Contenido relacionado
Revisiones y protocolos relacionados
Alistair Murray, Tran M Nguyen, Claire E Parker, Brian G Feagan, John K MacDonald | 28 agosto 2020
Alistair Murray, Tran M Nguyen, Claire E Parker, Brian G Feagan, John K MacDonald | 12 agosto 2020
John K Marshall, Marroon Thabane, A Hillary Steinhart, Jamie R Newman, Anju Anand, E Jan Irvine | 20 enero 2010
Anthony K Akobeng, Dongni Zhang, Morris Gordon, John K MacDonald | 28 septiembre 2016
Mary E Sherlock, John K MacDonald, Anne Marie Griffiths, A Hillary Steinhart, Cynthia H Seow | 26 octubre 2015
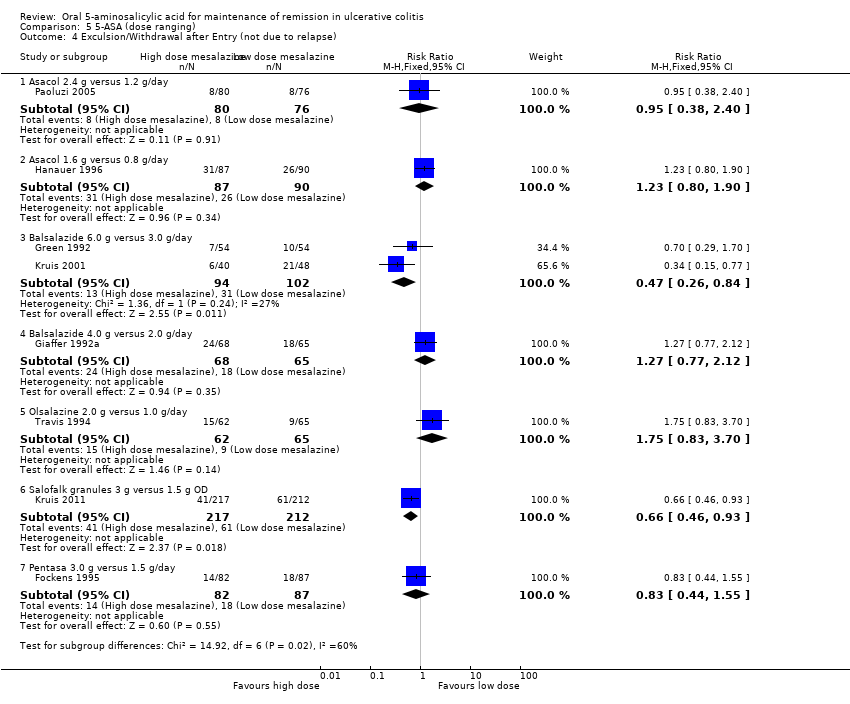
John K Marshall, Marroon Thabane, A Hillary Steinhart, Jamie R Newman, Anju Anand, E Jan Irvine | 14 noviembre 2012
Sushil K Garg, Vineet Ahuja, Mari Jeeva Sankar, Atul Kumar, Alan C Moss | 17 octubre 2012
Vipul Jairath, GY Zou, Claire E Parker, John K MacDonald, Turki AlAmeel, Mohammad Al Beshir, Majid A Almadi, Talal Al‐Taweel, Nathan SS Atkinson, Sujata Biswas, Thomas Chapman, Parambir S Dulai, Mark A Glaire, Daniël R Hoekman, Andreas Koutsoumpas, Elizabeth Minas, Mahmoud H Mosli, Mark Samaan, Reena Khanna, Simon Travis, Geert D'Haens, William J Sandborn, Brian G Feagan | 8 septiembre 2017
Lakhbir Kaur, Morris Gordon, Patricia Anne Baines, Zipporah Iheozor-Ejiofor, Vasiliki Sinopoulou, Anthony K Akobeng | 4 marzo 2020
Zipporah Iheozor-Ejiofor, Lakhbir Kaur, Morris Gordon, Patricia Anne Baines, Vasiliki Sinopoulou, Anthony K Akobeng | 4 marzo 2020
Respuestas clínicas Cochrane
Jane Burch, Michael Eisenhut | 23 septiembre 2019
Jane Burch, Michael Eisenhut | 23 septiembre 2019