| 1 Death before discharge Show forest plot | 17 | | Risk Ratio (M‐H, Fixed, 95% CI) | Subtotals only |
|
| 1.1 Studies with entry before 3 days based on oxygenation | 10 | 1066 | Risk Ratio (M‐H, Fixed, 95% CI) | 1.02 [0.89, 1.18] |
| 1.2 Studies with entry after 3 days based on BPD risk | 3 | 1075 | Risk Ratio (M‐H, Fixed, 95% CI) | 1.18 [0.81, 1.71] |
| 1.3 Studies of routine use in preterm infants on respiratory support | 4 | 1924 | Risk Ratio (M‐H, Fixed, 95% CI) | 0.90 [0.74, 1.10] |
| 2 Death before 36 weeks' postmenstrual age Show forest plot | 9 | | Risk Ratio (M‐H, Fixed, 95% CI) | Subtotals only |
|
| 2.1 Studies with entry before 3 days based on oxygenation | 5 | 458 | Risk Ratio (M‐H, Fixed, 95% CI) | 0.89 [0.72, 1.11] |
| 2.2 Studies with entry after 3 days based on BPD risk | 2 | 493 | Risk Ratio (M‐H, Fixed, 95% CI) | 1.33 [0.81, 2.20] |
| 2.3 Studies of routine use in preterm infants on respiratory support | 2 | 924 | Risk Ratio (M‐H, Fixed, 95% CI) | 1.31 [0.90, 1.89] |
| 3 Bronchopulmonary dysplasia among survivors at 36 weeks Show forest plot | 15 | | Risk Ratio (M‐H, Fixed, 95% CI) | Subtotals only |
|
| 3.1 Studies with entry before 3 days based on oxygenation | 8 | 681 | Risk Ratio (M‐H, Fixed, 95% CI) | 0.89 [0.76, 1.04] |
| 3.2 Studies with entry after 3 days based on BPD risk | 3 | 990 | Risk Ratio (M‐H, Fixed, 95% CI) | 0.91 [0.83, 1.01] |
| 3.3 Studies of routine use in preterm infants on respiratory support | 4 | 1782 | Risk Ratio (M‐H, Fixed, 95% CI) | 0.95 [0.85, 1.05] |
| 4 Death or bronchopulmonary dysplasia at 36 weeks Show forest plot | 15 | | Risk Ratio (M‐H, Fixed, 95% CI) | Subtotals only |
|
| 4.1 Studies with entry before 3 days based on oxygenation | 8 | 958 | Risk Ratio (M‐H, Fixed, 95% CI) | 0.94 [0.87, 1.01] |
| 4.2 Studies with entry after 3 days based on BPD risk | 3 | 1075 | Risk Ratio (M‐H, Fixed, 95% CI) | 0.92 [0.85, 1.01] |
| 4.3 Studies of routine use in preterm infants on respiratory support | 4 | 1924 | Risk Ratio (M‐H, Fixed, 95% CI) | 0.94 [0.87, 1.02] |
| 5 Intraventricular haemorrhage (all grades) Show forest plot | 7 | | Risk Ratio (M‐H, Fixed, 95% CI) | Subtotals only |
|
| 5.1 Studies with entry before 3 days based on oxygenation | 4 | 314 | Risk Ratio (M‐H, Fixed, 95% CI) | 0.94 [0.69, 1.28] |
| 5.2 Studies with entry after 3 days based on BPD risk | 1 | 458 | Risk Ratio (M‐H, Fixed, 95% CI) | 1.1 [0.48, 2.54] |
| 5.3 Studies of routine use in preterm infants on respiratory support | 2 | 1573 | Risk Ratio (M‐H, Fixed, 95% CI) | 1.04 [0.88, 1.23] |
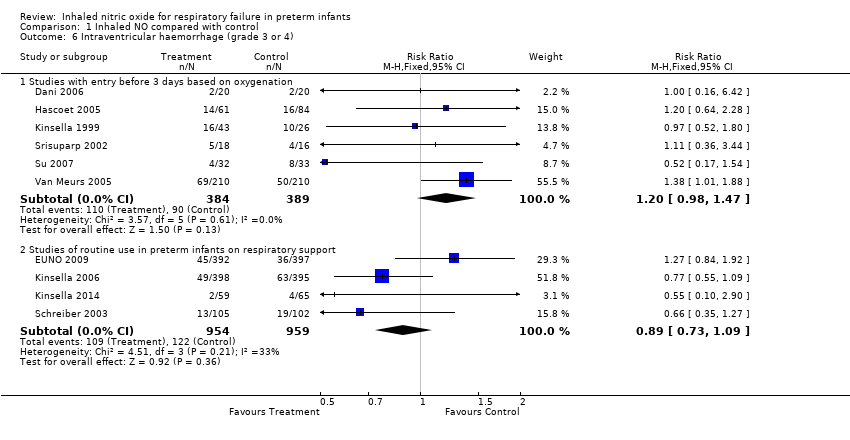
| 6 Intraventricular haemorrhage (grade 3 or 4) Show forest plot | 10 | | Risk Ratio (M‐H, Fixed, 95% CI) | Subtotals only |
|
| 6.1 Studies with entry before 3 days based on oxygenation | 6 | 773 | Risk Ratio (M‐H, Fixed, 95% CI) | 1.20 [0.98, 1.47] |
| 6.2 Studies of routine use in preterm infants on respiratory support | 4 | 1913 | Risk Ratio (M‐H, Fixed, 95% CI) | 0.89 [0.73, 1.09] |
| 7 Intraventricular haemorrhage (grade 3 or 4) or periventricular leukomalacia Show forest plot | 11 | | Risk Ratio (M‐H, Fixed, 95% CI) | Subtotals only |
|
| 7.1 Studies with entry before 3 days based on oxygenation | 8 | 901 | Risk Ratio (M‐H, Fixed, 95% CI) | 1.08 [0.88, 1.33] |
| 7.2 Studies of routine use in preterm infants on respiratory support | 3 | 1747 | Risk Ratio (M‐H, Fixed, 95% CI) | 0.90 [0.73, 1.12] |
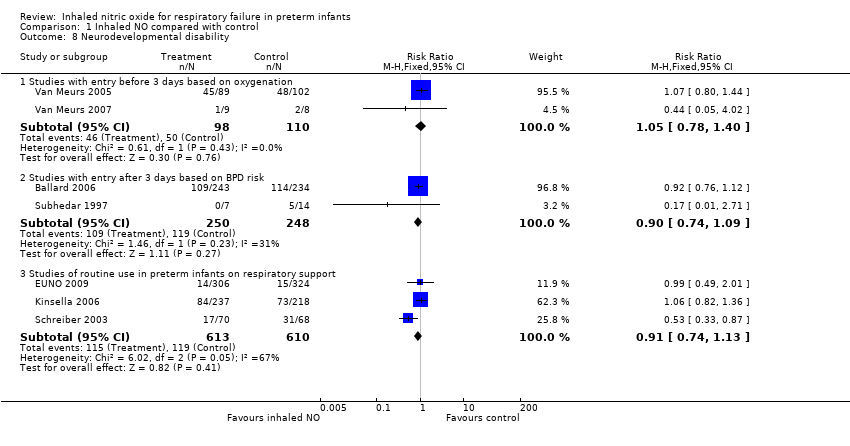
| 8 Neurodevelopmental disability Show forest plot | 7 | | Risk Ratio (M‐H, Fixed, 95% CI) | Subtotals only |
|
| 8.1 Studies with entry before 3 days based on oxygenation | 2 | 208 | Risk Ratio (M‐H, Fixed, 95% CI) | 1.05 [0.78, 1.40] |
| 8.2 Studies with entry after 3 days based on BPD risk | 2 | 498 | Risk Ratio (M‐H, Fixed, 95% CI) | 0.90 [0.74, 1.09] |
| 8.3 Studies of routine use in preterm infants on respiratory support | 3 | 1223 | Risk Ratio (M‐H, Fixed, 95% CI) | 0.91 [0.74, 1.13] |
| 9 Bayley MDI or PDI < ‐2 SD Show forest plot | 2 | | Risk Ratio (M‐H, Fixed, 95% CI) | Subtotals only |
|
| 9.1 Studies of routine use in preterm infants on respiratory support | 2 | 768 | Risk Ratio (M‐H, Fixed, 95% CI) | 0.57 [0.36, 0.90] |
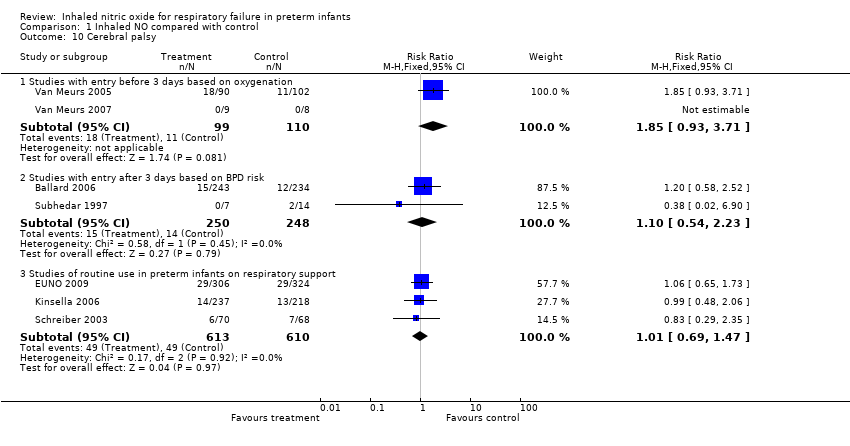
| 10 Cerebral palsy Show forest plot | 7 | | Risk Ratio (M‐H, Fixed, 95% CI) | Subtotals only |
|
| 10.1 Studies with entry before 3 days based on oxygenation | 2 | 209 | Risk Ratio (M‐H, Fixed, 95% CI) | 1.85 [0.93, 3.71] |
| 10.2 Studies with entry after 3 days based on BPD risk | 2 | 498 | Risk Ratio (M‐H, Fixed, 95% CI) | 1.10 [0.54, 2.23] |
| 10.3 Studies of routine use in preterm infants on respiratory support | 3 | 1223 | Risk Ratio (M‐H, Fixed, 95% CI) | 1.01 [0.69, 1.47] |
| 11 Severe retinopathy of prematurity (≥stage 3) Show forest plot | 5 | | Risk Ratio (M‐H, Fixed, 95% CI) | Subtotals only |
|
| 11.1 Studies with entry before 3 days based on oxygenation | 3 | 261 | Risk Ratio (M‐H, Fixed, 95% CI) | 0.97 [0.64, 1.47] |
| 11.2 Studies of routine use in preterm infants on respiratory support | 2 | 331 | Risk Ratio (M‐H, Fixed, 95% CI) | 0.65 [0.29, 1.46] |
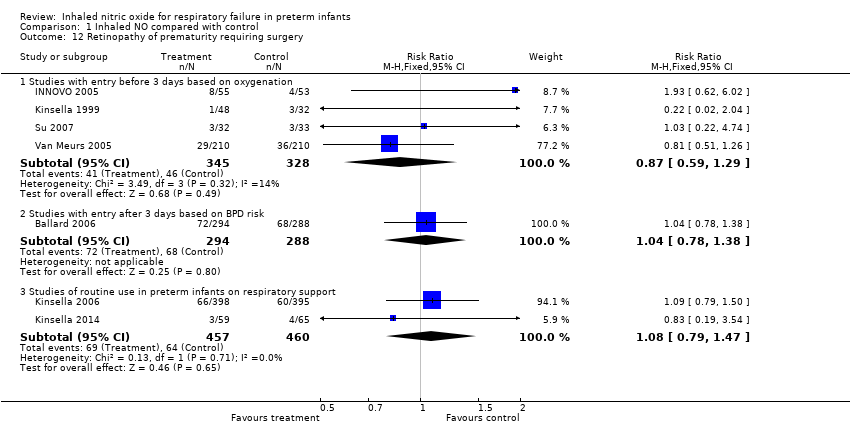
| 12 Retinopathy of prematurity requiring surgery Show forest plot | 7 | | Risk Ratio (M‐H, Fixed, 95% CI) | Subtotals only |
|
| 12.1 Studies with entry before 3 days based on oxygenation | 4 | 673 | Risk Ratio (M‐H, Fixed, 95% CI) | 0.87 [0.59, 1.29] |
| 12.2 Studies with entry after 3 days based on BPD risk | 1 | 582 | Risk Ratio (M‐H, Fixed, 95% CI) | 1.04 [0.78, 1.38] |
| 12.3 Studies of routine use in preterm infants on respiratory support | 2 | 917 | Risk Ratio (M‐H, Fixed, 95% CI) | 1.08 [0.79, 1.47] |