| 1 Death before discharge Show forest plot | 14 | | Risk Ratio (M‐H, Fixed, 95% CI) | Subtotals only |
|
| 1.1 Studies with entry before three days based on oxygenation | 9 | 1006 | Risk Ratio (M‐H, Fixed, 95% CI) | 1.04 [0.90, 1.20] |
| 1.2 Studies with entry after three days based on BPD risk | 2 | 624 | Risk Ratio (M‐H, Fixed, 95% CI) | 1.06 [0.64, 1.74] |
| 1.3 Studies of routine use in intubated preterm infants | 3 | 1800 | Risk Ratio (M‐H, Fixed, 95% CI) | 0.91 [0.74, 1.11] |
| 2 Death before 36 weeks postmenstrual age Show forest plot | 7 | | Risk Ratio (M‐H, Fixed, 95% CI) | Subtotals only |
|
| 2.1 Studies with entry before three days based on oxygenation | 5 | 458 | Risk Ratio (M‐H, Fixed, 95% CI) | 0.89 [0.72, 1.11] |
| 2.2 Studies with entry after three days based on BPD risk | 1 | 42 | Risk Ratio (M‐H, Fixed, 95% CI) | 1.57 [0.74, 3.34] |
| 2.3 Studies of routine use in preterm infants with lung disease | 1 | 800 | Risk Ratio (M‐H, Fixed, 95% CI) | 1.34 [0.92, 1.95] |
| 3 Bronchopulmonary dysplasia among survivors at 36 weeks Show forest plot | 13 | | Risk Ratio (M‐H, Fixed, 95% CI) | Subtotals only |
|
| 3.1 Studies with entry before three days based on oxygenation | 8 | 681 | Risk Ratio (M‐H, Fixed, 95% CI) | 0.89 [0.76, 1.04] |
| 3.2 Studies with entry after three days based on BPD risk | 2 | 573 | Risk Ratio (M‐H, Fixed, 95% CI) | 0.89 [0.78, 1.02] |
| 3.3 Studies of routine use in intubated preterm infants | 3 | 1658 | Risk Ratio (M‐H, Fixed, 95% CI) | 0.94 [0.84, 1.05] |
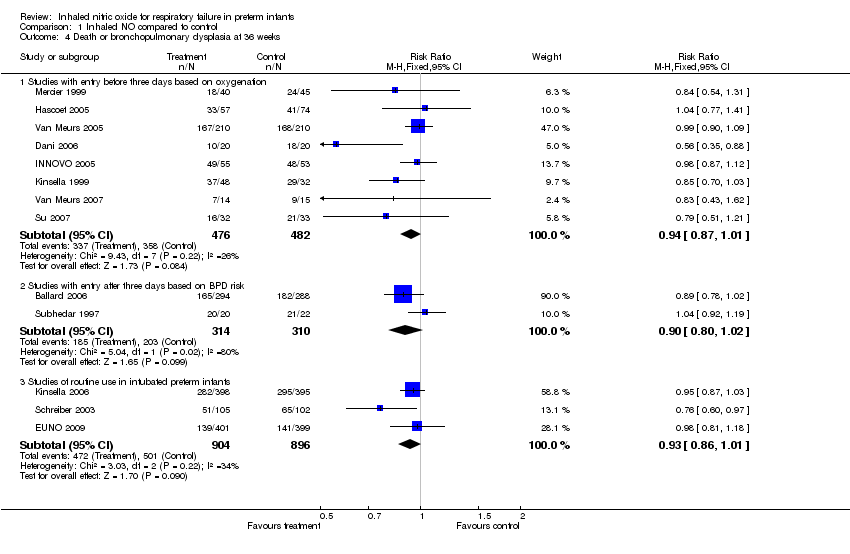
| 4 Death or bronchopulmonary dysplasia at 36 weeks Show forest plot | 13 | | Risk Ratio (M‐H, Fixed, 95% CI) | Subtotals only |
|
| 4.1 Studies with entry before three days based on oxygenation | 8 | 958 | Risk Ratio (M‐H, Fixed, 95% CI) | 0.94 [0.87, 1.01] |
| 4.2 Studies with entry after three days based on BPD risk | 2 | 624 | Risk Ratio (M‐H, Fixed, 95% CI) | 0.90 [0.80, 1.02] |
| 4.3 Studies of routine use in intubated preterm infants | 3 | 1800 | Risk Ratio (M‐H, Fixed, 95% CI) | 0.93 [0.86, 1.01] |
| 5 Intraventricular hemorrhage (all grades) Show forest plot | 5 | | Risk Ratio (M‐H, Fixed, 95% CI) | Subtotals only |
|
| 5.1 Studies with entry before three days based on oxygenation | 3 | 254 | Risk Ratio (M‐H, Fixed, 95% CI) | 1.00 [0.73, 1.37] |
| 5.2 Studies of routine use in preterm infants with respiratory disease | 2 | 1573 | Risk Ratio (M‐H, Fixed, 95% CI) | 1.04 [0.88, 1.23] |
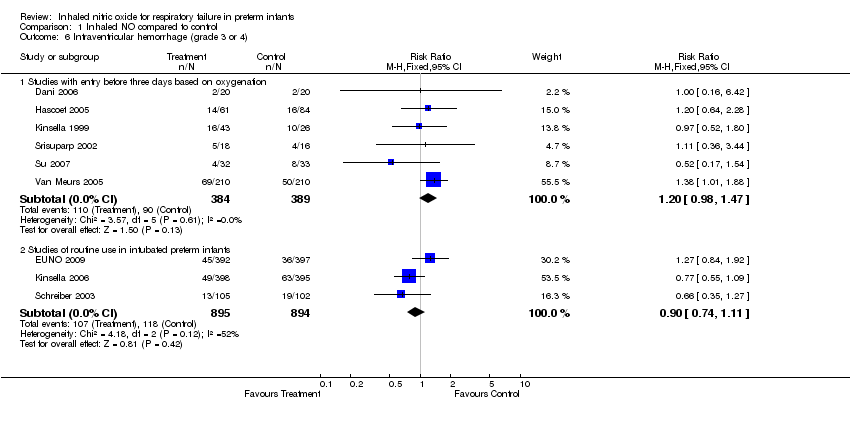
| 6 Intraventricular hemorrhage (grade 3 or 4) Show forest plot | 9 | | Risk Ratio (M‐H, Fixed, 95% CI) | Subtotals only |
|
| 6.1 Studies with entry before three days based on oxygenation | 6 | 773 | Risk Ratio (M‐H, Fixed, 95% CI) | 1.20 [0.98, 1.47] |
| 6.2 Studies of routine use in intubated preterm infants | 3 | 1789 | Risk Ratio (M‐H, Fixed, 95% CI) | 0.90 [0.74, 1.11] |
| 7 Intraventricular hemorrhage (grade 3 or 4) or periventricular leukomalacia Show forest plot | 11 | | Risk Ratio (M‐H, Fixed, 95% CI) | Subtotals only |
|
| 7.1 Studies with entry before three days based on oxygenation | 8 | 901 | Risk Ratio (M‐H, Fixed, 95% CI) | 1.08 [0.88, 1.33] |
| 7.2 Studies of routine use in intubated preterm infants | 3 | 1747 | Risk Ratio (M‐H, Fixed, 95% CI) | 0.90 [0.73, 1.12] |
| 8 Neurodevelopmental disability Show forest plot | 6 | | Risk Ratio (M‐H, Fixed, 95% CI) | Subtotals only |
|
| 8.1 Studies with entry before three days based on oxygenation | 2 | 208 | Risk Ratio (M‐H, Fixed, 95% CI) | 1.05 [0.78, 1.40] |
| 8.2 Studies with entry after three days based on BPD risk | 2 | 498 | Risk Ratio (M‐H, Fixed, 95% CI) | 0.90 [0.74, 1.09] |
| 8.3 Studies of routine use in intubated preterm infants | 2 | 593 | Risk Ratio (M‐H, Fixed, 95% CI) | 0.90 [0.72, 1.13] |
| 9 Cerebral Palsy Show forest plot | 6 | | Risk Ratio (M‐H, Fixed, 95% CI) | Subtotals only |
|
| 9.1 Studies with entry before three days based on oxygenation | 2 | 209 | Risk Ratio (M‐H, Fixed, 95% CI) | 1.85 [0.93, 3.71] |
| 9.2 Studies with entry after three days based on BPD risk | 2 | 498 | Risk Ratio (M‐H, Fixed, 95% CI) | 1.10 [0.54, 2.23] |
| 9.3 Studies of routine use in intubated preterm infants | 2 | 593 | Risk Ratio (M‐H, Fixed, 95% CI) | 0.94 [0.51, 1.70] |
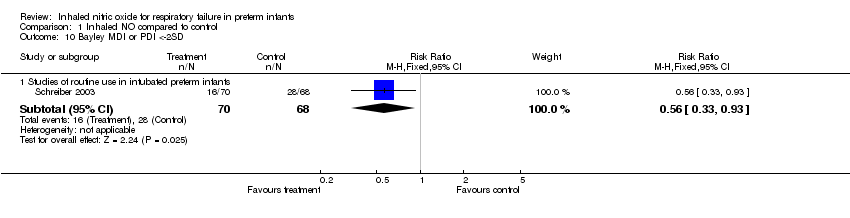
| 10 Bayley MDI or PDI <‐2SD Show forest plot | 1 | | Risk Ratio (M‐H, Fixed, 95% CI) | Subtotals only |
|
| 10.1 Studies of routine use in intubated preterm infants | 1 | 138 | Risk Ratio (M‐H, Fixed, 95% CI) | 0.56 [0.33, 0.93] |
| 11 Severe retinopathy of prematurity (Stage 3 or more) Show forest plot | 4 | | Risk Ratio (M‐H, Fixed, 95% CI) | Subtotals only |
|
| 11.1 Studies with entry before three days based on oxygenation | 3 | 261 | Risk Ratio (M‐H, Fixed, 95% CI) | 0.97 [0.64, 1.47] |
| 11.2 Studies of routine use in intubated preterm infants | 1 | 207 | Risk Ratio (M‐H, Fixed, 95% CI) | 0.58 [0.22, 1.54] |
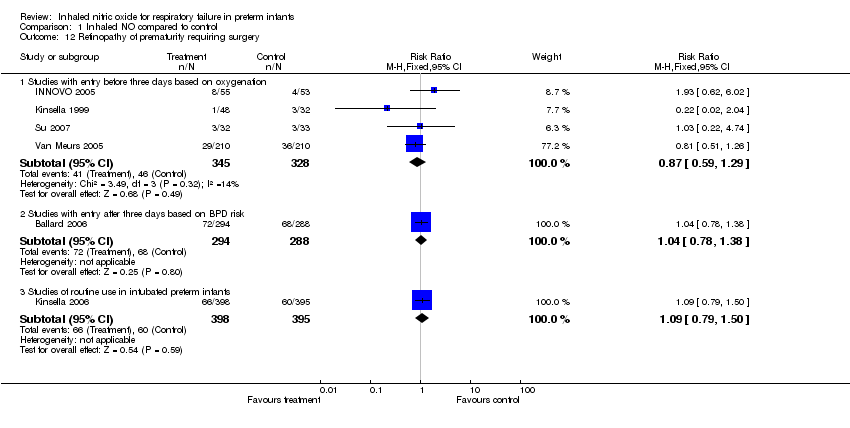
| 12 Retinopathy of prematurity requiring surgery Show forest plot | 6 | | Risk Ratio (M‐H, Fixed, 95% CI) | Subtotals only |
|
| 12.1 Studies with entry before three days based on oxygenation | 4 | 673 | Risk Ratio (M‐H, Fixed, 95% CI) | 0.87 [0.59, 1.29] |
| 12.2 Studies with entry after three days based on BPD risk | 1 | 582 | Risk Ratio (M‐H, Fixed, 95% CI) | 1.04 [0.78, 1.38] |
| 12.3 Studies of routine use in intubated preterm infants | 1 | 793 | Risk Ratio (M‐H, Fixed, 95% CI) | 1.09 [0.79, 1.50] |