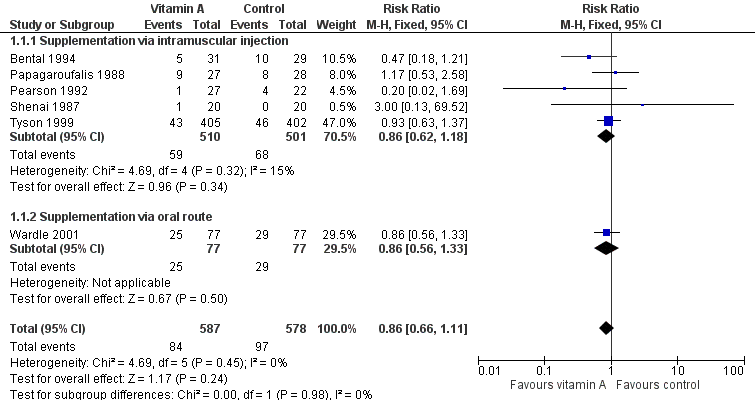
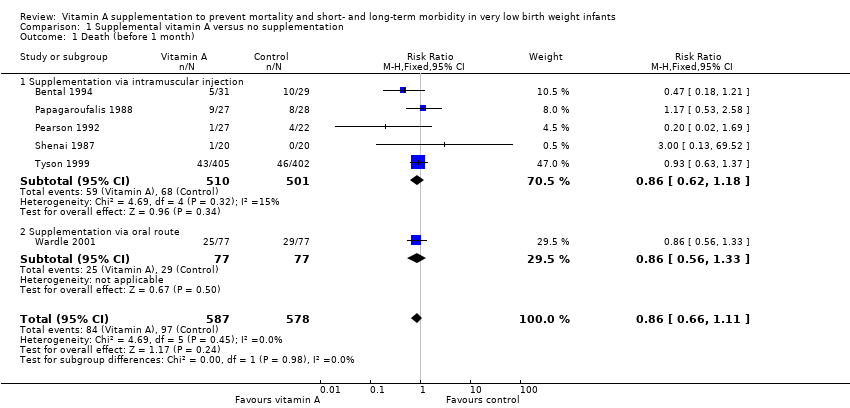
| 1 Death (before 1 month) Show forest plot | 6 | 1165 | Risk Ratio (M‐H, Fixed, 95% CI) | 0.86 [0.66, 1.11] |
|
| 1.1 Supplementation via intramuscular injection | 5 | 1011 | Risk Ratio (M‐H, Fixed, 95% CI) | 0.86 [0.62, 1.18] |
| 1.2 Supplementation via oral route | 1 | 154 | Risk Ratio (M‐H, Fixed, 95% CI) | 0.86 [0.56, 1.33] |
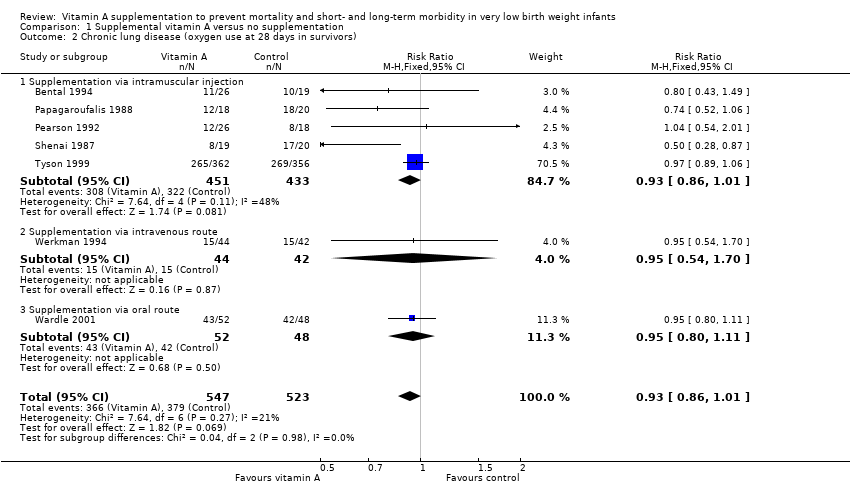
| 2 Chronic lung disease (oxygen use at 28 days in survivors) Show forest plot | 7 | 1070 | Risk Ratio (M‐H, Fixed, 95% CI) | 0.93 [0.86, 1.01] |
|
| 2.1 Supplementation via intramuscular injection | 5 | 884 | Risk Ratio (M‐H, Fixed, 95% CI) | 0.93 [0.86, 1.01] |
| 2.2 Supplementation via intravenous route | 1 | 86 | Risk Ratio (M‐H, Fixed, 95% CI) | 0.95 [0.54, 1.70] |
| 2.3 Supplementation via oral route | 1 | 100 | Risk Ratio (M‐H, Fixed, 95% CI) | 0.95 [0.80, 1.11] |
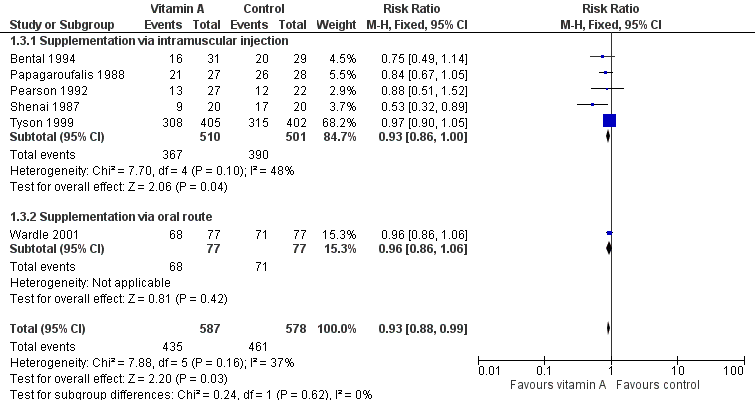
| 3 Death or chronic lung disease (oxygen use at 28 days) Show forest plot | 6 | 1165 | Risk Ratio (M‐H, Fixed, 95% CI) | 0.93 [0.88, 0.99] |
|
| 3.1 Supplementation via intramuscular injection | 5 | 1011 | Risk Ratio (M‐H, Fixed, 95% CI) | 0.93 [0.86, 1.00] |
| 3.2 Supplementation via oral route | 1 | 154 | Risk Ratio (M‐H, Fixed, 95% CI) | 0.96 [0.86, 1.06] |
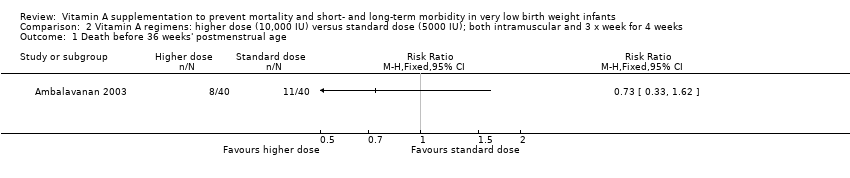
| 4 Death before 36 weeks' postmenstrual age Show forest plot | 4 | 1089 | Risk Ratio (M‐H, Fixed, 95% CI) | 1.00 [0.77, 1.29] |
|
| 4.1 Supplementation via intramuscular injection | 3 | 935 | Risk Ratio (M‐H, Fixed, 95% CI) | 1.06 [0.77, 1.46] |
| 4.2 Supplementation via oral route | 1 | 154 | Risk Ratio (M‐H, Fixed, 95% CI) | 0.86 [0.56, 1.33] |
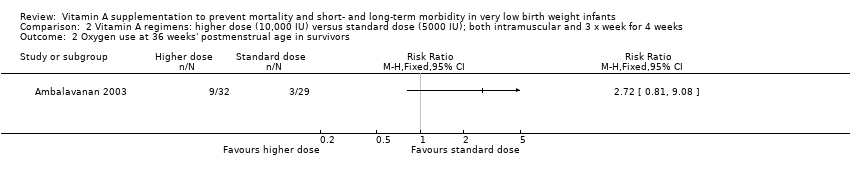
| 5 Chronic lung disease (oxygen use at 36 weeks' postmenstrual age in survivors) Show forest plot | 5 | 986 | Risk Ratio (M‐H, Fixed, 95% CI) | 0.87 [0.77, 0.99] |
|
| 5.1 Supplementation via intramuscular injection | 4 | 886 | Risk Ratio (M‐H, Fixed, 95% CI) | 0.85 [0.74, 0.98] |
| 5.2 Supplementation via oral route | 1 | 100 | Risk Ratio (M‐H, Fixed, 95% CI) | 1.00 [0.81, 1.24] |
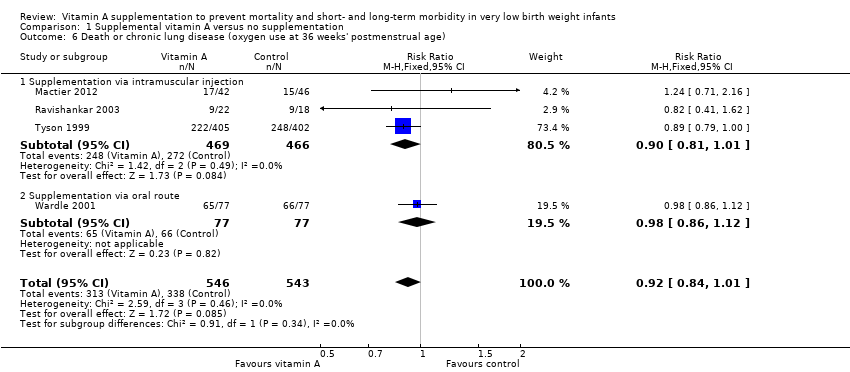
| 6 Death or chronic lung disease (oxygen use at 36 weeks' postmenstrual age) Show forest plot | 4 | 1089 | Risk Ratio (M‐H, Fixed, 95% CI) | 0.92 [0.84, 1.01] |
|
| 6.1 Supplementation via intramuscular injection | 3 | 935 | Risk Ratio (M‐H, Fixed, 95% CI) | 0.90 [0.81, 1.01] |
| 6.2 Supplementation via oral route | 1 | 154 | Risk Ratio (M‐H, Fixed, 95% CI) | 0.98 [0.86, 1.12] |
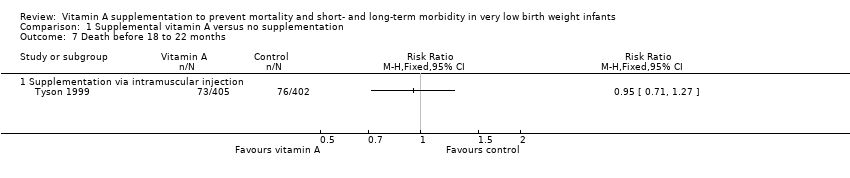
| 7 Death before 18 to 22 months Show forest plot | 1 | | Risk Ratio (M‐H, Fixed, 95% CI) | Totals not selected |
|
| 7.1 Supplementation via intramuscular injection | 1 | | Risk Ratio (M‐H, Fixed, 95% CI) | 0.0 [0.0, 0.0] |
| 8 Neurodevelopmental impairment at 18 to 22 months Show forest plot | 1 | | Risk Ratio (M‐H, Fixed, 95% CI) | Totals not selected |
|
| 8.1 Supplementation via intramuscular injection | 1 | | Risk Ratio (M‐H, Fixed, 95% CI) | 0.0 [0.0, 0.0] |
| 9 Death or neurodevelopmental impairment at 18 to 22 months Show forest plot | 1 | | Risk Ratio (M‐H, Fixed, 95% CI) | Totals not selected |
|
| 9.1 Supplementation via intramuscular injection | 1 | | Risk Ratio (M‐H, Fixed, 95% CI) | 0.0 [0.0, 0.0] |
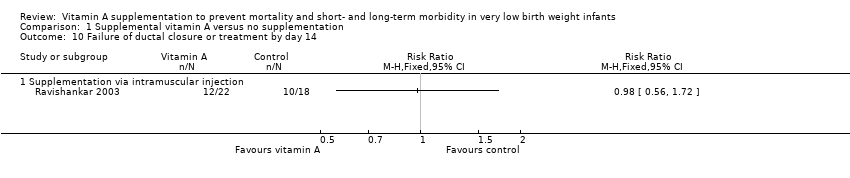
| 10 Failure of ductal closure or treatment by day 14 Show forest plot | 1 | | Risk Ratio (M‐H, Fixed, 95% CI) | Totals not selected |
|
| 10.1 Supplementation via intramuscular injection | 1 | | Risk Ratio (M‐H, Fixed, 95% CI) | 0.0 [0.0, 0.0] |
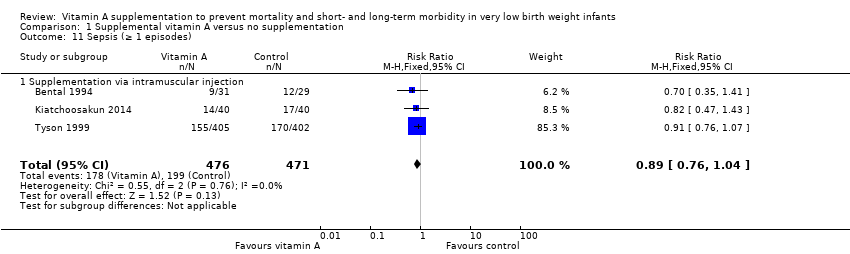
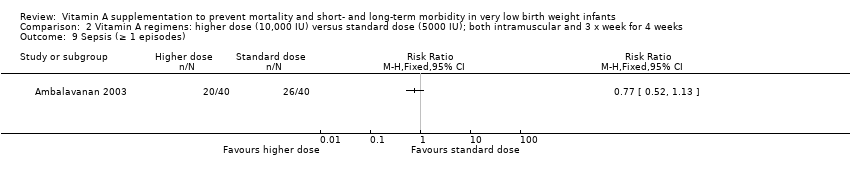
| 11 Sepsis (≥ 1 episodes) Show forest plot | 3 | 947 | Risk Ratio (M‐H, Fixed, 95% CI) | 0.89 [0.76, 1.04] |
|
| 11.1 Supplementation via intramuscular injection | 3 | 947 | Risk Ratio (M‐H, Fixed, 95% CI) | 0.89 [0.76, 1.04] |
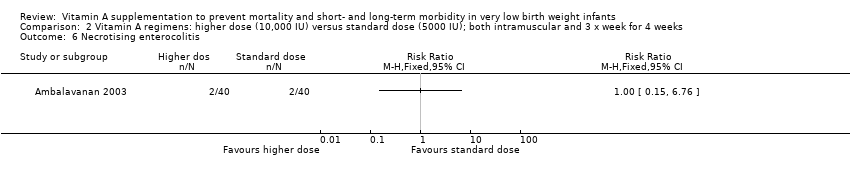
| 12 Necrotising enterocolitis Show forest plot | 4 | 1101 | Risk Ratio (M‐H, Fixed, 95% CI) | 0.92 [0.67, 1.27] |
|
| 13 Intraventricular haemorrhage Show forest plot | 5 | | Risk Ratio (M‐H, Fixed, 95% CI) | Subtotals only |
|
| 13.1 Any intraventricular haemorrhage | 3 | 907 | Risk Ratio (M‐H, Fixed, 95% CI) | 0.95 [0.82, 1.10] |
| 13.2 Severe intraventricular haemorrhage (Grade 3 or 4) | 4 | 1035 | Risk Ratio (M‐H, Fixed, 95% CI) | 0.95 [0.72, 1.25] |
| 14 Periventricular leukomalacia Show forest plot | 1 | | Risk Ratio (M‐H, Fixed, 95% CI) | Totals not selected |
|
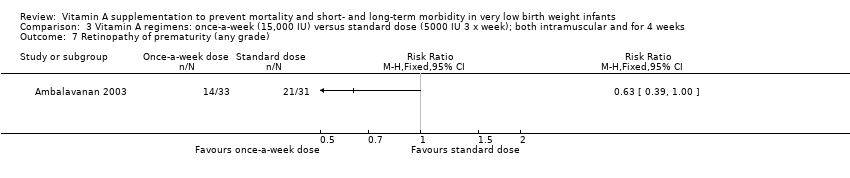
| 15 Retinopathy of prematurity (any grade) Show forest plot | 4 | 255 | Risk Ratio (M‐H, Fixed, 95% CI) | 0.81 [0.65, 1.01] |
|
| 15.1 Supplementation via intramuscular injection | 3 | 159 | Risk Ratio (M‐H, Fixed, 95% CI) | 0.64 [0.42, 0.99] |
| 15.2 Supplementation via oral route | 1 | 96 | Risk Ratio (M‐H, Fixed, 95% CI) | 0.95 [0.75, 1.20] |
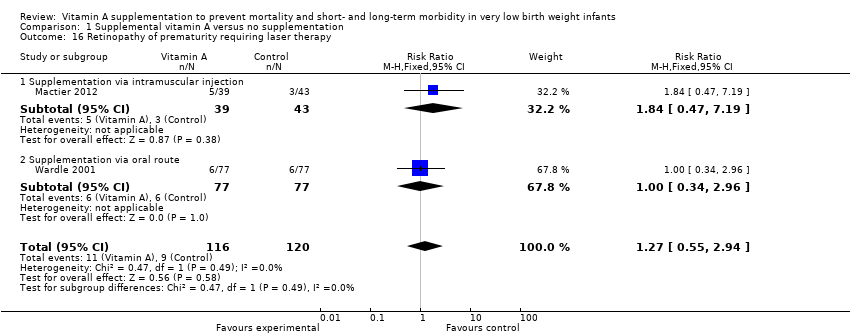
| 16 Retinopathy of prematurity requiring laser therapy Show forest plot | 2 | 236 | Risk Ratio (M‐H, Fixed, 95% CI) | 1.27 [0.55, 2.94] |
|
| 16.1 Supplementation via intramuscular injection | 1 | 82 | Risk Ratio (M‐H, Fixed, 95% CI) | 1.84 [0.47, 7.19] |
| 16.2 Supplementation via oral route | 1 | 154 | Risk Ratio (M‐H, Fixed, 95% CI) | 1.0 [0.34, 2.96] |