Contenido relacionado
Revisiones y protocolos relacionados
Andrew Whitelaw, Richard Lee‐Kelland | 6 abril 2017
Matteo Bruschettini, Olga Romantsik, Simona Zappettini, Rita Banzi, Luca Antonio Ramenghi, Maria Grazia Calevo | 5 mayo 2016
Matteo Bruschettini, Olga Romantsik, Simona Zappettini, Rita Banzi, Luca Antonio Ramenghi, Maria Grazia Calevo | 21 marzo 2016
Olga Romantsik, Elisa Smit, David E Odd, Matteo Bruschettini | 16 marzo 2023
Marc LaPointe, Stephen Haines | 22 julio 2002
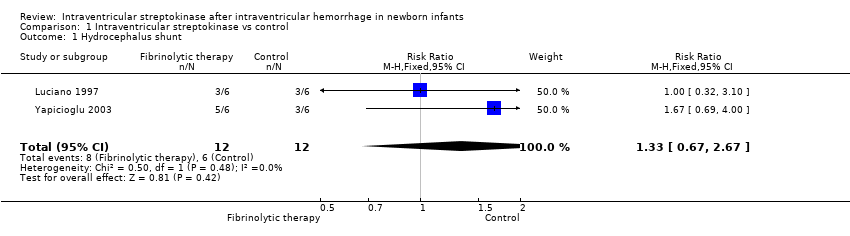
Andrew Whitelaw, Luc P Brion, Colin R Kennedy, David Odd | 23 abril 2001
Sachin S Shah, Arne Ohlssona, Vibhuti S Shah | 11 julio 2012
Agata Stróżyka, Themistoklis Paraskevasa, Olga Romantsik, Maria Grazia Calevo, Rita Banzi, David Ley, Matteo Bruschettini | 11 agosto 2023
Daniel Stephen Green, Mohamed E Abdel‐Latif, Lisa J Jones, Kei Lui, David A Osborn | 2 julio 2019
Olga Romantsik, Maria Grazia Calevo, Matteo Bruschettini | 7 julio 2020