同步机械通气在新生儿呼吸支持中的应用
摘要
研究背景
在同步机械通气期间,气道正压通气和自主呼吸相协调。如果开始进行同步机械通气,则应在较低的气道峰值压力下实现充分的气体交换,从而减少气压伤或容积伤、气漏和支气管肺发育不良的发生。在常规通气和患者触发通气期间,可以通过控制速率和吸气时间实现同步机械通气。
研究目的
本综述旨在对比以下干预措施的疗效:
(i) 同步机械通气,采用高频正压通气 (High‐Frequency Positive Pressure Ventilation,HFPPV) 或患者触发通气(辅助控制通气 (Assist Control Ventilation,ACV) 和同步间歇指令通气 (Synchronous Intermittent Mandatory Ventilation,SIMV),采用常规通气或高频振荡通气 (High‐Frequency Oscillation,HFO);
(ii) 不同类型的触发通气(ACV、SIMV、压力调节容积控制通气(Pressure‐Regulated Volume Control Ventilation,PRVCV)、压力支持的 SIMV(PS)和压力支持通气(Pressure Support Ventilation,PSV)。
检索策略
我们使用Cochrane新生儿组的标准检索策略对以下数据库进行检索:Cochrane对照试验中心注册库(Cochrane Central Register of Controlled Trials, CENTRAL)(2016年第5期)、MEDLINE(通过PubMed,1966年~2016年6月5日)、Embase(1980年~2016年6月5日) 和CINAHL(1982年~2016年6月5日)。我们还检索了临床试验数据库、会议论文,以及纳入文献的参考文献列表以获取随机和准随机对照临床试验。
纳入排除标准
我们纳入HFPPV对比CMV,或ACV/SIMV对比CMV或HFO在新生儿中进行同步机械通气的随机或准随机对照临床试验。也纳入对比新生儿中不同触发通气模式(ACV、SIMV、SIMV联合PS、PRVCV和PSV)的随机试验。
资料收集与分析
我们提取以下结局指标的相关资料:死亡率、气漏(气胸或间质性肺气肿(Pulmonary Interstitial Emphysema,PIE)、重度脑室内出血(3级和4级)、支气管肺发育不良(Bronchopulmonary Dysplasia,BPD)(氧供依赖超过28天)、中重度BPD(矫正胎龄36周以上或断奶/通气期间具有氧气/呼吸支持依赖性)。
我们共进行了8种对比:(1)HFPPV对比CMV;(2)ACV/SIMV对比CMV;(3)SIMV联合或不联合PS对比HFO;(4)ACV对比SIMV;(5)SIMV联合PS对比SIMV;(6)SIMV对比PRVCV;(7)SIMV对比PSV;(8)ACV对比PSV。分别使用相对危险度(Relative Risk,RR)和平均差(Mean Difference,MD)对二分类和连续性结局指标进行数据分析。
主要结果
本综述共纳入22项研究。Meta分析表明,与CMV相比,HFPPV气漏发生风险较低(RR=0.69,95% CI [0.51, 0.93])。与CMV相比,ACV/SIMV通气持续时间较短(MD=‐38.3h,95% CI [‐53.90, ‐22.69])。与HFO相比,SIMV联合或不联合PS发生中重度BPD的风险更高(RR=1.33,95% CI [1.07, 1.65]),且机械通气时间更长(MD=1.89d,95% CI [1.04, 2.74])。
与SIMV相比,ACV可降低断奶持续时间(MD=‐42.38h,95% CI [‐94.35, 9.60])。HFPPV和触发通气均不能降低BPD的发病率。与CMV相比,HFPPV组死亡率更低,触发通气组死亡率更高,但差异均不显著。HFPPV和触发通气在其他结局指标方面没有劣势。
作者结论
与传统通气相比,HFPPV和触发通气分别在减少漏气和缩短通气时间方面更加有效。所有试验均未进行全面的呼吸监测,因此无法明确这些益处是否源自激发同步通气。与HFO相比,以SIMV联合或不联合PS的形式进行触发通气发生BPD的风险更高,且通气时间更长。鼓励在开展进一步研究前优化与呼吸诊断有关的触发器和呼吸机。重点是在新型触发通气应用于常规临床实践之前,应在有足够把握度的随机试验中进行测试,以评估其长期结局。
PICO
简语概要
同步机械通气在新生儿呼吸支持中的应用
绝大多数需要机械辅助通气的新生儿也会进行一定程度的自主呼吸。若婴儿的呼吸与呼吸机的机械呼吸同步,则可能需要较小的压力。这可以减少气漏的发生风险,或对脑血流量的影响。本综述发现,与传统机械通气(Conventional Mechanical Ventilation,CMV)相比,高频正压通气(High‐Frequency Positive Pressure Ventilation,HFPPV)降低了气漏发生风险,且触发通气能够减少通气时间。然而,与高频振荡相比,某些触发通气模式发生中重度慢性肺部疾病的风险更高,通气时间也更长。新型触发通气仅在小规模的随机试验中进行了评估,且尚未表明其在重要的临床结局指标中具有优势。
Authors' conclusions
Background
Description of the condition
The majority of neonates breathe during mechanical ventilation. Those that actively exhale against positive pressure inflation develop pneumothoraces; whereas if positive pressure inflation and spontaneous inspiration coincide (synchrony), oxygenation and carbon dioxide elimination improve. If synchrony occurs, it should be possible to achieve adequate gas exchange at lower inflating pressures, reducing barotrauma, a known risk factor for bronchopulmonary dysplasia. Active expiration is more common if infants have non‐compliant lungs and are ventilated with long inspiratory times or relatively slow ventilator rates (30 to 40 bpm), or both. Increasing ventilator rate and reducing inspiratory time, mimicking more closely the preterm infant's respiratory pattern, has been shown in a proportion of infants to stop them actively expiring.
Description of the intervention
Synchronised ventilation can be achieved by HFPPV during which the ventilator rate more closely resembles the spontaneous respiratory rate of very prematurely born infants, and this is more likely to be associated with synchronous ventilation. It can also be achieved by PTV (ACV, SIMV, PRVCV or PSV), during which the infant's respiratory efforts exceeding a critical level trigger a positive pressure inflation. In SIMV only a preset number of the infant's respiratory efforts trigger positive pressure inflations.
How the intervention might work
During mechanical ventilation, infants actively exhale against positive pressure inflation and develop pneumothoraces. Theoretically, by increasing synchronous ventilation, either HFPPV or PTV could reduce air leaks and associated intraventricular haemorrhage and BPD. Indeed, 'triggered ventilation' compared to conventional mechanical ventilation (CMV) has been shown to improve tidal volume (Jarreau 1996) and oxygenation (Cleary 1995) and reduce blood pressure fluctuations (Hummler 1996). Synchronised mechanical ventilation might also reduce baro trauma and hence BPD.
Why it is important to do this review
The aim of this review was to determine whether HFPPV or triggered ventilation were associated with positive outcomes for prematurely born neonates. This review updates the existing review of synchronised ventilation which was published in the Cochrane Database of Systematic Reviews Issue 1, 2008 (Greenough 2008).
Objectives
To compare the efficacy of:
(i) synchronised mechanical ventilation, delivered as high‐frequency positive pressure ventilation (HFPPV) or patient‐triggered ventilation (assist control ventilation (ACV) and synchronous intermittent mandatory ventilation (SIMV)), with conventional ventilation or high‐frequency oscillation (HFO);
(ii) different types of triggered ventilation (ACV, SIMV, pressure‐regulated volume control ventilation (PRVCV), SIMV with pressure support (PS) and pressure support ventilation (PSV))
Methods
Criteria for considering studies for this review
Types of studies
Randomised or quasi‐randomised clinical trials comparing the use of synchronised ventilation (HFPPV or patient‐triggered ventilation) to conventional ventilation or high‐frequency oscillation, and randomised trials of different modes of triggered ventilation in neonates were considered for this review.
Types of participants
Neonates (less than four weeks of age) requiring assisted ventilation.
Types of interventions
We considered two forms of ventilation likely to induce synchrony:
high‐frequency positive pressure ventilation (HFPPV, ventilator rates ≥ 60 bpm); and triggered ventilation.
Triggered ventilation was divided into:
-
assist control ventilation (ACV), otherwise known as synchronous intermittent positive pressure ventilation (SIPPV), the infant being able to trigger a positive pressure inflation with each breath;
-
synchronised intermittent mandatory ventilation (SIMV), the infant being able to trigger only a pre‐set number of positive pressure inflations;
-
pressure‐regulated volume control ventilation (PRVCV), a synchronised pressure‐limited assist control mode that sequentially varies the delivered pressure to approximate a target inspiratory tidal volume;
-
pressure support ventilation, the initiation and end of inflation triggered by the infant's respiratory effort;
-
SIMV with pressure support (PS); PS assists every additional spontaneous breath beyond the set SIMV rate.
These modes of ventilation were compared to non‐synchronised ventilation either in the form of conventional ventilation (CMV), which for the purpose of this review is defined as pressure pre‐set, time‐limited ventilation delivered at rates of fewer than 60 bpm, or high‐frequency oscillatory ventilation (HFO).
Infants were randomly allocated to receive one or other forms of ventilation (except in Heicher 1981 when alternate allocation was used):
-
HFPPV versus CMV;
-
ACV or SIMV versus CMV;
-
SIMV or SIMV + PS versus HFO.
Triggered modes of ventilation were compared:
-
ACV versus SIMV;
-
SIMV plus PS versus SIMV;
-
SIMV versus PRVCV;
-
SIMV versus PSV;
-
ACV versus PSV.
Types of outcome measures
Primary outcomes
Data regarding clinical outcomes included:
-
mortality;
-
air leaks (pneumothorax or pulmonary interstitial emphysema (PIE));
-
severe intraventricular haemorrhage (grades 3 and 4);
-
bronchopulmonary dysplasia (BPD) (oxygen dependency beyond 28 days);
-
moderate/severe BPD (oxygen dependency or respiratory support dependency (or both) at 36 weeks' postmenstrual age);
-
duration of weaning/ventilation.
Search methods for identification of studies
Electronic searches
For the 2016 update we used the criteria and standard methods of Cochrane and the Cochrane Neonatal Review Group (see the Cochrane Neonatal Group search strategy for specialized register).
We conducted a comprehensive search including: the Cochrane Central Register of Controlled Trials (CENTRAL 2016, Issue 5) in The Cochrane Library; MEDLINE via PubMed (1996 to June 5 2016); EMBASE (1980 to June 5 2016); and CINAHL (1982 to June 5 2016) using the following search terms: (mechanical ventilation[MeSH] OR respiration, artificial[MeSH] OR mechanical ventilation OR triggered ventilation OR SIMV), plus database‐specific limiters for RCTs and neonates (see Appendix 1 for the full search strategies for each database). We did not apply language restrictions.
We searched clinical trials registries for ongoing or recently completed trials (clinicaltrials.gov; the World Health Organization’s International Trials Registry and Platform www.whoint/ictrp/search/en/; and the ISRCTN Registry).
For the previous version of this review we searched the Cochrane Central Register of Controlled Trials (CENTRAL, The Cochrane Library, 2008); Oxford Database of Perinatal Trials; MEDLINE from 1966 to 2008; and EMBASE 1996 to 2008 (MeSH terms: mechanical ventilation; triggered ventilation; artificial respiration; newborn infant).
Searching other resources
We searched previous reviews, abstracts, symposia proceedings as well as conducting handsearches of journals in the English language and establishing contact with expert informants.
Data collection and analysis
Three of the review authors (AS, TR, VM) identified trials that might be included. Each trial was then assessed independently by each review author who completed data collection forms that the review authors had previously agreed upon. The results were then compared and if there was disagreement a fourth and fifth review author (AG, ADM) assessed the results independently. For each included trial, we collected information regarding the method of randomisation, blinding, stratification, number of centres participating in the study, trial inclusion and exclusion criteria and sample size. We also collected demographic data of the trial participants (e.g. gestational age, birth weight, postnatal age, primary diagnosis). We analysed information on clinical outcomes including death, air leaks, intraventricular haemorrhage, chronic lung disease, duration of ventilation or weaning, ventilation mode failure and extubation failure. The denominator for each outcome was the number randomised. In the meta‐analyses involving comparison with CMV or HFO, either HFPPV or ACV/SIMV was designated the experimental therapy. In the meta‐analyses of ACV or PRVCV versus SIMV, then ACV or PRVCV was designated the experimental therapy. In the meta‐analyses of SIMV with PS versus SIMV, SIMV with PS was designated the experimental therapy, and in the meta‐analysis of ACV versus PSV, ACV was designated the experimental therapy.
Results
Description of studies
Included studies
We identified twenty‐two studies for inclusion in this review (see Figure 1).
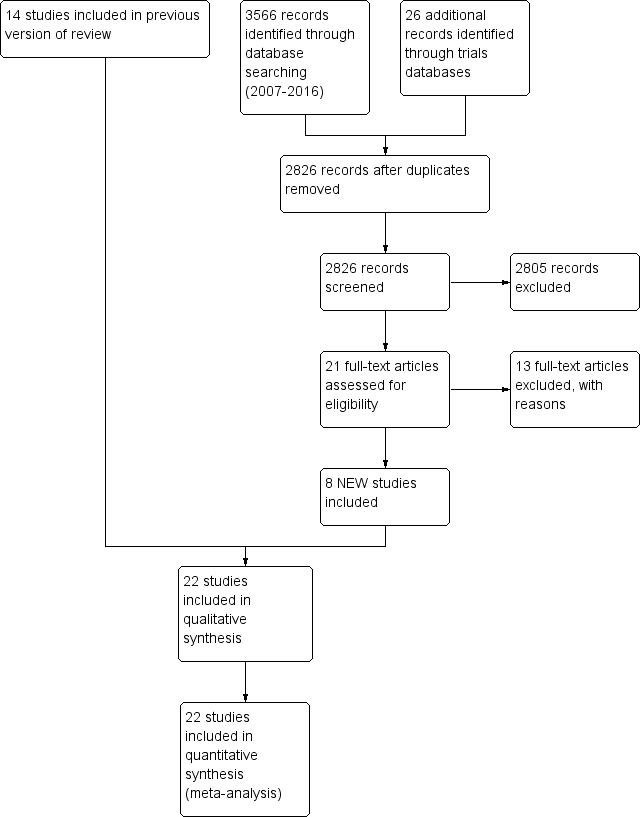
Study flow diagram: review update
1. HFPPV versus CMV (Heicher 1981; OCTAVE 1991; Pohlandt 1992; Amini 2013).
2. ACV/SIMV versus CMV: Chan 1993 (ACV versus CMV); Donn 1994 (SIMV versus CMV); Bernstein 1996 (SIMV versus CMV); Chen 1997 (SIMV versus CMV); Baumer 2000 (ACV versus CMV); Beresford 2000 (ACV versus CMV); Liu 2011 (ACV versus CMV).
3. SIMV or SIMV + PS versus HFO (Courtney 2002a; Craft 2003a; Singh 2012; Sun 2014)
4. ACV versus SIMV (Chan 1994; Dimitriou 1995a; Dimitriou 1995b)
5. SIMV plus PS versus SIMV (Reyes 2006)
6. SIMV versus PRVCV (D'Angio 2005)
7. SIMV versus PSV (Erdemir 2014)
8. ACV versus PSV (Patel 2012)
Pohlandt 1992, Chan 1993, Chan 1994, Dimitriou 1995a, Dimitriou 1995b, Baumer 2000 and Beresford 2000 included only preterm infants. Donn 1994 included preterm infants with a birth weight between 1100 grams and 1500 grams. Courtney 2002a included infants with a birth weight between 601 grams and 1200 grams. Reyes 2006 included preterm infants with a birth weight of 500 grams to 1000 grams. Singh 2012 included infants with a birth weight of greater than 750 grams. D'Angio 2005 included preterm infants with a birth weight of 500 grams to 1249 grams. Erdemir 2014 and Sun 2014 included preterm infants with birth weight less than 1500 grams. Craft 2003a included preterm infants with birth weight less than 1000 grams. Bernstein 1996, Heicher 1981 and OCTAVE 1991 studied mainly premature neonates. Chen 1997 included term and preterm infants but analysed the groups separately; only the results from the 63 infants with RDS are included in the meta‐analysis. Amini 2013 does not make it clear whether term as well as preterm infants were included. Patel 2012 included infants of any gestation who were less than 14 days old.
Information regarding use of antenatal steroids was given only in Baumer 2000, Beresford 2000, Courtney 2002a, Craft 2003a, D'Angio 2005, Reyes 2006, Patel 2012, Singh 2012, Erdemir 2014 and Sun 2014. Data regarding surfactant usage were available in the trials of Donn 1994, Chan 1994, Dimitriou 1995a, Dimitriou 1995b, Bernstein 1996, Chen 1997, Baumer 2000, Beresford 2000, Courtney 2002a, Craft 2003a, D'Angio 2005, Reyes 2006, Patel 2012, Singh 2012, Amini 2013, Erdemir 2014 and Sun 2014. The age at entry varied between studies; the trials of Chan 1993, Chan 1994, Dimitriou 1995a, Dimitriou 1995b, Reyes 2006, Patel 2012 and Erdemir 2014 were weaning studies. Data for the duration of ventilation or weaning were obtained by personal communication with the investigators for Chan 1993, Chan 1994, Dimitriou 1995a, Dimitriou 1995b, Baumer 2000 and Beresford 2000.
Excluded studies
Seventy‐two additional studies were detected, but were found to be not eligible for inclusion in this review (see table Characteristics of excluded studies).
Risk of bias in included studies
All the studies but one were randomised; Heicher 1981 used alternate allocation. The method of randomisation is reported in all but one trial (Chen 1997). Certain outcomes were only available in some of the trials and therefore only presented for the subgroups in which they were reported for at least two trials, except for the trials assessing PSV, PRVCV and SIMV plus PS.
HFPPV versus CMV: In Heicher 1981 and OCTAVE 1991 analysis was by intention to treat, but in Pohlandt 1992 infants not ventilated strictly according to the technique to which they were randomised were excluded from the analysis.
SIMV/ACV versus CMV: Analysis was according to intention to treat in Chan 1993 and Baumer 2000; in Bernstein 1996, 6% of infants erroneously randomised because of problems including seizures, non‐viability and birth weight of less than 500 grams were excluded from the analysis.
SIMV or SIMV + PS versus HFO: Analysis was according to intention to treat in Courtney 2002a and Sun 2014. In Craft 2003a an ad‐hoc interim analysis was performed due to declining recruitment and the study was curtailed.
ACV versus SIMV: Dimitriou 1995 is presented as two studies (Dimitriou 1995a; Dimitriou 1995b), as two separate consecutive randomised trials were performed in which ACV was compared to two different methods of delivering SIMV. In Chan 1994, Dimitriou 1995a and Dimitriou 1995b weaning failure was defined as no reduction in ventilator settings over a 24 or 48 hour period respectively; extubation failure was defined as a requirement for re‐intubation using standardised criteria within a 48 hour period.
SIMV plus PS versus SIMV: In Reyes 2006 analysis was by intention to treat; five infants who were randomised met exclusion criteria and their results were not included in the analysis.
PRVCV versus SIMV: In D'Angio 2005 analysis was by intention to treat; one infant did not receive the allocated intervention.
SIMV vs PSV: In Erdemir 2014 weaning and extubation was performed according to standardised criteria. Analysis was not stated to be by intention to treat; however there were no failures of weaning reported in either arm.
ACV vs PSV: In Patel 2012 analysis was by intention to treat. Weaning was by standardised criteria.
Effects of interventions
HFPPV versus CMV (comparison 1)
Death (Analysis 1.1): Four trials reported this outcome (Heicher 1981; OCTAVE 1991; Pohlandt 1992; Amini 2013). None demonstrated a significant effect. The meta‐analysis indicates a trend towards reduction in death rate using HFPPV but this does not reach statistical significance (relative risk (RR) 0.78, 95% confidence interval (CI) 0.61 to 1.00).
Air leaks (Analysis 1.2 and Analysis 1.3): Three trials reported pneumothorax as an outcome (Heicher 1981; OCTAVE 1991; Pohlandt 1992); one trial reported a significant effect, with a lower rate of pneumothorax in the HFPPV group (Heicher 1981). The meta‐analysis supports a significant reduction in the risk of pneumothorax (typical RR for pneumothorax was 0.69, 95% CI 0.51 to 0.93). Pohlandt 1992 reported a significant reduction in PIE in the HFPPV group (RR 0.68, 95% CI 0.49 to 0.94). Amini 2013 reported total air leaks as outcome variable, with a non‐significant trend favouring HFPPV (RR 0.25, 95% CI 0.06 to 1.08).
BPD (oxygen dependency at 28 days) (Analysis 1.4): Four trials reported this outcome (Heicher 1981; OCTAVE 1991; Pohlandt 1992; Amini 2013). None demonstrated a significant effect. The meta‐analysis found no evidence of effect.
IVH (Analysis 1.5): One trial reported this outcome, with a significantly lower rate of IVH in the HFPPV group (RR 0.13, 95% CI 0.02 to 0.94) (Amini 2013).
Other outcomes: The incidence of PDA post randomisation was given in two trials (Heicher 1981; Pohlandt 1992); in neither did it differ significantly.
ACV/SIMV versus CMV (comparison 2)
Death (Analysis 2.1): Six trials reported this outcome (Donn 1994; Bernstein 1996; Chen 1997; Baumer 2000; Beresford 2000; Liu 2011). None demonstrated a significant effect. The meta‐analysis indicates a trend towards an increase in death rate using ACV/SIMV but this does not reach statistical significance (typical RR 1.17, 95% CI 0.94 to 1.47).
Air leaks (Analysis 2.2): Seven trials reported this outcome (Chan 1993; Donn 1994; Bernstein 1996; Chen 1997; Baumer 2000; Beresford 2000; Liu 2011). None demonstrated a significant effect. The meta‐analysis found no evidence of effect.
Duration of ventilation (hours) (Analysis 2.3): Five trials reported this outcome (Donn 1994; Chen 1997; Baumer 2000; Beresford 2000; Liu 2011). Bernstein 1996 also reported the duration of ventilation, but the data are presented as the median and 95% CIs (SIMV 103 hours, 95% CI 94 to 118 versus CMV 120 hours, 95% CI 101 to 142), and the results, therefore, could not be meta‐analysed in the relevant Outcome (2.3). A significantly shorter duration of ventilation was noted in Chen's study (Chen 1997) and Donn's study (Donn 1994). The meta‐analysis of the five studies supported a significant reduction in ventilation duration (MD −38.30 hours, 95% CI −53.90 to −22.69). Chan 1993 reported the duration of weaning: ACV mean 39 hours, SD 45 versus CMV mean 65 hours, SD 75 (the results are not presented in Outcome 2.3).
Extubation failure (Analysis 2.4): Four trials reported this outcome (Chan 1993; Donn 1994; Chen 1997; Baumer 2000). One trial reported a significant effect in favour of ACV/SIMV (Chen 1997). The meta‐analysis of the results of the four trials, however, did not demonstrate a significant effect, the typical RR being 0.93 (95% CI 0.68 to 1.28).
Severe IVH (Analysis 2.5): Six trials reported this outcome (Donn 1994; Bernstein 1996; Chen 1997; Baumer 2000; Beresford 2000; Liu 2011). None demonstrated a significant effect. The meta‐analysis found no evidence of effect.
BPD (oxygen dependency at 28 days) (Analysis 2.6): Four trials reported this outcome (Baumer 2000; Bernstein 1996; Chen 1997; Donn 1994). None demonstrated a significant effect. The meta‐analysis found no evidence of effect.
Moderate/severe BPD (Oxygen dependency at 36 weeks postmenstrual age) (Analysis 2.7): Two trials reported this outcome (Baumer 2000; Beresford 2000). Neither demonstrated a significant effect. The meta‐analysis found no evidence of effect.
Other outcomes: In two trials the incidence of PDA is given post randomisation (Chen 1997; Beresford 2000). In one trial only the incidence of PDA requiring indomethacin and/or ligation was higher in the conventional group for both survivors (P < 0.05) and the whole population of infants (P < 0.05) (Beresford 2000).
SIMV OR SIMV + PS versus HFO (comparison 3)
Death (Analysis 3.1): Four trials of SIMV OR SIMV + PS VS HFO reported this outcome (Courtney 2002a; Craft 2003a; Singh 2012; Sun 2014). Sun 2014 reported a significant effect in favour of HFO (RR 3.21, 95% CI 1.07 to 9.67). No other trials reported a difference in this outcome, and the meta‐analysis found no evidence of effect.
BPD: oxygen dependency at 28 days (Analysis 3.2): One trial reported this outcome with no significant effect (Singh 2012).
Moderate/Severe BPD (Analysis 3.3): Three trials reported this outcome (Courtney 2002a; Craft 2003a; Sun 2014). Sun 2014 reported a significant effect in favour of HFO (RR 2.24, 95% CI 1.20 to 4.18) and Courtney 2002a reported a trend in favour of HFO (RR 1.24, 95% CI 0.96 to 1.60). The meta‐analysis showed a significant effect in favour of HFO (RR 1.33, 95% CI 1.07 to 1.65).
Death or BPD (Analysis 3.4): Only one study reported this combined outcome, with a significant effect in favour of HFO (RR 2.38, 95% CI 1.41 to 4.03) (Sun 2014).
Duration of mechanical ventilation (Analysis 3.5): Two trials reported this outcome with both showing a significant effect in favour of HFO (Singh 2012; Sun 2014). The meta‐analysis demonstrated a significant effect in favour of HFO (Mean difference 1.89 days, 95% CI 1.04 to 2.74).
Air Leaks (Analysis 3.6): One trial reported PIE as an outcome and showed a significant decrease of this outcome in the SIMV group (RR 0.66, CI 0.44 to 0.99) (Courtney 2002a). Three trials reported pneumothorax as an outcome with no significant difference (Courtney 2002a; Craft 2003a; Sun 2014).
IVH Grade 3 or 4 (Analysis 3.7): Four trials reported this outcome (Courtney 2002a; Craft 2003a; Singh 2012; Sun 2014). No trial found a significant difference.
ACV versus SIMV (comparison 4)
Duration of weaning (hours) (Analysis 4.1): Three trials of ACV versus SIMV reported this outcome (Chan 1994; Dimitriou 1995a; Dimitriou 1995b). None demonstrated a significant effect. In all three, however, the duration of weaning tended to be shorter in infants supported by ACV rather than SIMV. The meta‐analysis supported a trend in this direction which, however, did not reach statistical significance.
Weaning failure (Analysis 4.2): Three trials of ACV versus SIMV reported this outcome (Chan 1994; Dimitriou 1995a; Dimitriou 1995b). None demonstrated a significant effect. The meta‐analysis found no evidence of effect.
Extubation failure (Analysis 4.3): Three trials of ACV versus SIMV (Chan 1994; Dimitriou 1995a; Dimitriou 1995b) reported this outcome. None demonstrated a significant effect. The meta‐analysis found no evidence of effect.
Air leaks (Analysis 4.4): Three trials of ACV versus SIMV (Chan 1994; Dimitriou 1995a; Dimitriou 1995b) reported this outcome. None demonstrated a significant effect. The meta‐analysis found no evidence of effect.
SIMV PLUS PS versus SIMV (comparison 5)
Only Reyes 2006 reports on SIMV plus PS compared to SIMV alone.
Death (Analysis 5.1): There was no significant effect with regard to death at 28 days or death prior to discharge.
Air leaks (Analysis 5.2): The occurrence of PIE and pneumothorax are reported separately; there were no significant differences in either outcome.
BPD, oxygen dependency at 28 days (Outcome 5.3.1): There was no significant effect.
Moderate/severe BPD, oxygen dependency at 36 weeks postmenstrual age (Outcome 5.3.2): There was no overall significant effect.
Severe IVH (Grade III and IV) (Analysis 5.4): There was no significant effect.
Other outcomes: There was no significant effect re PDA. Days on mechanical ventilation and supplementary oxygen did not differ by ventilation status, but in the subgroup of infants with birth weight of 700 grams to 1000 grams, the days of supplementary oxygen were lower in the SIMV plus PS group (P = 0.034).
PRVCV versus SIMV (comparison 6)
Death prior to discharge (Analysis 6.1): One trial (D'Angio 2005) reported this with no significant difference between intervention.
BPD, oxygen requirement at 36 weeks' postmenstrual age in survivors (Analysis 6.2): One trial reported this with no significant difference between intervention (D'Angio 2005).
Airleak (PIE (Outcome 6.3.1) or Pneumothorax (Outcome 6.3.2)): In the PRVCV versus SIMV trial there were no significant effects with regard to either pneumothorax or PIE (D'Angio 2005).
Severe IVH (Analysis 6.4): One trial reported this outcome with no significant difference between intervention (D'Angio 2005).
SIMV versus PSV (comparison 7)
Duration of weaning (Analysis 7.1): One trial reported this outcome (Erdemir 2014). There was no significant difference.
Extubation failure (Analysis 7.2): One trial reported this outcome (Erdemir 2014). There was no significant difference.
Air leaks (total) (Analysis 7.3): One trial reported this outcome (Erdemir 2014). There was no significant difference.
Moderate/Severe BPD; Oxygen requirement at 36 weeks postmenstrual age (Analysis 7.4): One trial reported this outcome (Erdemir 2014). There was no significant difference.
ACV versus PSV (comparison 8)
Duration of weaning (Outcome 8.1): One trial reported this outcome (Patel 2012). The data were reported as median and range. No significant difference was reported.
Discussion
Physiological studies have demonstrated in prematurely born neonates that both high‐frequency positive pressure ventilation and triggered ventilation are more likely to provoke a synchronous respiratory interaction; that is, the infant's inspiratory efforts coincide with positive pressure inflations. When compared to CMV, those ventilation modes were shown to be associated with improved ventilation. Unfortunately, in none of the subsequent randomised trials is it reported whether synchronous ventilation was achieved and few outcome measures are consistently reported in all relevant trials. Nevertheless, the meta‐analyses demonstrate a significant decrease in air leak and a shorter duration of ventilation with HFPPV and triggered ventilation respectively. However, no significant effect on the incidence of BPD or death has been shown using either HFPPV or trigger ventilation modes.
No deleterious effects of those two ventilatory modes were highlighted. Some positive effects have been demonstrated of the newer triggered modes PRVCV and SIMV plus PS, but both modes have each only been examined in one randomised trial; further trials are required which incorporate long‐term outcomes.
A meta‐analysis of the studies comparing SIMV or SIMV + PS with HFO show a significant decrease in moderate or severe BPD, and significantly shorter duration of mechanical ventilation with HFO. Whether other trigger modes such as ACV have similar results to HFO requires investigating.

Study flow diagram: review update

Comparison 1: HFPPV vs CMV, Outcome 1: Death

Comparison 1: HFPPV vs CMV, Outcome 2: Air leaks

Comparison 1: HFPPV vs CMV, Outcome 3: Total air leak

Comparison 1: HFPPV vs CMV, Outcome 4: BPD (oxygen dependency at 28 days)

Comparison 1: HFPPV vs CMV, Outcome 5: IVH

Comparison 2: ACV/SIMV vs CMV, Outcome 1: Death

Comparison 2: ACV/SIMV vs CMV, Outcome 2: Air leaks

Comparison 2: ACV/SIMV vs CMV, Outcome 3: Duration of ventilation (hours)

Comparison 2: ACV/SIMV vs CMV, Outcome 4: Extubation failure

Comparison 2: ACV/SIMV vs CMV, Outcome 5: Severe IVH

Comparison 2: ACV/SIMV vs CMV, Outcome 6: BPD (oxygen dependency at 28 days)

Comparison 2: ACV/SIMV vs CMV, Outcome 7: Moderate/Severe BPD (oxygen dependent at 36 weeks PCA)

Comparison 3: SIMV or SIMV + PS vs HFOV, Outcome 1: Death

Comparison 3: SIMV or SIMV + PS vs HFOV, Outcome 2: BPD: oxygen requirement at 28 days

Comparison 3: SIMV or SIMV + PS vs HFOV, Outcome 3: Moderate/ Severe BPD: Oxygen requirement at 36 weeks PCA

Comparison 3: SIMV or SIMV + PS vs HFOV, Outcome 4: Death or BPD

Comparison 3: SIMV or SIMV + PS vs HFOV, Outcome 5: Duration of mechanical ventilation

Comparison 3: SIMV or SIMV + PS vs HFOV, Outcome 6: Air leaks

Comparison 3: SIMV or SIMV + PS vs HFOV, Outcome 7: IVH Grade 3/4

Comparison 4: ACV vs SIMV, Outcome 1: Duration of weaning (hours)

Comparison 4: ACV vs SIMV, Outcome 2: Weaning failure

Comparison 4: ACV vs SIMV, Outcome 3: Extubation failure

Comparison 4: ACV vs SIMV, Outcome 4: Air leaks

Comparison 5: PS + SIMV versus SIMV, Outcome 1: Death

Comparison 5: PS + SIMV versus SIMV, Outcome 2: Air leaks

Comparison 5: PS + SIMV versus SIMV, Outcome 3: BPD

Comparison 5: PS + SIMV versus SIMV, Outcome 4: Severe IVH (grade III and IV)

Comparison 6: PRVCV vs SIMV, Outcome 1: Death prior to discharge

Comparison 6: PRVCV vs SIMV, Outcome 2: BPD: oxygen requirement at 36 weeks in survivors

Comparison 6: PRVCV vs SIMV, Outcome 3: Air leak

Comparison 6: PRVCV vs SIMV, Outcome 4: Severe IVH

Comparison 7: PSV vs SIMV, Outcome 1: Duration of weaning

Comparison 7: PSV vs SIMV, Outcome 2: Extubation failure

Comparison 7: PSV vs SIMV, Outcome 3: Air leaks (total)

Comparison 7: PSV vs SIMV, Outcome 4: Moderate/Severe BPD: oxygen requirement at 36 weeks PCA
| Duration of weaning | ||||
| Study | Participants | Duration of weaning ACV (Median (range)) | Duration of weaning PSV (Median(range)) | Significance |
|---|---|---|---|---|
| Patel 2012 | 36 | 34 (7‐100) | 27 (10‐169) | p=0.88 |
Comparison 8: ACV versus PSV, Outcome 1: Duration of weaning
| Outcome or subgroup title | No. of studies | No. of participants | Statistical method | Effect size |
| 1.1 Death Show forest plot | 4 | 647 | Risk Ratio (M‐H, Fixed, 95% CI) | 0.78 [0.61, 1.00] |
| 1.2 Air leaks Show forest plot | 3 | Risk Ratio (M‐H, Fixed, 95% CI) | Subtotals only | |
| 1.2.1 Pneumothorax | 3 | 585 | Risk Ratio (M‐H, Fixed, 95% CI) | 0.69 [0.51, 0.93] |
| 1.2.2 Pulmonary interstitial emphysema | 1 | 137 | Risk Ratio (M‐H, Fixed, 95% CI) | 0.68 [0.49, 0.94] |
| 1.3 Total air leak Show forest plot | 1 | 62 | Risk Ratio (M‐H, Fixed, 95% CI) | 0.25 [0.06, 1.08] |
| 1.4 BPD (oxygen dependency at 28 days) Show forest plot | 4 | 647 | Risk Ratio (M‐H, Fixed, 95% CI) | 1.06 [0.77, 1.46] |
| 1.5 IVH Show forest plot | 1 | 62 | Risk Ratio (M‐H, Fixed, 95% CI) | 0.12 [0.02, 0.94] |
| Outcome or subgroup title | No. of studies | No. of participants | Statistical method | Effect size |
| 2.1 Death Show forest plot | 6 | 1790 | Risk Ratio (M‐H, Fixed, 95% CI) | 1.17 [0.94, 1.47] |
| 2.2 Air leaks Show forest plot | 7 | 1830 | Risk Ratio (M‐H, Fixed, 95% CI) | 0.98 [0.76, 1.27] |
| 2.3 Duration of ventilation (hours) Show forest plot | 5 | 1463 | Mean Difference (IV, Fixed, 95% CI) | ‐38.30 [‐53.90, ‐22.69] |
| 2.4 Extubation failure Show forest plot | 4 | 1056 | Risk Ratio (M‐H, Fixed, 95% CI) | 0.93 [0.68, 1.28] |
| 2.5 Severe IVH Show forest plot | 6 | 1790 | Risk Ratio (M‐H, Fixed, 95% CI) | 1.01 [0.73, 1.40] |
| 2.6 BPD (oxygen dependency at 28 days) Show forest plot | 4 | 805 | Risk Ratio (M‐H, Fixed, 95% CI) | 0.91 [0.75, 1.12] |
| 2.7 Moderate/Severe BPD (oxygen dependent at 36 weeks PCA) Show forest plot | 2 | 1310 | Risk Ratio (M‐H, Fixed, 95% CI) | 0.90 [0.75, 1.08] |
| Outcome or subgroup title | No. of studies | No. of participants | Statistical method | Effect size |
| 3.1 Death Show forest plot | 4 | 996 | Risk Ratio (M‐H, Fixed, 95% CI) | 1.25 [0.91, 1.71] |
| 3.2 BPD: oxygen requirement at 28 days Show forest plot | 1 | 110 | Risk Ratio (M‐H, Fixed, 95% CI) | 3.21 [0.37, 27.83] |
| 3.3 Moderate/ Severe BPD: Oxygen requirement at 36 weeks PCA Show forest plot | 3 | 869 | Risk Ratio (M‐H, Fixed, 95% CI) | 1.33 [1.07, 1.65] |
| 3.4 Death or BPD Show forest plot | 1 | 356 | Risk Ratio (M‐H, Fixed, 95% CI) | 2.38 [1.41, 4.03] |
| 3.5 Duration of mechanical ventilation Show forest plot | 2 | 466 | Mean Difference (IV, Fixed, 95% CI) | 1.89 [1.04, 2.74] |
| 3.6 Air leaks Show forest plot | 3 | 1398 | Risk Ratio (M‐H, Fixed, 95% CI) | 0.91 [0.70, 1.19] |
| 3.6.1 Pulmonary interstitial emphysema | 1 | 498 | Risk Ratio (M‐H, Fixed, 95% CI) | 0.66 [0.44, 0.99] |
| 3.6.2 Pneumothorax | 3 | 900 | Risk Ratio (M‐H, Fixed, 95% CI) | 1.15 [0.82, 1.64] |
| 3.7 IVH Grade 3/4 Show forest plot | 4 | 1010 | Risk Ratio (M‐H, Fixed, 95% CI) | 0.94 [0.71, 1.24] |
| Outcome or subgroup title | No. of studies | No. of participants | Statistical method | Effect size |
| 4.1 Duration of weaning (hours) Show forest plot | 3 | 120 | Mean Difference (IV, Fixed, 95% CI) | ‐42.38 [‐94.35, 9.60] |
| 4.2 Weaning failure Show forest plot | 3 | 120 | Risk Ratio (M‐H, Fixed, 95% CI) | 0.78 [0.31, 1.93] |
| 4.3 Extubation failure Show forest plot | 3 | 120 | Risk Ratio (M‐H, Fixed, 95% CI) | 1.00 [0.37, 2.67] |
| 4.4 Air leaks Show forest plot | 3 | 120 | Risk Ratio (M‐H, Fixed, 95% CI) | 0.80 [0.23, 2.83] |
| 4.4.1 Total air leaks | 3 | 120 | Risk Ratio (M‐H, Fixed, 95% CI) | 0.80 [0.23, 2.83] |
| Outcome or subgroup title | No. of studies | No. of participants | Statistical method | Effect size |
| 5.1 Death Show forest plot | 1 | Risk Ratio (M‐H, Fixed, 95% CI) | Subtotals only | |
| 5.1.1 Death during first 28 days | 1 | 107 | Risk Ratio (M‐H, Fixed, 95% CI) | 0.41 [0.08, 2.01] |
| 5.1.2 Death prior to discharge | 1 | 107 | Risk Ratio (M‐H, Fixed, 95% CI) | 0.87 [0.31, 2.43] |
| 5.2 Air leaks Show forest plot | 1 | Risk Ratio (M‐H, Fixed, 95% CI) | Subtotals only | |
| 5.2.1 Pneumothorax | 1 | 107 | Risk Ratio (M‐H, Fixed, 95% CI) | Not estimable |
| 5.2.2 Pulmonary interstitial emphysema | 1 | 107 | Risk Ratio (M‐H, Fixed, 95% CI) | 0.73 [0.25, 2.15] |
| 5.3 BPD Show forest plot | 1 | Risk Ratio (M‐H, Fixed, 95% CI) | Subtotals only | |
| 5.3.1 BPD (oxygen dependency at 28 days) | 1 | 107 | Risk Ratio (M‐H, Fixed, 95% CI) | 1.02 [0.84, 1.23] |
| 5.3.2 Moderate/Severe BPD (oxygen dependency at 36 weeks PMA) | 1 | 107 | Risk Ratio (M‐H, Fixed, 95% CI) | 0.71 [0.42, 1.18] |
| 5.4 Severe IVH (grade III and IV) Show forest plot | 1 | 107 | Risk Ratio (M‐H, Fixed, 95% CI) | 0.92 [0.41, 2.08] |
| Outcome or subgroup title | No. of studies | No. of participants | Statistical method | Effect size |
| 6.1 Death prior to discharge Show forest plot | 1 | 211 | Risk Ratio (M‐H, Fixed, 95% CI) | 1.03 [0.50, 2.11] |
| 6.2 BPD: oxygen requirement at 36 weeks in survivors Show forest plot | 1 | 185 | Risk Ratio (M‐H, Fixed, 95% CI) | 0.83 [0.55, 1.27] |
| 6.3 Air leak Show forest plot | 1 | 424 | Risk Ratio (M‐H, Fixed, 95% CI) | 1.04 [0.51, 2.13] |
| 6.3.1 PIE | 1 | 212 | Risk Ratio (M‐H, Fixed, 95% CI) | 1.66 [0.56, 4.91] |
| 6.3.2 Pneumothorax | 1 | 212 | Risk Ratio (M‐H, Fixed, 95% CI) | 0.69 [0.26, 1.88] |
| 6.4 Severe IVH Show forest plot | 1 | 203 | Risk Ratio (M‐H, Fixed, 95% CI) | 0.67 [0.29, 1.58] |
| Outcome or subgroup title | No. of studies | No. of participants | Statistical method | Effect size |
| 7.1 Duration of weaning Show forest plot | 1 | 60 | Mean Difference (IV, Fixed, 95% CI) | ‐11.30 [‐26.53, 3.93] |
| 7.2 Extubation failure Show forest plot | 1 | 60 | Risk Ratio (M‐H, Fixed, 95% CI) | 1.09 [0.57, 2.07] |
| 7.3 Air leaks (total) Show forest plot | 1 | 60 | Risk Ratio (M‐H, Fixed, 95% CI) | 0.20 [0.01, 4.00] |
| 7.4 Moderate/Severe BPD: oxygen requirement at 36 weeks PCA Show forest plot | 1 | 60 | Risk Ratio (M‐H, Fixed, 95% CI) | 1.00 [0.46, 2.17] |
| Outcome or subgroup title | No. of studies | No. of participants | Statistical method | Effect size |
| 8.1 Duration of weaning Show forest plot | 1 | Other data | No numeric data | |