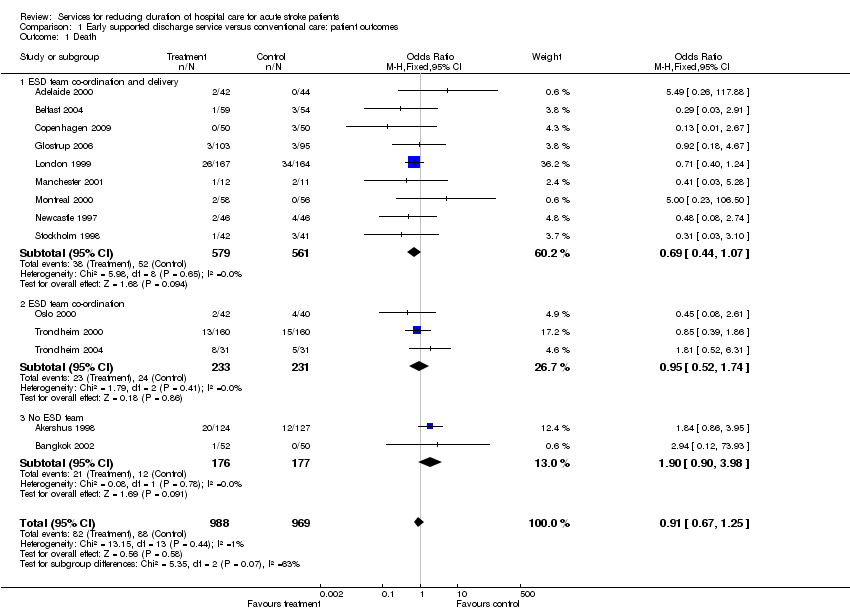
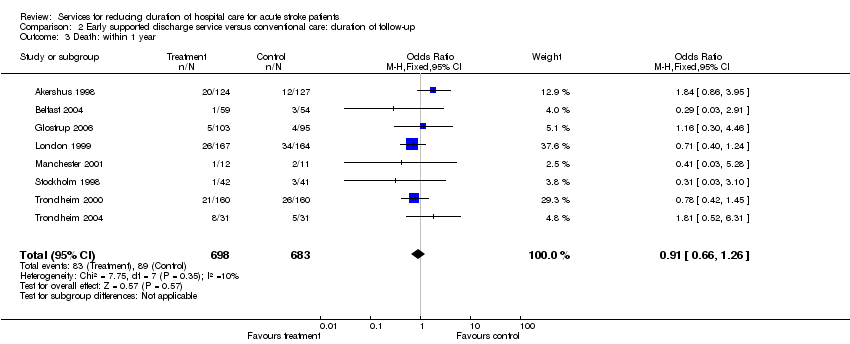
| 1 Death Show forest plot | 14 | 1957 | Odds Ratio (M‐H, Fixed, 95% CI) | 0.91 [0.67, 1.25] |
|
| 1.1 ESD team co‐ordination and delivery | 9 | 1140 | Odds Ratio (M‐H, Fixed, 95% CI) | 0.69 [0.44, 1.07] |
| 1.2 ESD team co‐ordination | 3 | 464 | Odds Ratio (M‐H, Fixed, 95% CI) | 0.95 [0.52, 1.74] |
| 1.3 No ESD team | 2 | 353 | Odds Ratio (M‐H, Fixed, 95% CI) | 1.90 [0.90, 3.98] |
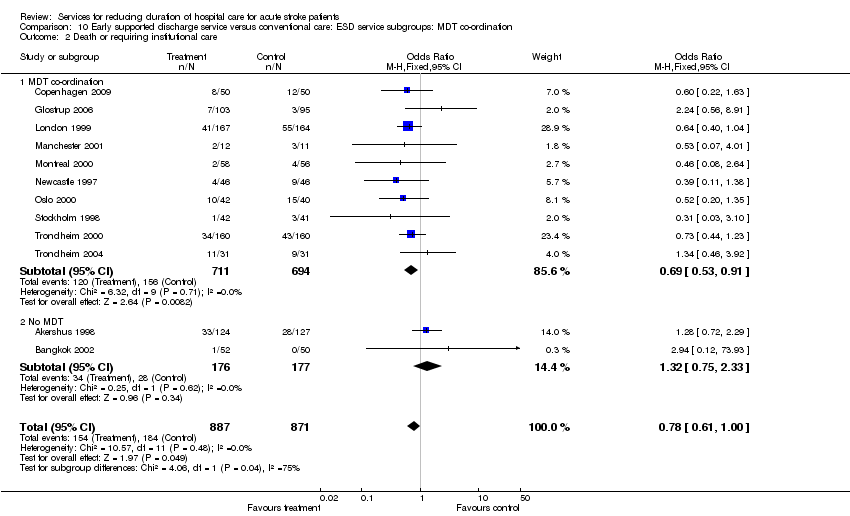
| 2 Death or requiring institutional care Show forest plot | 12 | 1758 | Odds Ratio (M‐H, Fixed, 95% CI) | 0.78 [0.61, 1.00] |
|
| 2.1 ESD team co‐ordination and delivery | 7 | 941 | Odds Ratio (M‐H, Fixed, 95% CI) | 0.65 [0.45, 0.93] |
| 2.2 ESD team co‐ordination | 3 | 464 | Odds Ratio (M‐H, Fixed, 95% CI) | 0.75 [0.50, 1.14] |
| 2.3 No ESD team | 2 | 353 | Odds Ratio (M‐H, Fixed, 95% CI) | 1.32 [0.75, 2.33] |
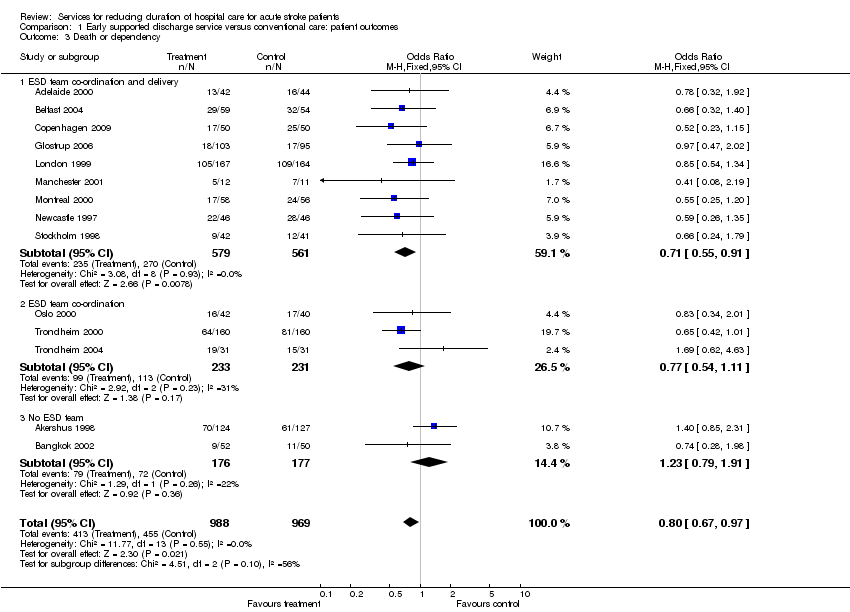
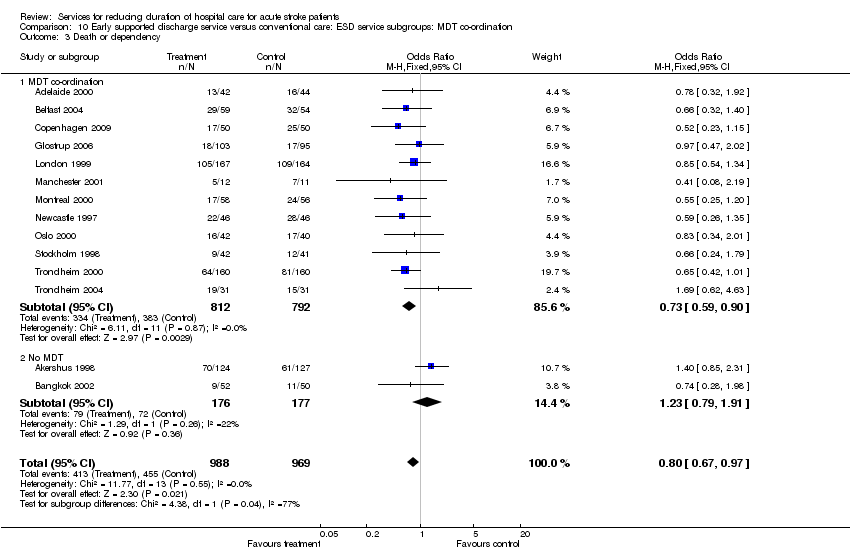
| 3 Death or dependency Show forest plot | 14 | 1957 | Odds Ratio (M‐H, Fixed, 95% CI) | 0.80 [0.67, 0.97] |
|
| 3.1 ESD team co‐ordination and delivery | 9 | 1140 | Odds Ratio (M‐H, Fixed, 95% CI) | 0.71 [0.55, 0.91] |
| 3.2 ESD team co‐ordination | 3 | 464 | Odds Ratio (M‐H, Fixed, 95% CI) | 0.77 [0.54, 1.11] |
| 3.3 No ESD team | 2 | 353 | Odds Ratio (M‐H, Fixed, 95% CI) | 1.23 [0.79, 1.91] |
| 4 Activities of daily living (Barthel ADL) score Show forest plot | 9 | 1124 | Std. Mean Difference (IV, Fixed, 95% CI) | 0.03 [‐0.08, 0.15] |
|
| 4.1 ESD team co‐ordination and delivery | 7 | 825 | Std. Mean Difference (IV, Fixed, 95% CI) | 0.06 [‐0.08, 0.20] |
| 4.2 ESD team co‐ordination | 1 | 48 | Std. Mean Difference (IV, Fixed, 95% CI) | ‐0.23 [‐0.79, 0.34] |
| 4.3 No ESD team | 1 | 251 | Std. Mean Difference (IV, Fixed, 95% CI) | 0.0 [‐0.25, 0.25] |
| 5 Extended activities of daily living (EADL) score Show forest plot | 9 | 1051 | Std. Mean Difference (IV, Fixed, 95% CI) | 0.14 [0.02, 0.26] |
|
| 5.1 ESD team co‐ordination and delivery | 7 | 729 | Std. Mean Difference (IV, Fixed, 95% CI) | 0.17 [0.02, 0.32] |
| 5.2 ESD team co‐ordination | 2 | 322 | Std. Mean Difference (IV, Fixed, 95% CI) | 0.07 [‐0.15, 0.29] |
| 5.3 No ESD team | 0 | 0 | Std. Mean Difference (IV, Fixed, 95% CI) | 0.0 [0.0, 0.0] |
| 6 Subjective health status Show forest plot | 12 | 1377 | Std. Mean Difference (IV, Fixed, 95% CI) | 0.00 [‐0.10, 0.11] |
|
| 6.1 ESD team co‐ordination and delivery | 8 | 860 | Std. Mean Difference (IV, Fixed, 95% CI) | ‐0.07 [‐0.21, 0.06] |
| 6.2 ESD team co‐ordination | 3 | 370 | Std. Mean Difference (IV, Fixed, 95% CI) | 0.14 [‐0.07, 0.34] |
| 6.3 No ESD team | 1 | 147 | Std. Mean Difference (IV, Fixed, 95% CI) | 0.14 [‐0.19, 0.47] |
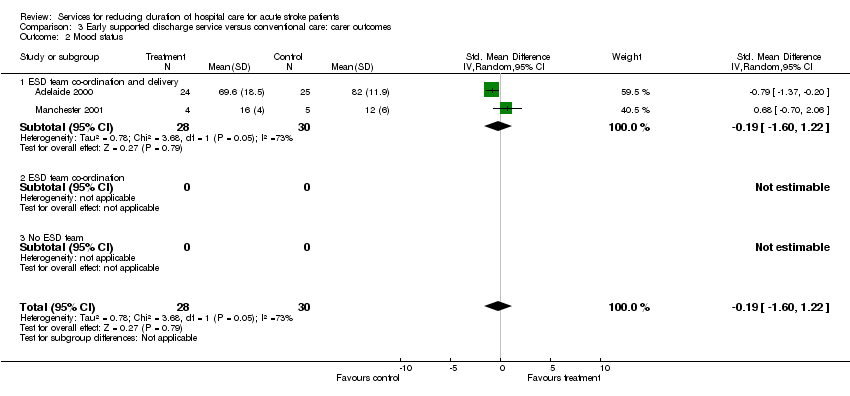
| 7 Mood status Show forest plot | 8 | 851 | Std. Mean Difference (IV, Fixed, 95% CI) | ‐0.06 [‐0.19, 0.07] |
|
| 7.1 ESD team co‐ordination and delivery | 5 | 383 | Std. Mean Difference (IV, Fixed, 95% CI) | ‐0.02 [‐0.22, 0.18] |
| 7.2 ESD team co‐ordination | 2 | 321 | Std. Mean Difference (IV, Fixed, 95% CI) | ‐0.08 [‐0.30, 0.14] |
| 7.3 No ESD team | 1 | 147 | Std. Mean Difference (IV, Fixed, 95% CI) | ‐0.12 [‐0.45, 0.20] |
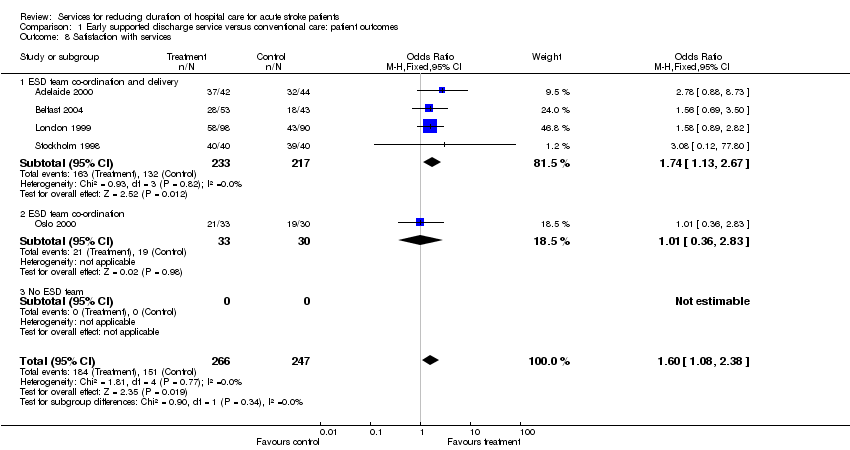
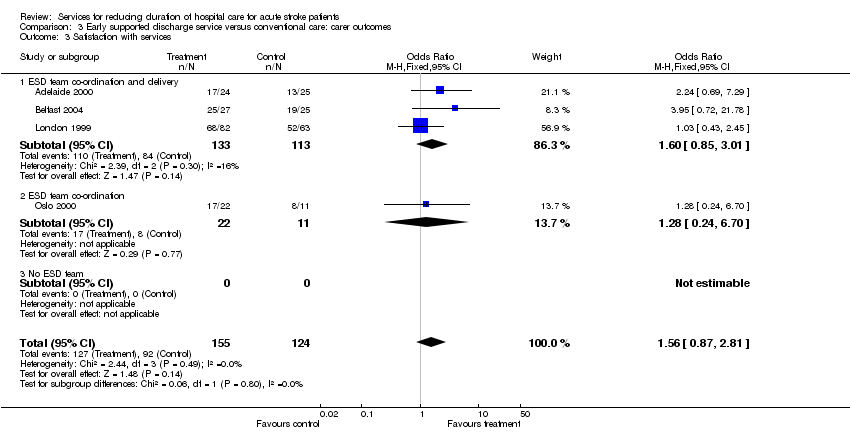
| 8 Satisfaction with services Show forest plot | 5 | 513 | Odds Ratio (M‐H, Fixed, 95% CI) | 1.60 [1.08, 2.38] |
|
| 8.1 ESD team co‐ordination and delivery | 4 | 450 | Odds Ratio (M‐H, Fixed, 95% CI) | 1.74 [1.13, 2.67] |
| 8.2 ESD team co‐ordination | 1 | 63 | Odds Ratio (M‐H, Fixed, 95% CI) | 1.01 [0.36, 2.83] |
| 8.3 No ESD team | 0 | 0 | Odds Ratio (M‐H, Fixed, 95% CI) | 0.0 [0.0, 0.0] |