Long chain polyunsaturated fatty acid supplementation in infants born at term
Referencias
References to studies included in this review
References to studies excluded from this review
Additional references
References to other published versions of this review
Characteristics of studies
Characteristics of included studies [ordered by study ID]
Ir a:
| Methods | Single‐centre study in Milan, Italy | |
| Participants | N = 60. Inclusion criteria: term infants (37 to 42 weeks), 5 minute Apgar score > 7, absence of disease. Exclusion criteria: not mentioned | |
| Interventions | Supplemented formula contained DHA (0.3%) and AA (0.44%). Control formula did not contain DHA nor AA. Study milk formulae were fed from within third day of life until 4 months. Source of LCPUFA was egg yolk phospholipids | |
| Outcomes | Brunet‐Lezine test of global neurodevelopment at 4, 12 and 24 months, Plasma and RBC phospholipid DHA and AA at 4 months and 24 months, physical growth at 1 year | |
| Notes | 30 infants in the breast‐fed reference group. Study authors responded by providing additional information regarding study methods | |
| Risk of bias | ||
| Bias | Authors' judgement | Support for judgement |
| Random sequence generation (selection bias) | Low risk | Use of a time balanced randomisation table |
| Allocation concealment (selection bias) | Low risk | Use of sealed envelopes |
| Blinding (performance bias and detection bias) | Low risk | Both investigators and family members were blinded to the intervention |
| Incomplete outcome data (attrition bias) | Low risk | Follow‐up rate > 90% |
| Selective reporting (reporting bias) | Low risk | All prespecified outcomes were reported |
| Other bias | Low risk | Appears to be free of other biases |
| Methods | Three‐centre RCT in Kansas, Portland and Seattle | |
| Participants | N = 134. Inclusion criteria: term infants ≥ 37 weeks' gestation, AGA. Exclusion criteria: Apgar score < 7 at 5 minutes, physical or metabolic defects, received IV lipid infusion or blood transfusion, mothers with diabetes, hyperlipidaemia or perinatal infection | |
| Interventions | DHA plus AA formula was enriched with DHA (0.13%) and AA (0.45%). DHA alone formula was enriched with DHA (0.2%). Control formula was standard milk without addition of DHA and AA. Infants were randomised within 9 days after birth. Study formulae were fed ad libitum as the sole source of nutrition for first 4 months and as exclusive milk beverage up to 12 months of age. Source of LCPUFA was egg yolk phospholipids | |
| Outcomes | RBC fatty acid levels at 2, 4, 6 and 12 months. Growth measured at 1, 2, 4, 6, 9 and 12 months. Visual acuity at 2, 4, 6, 9, 12 and 39 months. Visual acuity measured by the Teller acuity card procedure or sweep spatial frequency VEP. Global development assessed at 1 year (BSID) and at 3 years (Stanford Binet IQ). Language development assessed at 14 months (McArthur Communicative Development Inventory) and at 3 years (Peabody Picture Vocabulary Test) | |
| Notes | Breast‐fed reference group: n = 63. Study authors had provided additional information for the previous version of this review. We contacted them to request more information for this update. Study authors acknowledged receipt of our letter but did not provide requested information | |
| Risk of bias | ||
| Bias | Authors' judgement | Support for judgement |
| Random sequence generation (selection bias) | Low risk | Centralised randomisation |
| Allocation concealment (selection bias) | Low risk | Centralised randomisation |
| Blinding (performance bias and detection bias) | Low risk | Assessors of developmental outcomes were unaware of infants' group assignment and medical history |
| Incomplete outcome data (attrition bias) | High risk | Outcomes of only infants who completed the study were reported. Less than 80% follow‐up for visual acuity outcomes at different ages |
| Selective reporting (reporting bias) | Low risk | All prespecified outcomes were reported |
| Other bias | Low risk | Appears to be free of other biases |
| Methods | RCT in 4 centres (Missouri, Arkansas, Pennsylvania and Arizona) | |
| Participants | N = 404 (initially enrolled). Inclusion criteria: term infants between 37 and 42 weeks' gestation, ≤ 9 days, birth weight ≥ 2500 grams, 5 minute Apgar score ≥ 7, ability to tolerate milk‐based formula or breast milk. Exclusion criteria: significant cardiac, ophthalmological, gastrointestinal or hematological or metabolic disease, milk protein allergy, maternal medical history known to have adverse effects on the foetus, tuberculosis, HIV, perinatal infection, substance abuse | |
| Interventions | Study formula was milk formula supplemented with DHA (0.13%) and AA (0.45%). Control formula was standard milk without DHA and AA added. Infants were randomised within 9 days of birth. Study formulae were fed ad libitum as the sole source of nutrition for first 4 months and as exclusive milk beverage up to 12 months of age. Source of LCPUFA was fish and fungus oil in one group and egg yolk triglyceride in the other | |
| Outcomes | Fatty acid profiles in red cell lipids, physical growth at 1, 2, 4, 6, 9 and 12 months. Visual acuity measured by Teller acuity card procedure at 2, 4, 6 and 12 months, Fagan test of infant intelligence at 6 and 9 months, Bayley Scales of Infant Development at 6 and 12 months, language assessment with McArthur's communicative developmental inventories at 9 and 14 months, parental reporting of infant temperament at 6 and 12 months | |
| Notes | Study authors reported outcome data separately for milk formula enriched with LCPUFA derived from fish/fungus oil and milk formula enriched with LCPUFA derived from egg triglyceride. Our outcome of interest was the effect of LCPUFA rather than the source of LCPUFA, so we asked study authors to provide combined outcome data. Study authors provided the requested data . Breast‐fed control group: N = 82 | |
| Risk of bias | ||
| Bias | Authors' judgement | Support for judgement |
| Random sequence generation (selection bias) | Low risk | Computer‐generated with a random permuted blocks algorithm |
| Allocation concealment (selection bias) | Low risk | Centralised randomisation |
| Blinding (performance bias and detection bias) | Low risk | Measures of growth, visual acuity, information processing, general development, language and temperament were assessed by masked clinical tests |
| Incomplete outcome data (attrition bias) | High risk | 239 out of 404 enrolled infants completed the study, and only those results were reported. Less than 80% of enrolled infants completed the study |
| Selective reporting (reporting bias) | Low risk | All prespecified outcomes were reported |
| Other bias | Low risk | Appears to be free of other biases |
| Methods | Single‐centre RCT in China | |
| Participants | N = 121. Included: infants of gestational age 37 to 40 weeks. Exclusion criteria: infants with congenital anomalies | |
| Interventions | LCPUFA group was given milk formula enriched with DHA and AA. LCPUFA content of the formula was not clear. Control group was fed with standard milk formula without DHA and AA added. Infants were randomly assigned to the study formula before 2 weeks of life. Assigned diets were fed from day of enrolment to 6 months of age. Source of LCPUFA was not clear | |
| Outcomes | Fatty acid profiles in red cell lipids, physical growth and neurodevelopmental outcomes at 3 and 6 months of age | |
| Notes | Study authors published a short version of the article in a Chinese medical journal. The full article with raw data was provided by study authors on request. Study authors also clarified study methods. Breast‐fed reference group = 26 | |
| Risk of bias | ||
| Bias | Authors' judgement | Support for judgement |
| Random sequence generation (selection bias) | Unclear risk | Method used to generate random sequence was unclear |
| Allocation concealment (selection bias) | Unclear risk | Method used for allocation concealment was unclear |
| Blinding (performance bias and detection bias) | Low risk | Blinding of intervention and outcome assessors was performed |
| Incomplete outcome data (attrition bias) | High risk | Follow‐up rate was 48% at 3 months and 33% at 6 months |
| Selective reporting (reporting bias) | Unclear risk | Details not available |
| Other bias | Unclear risk | Details not available |
| Methods | Single‐centre RCT conducted in Dallas, Texas, USA | |
| Participants | N = 79. Inclusion criteria: infants of gestational age 37 to 40 weeks, singleton births and appropriate for gestational age. Exclusion criteria: family history of milk protein allergy or genetic or familial eye disease, maternal vegetarian or vegan dietary pattern, maternal metabolic disease, anaemia or infection, congenital malformation or infection, jaundice, perinatal asphyxia, meconium aspiration syndrome, admission to NICU | |
| Interventions | One group was fed with formula milk enriched with DHA (0.36%) and AA (0.72%). Another group was fed formula milk enriched with DHA alone (0.36%). Control group was fed standard milk formula without DHA and AA added. Infants were randomly assigned to the study formula between 1 and 5 days of life. Assigned diets were fed from within 5 days of birth until 17 weeks of age. Source of LCPUFA was single‐cell oil | |
| Outcomes | Blood lipids were measured at 17 and 52 weeks. Growth, sweep VEP and forced preferential looking were measured at 6, 17, 26 and 52 weeks. Bayley Scales of Infant Development were measured at 18 months | |
| Notes | Breast‐fed reference: n = 29 | |
| Risk of bias | ||
| Bias | Authors' judgement | Support for judgement |
| Random sequence generation (selection bias) | Low risk | Use of block randomisation schedule |
| Allocation concealment (selection bias) | Low risk | Use of sealed envelopes |
| Blinding (performance bias and detection bias) | Low risk | Investigators conducting blood lipid analysis and visual function testing were masked to type of formula provided to infants |
| Incomplete outcome data (attrition bias) | High risk | 70% to 86% follow up for different outcomes |
| Selective reporting (reporting bias) | Low risk | All prespecified outcomes were reported |
| Other bias | Low risk | Appears to be free of other biases |
| Methods | Single‐centre RCT conducted in Dallas, Texas, USA | |
| Participants | N = 103. Included: infants of gestational age 37 to 40 weeks, singleton births, appropriate for gestational age. Exclusion criteria: family history of milk protein allergy or genetic or familial eye disease, maternal vegetarian or vegan dietary pattern, maternal metabolic disease, anaemia or infection, congenital malformation or infection, jaundice, perinatal asphyxia, meconium aspiration syndrome, admission to NICU | |
| Interventions | 'LCPUFA' group was given milk formula enriched with DHA (0.36%) and AA (0.72%). Control group was fed standard milk formula without DHA and AA added. Infants were randomly assigned to study formula between 1 and 5 days of life. Assigned diets were fed from day of enrolment to 52 weeks of age. Source of DHA was single‐cell algal oil (Crypthecodinium cohnii); source of AA was fungal oil (Mortierella alpina) | |
| Outcomes | Fatty acid profiles in red cell lipids, physical growth, visual outcomes: sweep VEP acuity, random dot stereo acuity | |
| Notes | Study authors clarified method details and provided additional information on outcome data. No breast‐fed control group | |
| Risk of bias | ||
| Bias | Authors' judgement | Support for judgement |
| Random sequence generation (selection bias) | Low risk | Use of single randomisation schedule at a central location. Randomisation schedule had random‐length blocks (block length varied from 6 to 12) |
| Allocation concealment (selection bias) | Low risk | Use of sealed envelopes |
| Blinding (performance bias and detection bias) | Low risk | Each diet was masked by 2 colour codes and 2 number codes, for a total of 4 possible diet assignments. Study authors informed that outcome assessors were blinded |
| Incomplete outcome data (attrition bias) | Low risk | 83% to 92% follow‐up rates for different outcomes at different stages |
| Selective reporting (reporting bias) | Low risk | All prespecified outcomes were reported |
| Other bias | Low risk | Appears to be free of other biases |
| Methods | Randomised controlled trial conducted in Dallas (5 hospitals) and Kansas (2 hospitals) | |
| Participants | N = 170. Included: healthy, full‐term (37 to 42 weeks) formula‐fed infants. Excluded: infants who had received human milk within 24 hours of randomisation, with disease or congenital anomaly likely to affect visual development and neurodevelopment, poor formula intake, known or suspected intolerance to cow's milk formula. Also excluded were infants born to mothers with chronic illnesses such as HIV, renal or hepatic disease, diabetes, alcoholism or substance abuse | |
| Interventions | 'LCPUFA' group was given milk formula enriched with DHA (0.32%) and AA (0.64%). Control group was fed standard milk formula without DHA and AA added. Infants were randomly assigned to study formula between 1 and 9 days of life. Assigned diets were fed from day of enrolment to 1 year of age. Assigned formula was the sole source of nutrition until ≈4 months of age. Source of DHA was single‐cell algal oil (Crypthecodinium cohnii); source of AA was fungal oil (Mortierella alpina) | |
| Outcomes | Sweep VEP acuity, fatty acid profiles in red cell lipids, anthropometry, formula intake and tolerance at 1.5, 4, 6, 9 and 12 months of age. VEP visual acuity at 12 months of age was the primary outcome of interest. Quality of attention, heart rate, age‐appropriate standardised and specific cognitive tests (18 months to 6 years every 6‐monthly), growth until 6 years of age, school readiness and receptive vocabulary were other long‐term outcomes of interest | |
| Notes | The study included 4 groups: control (0% DHA), 0.32% DHA, 0.64% DHA, 0.96% DHA. For this review, we used the 0.32% DHA group as the intervention arm. DHA supplemented formulae also provided 0.64% arachidonic acid. Study authors clarified a few method issues and provided requested information. Standard errors of means were provided by study authors, and Cochrane review authors converted them into standard deviations | |
| Risk of bias | ||
| Bias | Authors' judgement | Support for judgement |
| Random sequence generation (selection bias) | Low risk | A computer programme with a random number generation function was used to create the randomisation sequence |
| Allocation concealment (selection bias) | Low risk | Use of sealed envelopes |
| Blinding (performance bias and detection bias) | Low risk | Each infant's study formula group allocation was masked until all infants had reached 12 months of age and data collection had been completed, validated and locked |
| Incomplete outcome data (attrition bias) | High risk | Only 120/170 enrolled infants (70.5%) completed the study |
| Selective reporting (reporting bias) | Low risk | For the primary outcome, reporting was free of selective reporting bias |
| Other bias | High risk | Bayley Scale scores at 18 months of age were reported only for study participants from the Dallas centre. Results for study participants at the Kansas centre were not reported. Study authors mention in the manuscript that this occurred because this phase 2 trial was done separately by study centres using different protocols and data collection and analysis |
| Methods | Single‐centre RCT conducted in Netherlands | |
| Participants | N = 315. Included: infants of gestational age 37 to 42 weeks. Exclusion criteria: congenital anomalies, infants from multiple births, mothers with significant disability, mothers with insufficient mastery of Dutch language, adopted or foster infants and formula‐fed infants who had received human milk for more than 5 days | |
| Interventions | 'LCPUFA' group was given milk formula enriched with DHA (0.3%) and AA (0.45%). Control group was fed standard milk formula without DHA and AA added. Infants were randomly assigned to the study formula between 1 and 5 days of life. Assigned diets were fed from day of enrolment for 2 months. Source of LCPUFA was egg yolk, tuna oil and single‐cell oil produced by the soil fungus, Mortierella alpina | |
| Outcomes | Neurodevelopmental assessment using Hempel and Bayley Scales. Hempel assessment is a standardised technique designed for detection of minor signs of neurological dysfunction and physical growth. Anthropometric, cardiovascular, cognitive and behavioural assessments were done at nine years of age | |
| Notes | Study authors provided additional information regarding various outcomes. Breast‐fed reference group: 160 | |
| Risk of bias | ||
| Bias | Authors' judgement | Support for judgement |
| Random sequence generation (selection bias) | Low risk | Use of central computerized randomisation with blocked design |
| Allocation concealment (selection bias) | Low risk | Central computerised randomisation |
| Blinding (performance bias and detection bias) | Low risk | Parents and examiners were unaware of the type of formula feeding that infants received |
| Incomplete outcome data (attrition bias) | Low risk | Follow‐up was 92% |
| Selective reporting (reporting bias) | Low risk | All prespecified outcomes were reported |
| Other bias | Low risk | Appears to be free of other biases |
| Methods | Single‐centre RCT conducted in Memphis, Tennessee, USA | |
| Participants | N = 39. Inclusion criteria: infants born at term (37 to 43 weeks' PMA) without IUGR and with no medical problems likely to influence long‐term growth and development. Exclusion criteria: not mentioned | |
| Interventions | Supplemented formula was enriched with DHA (0.10%) and AA (0.43%). Control formula did not include DHA and AA. Infants were randomised within 24 hours of birth to receive study milk formula. Study formula was fed for 1 year. Source of LCPUFA was egg yolk phospholipids | |
| Outcomes | RBC and plasma fatty acid levels at 2, 4, 6 and 12 months | |
| Notes | Breast‐fed reference group: N = 19 | |
| Risk of bias | ||
| Bias | Authors' judgement | Support for judgement |
| Random sequence generation (selection bias) | Low risk | |
| Allocation concealment (selection bias) | Low risk | Sealed envelopes |
| Blinding (performance bias and detection bias) | Low risk | Two investigators were unaware of infants' dietary treatments and results of earlier acuity tests |
| Incomplete outcome data (attrition bias) | High risk | 58 of the initially recruited 90 completed the study (LCPUFA: 20; control formula: 19; breast‐fed reference group: 19). 36 were lost to follow‐up (LCPUFA: 9; control formula: 11; breast‐fed reference group: 16) |
| Selective reporting (reporting bias) | Low risk | All prespecified outcomes were reported |
| Other bias | Low risk | Appears to be free of other biases |
| Methods | Single‐centre RCT conducted in France | |
| Participants | N = 24. Inclusion criteria: healthy term appropriate for gestational age infants. Exclusion criteria: infants of mothers who had history of cocaine or alcohol abuse, hyperlipidaemia, diabetes, strict vegetarian or vegan diets | |
| Interventions | 'LCPUFA' group was given milk formula enriched with DHA (0.31%). Control group was fed standard milk formula without DHA added. Assigned diets were fed from day 3 of life until 4 months of age. Source of LCPUFA was fish oil | |
| Outcomes | Fatty acid levels in RBCs at 4 months; weight, length and head circumference at 2 and 4 months of age | |
| Notes | Study authors responded by providing additional information regarding study methods | |
| Risk of bias | ||
| Bias | Authors' judgement | Support for judgement |
| Random sequence generation (selection bias) | Low risk | Use of computer‐generated random allocation list |
| Allocation concealment (selection bias) | Low risk | Use of sealed opaque envelopes |
| Blinding (performance bias and detection bias) | Low risk | Caregivers, parents and outcome assessors were blinded to the intervention group |
| Incomplete outcome data (attrition bias) | Low risk | Follow‐up > 80% |
| Selective reporting (reporting bias) | Low risk | All prespecified outcomes were reported |
| Other bias | Low risk | Appears to be free of other biases |
| Methods | Two‐centre RCTs conducted in Nottingham and Leicester, England | |
| Participants | N = 309. Inclusion criteria: term infants ≥ 37 weeks' gestation and appropriate for gestational age singletons. Exclusion criteria: presence of congenital anomalies | |
| Interventions | 'LCPUFA' group was given milk formula enriched with DHA (0.32%) and AA (0.30%). Control group was fed standard milk formula without DHA and AA added. Infants were assigned to study formula within first week of life. Study formula was continued for 6 months. Source of LCPUFA was egg yolk phospholipids | |
| Outcomes | Primary endpoint was development at 18 months assessed by Bayley Scales of Infant Development (MDI and PDI). Secondary endpoint was development at 9 months assessed by Knobloch, Passamanick and Sherrards tests. Growth and gastrointestinal tolerance were also assessed at 6, 9 and 18 months. Incidences of atopy, eczema, wheeze and infection were documented | |
| Notes | Infants who were breast‐fed for at least 6 weeks were a reference group (n = 138). Study authors published a correction to outcomes reported in 2002, stating that they inadvertently reversed the 2 diet codes. Hence the outcomes of standard formula were those of infants fed LCPUFA formula, and vice versa. We have entered the correct data into this review | |
| Risk of bias | ||
| Bias | Authors' judgement | Support for judgement |
| Random sequence generation (selection bias) | Low risk | A random permuted block design stratified by centre and by sex was used to generate the allocation schedule |
| Allocation concealment (selection bias) | Low risk | Use of sealed opaque envelopes |
| Blinding (performance bias and detection bias) | Low risk | Mothers and study personnel were unaware of the dietary allocation |
| Incomplete outcome data (attrition bias) | Low risk | Follow‐up rates of 81% |
| Selective reporting (reporting bias) | Low risk | All prespecified outcomes were reported |
| Other bias | Low risk | Appears to be free of other biases |
| Methods | Single‐centre RCT conducted in Adelaide Sample size calculation: yes | |
| Participants | N = 32. Inclusion criteria: healthy term appropriate for gestational age infants born at 37 to 42 weeks. Exclusion criteria: infants of mothers who had history of lipid metabolism disorders, diabetes, drug or alcohol abuse | |
| Interventions | 'LCPUFA' group was given milk formula enriched with DHA (0.35%). In addition, formula was enriched with EPA and GLA. Control group was fed standard milk formula without DHA and AA added. Assigned diets were fed from birth to 30 weeks of life. Source of LCPUFA was fish oil and evening primrose oil | |
| Outcomes | Plasma and red blood cell fatty acid levels at 6, 16 and 30 weeks; visual evoked potential acuity at 16 and 30 weeks; Bayley Scales of Infant Development at 1 year | |
| Notes | Breast‐fed reference group, n = 28 | |
| Risk of bias | ||
| Bias | Authors' judgement | Support for judgement |
| Random sequence generation (selection bias) | Low risk | Use of central computerised randomisation |
| Allocation concealment (selection bias) | Low risk | Adequate; use of sealed opaque envelopes |
| Blinding (performance bias and detection bias) | Low risk | Mothers were unaware of formula type |
| Incomplete outcome data (attrition bias) | High risk | 60% to 81% follow‐up for various primary outcomes |
| Selective reporting (reporting bias) | Low risk | All prespecified outcomes were reported |
| Other bias | Low risk | Appears to be free of other biases |
| Methods | Single‐centre RCT conducted in Adelaide | |
| Participants | N = 83. Inclusion criteria: healthy term infants. Exclusion criteria: small for gestational age, congenital disease, infants of insulin‐dependent diabetic mothers, history of drug or alcohol abuse in the mother | |
| Interventions | 'LCPUFA' group was given milk formula enriched with DHA (0.34%) and AA (0.34%). Another LCPUFA group received milk formula enriched with DHA alone (0.34%). Control group was fed standard milk formula without DHA and AA added. Infants were randomly assigned to study formula within 7 days of life. Assigned milk formula was sole source of nutrition for 4 months. Subsequently, study formula was the only source of milk until 1 year of age. Source of LCPUFA was egg yolk phospholipids (DHA + AA group) and tuna oil (DHA group) | |
| Outcomes | Plasma and RBC fatty acid levels at 6, 16 and 34 weeks and 1 year of age. Physical growth at 6, 16 and 34 weeks and at 1 and 2 years of age. VEP at 16 and 34 weeks. Bayley Scales of Infant Development at 1 and 2 years | |
| Notes | Breast‐fed reference group, n = 63 | |
| Risk of bias | ||
| Bias | Authors' judgement | Support for judgement |
| Random sequence generation (selection bias) | Low risk | Computer‐generated random numbers |
| Allocation concealment (selection bias) | Low risk | Adequate; use of sealed opaque envelopes |
| Blinding (performance bias and detection bias) | Low risk | Investigators and families were blinded to randomisation |
| Incomplete outcome data (attrition bias) | High risk | 60% to 85% for various outcomes |
| Selective reporting (reporting bias) | Low risk | All prespecified outcomes were reported |
| Other bias | Low risk | Appears to be free of other biases |
| Methods | Single‐centre RCT in Wales | |
| Participants | N = 109. Included: infants at full‐term gestation with birth weight 2.5 to 4.5 kg. Exclusion criteria: congenital anomalies, infants from multiple births | |
| Interventions | LCPUFA formula was enriched with DHA (0.2%) and AA (0.4%). Control formula was not enriched with DHA and AA. Study formula was started within 72 hours of birth and was given for first 12 weeks. Source of LCPUFA was single‐cell oils | |
| Outcomes | Physical growth at 6 weeks, 3 months, 6 months and 1 year; general health of infants | |
| Notes | Study authors replied with clarification regarding study methods. No breast‐fed control group | |
| Risk of bias | ||
| Bias | Authors' judgement | Support for judgement |
| Random sequence generation (selection bias) | Low risk | "block randomisation in double blind fashion" |
| Allocation concealment (selection bias) | Unclear risk | Details were not available |
| Blinding (performance bias and detection bias) | Low risk | Parents, caregivers and professionals were blinded to milk type |
| Incomplete outcome data (attrition bias) | Low risk | Follow‐up 78% |
| Selective reporting (reporting bias) | Low risk | All prespecified outcomes were reported |
| Other bias | Low risk | Appears to be free of other biases |
| Methods | Single‐centre RCT in Scotland | |
| Participants | N = 72. Included: term infants (37 to 42 weeks) with birth weight between 2.5 and 4 kg. Exclusion criteria: not mentioned | |
| Interventions | LCPUFA formula was enriched with DHA (0.15% to 0.25%) and AA (0.3% to 0.4%). Control formula did not contain DHA or AA. Study milk formula was given from birth until 4 months of age. Source of LCPUFA was egg lipids, milk fat and vegetable oils | |
| Outcomes | Infant cognition measured by a means‐end problem‐solving test at 10 months. Assessments of intelligence quotient (IQ), attention control (Day‐Night Test) and speed of processing on Matching Familiar Figures Test (MFFT) was done at 6 years for enrolled infants | |
| Notes | Results are given as medians and quartiles and therefore are provided in text, not in tables. No breast‐fed control group | |
| Risk of bias | ||
| Bias | Authors' judgement | Support for judgement |
| Random sequence generation (selection bias) | Low risk | Use of computer‐generated randomisation table. Randomisation was stratified to ensure sex matching |
| Allocation concealment (selection bias) | Low risk | Pharmacy coded formulae administered to babies |
| Blinding (performance bias and detection bias) | Low risk | Mothers and investigators were unaware of group assignments |
| Incomplete outcome data (attrition bias) | High risk | Completeness of follow‐up: 44 of 72 (61%) infants completed study outcome assessment |
| Selective reporting (reporting bias) | Low risk | All prespecified outcomes were reported |
| Other bias | Low risk | Appears to be free of other biases |
AA: arachidonic acid
AGA: appropriate for gestational age
BSID: Bayley Scales of Infant Development
BW: body weight
DHA: docosahexaenoic acid
EPA: eicosapentaenoic acid
GA: gestational age
GLA: gamma‐linolenic acid
HIV: human immunodeficiency virus
IUGR: intrauterine growth rate
LCPUFA: long chain polyunsaturated fatty acids
MDI: Mental Developmental Index
NICU: neonatal intensive care unit
PDI: Psychomotor Developmental Index
PMA: postmenstrual age
RBC: red blood cells
RCT: randomised controlled trial
VEP: visual evoke potentials
Characteristics of excluded studies [ordered by study ID]
Ir a:
| Study | Reason for exclusion |
| RCT. DHA/placebo supplementation was given to breast‐fed infants | |
| Late age (6 weeks) at which study formula was started | |
| Methods not clear. Outcomes of interest not available. Study authors expressed concern about methodological issues of their study | |
| Methods not clear. Time of start of study formula and duration of supplementation not clear | |
| Methods not clear. Outcomes of interest not available | |
| Study assessed effect of LCPUFA supplemented formula milk on laboratory markers of immune function | |
| Outcomes of interest were lab markers: phenotype and cytokine levels such as (interleukin [IL]‐2, IL‐4, IL‐6, IL‐10, IL‐12, interferon [IFN]‐gamma, tumour necrosis factor [TNF]‐alpha, TGF‐beta) after incubation with phytohemagglutinin (PHA), beta‐lactoglobulin or soy protein | |
| Single‐centre RCT. Intervention formula contained reduced protein and added alpha lactalbumin, in addition to LCPUFA | |
| Study milk formula was supplemented with probiotic (Bifidobacterium lactis) in addition to LCPUFA; control formula had neither | |
| Late age at which supplementation was commenced | |
| Multi‐centre, prospective, observational, open‐label study that evaluated respiratory outcomes with LCPUFA supplementation during first year | |
| Randomised, double‐blind, placebo‐controlled trial. Healthy term infants (breast/formula fed) were assigned to receive a DHA‐enriched FO supplement (containing at least 250 mg DHA/d and 60 mg EPA/d) or placebo (olive oil) from birth to 6 months. Study infants were not solely formula fed | |
| RCT comparing LCPUFA vs placebo in formula milk, but outcome of interest was number of antigen‐presenting B cells | |
| Multi‐centre RCT. Compared formula milk supplemented with 2 different sources of DHA (algal‐derived DHA single‐cell oil (DHASCO) vs marine algae‐derived single‐cell oil (DHASCO‐B) | |
| RCT that compared red cell membrane fatty acid levels of 24 infants who received standard term formula vs 25 control infants who received the same formula supplemented with higher DHA and AA content for at least 4 months before the age of 6 months. Clinical outcomes were not reported | |
| Milk formulae with different amounts of alpha linolenic acid were compared |
DHA: docosahexaenoic acid
DHASCO: algal‐derived DHA single‐cell oil
DHASCO‐B: marine algae‐derived DHA single‐cell oil
EPA: eicosapentaenoic acid
FO: fish oil
IFN: interferon
IL: interleukin
LCPUFA: long chain polyunsaturated fatty acids
PHA: phytohemagglutinin
RCT: randomised controlled trial
TNF: tumour necrosis factor
Data and analyses
| Outcome or subgroup title | No. of studies | No. of participants | Statistical method | Effect size |
| 1 VEP acuity at 4 m (logMAR, steady state) Show forest plot | 2 | Mean Difference (IV, Fixed, 95% CI) | Subtotals only | |
| Analysis 1.1  Comparison 1 LCPUFA supplemented vs control formula, Outcome 1 VEP acuity at 4 m (logMAR, steady state). | ||||
| 1.1 DHA and AA vs normal term formula | 1 | 30 | Mean Difference (IV, Fixed, 95% CI) | 0.01 [‐0.07, 0.09] |
| 1.2 DHA vs normal term formula | 2 | 60 | Mean Difference (IV, Fixed, 95% CI) | ‐0.03 [‐0.10, 0.03] |
| 2 Sweep VEP acuity at 4 m (logMAR) Show forest plot | 3 | Mean Difference (IV, Fixed, 95% CI) | Subtotals only | |
| Analysis 1.2  Comparison 1 LCPUFA supplemented vs control formula, Outcome 2 Sweep VEP acuity at 4 m (logMAR). | ||||
| 2.1 DHA and AA vs normal term formula | 3 | 266 | Mean Difference (IV, Fixed, 95% CI) | ‐0.08 [‐0.10, ‐0.05] |
| 2.2 DHA vs normal term formula | 1 | 41 | Mean Difference (IV, Fixed, 95% CI) | ‐0.08 [‐0.15, ‐0.01] |
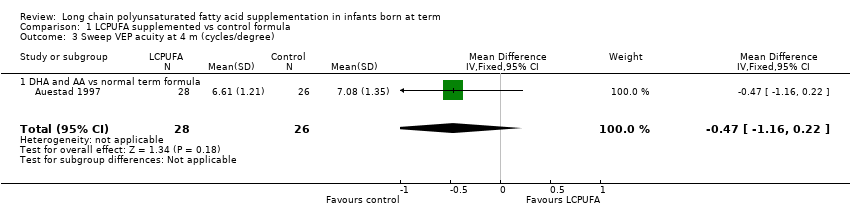
| 3 Sweep VEP acuity at 4 m (cycles/degree) Show forest plot | 1 | 54 | Mean Difference (IV, Fixed, 95% CI) | ‐0.47 [‐1.16, 0.22] |
| Analysis 1.3  Comparison 1 LCPUFA supplemented vs control formula, Outcome 3 Sweep VEP acuity at 4 m (cycles/degree). | ||||
| 3.1 DHA and AA vs normal term formula | 1 | 54 | Mean Difference (IV, Fixed, 95% CI) | ‐0.47 [‐1.16, 0.22] |
| 4 Visual acuity/Teller cards at 4 m (cycles/degree) Show forest plot | 3 | 264 | Mean Difference (IV, Fixed, 95% CI) | ‐0.11 [‐0.24, 0.02] |
| Analysis 1.4  Comparison 1 LCPUFA supplemented vs control formula, Outcome 4 Visual acuity/Teller cards at 4 m (cycles/degree). | ||||
| 4.1 DHA and AA vs normal term formula | 3 | 264 | Mean Difference (IV, Fixed, 95% CI) | ‐0.11 [‐0.24, 0.02] |
| 5 Sweep VEP acuity at 6 m (cycles/degree) Show forest plot | 1 | 53 | Mean Difference (IV, Fixed, 95% CI) | ‐0.31 [‐1.04, 0.42] |
| Analysis 1.5  Comparison 1 LCPUFA supplemented vs control formula, Outcome 5 Sweep VEP acuity at 6 m (cycles/degree). | ||||
| 5.1 DHA and AA vs normal term formula | 1 | 53 | Mean Difference (IV, Fixed, 95% CI) | ‐0.31 [‐1.04, 0.42] |
| 6 Visual acuity/Teller cards at 6 m (cycles/degree) Show forest plot | 3 | Mean Difference (IV, Fixed, 95% CI) | Subtotals only | |
| Analysis 1.6  Comparison 1 LCPUFA supplemented vs control formula, Outcome 6 Visual acuity/Teller cards at 6 m (cycles/degree). | ||||
| 6.1 DHA and AA vs normal term formula | 3 | 256 | Mean Difference (IV, Fixed, 95% CI) | 0.02 [‐0.11, 0.15] |
| 7 VEP acuity at 7‐8 m (logMAR, steady state) Show forest plot | 2 | Mean Difference (IV, Fixed, 95% CI) | Subtotals only | |
| Analysis 1.7  Comparison 1 LCPUFA supplemented vs control formula, Outcome 7 VEP acuity at 7‐8 m (logMAR, steady state). | ||||
| 7.1 DHA and AA vs normal term formula | 1 | 30 | Mean Difference (IV, Fixed, 95% CI) | 0.0 [‐0.13, 0.13] |
| 7.2 DHA vs normal term formula | 2 | 52 | Mean Difference (IV, Fixed, 95% CI) | ‐0.02 [‐0.14, 0.10] |
| 8 Sweep VEP acuity at 12 months (logMAR) Show forest plot | 3 | Mean Difference (IV, Fixed, 95% CI) | Subtotals only | |
| Analysis 1.8  Comparison 1 LCPUFA supplemented vs control formula, Outcome 8 Sweep VEP acuity at 12 months (logMAR). | ||||
| 8.1 DHA and AA vs normal term formula | 3 | 244 | Mean Difference (IV, Fixed, 95% CI) | ‐0.15 [‐0.17, ‐0.13] |
| 8.2 DHA vs normal term formula | 1 | 40 | Mean Difference (IV, Fixed, 95% CI) | ‐0.14 [‐0.21, ‐0.07] |
| 9 Sweep VEP acuity at 12 m (cycles/degree) Show forest plot | 1 | 53 | Mean Difference (IV, Fixed, 95% CI) | 0.0 [‐0.71, 0.71] |
| Analysis 1.9  Comparison 1 LCPUFA supplemented vs control formula, Outcome 9 Sweep VEP acuity at 12 m (cycles/degree). | ||||
| 9.1 DHA and AA vs normal term formula | 1 | 53 | Mean Difference (IV, Fixed, 95% CI) | 0.0 [‐0.71, 0.71] |
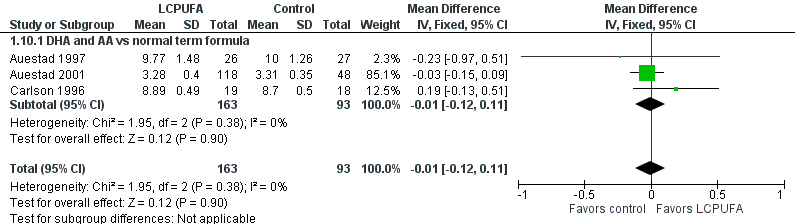
| 10 Visual acuity/Teller cards at 12 m (cycles/degree) Show forest plot | 3 | 256 | Mean Difference (IV, Fixed, 95% CI) | ‐0.01 [‐0.12, 0.11] |
| Analysis 1.10 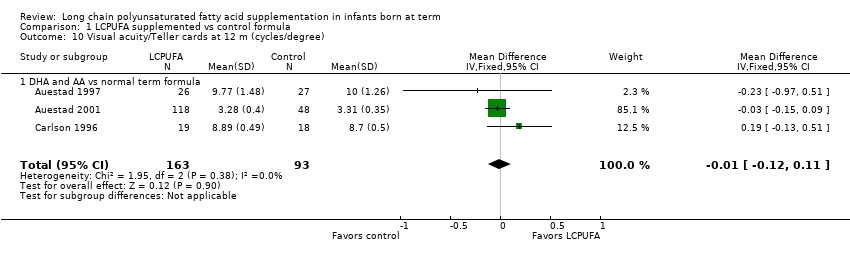 Comparison 1 LCPUFA supplemented vs control formula, Outcome 10 Visual acuity/Teller cards at 12 m (cycles/degree). | ||||
| 10.1 DHA and AA vs normal term formula | 3 | 256 | Mean Difference (IV, Fixed, 95% CI) | ‐0.01 [‐0.12, 0.11] |
| 11 Visual acuity at 3 years (Teller acuity cards; cycles/degree) Show forest plot | 1 | Mean Difference (IV, Fixed, 95% CI) | Subtotals only | |
| Analysis 1.11  Comparison 1 LCPUFA supplemented vs control formula, Outcome 11 Visual acuity at 3 years (Teller acuity cards; cycles/degree). | ||||
| 11.1 DHA and AA vs normal term formula | 1 | 68 | Mean Difference (IV, Fixed, 95% CI) | ‐2.10 [‐2.41, ‐1.79] |
| 11.2 DHA vs normal term formula | 1 | 68 | Mean Difference (IV, Fixed, 95% CI) | ‐2.80 [‐3.11, ‐2.49] |
| 12 MDI (Bayley) score at 3 m Show forest plot | 1 | 58 | Mean Difference (IV, Fixed, 95% CI) | 2.48 [‐1.90, 6.86] |
| Analysis 1.12  Comparison 1 LCPUFA supplemented vs control formula, Outcome 12 MDI (Bayley) score at 3 m. | ||||
| 12.1 DHA and AA vs normal term formula | 1 | 58 | Mean Difference (IV, Fixed, 95% CI) | 2.48 [‐1.90, 6.86] |
| 13 PDI (Bayley) score at 3 m Show forest plot | 1 | 58 | Mean Difference (IV, Fixed, 95% CI) | 3.66 [0.43, 6.89] |
| Analysis 1.13  Comparison 1 LCPUFA supplemented vs control formula, Outcome 13 PDI (Bayley) score at 3 m. | ||||
| 13.1 DHA and AA vs normal term formula | 1 | 58 | Mean Difference (IV, Fixed, 95% CI) | 3.66 [0.43, 6.89] |
| 14 MDI (Bayley) score at 6 m Show forest plot | 2 | 207 | Mean Difference (IV, Fixed, 95% CI) | ‐0.59 [‐2.26, 1.07] |
| Analysis 1.14  Comparison 1 LCPUFA supplemented vs control formula, Outcome 14 MDI (Bayley) score at 6 m. | ||||
| 14.1 DHA and AA vs normal term formula | 2 | 207 | Mean Difference (IV, Fixed, 95% CI) | ‐0.59 [‐2.26, 1.07] |
| 15 PDI (Bayley) score at 6 m Show forest plot | 2 | 206 | Mean Difference (IV, Fixed, 95% CI) | 0.23 [‐2.47, 2.94] |
| Analysis 1.15  Comparison 1 LCPUFA supplemented vs control formula, Outcome 15 PDI (Bayley) score at 6 m. | ||||
| 15.1 DHA and AA vs normal term formula | 2 | 206 | Mean Difference (IV, Fixed, 95% CI) | 0.23 [‐2.47, 2.94] |
| 16 MDI (Bayley score) at 1 year Show forest plot | 4 | Mean Difference (IV, Fixed, 95% CI) | Subtotals only | |
| Analysis 1.16  Comparison 1 LCPUFA supplemented vs control formula, Outcome 16 MDI (Bayley score) at 1 year. | ||||
| 16.1 DHA and AA vs normal term formula | 3 | 298 | Mean Difference (IV, Fixed, 95% CI) | ‐0.95 [‐3.38, 1.49] |
| 16.2 DHA vs normal term formula | 3 | 160 | Mean Difference (IV, Fixed, 95% CI) | ‐0.27 [‐4.36, 3.83] |
| 17 PDI (Bayley score) at 1 year Show forest plot | 4 | Mean Difference (IV, Fixed, 95% CI) | Subtotals only | |
| Analysis 1.17 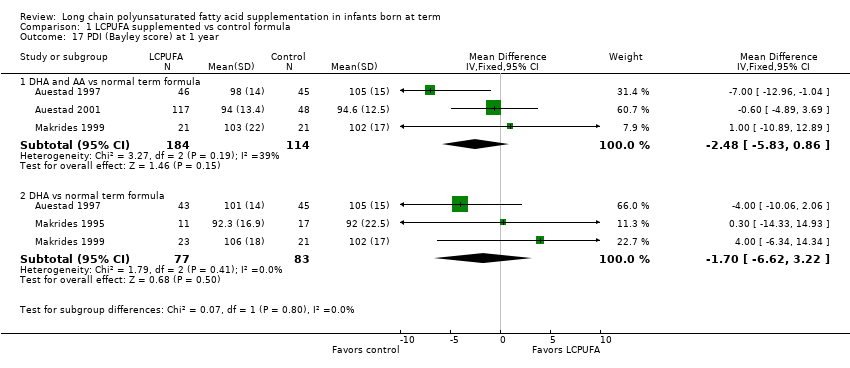 Comparison 1 LCPUFA supplemented vs control formula, Outcome 17 PDI (Bayley score) at 1 year. | ||||
| 17.1 DHA and AA vs normal term formula | 3 | 298 | Mean Difference (IV, Fixed, 95% CI) | ‐2.48 [‐5.83, 0.86] |
| 17.2 DHA vs normal term formula | 3 | 160 | Mean Difference (IV, Fixed, 95% CI) | ‐1.70 [‐6.62, 3.22] |
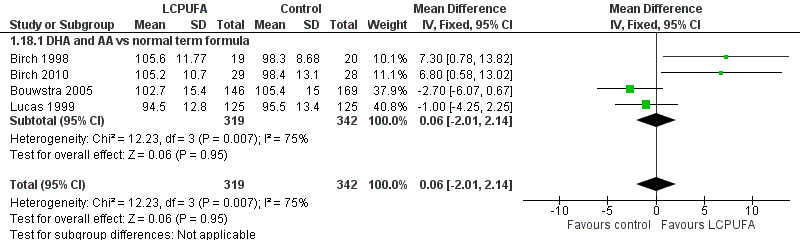
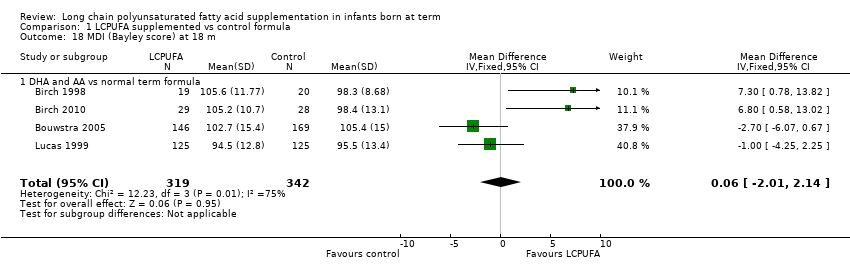
| 18 MDI (Bayley score) at 18 m Show forest plot | 4 | 661 | Mean Difference (IV, Fixed, 95% CI) | 0.06 [‐2.01, 2.14] |
| Analysis 1.18  Comparison 1 LCPUFA supplemented vs control formula, Outcome 18 MDI (Bayley score) at 18 m. | ||||
| 18.1 DHA and AA vs normal term formula | 4 | 661 | Mean Difference (IV, Fixed, 95% CI) | 0.06 [‐2.01, 2.14] |
| 19 PDI (Bayley score) at 18 m Show forest plot | 4 | 661 | Mean Difference (IV, Fixed, 95% CI) | 0.69 [‐0.78, 2.16] |
| Analysis 1.19  Comparison 1 LCPUFA supplemented vs control formula, Outcome 19 PDI (Bayley score) at 18 m. | ||||
| 19.1 DHA and AA vs normal term formula | 4 | 661 | Mean Difference (IV, Fixed, 95% CI) | 0.69 [‐0.78, 2.16] |
| 20 MDI (Bayley score) at 2 years Show forest plot | 1 | 79 | Mean Difference (IV, Fixed, 95% CI) | 1.85 [‐5.26, 8.96] |
| Analysis 1.20  Comparison 1 LCPUFA supplemented vs control formula, Outcome 20 MDI (Bayley score) at 2 years. | ||||
| 20.1 DHA and AA vs normal term formula | 1 | 38 | Mean Difference (IV, Fixed, 95% CI) | ‐2.0 [‐13.88, 9.88] |
| 20.2 DHA vs normal term formula | 1 | 41 | Mean Difference (IV, Fixed, 95% CI) | 4.0 [‐4.88, 12.88] |
| 21 PDI (Bayley score) at 2 years Show forest plot | 1 | Mean Difference (IV, Fixed, 95% CI) | Subtotals only | |
| Analysis 1.21  Comparison 1 LCPUFA supplemented vs control formula, Outcome 21 PDI (Bayley score) at 2 years. | ||||
| 21.1 DHA and AA vs normal term formula | 1 | 37 | Mean Difference (IV, Fixed, 95% CI) | ‐1.0 [‐12.71, 10.71] |
| 21.2 DHA vs normal term formula | 1 | 37 | Mean Difference (IV, Fixed, 95% CI) | 7.00 [‐3.32, 17.32] |
| 22 Weight at 4 months Show forest plot | 2 | Mean Difference (IV, Fixed, 95% CI) | Subtotals only | |
| Analysis 1.22  Comparison 1 LCPUFA supplemented vs control formula, Outcome 22 Weight at 4 months. | ||||
| 22.1 DHA and AA vs normal term formula | 1 | 46 | Mean Difference (IV, Fixed, 95% CI) | 0.15 [‐0.22, 0.52] |
| 22.2 DHA vs normal term formula | 2 | 71 | Mean Difference (IV, Fixed, 95% CI) | ‐0.03 [‐0.33, 0.27] |
| 23 Length at 4 months Show forest plot | 2 | Mean Difference (IV, Fixed, 95% CI) | Subtotals only | |
| Analysis 1.23  Comparison 1 LCPUFA supplemented vs control formula, Outcome 23 Length at 4 months. | ||||
| 23.1 DHA and AA vs normal term formula | 1 | 46 | Mean Difference (IV, Fixed, 95% CI) | 0.0 [‐1.45, 1.45] |
| 23.2 DHA vs normal term formula | 2 | 71 | Mean Difference (IV, Fixed, 95% CI) | 0.03 [1.00, 1.06] |
| 24 Head circumference at 4 months Show forest plot | 2 | Mean Difference (IV, Fixed, 95% CI) | Subtotals only | |
| Analysis 1.24  Comparison 1 LCPUFA supplemented vs control formula, Outcome 24 Head circumference at 4 months. | ||||
| 24.1 DHA and AA vs normal term formula | 1 | 46 | Mean Difference (IV, Fixed, 95% CI) | 0.5 [‐0.26, 1.26] |
| 24.2 DHA vs normal term formula | 2 | 71 | Mean Difference (IV, Fixed, 95% CI) | ‐0.01 [‐0.53, 0.51] |
| 25 Weight at 6 m (kg) Show forest plot | 4 | 830 | Mean Difference (IV, Fixed, 95% CI) | 0.01 [‐0.11, 0.13] |
| Analysis 1.25  Comparison 1 LCPUFA supplemented vs control formula, Outcome 25 Weight at 6 m (kg). | ||||
| 26 Length at 6 m (cm) Show forest plot | 4 | 830 | Mean Difference (IV, Fixed, 95% CI) | ‐0.13 [‐0.47, 0.21] |
| Analysis 1.26  Comparison 1 LCPUFA supplemented vs control formula, Outcome 26 Length at 6 m (cm). | ||||
| 27 Head circumference at 6 m (cm) Show forest plot | 4 | 830 | Mean Difference (IV, Fixed, 95% CI) | ‐0.06 [‐0.25, 0.13] |
| Analysis 1.27  Comparison 1 LCPUFA supplemented vs control formula, Outcome 27 Head circumference at 6 m (cm). | ||||
| 28 Weight at 12 m (kg) Show forest plot | 6 | Mean Difference (IV, Fixed, 95% CI) | Subtotals only | |
| Analysis 1.28  Comparison 1 LCPUFA supplemented vs control formula, Outcome 28 Weight at 12 m (kg). | ||||
| 28.1 DHA and AA vs normal term formula | 5 | 689 | Mean Difference (IV, Fixed, 95% CI) | ‐0.11 [‐0.28, 0.05] |
| 28.2 DHA vs normal term formula | 2 | 75 | Mean Difference (IV, Fixed, 95% CI) | ‐0.43 [‐0.96, 0.09] |
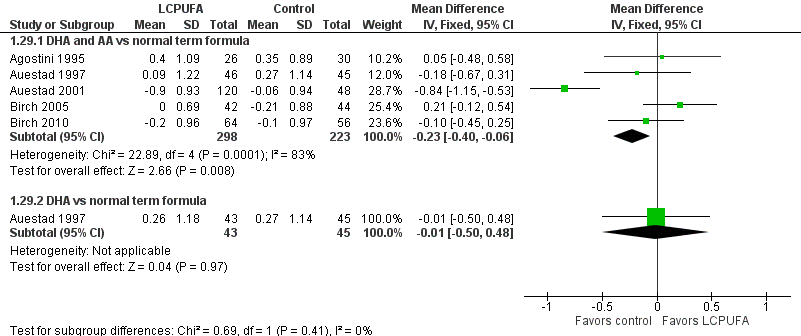
| 29 Weight at 12 m, z score Show forest plot | 5 | Mean Difference (IV, Fixed, 95% CI) | Subtotals only | |
| Analysis 1.29  Comparison 1 LCPUFA supplemented vs control formula, Outcome 29 Weight at 12 m, z score. | ||||
| 29.1 DHA and AA vs normal term formula | 5 | 521 | Mean Difference (IV, Fixed, 95% CI) | ‐0.23 [‐0.40, ‐0.06] |
| 29.2 DHA vs normal term formula | 1 | 88 | Mean Difference (IV, Fixed, 95% CI) | ‐0.01 [‐0.50, 0.48] |
| 30 Length at 12 m (cm) Show forest plot | 6 | Mean Difference (IV, Fixed, 95% CI) | Subtotals only | |
| Analysis 1.30  Comparison 1 LCPUFA supplemented vs control formula, Outcome 30 Length at 12 m (cm). | ||||
| 30.1 DHA and AA vs normal term formula | 5 | 689 | Mean Difference (IV, Fixed, 95% CI) | ‐0.15 [‐0.57, 0.28] |
| 30.2 DHA vs normal term formula | 2 | 75 | Mean Difference (IV, Fixed, 95% CI) | ‐0.95 [‐2.05, 0.15] |
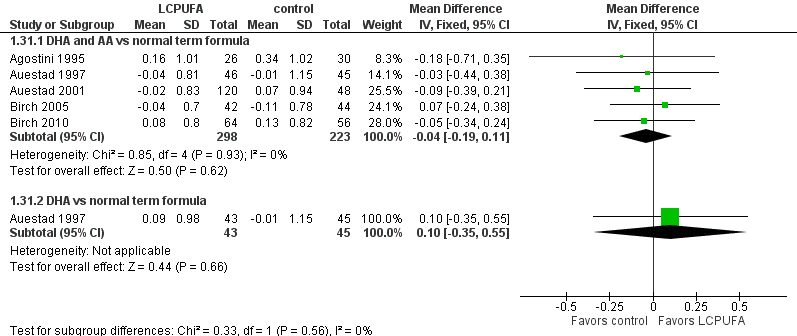
| 31 Length at 12 m, z score Show forest plot | 5 | Mean Difference (IV, Fixed, 95% CI) | Subtotals only | |
| Analysis 1.31  Comparison 1 LCPUFA supplemented vs control formula, Outcome 31 Length at 12 m, z score. | ||||
| 31.1 DHA and AA vs normal term formula | 5 | 521 | Mean Difference (IV, Fixed, 95% CI) | ‐0.04 [‐0.19, 0.11] |
| 31.2 DHA vs normal term formula | 1 | 88 | Mean Difference (IV, Fixed, 95% CI) | 0.10 [‐0.35, 0.55] |
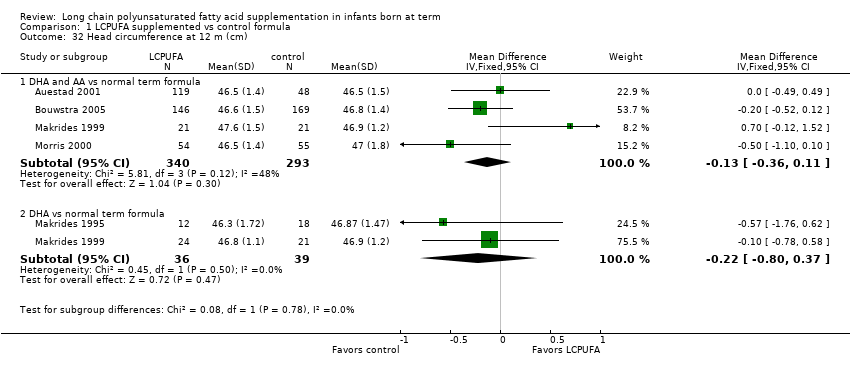
| 32 Head circumference at 12 m (cm) Show forest plot | 5 | Mean Difference (IV, Fixed, 95% CI) | Subtotals only | |
| Analysis 1.32  Comparison 1 LCPUFA supplemented vs control formula, Outcome 32 Head circumference at 12 m (cm). | ||||
| 32.1 DHA and AA vs normal term formula | 4 | 633 | Mean Difference (IV, Fixed, 95% CI) | ‐0.13 [‐0.36, 0.11] |
| 32.2 DHA vs normal term formula | 2 | 75 | Mean Difference (IV, Fixed, 95% CI) | ‐0.22 [‐0.80, 0.37] |
| 33 Head circumference at 12 m, z score Show forest plot | 4 | Mean Difference (IV, Fixed, 95% CI) | Subtotals only | |
| Analysis 1.33  Comparison 1 LCPUFA supplemented vs control formula, Outcome 33 Head circumference at 12 m, z score. | ||||
| 33.1 DHA and AA vs normal term formula | 4 | 464 | Mean Difference (IV, Fixed, 95% CI) | ‐0.13 [‐0.32, 0.05] |
| 33.2 DHA vs normal term formula | 1 | 88 | Mean Difference (IV, Fixed, 95% CI) | 0.07 [‐0.33, 0.47] |
| 34 Weight at 18 m (kg) Show forest plot | 2 | 563 | Mean Difference (IV, Fixed, 95% CI) | ‐0.04 [‐0.25, 0.17] |
| Analysis 1.34  Comparison 1 LCPUFA supplemented vs control formula, Outcome 34 Weight at 18 m (kg). | ||||
| 34.1 DHA and AA vs normal term formula | 2 | 563 | Mean Difference (IV, Fixed, 95% CI) | ‐0.04 [‐0.25, 0.17] |
| 35 Length at 18 m (cm) Show forest plot | 2 | 565 | Mean Difference (IV, Fixed, 95% CI) | ‐0.19 [‐0.71, 0.34] |
| Analysis 1.35  Comparison 1 LCPUFA supplemented vs control formula, Outcome 35 Length at 18 m (cm). | ||||
| 35.1 DHA and AA vs normal term formula | 2 | 565 | Mean Difference (IV, Fixed, 95% CI) | ‐0.19 [‐0.71, 0.34] |
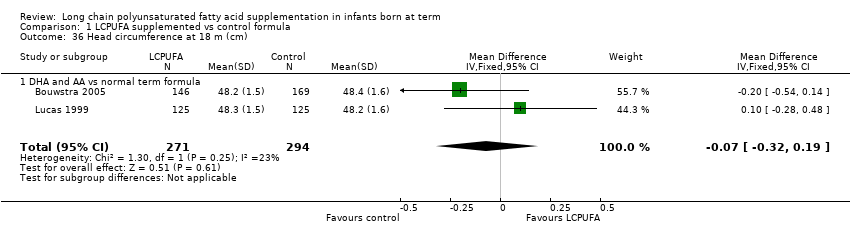
| 36 Head circumference at 18 m (cm) Show forest plot | 2 | 565 | Mean Difference (IV, Fixed, 95% CI) | ‐0.07 [‐0.32, 0.19] |
| Analysis 1.36  Comparison 1 LCPUFA supplemented vs control formula, Outcome 36 Head circumference at 18 m (cm). | ||||
| 36.1 DHA and AA vs normal term formula | 2 | 565 | Mean Difference (IV, Fixed, 95% CI) | ‐0.07 [‐0.32, 0.19] |
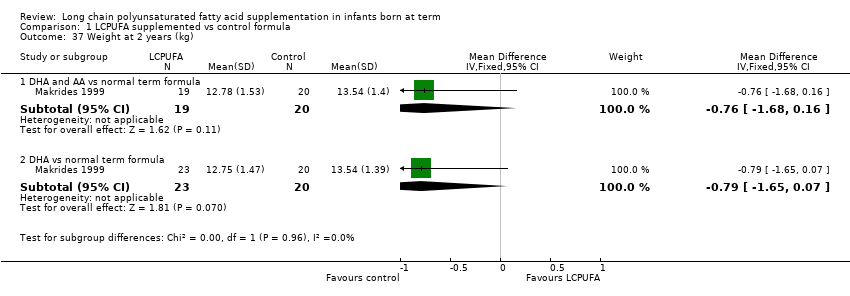
| 37 Weight at 2 years (kg) Show forest plot | 1 | Mean Difference (IV, Fixed, 95% CI) | Subtotals only | |
| Analysis 1.37  Comparison 1 LCPUFA supplemented vs control formula, Outcome 37 Weight at 2 years (kg). | ||||
| 37.1 DHA and AA vs normal term formula | 1 | 39 | Mean Difference (IV, Fixed, 95% CI) | ‐0.76 [‐1.68, 0.16] |
| 37.2 DHA vs normal term formula | 1 | 43 | Mean Difference (IV, Fixed, 95% CI) | ‐0.79 [‐1.65, 0.07] |
| 38 Height at 2 years (cm) Show forest plot | 1 | Mean Difference (IV, Fixed, 95% CI) | Subtotals only | |
| Analysis 1.38 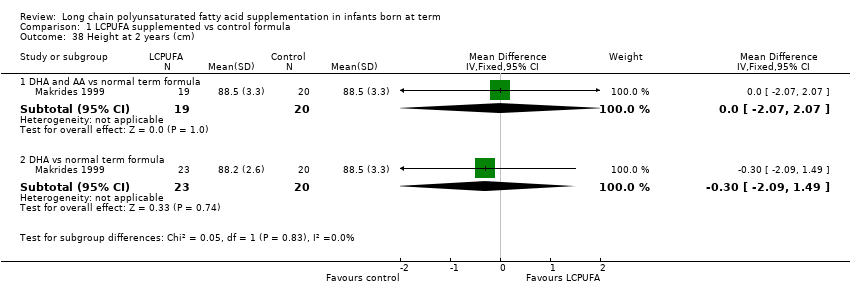 Comparison 1 LCPUFA supplemented vs control formula, Outcome 38 Height at 2 years (cm). | ||||
| 38.1 DHA and AA vs normal term formula | 1 | 39 | Mean Difference (IV, Fixed, 95% CI) | 0.0 [‐2.07, 2.07] |
| 38.2 DHA vs normal term formula | 1 | 43 | Mean Difference (IV, Fixed, 95% CI) | ‐0.30 [‐2.09, 1.49] |
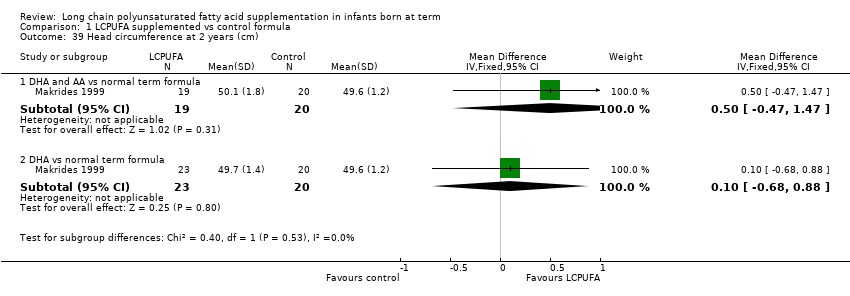
| 39 Head circumference at 2 years (cm) Show forest plot | 1 | Mean Difference (IV, Fixed, 95% CI) | Subtotals only | |
| Analysis 1.39  Comparison 1 LCPUFA supplemented vs control formula, Outcome 39 Head circumference at 2 years (cm). | ||||
| 39.1 DHA and AA vs normal term formula | 1 | 39 | Mean Difference (IV, Fixed, 95% CI) | 0.5 [‐0.47, 1.47] |
| 39.2 DHA vs normal term formula | 1 | 43 | Mean Difference (IV, Fixed, 95% CI) | 0.10 [‐0.68, 0.88] |

Study flow diagram.

Risk of bias summary: review authors' judgements about each risk of bias item for each included study.
Forest plot of comparison: 1 LCPUFA supplemented vs control formula, outcome: 1.10 Visual acuity/Teller cards at 12 m (cycles/degree).
Forest plot of comparison: 1 LCPUFA supplemented vs control formula, outcome: 1.18 MDI (Bayley Scale score) at 18 m.

Forest plot of comparison: 1 LCPUFA supplemented vs control formula, outcome: 1.19 PDI (Bayley Scale score) at 18 m.
Forest plot of comparison: 1 LCPUFA supplemented vs control formula, outcome: 1.29 Weight at 12 m, z score.
Forest plot of comparison: 1 LCPUFA supplemented vs control formula, outcome: 1.31 Length at 12 m, z score.

Forest plot of comparison: 1 LCPUFA supplemented vs control formula, outcome: 1.33 Head circumference at 12 m, z score.

Comparison 1 LCPUFA supplemented vs control formula, Outcome 1 VEP acuity at 4 m (logMAR, steady state).

Comparison 1 LCPUFA supplemented vs control formula, Outcome 2 Sweep VEP acuity at 4 m (logMAR).
Comparison 1 LCPUFA supplemented vs control formula, Outcome 3 Sweep VEP acuity at 4 m (cycles/degree).

Comparison 1 LCPUFA supplemented vs control formula, Outcome 4 Visual acuity/Teller cards at 4 m (cycles/degree).

Comparison 1 LCPUFA supplemented vs control formula, Outcome 5 Sweep VEP acuity at 6 m (cycles/degree).
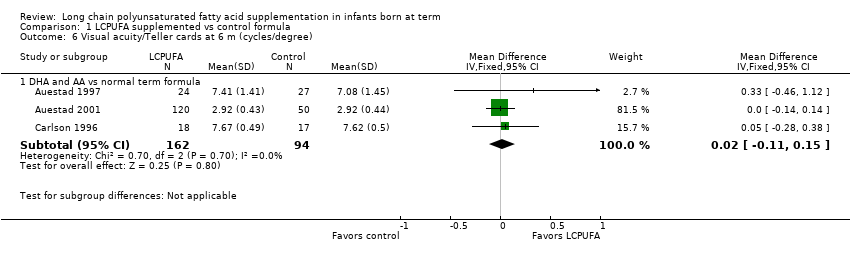
Comparison 1 LCPUFA supplemented vs control formula, Outcome 6 Visual acuity/Teller cards at 6 m (cycles/degree).

Comparison 1 LCPUFA supplemented vs control formula, Outcome 7 VEP acuity at 7‐8 m (logMAR, steady state).
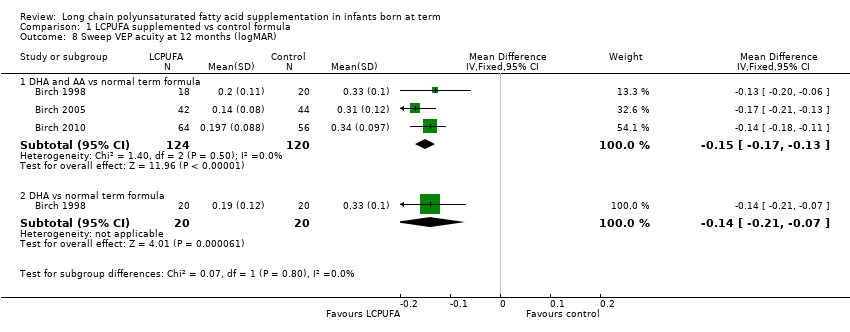
Comparison 1 LCPUFA supplemented vs control formula, Outcome 8 Sweep VEP acuity at 12 months (logMAR).

Comparison 1 LCPUFA supplemented vs control formula, Outcome 9 Sweep VEP acuity at 12 m (cycles/degree).

Comparison 1 LCPUFA supplemented vs control formula, Outcome 10 Visual acuity/Teller cards at 12 m (cycles/degree).
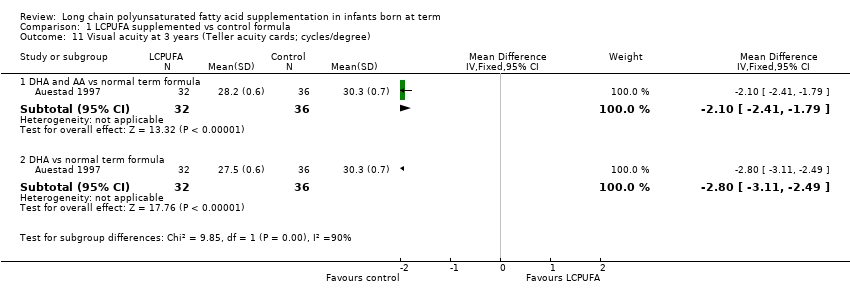
Comparison 1 LCPUFA supplemented vs control formula, Outcome 11 Visual acuity at 3 years (Teller acuity cards; cycles/degree).
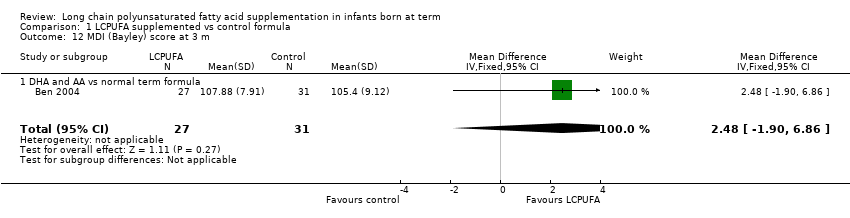
Comparison 1 LCPUFA supplemented vs control formula, Outcome 12 MDI (Bayley) score at 3 m.

Comparison 1 LCPUFA supplemented vs control formula, Outcome 13 PDI (Bayley) score at 3 m.

Comparison 1 LCPUFA supplemented vs control formula, Outcome 14 MDI (Bayley) score at 6 m.

Comparison 1 LCPUFA supplemented vs control formula, Outcome 15 PDI (Bayley) score at 6 m.

Comparison 1 LCPUFA supplemented vs control formula, Outcome 16 MDI (Bayley score) at 1 year.

Comparison 1 LCPUFA supplemented vs control formula, Outcome 17 PDI (Bayley score) at 1 year.
Comparison 1 LCPUFA supplemented vs control formula, Outcome 18 MDI (Bayley score) at 18 m.

Comparison 1 LCPUFA supplemented vs control formula, Outcome 19 PDI (Bayley score) at 18 m.
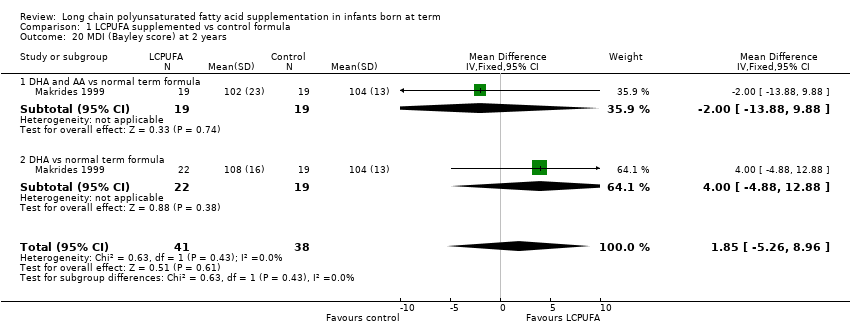
Comparison 1 LCPUFA supplemented vs control formula, Outcome 20 MDI (Bayley score) at 2 years.

Comparison 1 LCPUFA supplemented vs control formula, Outcome 21 PDI (Bayley score) at 2 years.
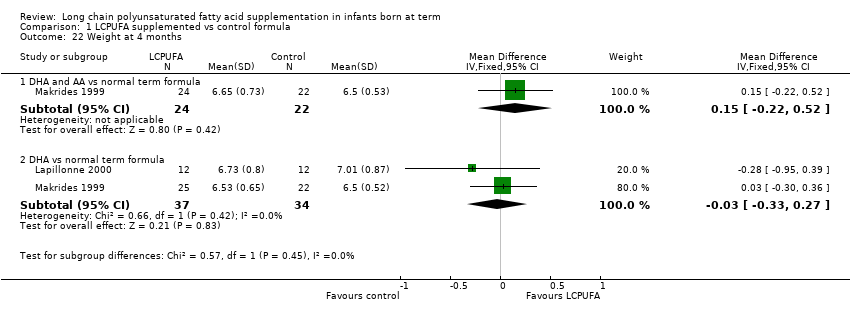
Comparison 1 LCPUFA supplemented vs control formula, Outcome 22 Weight at 4 months.

Comparison 1 LCPUFA supplemented vs control formula, Outcome 23 Length at 4 months.
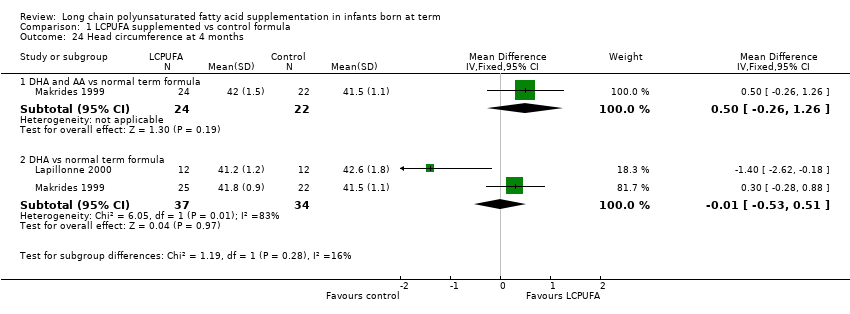
Comparison 1 LCPUFA supplemented vs control formula, Outcome 24 Head circumference at 4 months.
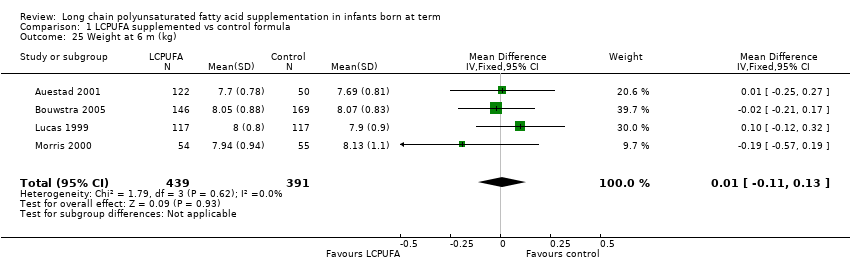
Comparison 1 LCPUFA supplemented vs control formula, Outcome 25 Weight at 6 m (kg).

Comparison 1 LCPUFA supplemented vs control formula, Outcome 26 Length at 6 m (cm).

Comparison 1 LCPUFA supplemented vs control formula, Outcome 27 Head circumference at 6 m (cm).
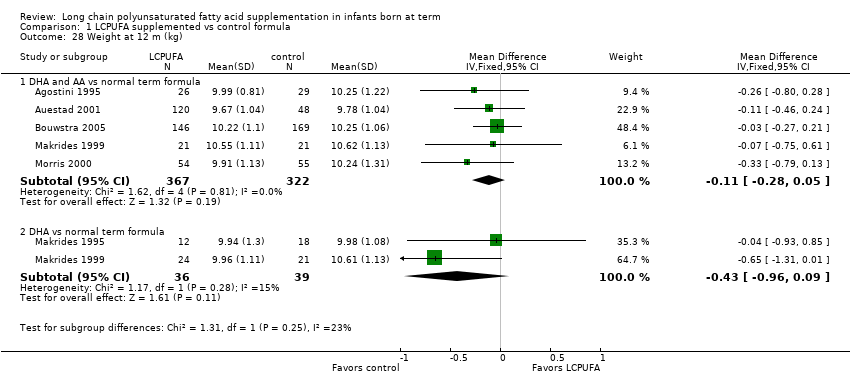
Comparison 1 LCPUFA supplemented vs control formula, Outcome 28 Weight at 12 m (kg).
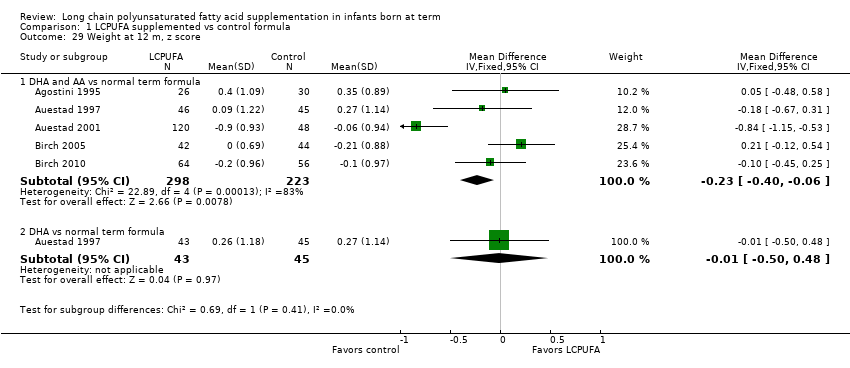
Comparison 1 LCPUFA supplemented vs control formula, Outcome 29 Weight at 12 m, z score.
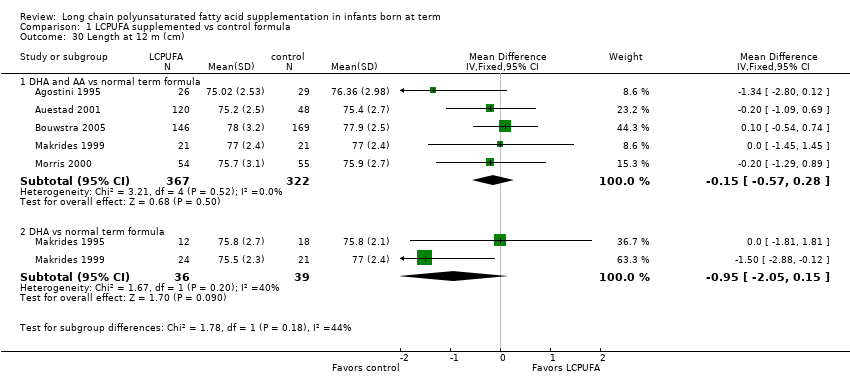
Comparison 1 LCPUFA supplemented vs control formula, Outcome 30 Length at 12 m (cm).

Comparison 1 LCPUFA supplemented vs control formula, Outcome 31 Length at 12 m, z score.
Comparison 1 LCPUFA supplemented vs control formula, Outcome 32 Head circumference at 12 m (cm).

Comparison 1 LCPUFA supplemented vs control formula, Outcome 33 Head circumference at 12 m, z score.

Comparison 1 LCPUFA supplemented vs control formula, Outcome 34 Weight at 18 m (kg).

Comparison 1 LCPUFA supplemented vs control formula, Outcome 35 Length at 18 m (cm).
Comparison 1 LCPUFA supplemented vs control formula, Outcome 36 Head circumference at 18 m (cm).
Comparison 1 LCPUFA supplemented vs control formula, Outcome 37 Weight at 2 years (kg).

Comparison 1 LCPUFA supplemented vs control formula, Outcome 38 Height at 2 years (cm).
Comparison 1 LCPUFA supplemented vs control formula, Outcome 39 Head circumference at 2 years (cm).
| LCPUFA supplemented formula compared with control formula for term infants for clinical outcomes (visual function, neurodevelopment and physical growth) | ||||||
| Patient or population: term infants | ||||||
| Outcomes | Illustrative comparative risks* (95% CI) | Relative effect | Number of participants | Quality of the evidence | Comments | |
| Assumed risk | Corresponding risk | |||||
| Control formula | LCPUFA supplemented formula | |||||
| Visual acuity/Teller cards at 12 months (cycles/degree) ‐ DHA and AA vs normal term formula | Mean visual acuity (cycles/degree) ranged across control groups from 3.31 to 10 | Mean visual acuity (cycles/degree) ranged across intervention groups from 3.28 to 9.77 | MD ‐0.01 (95% CI ‐0.12 to 0.11) | 256 | ⊕⊕⊝⊝ | Downgraded 2 levels |
| Sweep VEP acuity at 12 months (LogMAR) ‐ DHA and AA vs normal term formula | Mean sweep VEP acuity (LogMAR) ranged across control groups from 0.31 to 0.339 | Mean sweep VEP acuity (LogMAR) ranged across intervention groups from 0.14 to 0.2 | MD ‐0.15 (95% CI ‐0.17 to ‐0.13) | 244 | ⊕⊕⊝⊝ | Downgraded 2 levels |
| MDI scores (Bayley) at 18 months ‐ DHA and AA vs normal term formula | Mean MDI ranged across control groups from 98.3 to 105.4 | Mean MDI ranged across intervention groups from 94.5 to 105.6 | MD 0.06 (95% CI ‐ 2.01 to 2.14) | 661 | ⊕⊕⊝⊝ | Downgraded 2 levels |
| PDI scores (Bayley) at 18 months ‐ DHA and AA vs normal term formula | Mean PDI ranged across control groups from 96.4 to 102 | Mean PDI ranged across intervention groups from 95.9 to 105.8 | MD 0.69 (95% CI ‐0.78 to 2.16) | 661 | ⊕⊕⊝⊝ | Downgraded 2 levels |
| Weight at 12 months (z scores) ‐ DHA and AA vs normal term formula | Mean z scores for weight ranged across control groups from ‐0.21 to 0.35 | Mean z scores for weight ranged across intervention groups from ‐0.9 to 0.4 | MD ‐0.23 (95% CI ‐0.40 to ‐0.06) | 521 | ⊕⊕⊝⊝ | Downgraded 2 levels |
| Length at 12 months (z scores) ‐ DHA and AA vs normal term formula | Mean z scores for length ranged across control groups from ‐0.11 to 0.34 | Mean z scores for length ranged across control groups from ‐0.04 to 0.16 | MD ‐0.04 (95% CI ‐0.19 to 0.11) | 521 | ⊕⊕⊝⊝ | Downgraded 2 levels |
| Head circumference at 12 months (z scores) ‐ DHA and AA vs normal term formula | Mean z scores for head circumference ranged across control groups from 0.18 to 0.94 | Mean z scores for head circumference ranged across control groups from 0.01 to 0.93 | MD ‐0.13 (95% CI ‐0.32 to 0.05) | 464 | ⊕⊕⊝⊝ | Downgraded 2 levels |
| *The basis for the assumed risk (e.g. median control group risk across studies) is provided in footnotes. The corresponding risk (and its 95% confidence interval) is based on assumed risk in the comparison group and the relative effect of the intervention (and its 95% CI) | ||||||
| GRADE Working Group grades of evidence | ||||||
| Outcome or subgroup title | No. of studies | No. of participants | Statistical method | Effect size |
| 1 VEP acuity at 4 m (logMAR, steady state) Show forest plot | 2 | Mean Difference (IV, Fixed, 95% CI) | Subtotals only | |
| 1.1 DHA and AA vs normal term formula | 1 | 30 | Mean Difference (IV, Fixed, 95% CI) | 0.01 [‐0.07, 0.09] |
| 1.2 DHA vs normal term formula | 2 | 60 | Mean Difference (IV, Fixed, 95% CI) | ‐0.03 [‐0.10, 0.03] |
| 2 Sweep VEP acuity at 4 m (logMAR) Show forest plot | 3 | Mean Difference (IV, Fixed, 95% CI) | Subtotals only | |
| 2.1 DHA and AA vs normal term formula | 3 | 266 | Mean Difference (IV, Fixed, 95% CI) | ‐0.08 [‐0.10, ‐0.05] |
| 2.2 DHA vs normal term formula | 1 | 41 | Mean Difference (IV, Fixed, 95% CI) | ‐0.08 [‐0.15, ‐0.01] |
| 3 Sweep VEP acuity at 4 m (cycles/degree) Show forest plot | 1 | 54 | Mean Difference (IV, Fixed, 95% CI) | ‐0.47 [‐1.16, 0.22] |
| 3.1 DHA and AA vs normal term formula | 1 | 54 | Mean Difference (IV, Fixed, 95% CI) | ‐0.47 [‐1.16, 0.22] |
| 4 Visual acuity/Teller cards at 4 m (cycles/degree) Show forest plot | 3 | 264 | Mean Difference (IV, Fixed, 95% CI) | ‐0.11 [‐0.24, 0.02] |
| 4.1 DHA and AA vs normal term formula | 3 | 264 | Mean Difference (IV, Fixed, 95% CI) | ‐0.11 [‐0.24, 0.02] |
| 5 Sweep VEP acuity at 6 m (cycles/degree) Show forest plot | 1 | 53 | Mean Difference (IV, Fixed, 95% CI) | ‐0.31 [‐1.04, 0.42] |
| 5.1 DHA and AA vs normal term formula | 1 | 53 | Mean Difference (IV, Fixed, 95% CI) | ‐0.31 [‐1.04, 0.42] |
| 6 Visual acuity/Teller cards at 6 m (cycles/degree) Show forest plot | 3 | Mean Difference (IV, Fixed, 95% CI) | Subtotals only | |
| 6.1 DHA and AA vs normal term formula | 3 | 256 | Mean Difference (IV, Fixed, 95% CI) | 0.02 [‐0.11, 0.15] |
| 7 VEP acuity at 7‐8 m (logMAR, steady state) Show forest plot | 2 | Mean Difference (IV, Fixed, 95% CI) | Subtotals only | |
| 7.1 DHA and AA vs normal term formula | 1 | 30 | Mean Difference (IV, Fixed, 95% CI) | 0.0 [‐0.13, 0.13] |
| 7.2 DHA vs normal term formula | 2 | 52 | Mean Difference (IV, Fixed, 95% CI) | ‐0.02 [‐0.14, 0.10] |
| 8 Sweep VEP acuity at 12 months (logMAR) Show forest plot | 3 | Mean Difference (IV, Fixed, 95% CI) | Subtotals only | |
| 8.1 DHA and AA vs normal term formula | 3 | 244 | Mean Difference (IV, Fixed, 95% CI) | ‐0.15 [‐0.17, ‐0.13] |
| 8.2 DHA vs normal term formula | 1 | 40 | Mean Difference (IV, Fixed, 95% CI) | ‐0.14 [‐0.21, ‐0.07] |
| 9 Sweep VEP acuity at 12 m (cycles/degree) Show forest plot | 1 | 53 | Mean Difference (IV, Fixed, 95% CI) | 0.0 [‐0.71, 0.71] |
| 9.1 DHA and AA vs normal term formula | 1 | 53 | Mean Difference (IV, Fixed, 95% CI) | 0.0 [‐0.71, 0.71] |
| 10 Visual acuity/Teller cards at 12 m (cycles/degree) Show forest plot | 3 | 256 | Mean Difference (IV, Fixed, 95% CI) | ‐0.01 [‐0.12, 0.11] |
| 10.1 DHA and AA vs normal term formula | 3 | 256 | Mean Difference (IV, Fixed, 95% CI) | ‐0.01 [‐0.12, 0.11] |
| 11 Visual acuity at 3 years (Teller acuity cards; cycles/degree) Show forest plot | 1 | Mean Difference (IV, Fixed, 95% CI) | Subtotals only | |
| 11.1 DHA and AA vs normal term formula | 1 | 68 | Mean Difference (IV, Fixed, 95% CI) | ‐2.10 [‐2.41, ‐1.79] |
| 11.2 DHA vs normal term formula | 1 | 68 | Mean Difference (IV, Fixed, 95% CI) | ‐2.80 [‐3.11, ‐2.49] |
| 12 MDI (Bayley) score at 3 m Show forest plot | 1 | 58 | Mean Difference (IV, Fixed, 95% CI) | 2.48 [‐1.90, 6.86] |
| 12.1 DHA and AA vs normal term formula | 1 | 58 | Mean Difference (IV, Fixed, 95% CI) | 2.48 [‐1.90, 6.86] |
| 13 PDI (Bayley) score at 3 m Show forest plot | 1 | 58 | Mean Difference (IV, Fixed, 95% CI) | 3.66 [0.43, 6.89] |
| 13.1 DHA and AA vs normal term formula | 1 | 58 | Mean Difference (IV, Fixed, 95% CI) | 3.66 [0.43, 6.89] |
| 14 MDI (Bayley) score at 6 m Show forest plot | 2 | 207 | Mean Difference (IV, Fixed, 95% CI) | ‐0.59 [‐2.26, 1.07] |
| 14.1 DHA and AA vs normal term formula | 2 | 207 | Mean Difference (IV, Fixed, 95% CI) | ‐0.59 [‐2.26, 1.07] |
| 15 PDI (Bayley) score at 6 m Show forest plot | 2 | 206 | Mean Difference (IV, Fixed, 95% CI) | 0.23 [‐2.47, 2.94] |
| 15.1 DHA and AA vs normal term formula | 2 | 206 | Mean Difference (IV, Fixed, 95% CI) | 0.23 [‐2.47, 2.94] |
| 16 MDI (Bayley score) at 1 year Show forest plot | 4 | Mean Difference (IV, Fixed, 95% CI) | Subtotals only | |
| 16.1 DHA and AA vs normal term formula | 3 | 298 | Mean Difference (IV, Fixed, 95% CI) | ‐0.95 [‐3.38, 1.49] |
| 16.2 DHA vs normal term formula | 3 | 160 | Mean Difference (IV, Fixed, 95% CI) | ‐0.27 [‐4.36, 3.83] |
| 17 PDI (Bayley score) at 1 year Show forest plot | 4 | Mean Difference (IV, Fixed, 95% CI) | Subtotals only | |
| 17.1 DHA and AA vs normal term formula | 3 | 298 | Mean Difference (IV, Fixed, 95% CI) | ‐2.48 [‐5.83, 0.86] |
| 17.2 DHA vs normal term formula | 3 | 160 | Mean Difference (IV, Fixed, 95% CI) | ‐1.70 [‐6.62, 3.22] |
| 18 MDI (Bayley score) at 18 m Show forest plot | 4 | 661 | Mean Difference (IV, Fixed, 95% CI) | 0.06 [‐2.01, 2.14] |
| 18.1 DHA and AA vs normal term formula | 4 | 661 | Mean Difference (IV, Fixed, 95% CI) | 0.06 [‐2.01, 2.14] |
| 19 PDI (Bayley score) at 18 m Show forest plot | 4 | 661 | Mean Difference (IV, Fixed, 95% CI) | 0.69 [‐0.78, 2.16] |
| 19.1 DHA and AA vs normal term formula | 4 | 661 | Mean Difference (IV, Fixed, 95% CI) | 0.69 [‐0.78, 2.16] |
| 20 MDI (Bayley score) at 2 years Show forest plot | 1 | 79 | Mean Difference (IV, Fixed, 95% CI) | 1.85 [‐5.26, 8.96] |
| 20.1 DHA and AA vs normal term formula | 1 | 38 | Mean Difference (IV, Fixed, 95% CI) | ‐2.0 [‐13.88, 9.88] |
| 20.2 DHA vs normal term formula | 1 | 41 | Mean Difference (IV, Fixed, 95% CI) | 4.0 [‐4.88, 12.88] |
| 21 PDI (Bayley score) at 2 years Show forest plot | 1 | Mean Difference (IV, Fixed, 95% CI) | Subtotals only | |
| 21.1 DHA and AA vs normal term formula | 1 | 37 | Mean Difference (IV, Fixed, 95% CI) | ‐1.0 [‐12.71, 10.71] |
| 21.2 DHA vs normal term formula | 1 | 37 | Mean Difference (IV, Fixed, 95% CI) | 7.00 [‐3.32, 17.32] |
| 22 Weight at 4 months Show forest plot | 2 | Mean Difference (IV, Fixed, 95% CI) | Subtotals only | |
| 22.1 DHA and AA vs normal term formula | 1 | 46 | Mean Difference (IV, Fixed, 95% CI) | 0.15 [‐0.22, 0.52] |
| 22.2 DHA vs normal term formula | 2 | 71 | Mean Difference (IV, Fixed, 95% CI) | ‐0.03 [‐0.33, 0.27] |
| 23 Length at 4 months Show forest plot | 2 | Mean Difference (IV, Fixed, 95% CI) | Subtotals only | |
| 23.1 DHA and AA vs normal term formula | 1 | 46 | Mean Difference (IV, Fixed, 95% CI) | 0.0 [‐1.45, 1.45] |
| 23.2 DHA vs normal term formula | 2 | 71 | Mean Difference (IV, Fixed, 95% CI) | 0.03 [1.00, 1.06] |
| 24 Head circumference at 4 months Show forest plot | 2 | Mean Difference (IV, Fixed, 95% CI) | Subtotals only | |
| 24.1 DHA and AA vs normal term formula | 1 | 46 | Mean Difference (IV, Fixed, 95% CI) | 0.5 [‐0.26, 1.26] |
| 24.2 DHA vs normal term formula | 2 | 71 | Mean Difference (IV, Fixed, 95% CI) | ‐0.01 [‐0.53, 0.51] |
| 25 Weight at 6 m (kg) Show forest plot | 4 | 830 | Mean Difference (IV, Fixed, 95% CI) | 0.01 [‐0.11, 0.13] |
| 26 Length at 6 m (cm) Show forest plot | 4 | 830 | Mean Difference (IV, Fixed, 95% CI) | ‐0.13 [‐0.47, 0.21] |
| 27 Head circumference at 6 m (cm) Show forest plot | 4 | 830 | Mean Difference (IV, Fixed, 95% CI) | ‐0.06 [‐0.25, 0.13] |
| 28 Weight at 12 m (kg) Show forest plot | 6 | Mean Difference (IV, Fixed, 95% CI) | Subtotals only | |
| 28.1 DHA and AA vs normal term formula | 5 | 689 | Mean Difference (IV, Fixed, 95% CI) | ‐0.11 [‐0.28, 0.05] |
| 28.2 DHA vs normal term formula | 2 | 75 | Mean Difference (IV, Fixed, 95% CI) | ‐0.43 [‐0.96, 0.09] |
| 29 Weight at 12 m, z score Show forest plot | 5 | Mean Difference (IV, Fixed, 95% CI) | Subtotals only | |
| 29.1 DHA and AA vs normal term formula | 5 | 521 | Mean Difference (IV, Fixed, 95% CI) | ‐0.23 [‐0.40, ‐0.06] |
| 29.2 DHA vs normal term formula | 1 | 88 | Mean Difference (IV, Fixed, 95% CI) | ‐0.01 [‐0.50, 0.48] |
| 30 Length at 12 m (cm) Show forest plot | 6 | Mean Difference (IV, Fixed, 95% CI) | Subtotals only | |
| 30.1 DHA and AA vs normal term formula | 5 | 689 | Mean Difference (IV, Fixed, 95% CI) | ‐0.15 [‐0.57, 0.28] |
| 30.2 DHA vs normal term formula | 2 | 75 | Mean Difference (IV, Fixed, 95% CI) | ‐0.95 [‐2.05, 0.15] |
| 31 Length at 12 m, z score Show forest plot | 5 | Mean Difference (IV, Fixed, 95% CI) | Subtotals only | |
| 31.1 DHA and AA vs normal term formula | 5 | 521 | Mean Difference (IV, Fixed, 95% CI) | ‐0.04 [‐0.19, 0.11] |
| 31.2 DHA vs normal term formula | 1 | 88 | Mean Difference (IV, Fixed, 95% CI) | 0.10 [‐0.35, 0.55] |
| 32 Head circumference at 12 m (cm) Show forest plot | 5 | Mean Difference (IV, Fixed, 95% CI) | Subtotals only | |
| 32.1 DHA and AA vs normal term formula | 4 | 633 | Mean Difference (IV, Fixed, 95% CI) | ‐0.13 [‐0.36, 0.11] |
| 32.2 DHA vs normal term formula | 2 | 75 | Mean Difference (IV, Fixed, 95% CI) | ‐0.22 [‐0.80, 0.37] |
| 33 Head circumference at 12 m, z score Show forest plot | 4 | Mean Difference (IV, Fixed, 95% CI) | Subtotals only | |
| 33.1 DHA and AA vs normal term formula | 4 | 464 | Mean Difference (IV, Fixed, 95% CI) | ‐0.13 [‐0.32, 0.05] |
| 33.2 DHA vs normal term formula | 1 | 88 | Mean Difference (IV, Fixed, 95% CI) | 0.07 [‐0.33, 0.47] |
| 34 Weight at 18 m (kg) Show forest plot | 2 | 563 | Mean Difference (IV, Fixed, 95% CI) | ‐0.04 [‐0.25, 0.17] |
| 34.1 DHA and AA vs normal term formula | 2 | 563 | Mean Difference (IV, Fixed, 95% CI) | ‐0.04 [‐0.25, 0.17] |
| 35 Length at 18 m (cm) Show forest plot | 2 | 565 | Mean Difference (IV, Fixed, 95% CI) | ‐0.19 [‐0.71, 0.34] |
| 35.1 DHA and AA vs normal term formula | 2 | 565 | Mean Difference (IV, Fixed, 95% CI) | ‐0.19 [‐0.71, 0.34] |
| 36 Head circumference at 18 m (cm) Show forest plot | 2 | 565 | Mean Difference (IV, Fixed, 95% CI) | ‐0.07 [‐0.32, 0.19] |
| 36.1 DHA and AA vs normal term formula | 2 | 565 | Mean Difference (IV, Fixed, 95% CI) | ‐0.07 [‐0.32, 0.19] |
| 37 Weight at 2 years (kg) Show forest plot | 1 | Mean Difference (IV, Fixed, 95% CI) | Subtotals only | |
| 37.1 DHA and AA vs normal term formula | 1 | 39 | Mean Difference (IV, Fixed, 95% CI) | ‐0.76 [‐1.68, 0.16] |
| 37.2 DHA vs normal term formula | 1 | 43 | Mean Difference (IV, Fixed, 95% CI) | ‐0.79 [‐1.65, 0.07] |
| 38 Height at 2 years (cm) Show forest plot | 1 | Mean Difference (IV, Fixed, 95% CI) | Subtotals only | |
| 38.1 DHA and AA vs normal term formula | 1 | 39 | Mean Difference (IV, Fixed, 95% CI) | 0.0 [‐2.07, 2.07] |
| 38.2 DHA vs normal term formula | 1 | 43 | Mean Difference (IV, Fixed, 95% CI) | ‐0.30 [‐2.09, 1.49] |
| 39 Head circumference at 2 years (cm) Show forest plot | 1 | Mean Difference (IV, Fixed, 95% CI) | Subtotals only | |
| 39.1 DHA and AA vs normal term formula | 1 | 39 | Mean Difference (IV, Fixed, 95% CI) | 0.5 [‐0.47, 1.47] |
| 39.2 DHA vs normal term formula | 1 | 43 | Mean Difference (IV, Fixed, 95% CI) | 0.10 [‐0.68, 0.88] |