Long chain polyunsaturated fatty acid supplementation in infants born at term
Appendices
Appendix 1. Appendix 1: MEDLINE search strategy
Ovid MEDLINE(R) 1946 to present with daily update, Ovid MEDLINE(R) daily epub ahead of print, in‐process & other non‐indexed citations (28 December 2016)
1. Polyunsaturated fatty acid.mp. or Fatty Acids, Unsaturated/: 24403 citations
2. Fish Oils/ or Docosahexaenoic Acids/ or docosahexanoic acid.mp. or Fatty Acids, Omega‐3/: 24019 citations
3. n3 fatty acid.mp. : 35 citations
4. n6 fatty acid.mp: 10 citations
5. Arachidonic acid.mp. or arachidonic acid/: 44933 citations
6. 1 or 2 or 3 or 4 or 5: 82726 citations
7. Infant/ or Infant, Newborn/ or Infant Formula/: 1132619 citations
8. 6 and 7: 2304 Citations
9. limit 8 to (clinical trial or controlled clinical trial or pragmatic clinical trial or randomised controlled trial): 508 citations
Appendix 2. Appendix 2: Embase search strategy
| Embase (Ovid) 1980 to 28 December 2016 |
1. Polyunsaturated fatty acid.mp. or Fatty Acids, Unsaturated/: 33673 citations
2. Fish Oils/ or Docosahexaenoic Acids/ or docosahexanoic acid.mp. or Fatty Acids, Omega‐3/: 41081 citations
3. n3 fatty acid.mp. : 41 citations
4. n6 fatty acid.mp: 8 citations
5. Arachidonic acid.mp. or arachidonic acid/: 55542 citations
6. 1 or 2 or 3 or 4 or 5: 111096 citations
7. Infant/ or Infant, Newborn/ or Infant Formula/: 945827 citations
8. 6 and 7: 3782 Citations
9. limit 7 to (clinical trial or controlled clinical trial or pragmatic clinical trial or randomised controlled trial): 581 citations
Appendix 3. Appendix 3: CINAHL search strategy
| S1 | docosahexanoic acid: 2583 citations |
| S2 | omega‐3: 6657 citations |
| S3 | Omega‐6: 997 citations |
| S4 | arachidonic acid: 1711 |
| S5 | poly unsaturated fatty acid:16 citations |
| S6 | polyunsaturated fatty acids: 2192 citations |
| S7 | fish oil: 3059 citations |
| S8 | n‐3 fatty acid: 784 citations |
| S9 | n‐3 fatty acids: 784 citations |
| S10 | n‐6 fatty acids:119 citations |
| S11 | infant: 208105 citations |
| S12 | newborn infant:1851 citations |
| S13 | infant formula:3235 citations |
| S14 | S11 OR S12 OR S13: 208105 citations |
| S15 | S1 OR S2 OR S3 OR S4 OR S5 OR S6 OR S7 OR S8 OR S9 OR S10: 11103 citations |
| S16 | S14 AND S15: 906 citations |
Appendix 4. Appendix 4: Cochrane CENTRAL search strategy
#1. "long chain polyunsaturated fatty acid"(Word variations have been searched): 346 Citations
#2. Arachidonic Acid: 1378 Citations
#3. Docosahexanoic acid: 73 Citations
#4. Omega 3: Citations: 3734 Citations
#5. Omega 6: 2337 Citations
#6. Omega‐3: 3339 Citations
#7. Omega‐6: 475 Citations
#8. LCPUFA: 162 Citations
#9. #1 OR #2 OR #3 OR #4 OR #5 OR #6 OR #7 OR #8: 5054 Citations
#10. Infant: 39347 Citations
#11. Neonate: 1322 Citations
#12. Newborn Infant: 17586 Citations
#13. Milk Formula: 1599 Citations
#14. Formula Milk: 1599 Citations
#15. #10 OR #11 or #12 or #13 or #14:39948 Citations
#16. #9 AND #15: 505 Citations
Appendix 5. Appendix 5: Risk of bias tool
Risk of bias of studies was assessed by two review authors (SR and BJ). We resolved disagreements by discussion among all four review authors and by consensus. We entered information into the Risk of bias table using the following criteria.
1. Was there adequate sequence generation (checking for possible selection bias): The method used to generate the allocation sequence in each included study was described as low risk (any truly random process, e.g. random number table, computer random number generator); high risk (any non‐random process, e.g. odd or even date of birth, hospital or clinic record number); unclear risk.
2. Was there adequate allocation concealment (checking for possible selection bias): The method used to conceal the allocation sequence in each included study was described as: low risk (e.g. telephone or central randomisation, consecutively numbered sealed opaque envelopes); high risk (open random allocation, unsealed or non‐opaque envelopes, alternation, date of birth); unclear risk.
3. Was there adequate blinding (checking for possible performance bias): The methods used to blind personnel from knowledge of which intervention participants received. Was knowledge of the allocated intervention adequately prevented during the study? At the time of outcome assessment? Categorised as low risk, high risk or unclear risk.
4. Were incomplete outcome data addressed (checking for possible attrition bias through withdrawals, dropouts, protocol deviations): If attrition and exclusion were reported, numbers included in the analysis at each stage (compared with total randomised participants), reasons for attrition or exclusion when reported and whether missing data were balanced across groups or were related to outcomes were reported. We assessed methods as low risk (< 20% missing data); high risk (≥ 20% missing data); unclear risk.
5. Was there selective reporting bias: The possibility of selective outcome reporting bias was investigated. We assessed methods as low risk (when it was clear that all of the study's prespecified outcomes were reported); high risk (when not all of the study's prespecified outcomes were reported; one or more reported primary outcomes were not prespecified; outcomes of interest were reported incompletely; study failed to include results of a key outcome that would have been expected to have been reported); unclear risk.
6. Were there any other sources of potential bias: Any important concerns about other potential sources of bias (e.g. whether a potential source of bias was related to the specific study design, whether the trial was stopped early owing to some data‐dependent process) were described. We assessed whether each study was free of other problems that could put it at risk of bias as low risk; high risk; unclear risk.

Study flow diagram.

Risk of bias summary: review authors' judgements about each risk of bias item for each included study.
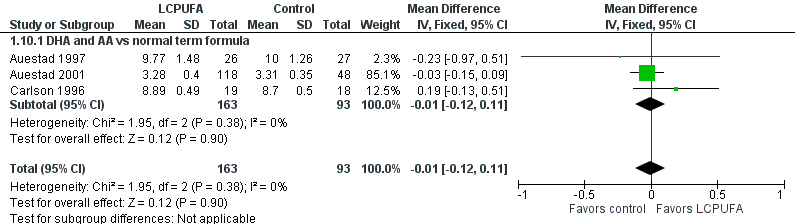
Forest plot of comparison: 1 LCPUFA supplemented vs control formula, outcome: 1.10 Visual acuity/Teller cards at 12 m (cycles/degree).
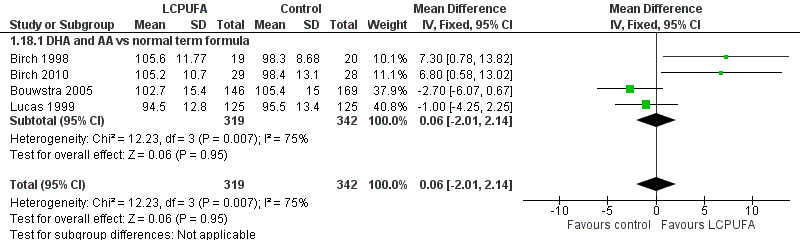
Forest plot of comparison: 1 LCPUFA supplemented vs control formula, outcome: 1.18 MDI (Bayley Scale score) at 18 m.

Forest plot of comparison: 1 LCPUFA supplemented vs control formula, outcome: 1.19 PDI (Bayley Scale score) at 18 m.
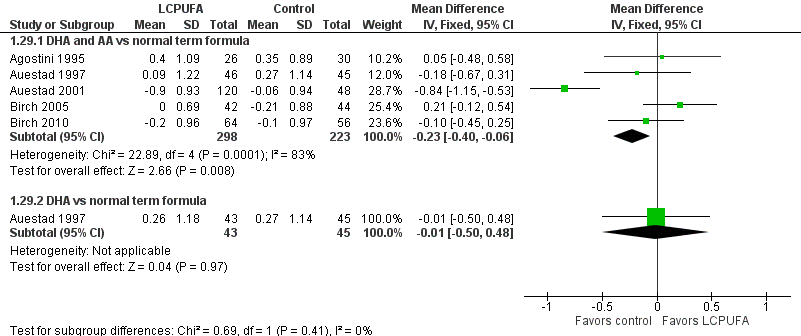
Forest plot of comparison: 1 LCPUFA supplemented vs control formula, outcome: 1.29 Weight at 12 m, z score.
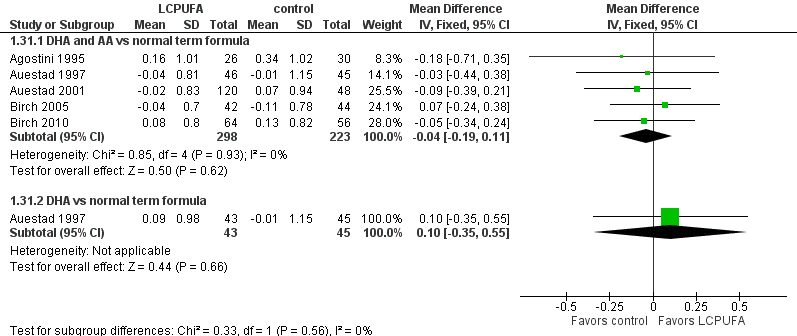
Forest plot of comparison: 1 LCPUFA supplemented vs control formula, outcome: 1.31 Length at 12 m, z score.

Forest plot of comparison: 1 LCPUFA supplemented vs control formula, outcome: 1.33 Head circumference at 12 m, z score.

Comparison 1 LCPUFA supplemented vs control formula, Outcome 1 VEP acuity at 4 m (logMAR, steady state).

Comparison 1 LCPUFA supplemented vs control formula, Outcome 2 Sweep VEP acuity at 4 m (logMAR).
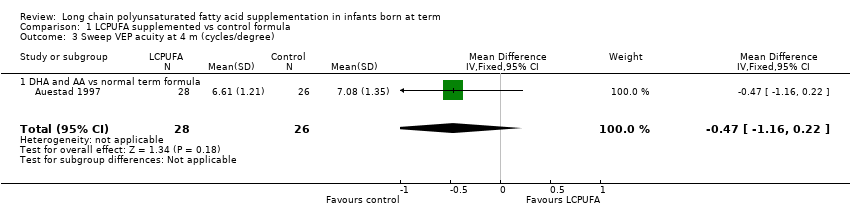
Comparison 1 LCPUFA supplemented vs control formula, Outcome 3 Sweep VEP acuity at 4 m (cycles/degree).

Comparison 1 LCPUFA supplemented vs control formula, Outcome 4 Visual acuity/Teller cards at 4 m (cycles/degree).

Comparison 1 LCPUFA supplemented vs control formula, Outcome 5 Sweep VEP acuity at 6 m (cycles/degree).
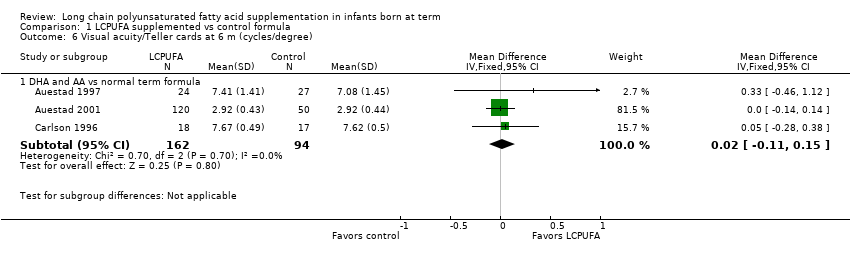
Comparison 1 LCPUFA supplemented vs control formula, Outcome 6 Visual acuity/Teller cards at 6 m (cycles/degree).

Comparison 1 LCPUFA supplemented vs control formula, Outcome 7 VEP acuity at 7‐8 m (logMAR, steady state).
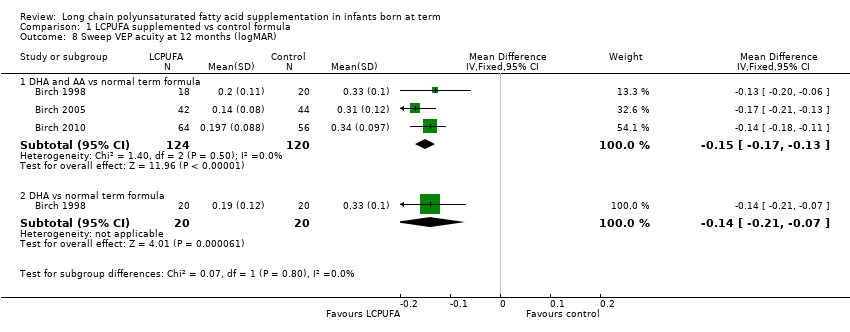
Comparison 1 LCPUFA supplemented vs control formula, Outcome 8 Sweep VEP acuity at 12 months (logMAR).

Comparison 1 LCPUFA supplemented vs control formula, Outcome 9 Sweep VEP acuity at 12 m (cycles/degree).
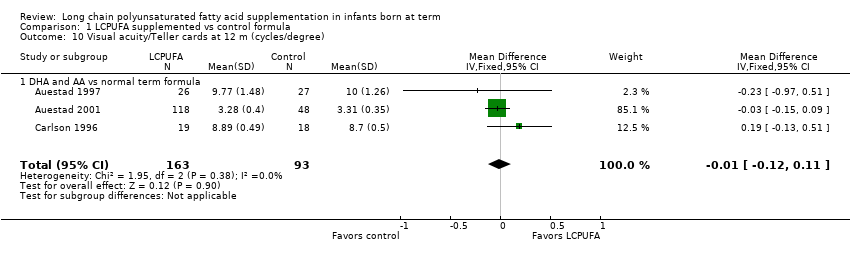
Comparison 1 LCPUFA supplemented vs control formula, Outcome 10 Visual acuity/Teller cards at 12 m (cycles/degree).
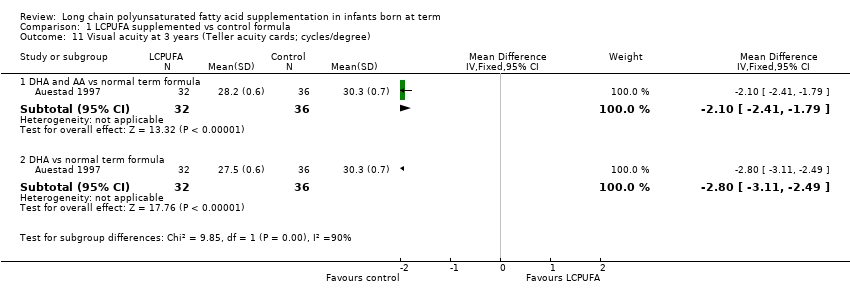
Comparison 1 LCPUFA supplemented vs control formula, Outcome 11 Visual acuity at 3 years (Teller acuity cards; cycles/degree).
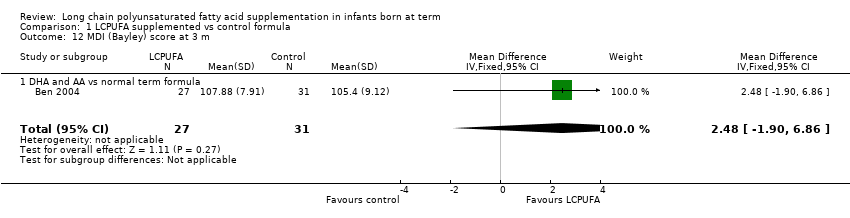
Comparison 1 LCPUFA supplemented vs control formula, Outcome 12 MDI (Bayley) score at 3 m.

Comparison 1 LCPUFA supplemented vs control formula, Outcome 13 PDI (Bayley) score at 3 m.

Comparison 1 LCPUFA supplemented vs control formula, Outcome 14 MDI (Bayley) score at 6 m.

Comparison 1 LCPUFA supplemented vs control formula, Outcome 15 PDI (Bayley) score at 6 m.

Comparison 1 LCPUFA supplemented vs control formula, Outcome 16 MDI (Bayley score) at 1 year.

Comparison 1 LCPUFA supplemented vs control formula, Outcome 17 PDI (Bayley score) at 1 year.
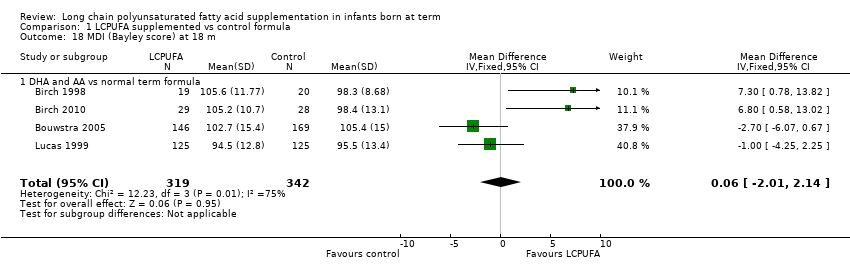
Comparison 1 LCPUFA supplemented vs control formula, Outcome 18 MDI (Bayley score) at 18 m.

Comparison 1 LCPUFA supplemented vs control formula, Outcome 19 PDI (Bayley score) at 18 m.
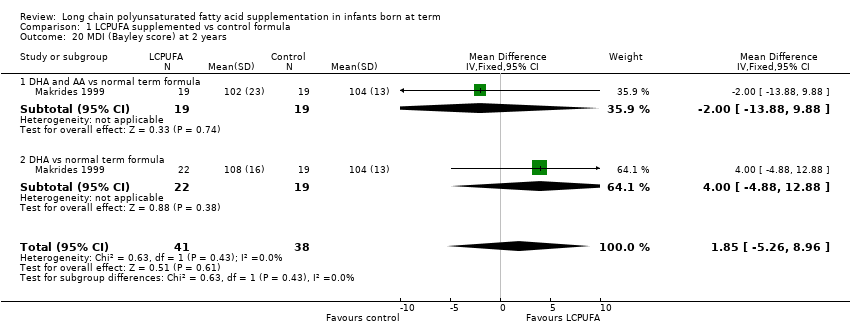
Comparison 1 LCPUFA supplemented vs control formula, Outcome 20 MDI (Bayley score) at 2 years.

Comparison 1 LCPUFA supplemented vs control formula, Outcome 21 PDI (Bayley score) at 2 years.
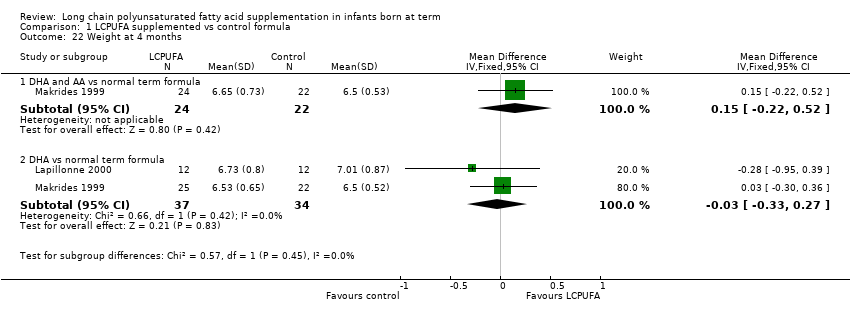
Comparison 1 LCPUFA supplemented vs control formula, Outcome 22 Weight at 4 months.

Comparison 1 LCPUFA supplemented vs control formula, Outcome 23 Length at 4 months.
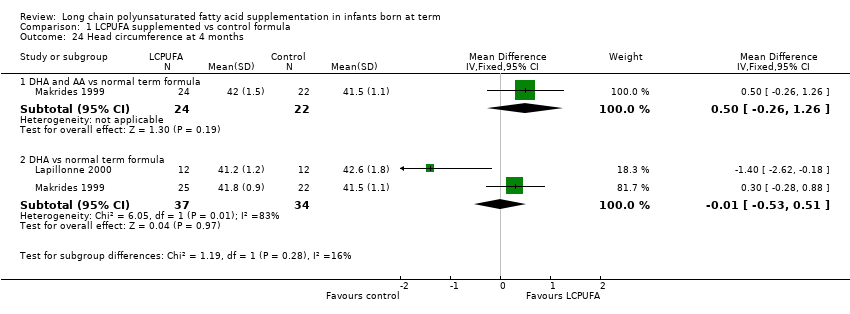
Comparison 1 LCPUFA supplemented vs control formula, Outcome 24 Head circumference at 4 months.
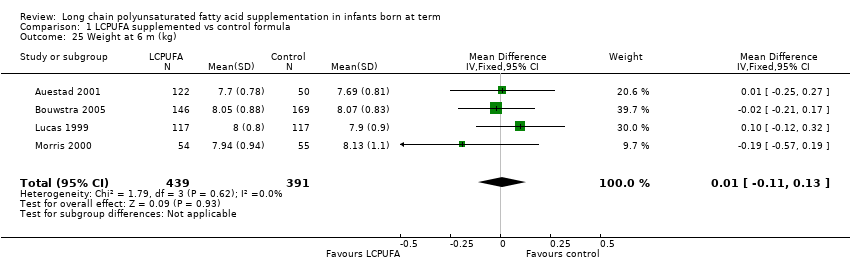
Comparison 1 LCPUFA supplemented vs control formula, Outcome 25 Weight at 6 m (kg).

Comparison 1 LCPUFA supplemented vs control formula, Outcome 26 Length at 6 m (cm).

Comparison 1 LCPUFA supplemented vs control formula, Outcome 27 Head circumference at 6 m (cm).
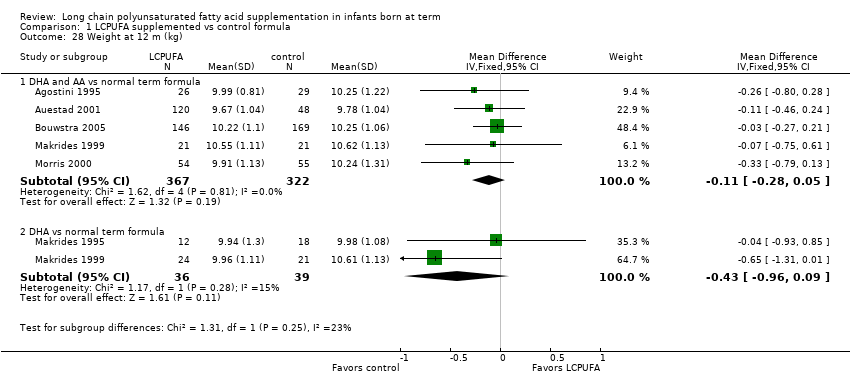
Comparison 1 LCPUFA supplemented vs control formula, Outcome 28 Weight at 12 m (kg).
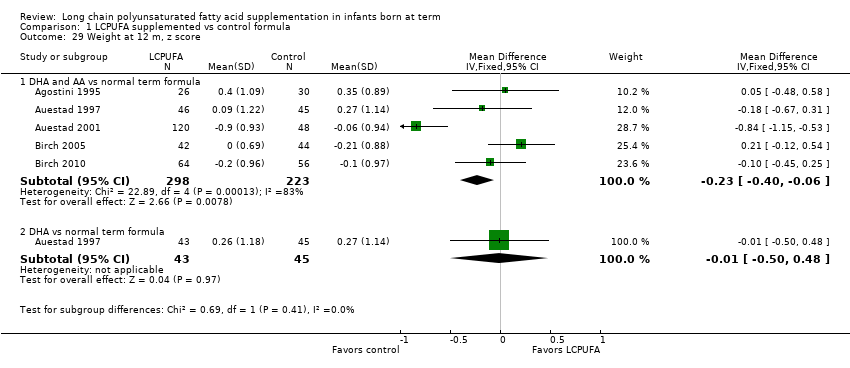
Comparison 1 LCPUFA supplemented vs control formula, Outcome 29 Weight at 12 m, z score.
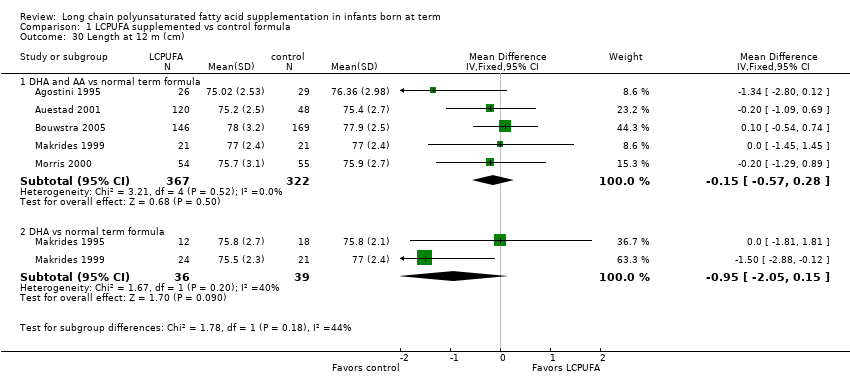
Comparison 1 LCPUFA supplemented vs control formula, Outcome 30 Length at 12 m (cm).

Comparison 1 LCPUFA supplemented vs control formula, Outcome 31 Length at 12 m, z score.
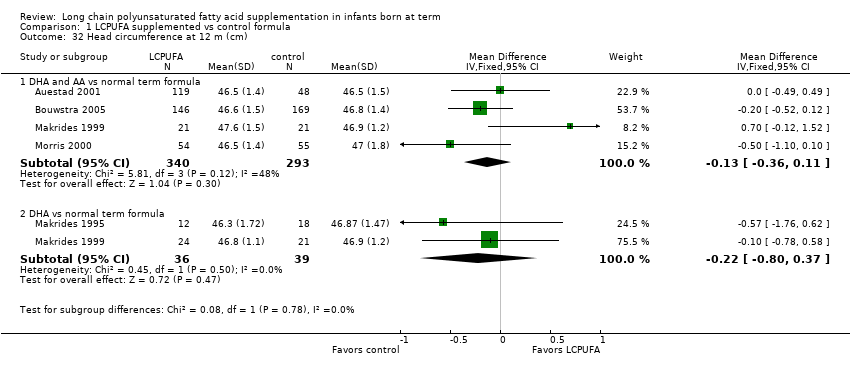
Comparison 1 LCPUFA supplemented vs control formula, Outcome 32 Head circumference at 12 m (cm).

Comparison 1 LCPUFA supplemented vs control formula, Outcome 33 Head circumference at 12 m, z score.

Comparison 1 LCPUFA supplemented vs control formula, Outcome 34 Weight at 18 m (kg).

Comparison 1 LCPUFA supplemented vs control formula, Outcome 35 Length at 18 m (cm).
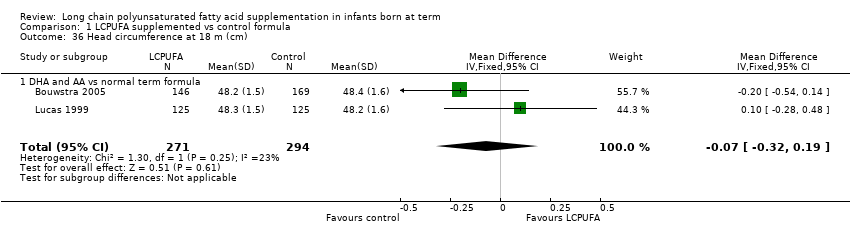
Comparison 1 LCPUFA supplemented vs control formula, Outcome 36 Head circumference at 18 m (cm).
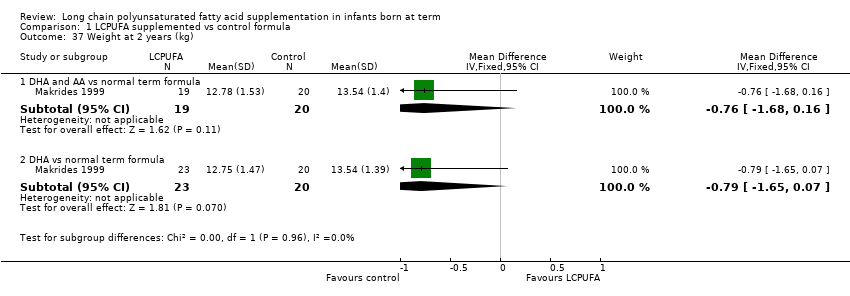
Comparison 1 LCPUFA supplemented vs control formula, Outcome 37 Weight at 2 years (kg).
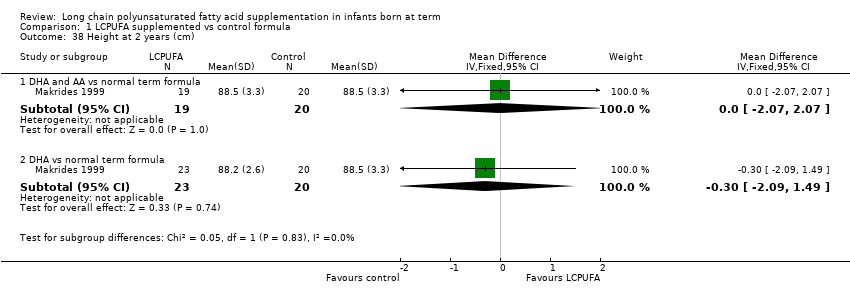
Comparison 1 LCPUFA supplemented vs control formula, Outcome 38 Height at 2 years (cm).
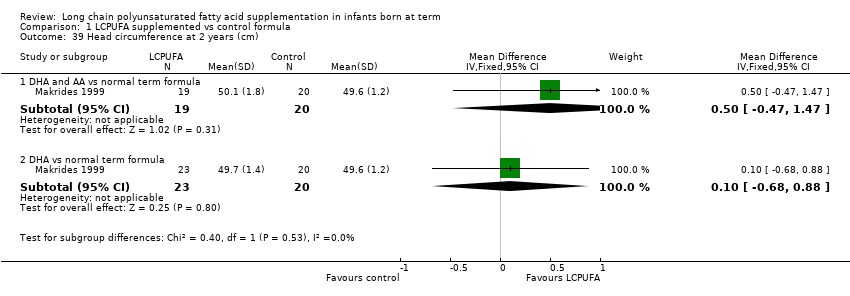
Comparison 1 LCPUFA supplemented vs control formula, Outcome 39 Head circumference at 2 years (cm).
| LCPUFA supplemented formula compared with control formula for term infants for clinical outcomes (visual function, neurodevelopment and physical growth) | ||||||
| Patient or population: term infants | ||||||
| Outcomes | Illustrative comparative risks* (95% CI) | Relative effect | Number of participants | Quality of the evidence | Comments | |
| Assumed risk | Corresponding risk | |||||
| Control formula | LCPUFA supplemented formula | |||||
| Visual acuity/Teller cards at 12 months (cycles/degree) ‐ DHA and AA vs normal term formula | Mean visual acuity (cycles/degree) ranged across control groups from 3.31 to 10 | Mean visual acuity (cycles/degree) ranged across intervention groups from 3.28 to 9.77 | MD ‐0.01 (95% CI ‐0.12 to 0.11) | 256 | ⊕⊕⊝⊝ | Downgraded 2 levels |
| Sweep VEP acuity at 12 months (LogMAR) ‐ DHA and AA vs normal term formula | Mean sweep VEP acuity (LogMAR) ranged across control groups from 0.31 to 0.339 | Mean sweep VEP acuity (LogMAR) ranged across intervention groups from 0.14 to 0.2 | MD ‐0.15 (95% CI ‐0.17 to ‐0.13) | 244 | ⊕⊕⊝⊝ | Downgraded 2 levels |
| MDI scores (Bayley) at 18 months ‐ DHA and AA vs normal term formula | Mean MDI ranged across control groups from 98.3 to 105.4 | Mean MDI ranged across intervention groups from 94.5 to 105.6 | MD 0.06 (95% CI ‐ 2.01 to 2.14) | 661 | ⊕⊕⊝⊝ | Downgraded 2 levels |
| PDI scores (Bayley) at 18 months ‐ DHA and AA vs normal term formula | Mean PDI ranged across control groups from 96.4 to 102 | Mean PDI ranged across intervention groups from 95.9 to 105.8 | MD 0.69 (95% CI ‐0.78 to 2.16) | 661 | ⊕⊕⊝⊝ | Downgraded 2 levels |
| Weight at 12 months (z scores) ‐ DHA and AA vs normal term formula | Mean z scores for weight ranged across control groups from ‐0.21 to 0.35 | Mean z scores for weight ranged across intervention groups from ‐0.9 to 0.4 | MD ‐0.23 (95% CI ‐0.40 to ‐0.06) | 521 | ⊕⊕⊝⊝ | Downgraded 2 levels |
| Length at 12 months (z scores) ‐ DHA and AA vs normal term formula | Mean z scores for length ranged across control groups from ‐0.11 to 0.34 | Mean z scores for length ranged across control groups from ‐0.04 to 0.16 | MD ‐0.04 (95% CI ‐0.19 to 0.11) | 521 | ⊕⊕⊝⊝ | Downgraded 2 levels |
| Head circumference at 12 months (z scores) ‐ DHA and AA vs normal term formula | Mean z scores for head circumference ranged across control groups from 0.18 to 0.94 | Mean z scores for head circumference ranged across control groups from 0.01 to 0.93 | MD ‐0.13 (95% CI ‐0.32 to 0.05) | 464 | ⊕⊕⊝⊝ | Downgraded 2 levels |
| *The basis for the assumed risk (e.g. median control group risk across studies) is provided in footnotes. The corresponding risk (and its 95% confidence interval) is based on assumed risk in the comparison group and the relative effect of the intervention (and its 95% CI) | ||||||
| GRADE Working Group grades of evidence | ||||||
| Outcome or subgroup title | No. of studies | No. of participants | Statistical method | Effect size |
| 1 VEP acuity at 4 m (logMAR, steady state) Show forest plot | 2 | Mean Difference (IV, Fixed, 95% CI) | Subtotals only | |
| 1.1 DHA and AA vs normal term formula | 1 | 30 | Mean Difference (IV, Fixed, 95% CI) | 0.01 [‐0.07, 0.09] |
| 1.2 DHA vs normal term formula | 2 | 60 | Mean Difference (IV, Fixed, 95% CI) | ‐0.03 [‐0.10, 0.03] |
| 2 Sweep VEP acuity at 4 m (logMAR) Show forest plot | 3 | Mean Difference (IV, Fixed, 95% CI) | Subtotals only | |
| 2.1 DHA and AA vs normal term formula | 3 | 266 | Mean Difference (IV, Fixed, 95% CI) | ‐0.08 [‐0.10, ‐0.05] |
| 2.2 DHA vs normal term formula | 1 | 41 | Mean Difference (IV, Fixed, 95% CI) | ‐0.08 [‐0.15, ‐0.01] |
| 3 Sweep VEP acuity at 4 m (cycles/degree) Show forest plot | 1 | 54 | Mean Difference (IV, Fixed, 95% CI) | ‐0.47 [‐1.16, 0.22] |
| 3.1 DHA and AA vs normal term formula | 1 | 54 | Mean Difference (IV, Fixed, 95% CI) | ‐0.47 [‐1.16, 0.22] |
| 4 Visual acuity/Teller cards at 4 m (cycles/degree) Show forest plot | 3 | 264 | Mean Difference (IV, Fixed, 95% CI) | ‐0.11 [‐0.24, 0.02] |
| 4.1 DHA and AA vs normal term formula | 3 | 264 | Mean Difference (IV, Fixed, 95% CI) | ‐0.11 [‐0.24, 0.02] |
| 5 Sweep VEP acuity at 6 m (cycles/degree) Show forest plot | 1 | 53 | Mean Difference (IV, Fixed, 95% CI) | ‐0.31 [‐1.04, 0.42] |
| 5.1 DHA and AA vs normal term formula | 1 | 53 | Mean Difference (IV, Fixed, 95% CI) | ‐0.31 [‐1.04, 0.42] |
| 6 Visual acuity/Teller cards at 6 m (cycles/degree) Show forest plot | 3 | Mean Difference (IV, Fixed, 95% CI) | Subtotals only | |
| 6.1 DHA and AA vs normal term formula | 3 | 256 | Mean Difference (IV, Fixed, 95% CI) | 0.02 [‐0.11, 0.15] |
| 7 VEP acuity at 7‐8 m (logMAR, steady state) Show forest plot | 2 | Mean Difference (IV, Fixed, 95% CI) | Subtotals only | |
| 7.1 DHA and AA vs normal term formula | 1 | 30 | Mean Difference (IV, Fixed, 95% CI) | 0.0 [‐0.13, 0.13] |
| 7.2 DHA vs normal term formula | 2 | 52 | Mean Difference (IV, Fixed, 95% CI) | ‐0.02 [‐0.14, 0.10] |
| 8 Sweep VEP acuity at 12 months (logMAR) Show forest plot | 3 | Mean Difference (IV, Fixed, 95% CI) | Subtotals only | |
| 8.1 DHA and AA vs normal term formula | 3 | 244 | Mean Difference (IV, Fixed, 95% CI) | ‐0.15 [‐0.17, ‐0.13] |
| 8.2 DHA vs normal term formula | 1 | 40 | Mean Difference (IV, Fixed, 95% CI) | ‐0.14 [‐0.21, ‐0.07] |
| 9 Sweep VEP acuity at 12 m (cycles/degree) Show forest plot | 1 | 53 | Mean Difference (IV, Fixed, 95% CI) | 0.0 [‐0.71, 0.71] |
| 9.1 DHA and AA vs normal term formula | 1 | 53 | Mean Difference (IV, Fixed, 95% CI) | 0.0 [‐0.71, 0.71] |
| 10 Visual acuity/Teller cards at 12 m (cycles/degree) Show forest plot | 3 | 256 | Mean Difference (IV, Fixed, 95% CI) | ‐0.01 [‐0.12, 0.11] |
| 10.1 DHA and AA vs normal term formula | 3 | 256 | Mean Difference (IV, Fixed, 95% CI) | ‐0.01 [‐0.12, 0.11] |
| 11 Visual acuity at 3 years (Teller acuity cards; cycles/degree) Show forest plot | 1 | Mean Difference (IV, Fixed, 95% CI) | Subtotals only | |
| 11.1 DHA and AA vs normal term formula | 1 | 68 | Mean Difference (IV, Fixed, 95% CI) | ‐2.10 [‐2.41, ‐1.79] |
| 11.2 DHA vs normal term formula | 1 | 68 | Mean Difference (IV, Fixed, 95% CI) | ‐2.80 [‐3.11, ‐2.49] |
| 12 MDI (Bayley) score at 3 m Show forest plot | 1 | 58 | Mean Difference (IV, Fixed, 95% CI) | 2.48 [‐1.90, 6.86] |
| 12.1 DHA and AA vs normal term formula | 1 | 58 | Mean Difference (IV, Fixed, 95% CI) | 2.48 [‐1.90, 6.86] |
| 13 PDI (Bayley) score at 3 m Show forest plot | 1 | 58 | Mean Difference (IV, Fixed, 95% CI) | 3.66 [0.43, 6.89] |
| 13.1 DHA and AA vs normal term formula | 1 | 58 | Mean Difference (IV, Fixed, 95% CI) | 3.66 [0.43, 6.89] |
| 14 MDI (Bayley) score at 6 m Show forest plot | 2 | 207 | Mean Difference (IV, Fixed, 95% CI) | ‐0.59 [‐2.26, 1.07] |
| 14.1 DHA and AA vs normal term formula | 2 | 207 | Mean Difference (IV, Fixed, 95% CI) | ‐0.59 [‐2.26, 1.07] |
| 15 PDI (Bayley) score at 6 m Show forest plot | 2 | 206 | Mean Difference (IV, Fixed, 95% CI) | 0.23 [‐2.47, 2.94] |
| 15.1 DHA and AA vs normal term formula | 2 | 206 | Mean Difference (IV, Fixed, 95% CI) | 0.23 [‐2.47, 2.94] |
| 16 MDI (Bayley score) at 1 year Show forest plot | 4 | Mean Difference (IV, Fixed, 95% CI) | Subtotals only | |
| 16.1 DHA and AA vs normal term formula | 3 | 298 | Mean Difference (IV, Fixed, 95% CI) | ‐0.95 [‐3.38, 1.49] |
| 16.2 DHA vs normal term formula | 3 | 160 | Mean Difference (IV, Fixed, 95% CI) | ‐0.27 [‐4.36, 3.83] |
| 17 PDI (Bayley score) at 1 year Show forest plot | 4 | Mean Difference (IV, Fixed, 95% CI) | Subtotals only | |
| 17.1 DHA and AA vs normal term formula | 3 | 298 | Mean Difference (IV, Fixed, 95% CI) | ‐2.48 [‐5.83, 0.86] |
| 17.2 DHA vs normal term formula | 3 | 160 | Mean Difference (IV, Fixed, 95% CI) | ‐1.70 [‐6.62, 3.22] |
| 18 MDI (Bayley score) at 18 m Show forest plot | 4 | 661 | Mean Difference (IV, Fixed, 95% CI) | 0.06 [‐2.01, 2.14] |
| 18.1 DHA and AA vs normal term formula | 4 | 661 | Mean Difference (IV, Fixed, 95% CI) | 0.06 [‐2.01, 2.14] |
| 19 PDI (Bayley score) at 18 m Show forest plot | 4 | 661 | Mean Difference (IV, Fixed, 95% CI) | 0.69 [‐0.78, 2.16] |
| 19.1 DHA and AA vs normal term formula | 4 | 661 | Mean Difference (IV, Fixed, 95% CI) | 0.69 [‐0.78, 2.16] |
| 20 MDI (Bayley score) at 2 years Show forest plot | 1 | 79 | Mean Difference (IV, Fixed, 95% CI) | 1.85 [‐5.26, 8.96] |
| 20.1 DHA and AA vs normal term formula | 1 | 38 | Mean Difference (IV, Fixed, 95% CI) | ‐2.0 [‐13.88, 9.88] |
| 20.2 DHA vs normal term formula | 1 | 41 | Mean Difference (IV, Fixed, 95% CI) | 4.0 [‐4.88, 12.88] |
| 21 PDI (Bayley score) at 2 years Show forest plot | 1 | Mean Difference (IV, Fixed, 95% CI) | Subtotals only | |
| 21.1 DHA and AA vs normal term formula | 1 | 37 | Mean Difference (IV, Fixed, 95% CI) | ‐1.0 [‐12.71, 10.71] |
| 21.2 DHA vs normal term formula | 1 | 37 | Mean Difference (IV, Fixed, 95% CI) | 7.00 [‐3.32, 17.32] |
| 22 Weight at 4 months Show forest plot | 2 | Mean Difference (IV, Fixed, 95% CI) | Subtotals only | |
| 22.1 DHA and AA vs normal term formula | 1 | 46 | Mean Difference (IV, Fixed, 95% CI) | 0.15 [‐0.22, 0.52] |
| 22.2 DHA vs normal term formula | 2 | 71 | Mean Difference (IV, Fixed, 95% CI) | ‐0.03 [‐0.33, 0.27] |
| 23 Length at 4 months Show forest plot | 2 | Mean Difference (IV, Fixed, 95% CI) | Subtotals only | |
| 23.1 DHA and AA vs normal term formula | 1 | 46 | Mean Difference (IV, Fixed, 95% CI) | 0.0 [‐1.45, 1.45] |
| 23.2 DHA vs normal term formula | 2 | 71 | Mean Difference (IV, Fixed, 95% CI) | 0.03 [1.00, 1.06] |
| 24 Head circumference at 4 months Show forest plot | 2 | Mean Difference (IV, Fixed, 95% CI) | Subtotals only | |
| 24.1 DHA and AA vs normal term formula | 1 | 46 | Mean Difference (IV, Fixed, 95% CI) | 0.5 [‐0.26, 1.26] |
| 24.2 DHA vs normal term formula | 2 | 71 | Mean Difference (IV, Fixed, 95% CI) | ‐0.01 [‐0.53, 0.51] |
| 25 Weight at 6 m (kg) Show forest plot | 4 | 830 | Mean Difference (IV, Fixed, 95% CI) | 0.01 [‐0.11, 0.13] |
| 26 Length at 6 m (cm) Show forest plot | 4 | 830 | Mean Difference (IV, Fixed, 95% CI) | ‐0.13 [‐0.47, 0.21] |
| 27 Head circumference at 6 m (cm) Show forest plot | 4 | 830 | Mean Difference (IV, Fixed, 95% CI) | ‐0.06 [‐0.25, 0.13] |
| 28 Weight at 12 m (kg) Show forest plot | 6 | Mean Difference (IV, Fixed, 95% CI) | Subtotals only | |
| 28.1 DHA and AA vs normal term formula | 5 | 689 | Mean Difference (IV, Fixed, 95% CI) | ‐0.11 [‐0.28, 0.05] |
| 28.2 DHA vs normal term formula | 2 | 75 | Mean Difference (IV, Fixed, 95% CI) | ‐0.43 [‐0.96, 0.09] |
| 29 Weight at 12 m, z score Show forest plot | 5 | Mean Difference (IV, Fixed, 95% CI) | Subtotals only | |
| 29.1 DHA and AA vs normal term formula | 5 | 521 | Mean Difference (IV, Fixed, 95% CI) | ‐0.23 [‐0.40, ‐0.06] |
| 29.2 DHA vs normal term formula | 1 | 88 | Mean Difference (IV, Fixed, 95% CI) | ‐0.01 [‐0.50, 0.48] |
| 30 Length at 12 m (cm) Show forest plot | 6 | Mean Difference (IV, Fixed, 95% CI) | Subtotals only | |
| 30.1 DHA and AA vs normal term formula | 5 | 689 | Mean Difference (IV, Fixed, 95% CI) | ‐0.15 [‐0.57, 0.28] |
| 30.2 DHA vs normal term formula | 2 | 75 | Mean Difference (IV, Fixed, 95% CI) | ‐0.95 [‐2.05, 0.15] |
| 31 Length at 12 m, z score Show forest plot | 5 | Mean Difference (IV, Fixed, 95% CI) | Subtotals only | |
| 31.1 DHA and AA vs normal term formula | 5 | 521 | Mean Difference (IV, Fixed, 95% CI) | ‐0.04 [‐0.19, 0.11] |
| 31.2 DHA vs normal term formula | 1 | 88 | Mean Difference (IV, Fixed, 95% CI) | 0.10 [‐0.35, 0.55] |
| 32 Head circumference at 12 m (cm) Show forest plot | 5 | Mean Difference (IV, Fixed, 95% CI) | Subtotals only | |
| 32.1 DHA and AA vs normal term formula | 4 | 633 | Mean Difference (IV, Fixed, 95% CI) | ‐0.13 [‐0.36, 0.11] |
| 32.2 DHA vs normal term formula | 2 | 75 | Mean Difference (IV, Fixed, 95% CI) | ‐0.22 [‐0.80, 0.37] |
| 33 Head circumference at 12 m, z score Show forest plot | 4 | Mean Difference (IV, Fixed, 95% CI) | Subtotals only | |
| 33.1 DHA and AA vs normal term formula | 4 | 464 | Mean Difference (IV, Fixed, 95% CI) | ‐0.13 [‐0.32, 0.05] |
| 33.2 DHA vs normal term formula | 1 | 88 | Mean Difference (IV, Fixed, 95% CI) | 0.07 [‐0.33, 0.47] |
| 34 Weight at 18 m (kg) Show forest plot | 2 | 563 | Mean Difference (IV, Fixed, 95% CI) | ‐0.04 [‐0.25, 0.17] |
| 34.1 DHA and AA vs normal term formula | 2 | 563 | Mean Difference (IV, Fixed, 95% CI) | ‐0.04 [‐0.25, 0.17] |
| 35 Length at 18 m (cm) Show forest plot | 2 | 565 | Mean Difference (IV, Fixed, 95% CI) | ‐0.19 [‐0.71, 0.34] |
| 35.1 DHA and AA vs normal term formula | 2 | 565 | Mean Difference (IV, Fixed, 95% CI) | ‐0.19 [‐0.71, 0.34] |
| 36 Head circumference at 18 m (cm) Show forest plot | 2 | 565 | Mean Difference (IV, Fixed, 95% CI) | ‐0.07 [‐0.32, 0.19] |
| 36.1 DHA and AA vs normal term formula | 2 | 565 | Mean Difference (IV, Fixed, 95% CI) | ‐0.07 [‐0.32, 0.19] |
| 37 Weight at 2 years (kg) Show forest plot | 1 | Mean Difference (IV, Fixed, 95% CI) | Subtotals only | |
| 37.1 DHA and AA vs normal term formula | 1 | 39 | Mean Difference (IV, Fixed, 95% CI) | ‐0.76 [‐1.68, 0.16] |
| 37.2 DHA vs normal term formula | 1 | 43 | Mean Difference (IV, Fixed, 95% CI) | ‐0.79 [‐1.65, 0.07] |
| 38 Height at 2 years (cm) Show forest plot | 1 | Mean Difference (IV, Fixed, 95% CI) | Subtotals only | |
| 38.1 DHA and AA vs normal term formula | 1 | 39 | Mean Difference (IV, Fixed, 95% CI) | 0.0 [‐2.07, 2.07] |
| 38.2 DHA vs normal term formula | 1 | 43 | Mean Difference (IV, Fixed, 95% CI) | ‐0.30 [‐2.09, 1.49] |
| 39 Head circumference at 2 years (cm) Show forest plot | 1 | Mean Difference (IV, Fixed, 95% CI) | Subtotals only | |
| 39.1 DHA and AA vs normal term formula | 1 | 39 | Mean Difference (IV, Fixed, 95% CI) | 0.5 [‐0.47, 1.47] |
| 39.2 DHA vs normal term formula | 1 | 43 | Mean Difference (IV, Fixed, 95% CI) | 0.10 [‐0.68, 0.88] |