Nahrungsergänzung durch langkettige, mehrfach ungesättigte Fettsäuren bei frühgeborenen Säuglingen
Referencias
References to studies included in this review
References to studies excluded from this review
Additional references
References to other published versions of this review
Characteristics of studies
Characteristics of included studies [ordered by study ID]
Ir a:
| Methods | Randomised controlled study, single centre, Memphis. Intervention and outcome assessment were blinded and follow‐up of subjects was complete. | |
| Participants | Entry criteria included no need for mechanical ventilation and no significant IVH or retinopathy of prematurity. 10 subjects who could not tolerate enteral feeds were replaced. 79 infants were enrolled, 67 completed study (33 supplemented, 34 control). Subjects were predominantly from lower socio‐economic groups and black. Supplemented group GA 29 ± 2 wk, BW 1074 ± 193 g. Control group GA 29 ± 2 wk, BW 1133 ± 163 g. | |
| Interventions | Preterm formula (PT) until discharge (approximately 1800 g) then term formula (T). Supplemented formula 18.7% & 32.6% (PT & T) LA, 3.1% & 4.9% (PT & T) ALA, 0.3% EPA, 0.2% DHA. Control formula 19.1% & 33.1% (PT & T) LA, 3.0% & 4.8% (PT & T) ALA. | |
| Outcomes | Visual acuity (Teller acuity cards) and growth at term (0 months), and 2, 4, 6.5, 9 & 12 months post‐term. | |
| Notes | Visual acuity and growth parameters given in Figures; investigators contacted for actual values but no response. | |
| Risk of bias | ||
| Bias | Authors' judgement | Support for judgement |
| Random sequence generation (selection bias) | Unclear risk | Can't tell |
| Allocation concealment (selection bias) | Unclear risk | Method used for allocation concealment not clear |
| Blinding (performance bias and detection bias) | Low risk | Blinding of intervention: yes Blinding of outcome measurement: yes |
| Incomplete outcome data (attrition bias) | Low risk | Follow‐up complete |
| Selective reporting (reporting bias) | Low risk | Yes |
| Other bias | Low risk | Yes |
| Methods | Randomised double‐blind trial, single centre, Memphis. Intervention and outcome assessment were blinded. Follow‐up was complete. Infants were randomised by sealed envelopes, stratified by gender. | |
| Participants | 94 infants were recruited and 59 completed study through to 4 months. Selection criteria included birthweight between 747 and 1275 g. More controls dropped out than supplemented infants and replacements were added to balance the groups. 40% of subjects had bronchopulmonary dysplasia (defined as an oxygen requirement for > 28 days) which is associated with impaired vision and development. Therefore, data are given for subgroups of infants with or without bronchopulmonary dysplasia. | |
| Interventions | Supplemented formula fed from 3 to 5 days of age to 48 wk PCA. Supplemented formula 21.2% LA, 2.4% ALA, 0.06% EPA, 0.20% DHA vs control formula 21.2% LA, 2.4% ALA. All fed standard formula from 2 months' PCA to 12 months' PCA (34.3% LA, 4.8% ALA). | |
| Outcomes | Visual acuity (Teller acuity cards), plasma fatty acids and growth (including normalised data). Fagan test of infant development were reported for a subset at 12 months. | |
| Notes | Change of test format for infant development resulted in a smaller sample size than planned (sample size required n = 60, sample size assessed n = 27) — the authors comment on type 2 error resulting from the unplanned loss of power. Only the results from infants tested with the same version of the Fagan test used in their 1993 study were published and therefore available for the review. | |
| Risk of bias | ||
| Bias | Authors' judgement | Support for judgement |
| Random sequence generation (selection bias) | Unclear risk | Can't tell |
| Allocation concealment (selection bias) | Low risk | Yes (sealed envelopes) Stratification by gender |
| Blinding (performance bias and detection bias) | Low risk | Blinding of intervention: yes Blinding of outcome measurement: yes |
| Incomplete outcome data (attrition bias) | Low risk | Follow‐up complete |
| Selective reporting (reporting bias) | Low risk | |
| Other bias | Low risk | |
| Methods | Randomised controlled trial, single centre, the Netherlands. Infants were randomised to 2 groups to receive supplemented or control formula. Method of randomisation and concealment of random allocation unclear. Blinding of intervention unclear. Outcome assessors were blinded. Follow‐up complete (100 %). | |
| Participants | Healthy preterm infants (n = 22), "normally growing", were randomised to supplemented or control formula. Specific health characteristics, age at enrolment, and milk and caloric intake are not reported. Exclusion criteria not reported. Gestational age and birth weight in LCPUFA vs control groups were 31.0 ± 2.0 wk vs 31.0 ± 2.0 wk, and 1.16 ± 0.27 kg vs 1.15 ± 0.36 kg, respectively). | |
| Interventions | Infants in both groups were fed study formulae (80 kcal/100 mL) from enrolment until 7 months postnatal age. Composition of study formulae was nearly identical except for DHA and AA which were not present in control formula. Supplemented formula contained 0.64% DHA and 0.84% AA derived from single‐cell oils. | |
| Outcomes | Plasma phospholipid fatty acids, estimation of endogenous LCPUFA synthesis, weight at 7 months postnatal age. | |
| Notes | ||
| Risk of bias | ||
| Bias | Authors' judgement | Support for judgement |
| Random sequence generation (selection bias) | Unclear risk | Can't tell |
| Allocation concealment (selection bias) | Unclear risk | Can't tell |
| Blinding (performance bias and detection bias) | Low risk | Blinding of intervention: can't tell Blinding of outcome measurement: yes |
| Incomplete outcome data (attrition bias) | Low risk | Follow‐up complete |
| Selective reporting (reporting bias) | Low risk | |
| Other bias | Low risk | |
| Methods | Randomised controlled study, single centre, Canada. Intervention and outcome assessments were blinded and all subjects were followed. | |
| Participants | Medically stable preterm infants (n = 84), with AGA birth weights, who were receiving full enteral feeds by day 14 were randomised to control or one of three supplemented formulae. Infants were excluded or withdrawn (n = 18) if they received parenteral nutrition after 14 days of age, or they received steroids, red cell or plasma transfusions, or intravenous lipid after 8 days of age. 18 infants received the medium level LC PUFA supplement vs 18 the control formula (GA 31.9 ± 1.8 wk, BW 1.73 ± 0.44 kg vs GA 31.6 ± 2.3 wk, BW 1.74 ± 0.30 kg). | |
| Interventions | The control formula contained 12.8% LA and 1.4% ALA. There were three supplemented formulae: low (0.32% AA & 0.24% DHA), medium (0.49% AA & 0.35% DHA) and high (1.1% AA & 0.76% DHA). The AA and DHA were obtained from single cell oils. | |
| Outcomes | Fatty acids in erythrocyte membrane phospholipids, lymphocyte membrane phospholipids and plasma phospholipids were measured at 2 and 6 wk. Anthropometric measurements were recorded at birth, and at 2 and 6 wk of age. (6 wk measurement/38 weeks PMA entered as term data) | |
| Notes | The formula‐fed group receiving the medium level of LCPUFA supplementation had erythrocyte fatty acids similar to the breast milk‐fed group and therefore are included as the comparison with controls for this review. | |
| Risk of bias | ||
| Bias | Authors' judgement | Support for judgement |
| Random sequence generation (selection bias) | Unclear risk | Can't tell |
| Allocation concealment (selection bias) | Low risk | |
| Blinding (performance bias and detection bias) | Low risk | Blinding of intervention: yes Blinding of outcome measurement: yes |
| Incomplete outcome data (attrition bias) | Low risk | Follow‐up complete |
| Selective reporting (reporting bias) | Low risk | |
| Other bias | Low risk | |
| Methods | Randomised, double‐blinded, controlled trial, multicentre. Infants were randomised, stratified by birthweight (< 1000g, 1000 to 1500g, > 1500g), by computer‐generated assignment schedules to receive control formula or one of two supplemented formulae. Interventions and assessors of outcomes were blinded. Follow‐up was incomplete (50% to 60% for the primary outcome, 44% to 46% for neurodevelopment). | |
| Participants | Preterm infants ≤ 35 weeks were eligible if they had received < 10 days of enteral feedings > 30 ml/kg/day. Exclusion criteria: GI tract and liver abnormalities and/or disease including confirmed NEC, congenital abnormalities or diseases likely to interfere with evaluation. 361 infants were enrolled. BW (GA): algal/fungal DHA group: 1189 ± 34 g (29.4 ± 0.3 wk), fish/fungal DHA group: 1107 ± 31 g (28.8 ± 0.2 wk), BW of the control group: 1215 ± 33 g (29.6 ± 0.3 wk). In addition, there was a non‐randomised reference group of 105 breast‐fed term infants. | |
| Interventions | Infants were fed preterm formula from enrolment until near discharge (24 kcal/oz), discharge formula to 3 months post‐term (22 kcal/oz), and term formula to 12 months post‐term (20 kcal/oz). Each study group was provided with ready‐to‐use formulae, the only differences being the polyunsaturated fatty acid profiles due to absence of DHA and AA in control formula. There were 2 supplemented groups (algal/fungal oil or fish/fungal oil) and for the meta‐analysis in this review, we chose the algal/fungal group because a) microbial oils are very similar to human milk fat and b) results of the trial suggested superiority of algal/fungal over fish/fungal oil for the primary outcome of the trial. The supplemented formulae contained either 17 mg/100 kcal algal DHA and 34 mg/100 kcal fungal AA or 17 mg/100 kcal fish DHA and 34 mg/100 kcal fungal AA. The preterm supplemented formulae contained 18.6% LA and 2.4% ALA, 0.33% algal DHA, 0.33% fungal DHA vs 18.7% LA and 2.4% ALA in the control formula. | |
| Outcomes | Primary outcome was weight at 4 months and 12 months post‐term. Secondary outcomes included several anthropometric measurements over the first 18 months, neurodevelopment assessed by Bayley Scales of Infant Development (MDI, PDI) at 18 months post‐term, data on fluid intake, feeding tolerance and a range of blood tests (blood picture, cholesterol, glucose, tryglycerides, electrolytes and minerals, liver and kidney function tests), and adverse events. | |
| Notes | Change of enrolment criteria during study. Initially infants > 1500 g were included in the study. After an amendment of the protocol, only infants ≤ 1500 g were enrolled. Authors provided numerical data for growth and neurodevelopmental outcome (these appeared only in Figures in the publication) as well as methodological details. | |
| Risk of bias | ||
| Bias | Authors' judgement | Support for judgement |
| Random sequence generation (selection bias) | Low risk | Yes (computer‐generated randomisation schedules) |
| Allocation concealment (selection bias) | Low risk | Yes (using sealed opaque envelopes) |
| Blinding (performance bias and detection bias) | Low risk | Blinding of intervention: yes Blinding of outcome measurement: yes |
| Incomplete outcome data (attrition bias) | High risk | Follow‐up incomplete: Primary outcome of weight at 4 months and 12 months post‐term: 50% to 60% Neurodevelopment: 44% to 46% |
| Selective reporting (reporting bias) | Low risk | |
| Other bias | Low risk | |
| Methods | Infants were randomised to receive control formula or 1 of 2 supplemented formulae. It is unclear whether assessment was blinded or whether follow up was complete. | |
| Participants | Preterm infants (n = 194) with BW 0.86 to 1.56 kg. | |
| Interventions | The supplemented formulae contained either 0.15% algal DHA or 0.14% algal DHA and 0.27% fungal AA. The LA:ALA ratio of the control formula is not available. | |
| Outcomes | Anthropometric measurements and visual acuity (Teller acuity cards) were recorded at 2 and 4 months postconceptional age. | |
| Notes | Abstract only is available. The formula supplemented with DHA and AA was compared with control formula for this review. There was a breast milk‐fed reference group (n = 80). 194 infants were randomised. An assumption was made for this review that there were 64 per group. | |
| Risk of bias | ||
| Bias | Authors' judgement | Support for judgement |
| Random sequence generation (selection bias) | Unclear risk | Can't tell |
| Allocation concealment (selection bias) | Unclear risk | Can't tell |
| Blinding (performance bias and detection bias) | Unclear risk | Can't tell |
| Incomplete outcome data (attrition bias) | Unclear risk | Can't tell |
| Selective reporting (reporting bias) | Unclear risk | Can't tell |
| Other bias | Unclear risk | Can't tell |
| Methods | Randomised controlled trial, single centre, Italy. Infants were randomised on day 10 to supplemented or control formula. No allocation concealment and interventions were not blinded. It is not stated whether assessment of outcome was blinded. Follow‐up of subjects is complete. | |
| Participants | Preterm AGA infants were included if > 50% nutrition was enteral on day 10. Supplemented group: GA 31.1 ± 1.2 wk, BW 1583 ± 310 g, n = 21. Control group: GA 31.3 ± 1.2 wk, 1463 ± 273 g, n = 25. | |
| Interventions | Supplemented formula LA 10.8% to 12.2%, ALA 0.40% to 0.73%, DHA 0.23%, AA 0.23%. | |
| Outcomes | At 52 weeks PCA, flash visual evoked potentials (VEP), electroretinograms (ERG) and auditory responses were measured. | |
| Notes | 66 infants were enrolled, 17 of whom formed a breast milk‐fed reference group. The formula groups received up to 25% milk as breast milk. | |
| Risk of bias | ||
| Bias | Authors' judgement | Support for judgement |
| Random sequence generation (selection bias) | Unclear risk | Can't tell |
| Allocation concealment (selection bias) | High risk | No |
| Blinding (performance bias and detection bias) | Unclear risk | Blinding of intervention: no Blinding of outcome measurement: can't tell |
| Incomplete outcome data (attrition bias) | Low risk | Follow‐up complete |
| Selective reporting (reporting bias) | Low risk | |
| Other bias | High risk | Formula groups received up to 25% of milk as breast milk Methodology of assessment of VEP and ERG deviate from international standards |
| Methods | Double‐blind randomised controlled trial, single centre, Taiwan. Infants were randomised by drawing lots, intervention was double blinded, assessors of outcomes were probably blinded, follow‐up rate of neurodevelopmental assessment at 12 months was 81% to 94%. | |
| Participants | Preterm AGA 30 to 37 wk were eligible if they had normal fundus oculi and had not been started on oral feeds. 27 infants (intervention group: n = 16, control group: n = 11) were enrolled. Supplemented group BW 1980 ± 110 g, GA 33.3 ± 0.5 wk. Control group BW 1990 ± 120 g, GA 33.0 ± 0.5 wk. Exclusion criteria: breastfeeding, maternal diabetes or drug abuse, sepsis, chronic lung disease, PVL, surgical NEC, administration of products containing DHA or AA, mechanical ventilation after introducing feeds, and various other conditions and diseases. | |
| Interventions | Supplemented formula ("Neoangelac Plus") LA/ALA 10:1, DHA 0.05% and AA 0.1% from unicellular organisms. Control formula ("Neoangelac") LA/ALA 10:1, no added DHA/AA. Study formula was given from reaching 32 wk postconceptional age and weight > 2000 g for 6 months. | |
| Outcomes | Outcomes included neurodevelopment at 6 months and 12 months post‐term (Bayley Scales of Infant Development (MDI, PDI)), anthropometric measurements at 1, 2, 3, 4, 5, 6, 12 months, and visual acuity by steady state VEP, Lea grating cards, and 'Hiding Heidi' low contrast cards at 4 and 6 months after enrolment. | |
| Notes | Initially the authors planned to enrol 30 infants in each group, but because of increase in breastfeeding, strict exclusion criteria and an outbreak of SARS the number of included subjects was lower. | |
| Risk of bias | ||
| Bias | Authors' judgement | Support for judgement |
| Random sequence generation (selection bias) | Low risk | Probably adequate (drawing lots) |
| Allocation concealment (selection bias) | Unclear risk | Method used for allocation concealment not clear |
| Blinding (performance bias and detection bias) | Low risk | Blinding of intervention: yes Blinding of outcome measurement: yes |
| Incomplete outcome data (attrition bias) | Low risk | Follow‐up rate of primary outcome 81% to 94% |
| Selective reporting (reporting bias) | Low risk | |
| Other bias | Low risk | |
| Methods | Double‐blind randomised controlled trial, multicentre, UK. Infants were randomised, double‐blind, stratified by birthweight (< & > 1200g), centre‐wise in permuted blocks by independent personnel to receive supplemented or control formula. Assessment was blinded and follow‐up was complete. | |
| Participants | Preterm infants (n = 195) from 3 centres were included if BW < 1750g and fully formula fed by 10 days, and no congenital malformations. Supplemented group BW 1336 ± 284 g, GA 30.4 ± 2.3 wk. Control group BW 1353 ± 274 g, GA 30.3 ± 2.4 wk. | |
| Interventions | Control preterm formula contained 10.6 % fa LA and 0.7% fa ALA. Supplemented preterm formula contained 0.17% fa DHA, 0.31% fa AA and 0.04% fa EPA. Trial formula was fed for a mean ± SD of 33 ± 17 days. | |
| Outcomes | Primary outcome was neurodevelopment at 18 months post‐term. Bayley Scales of Infant Development (MDI, PDI) at 18 months post‐term. Knoblock, Passamanik & Sherrard's Developmental Screening Inventory at 9 months post‐term. Neurological impairment at 9 and 18 months post‐term. Growth in hospital and at 9 and 18 months post‐term. | |
| Notes | Funded by Numico Research BV (Wageningen, The Netherlands). | |
| Risk of bias | ||
| Bias | Authors' judgement | Support for judgement |
| Random sequence generation (selection bias) | Low risk | Yes |
| Allocation concealment (selection bias) | Low risk | Blinding of randomisation: yes Stratification by birth weight |
| Blinding (performance bias and detection bias) | Low risk | Blinding of intervention: yes Blinding of outcome measurement: yes |
| Incomplete outcome data (attrition bias) | Low risk | More than 80% follow‐up. Neurodevelopment follow‐up: at 9 months: 80/100 control & 78/95 intervention; at 18 months: 81/100 control & 69/95 intervention Growth follow‐up: at 9 months: 80/100 control & 78/95 intervention; at 18 months: 84/100 control & 74/95 intervention |
| Selective reporting (reporting bias) | Low risk | |
| Other bias | Low risk | |
| Methods | Randomised, double‐blinded trial, multicentre, UK. Infants were randomised, double‐blind, stratified by birthweight (< & > 1200g), centre‐wise in permuted blocks by independent personnel to receive supplemented or control formula. Outcome assessors were blinded and follow‐up rate for the primary outcome was 87% and 80% in treatment and control group respectively. | |
| Participants | Preterm infants (n = 238) from 5 UK centres were included if BW ≤ 2000 g and < 35 wk gestation if they received at least some of their enteral feeds as formula milk. They were enrolled when the attending paediatrician decided that infant formula should be started. Age at randomisation: supplemented group 14.3 ± 9.6 days. Control group 13.9 ± 10.4 days. Supplemented group BW 1487 ± 342 g, GA 31.2 ± 2.1 wk. Control group BW 1510 ± 326 g, GA 31.1 ± 1.9 wk. Exclusion criteria: congenital abnormalities known to affect growth or neurodevelopment. | |
| Interventions | Infants were fed preterm formula until the infant reached 2 kg or was discharged. After this point, post‐discharge (nutrient‐enriched) formula was given. Control preterm formula contained 11.5 % LA and 1.6 % ALA. Supplemented preterm formula contained 12.3 % LA, 1.5 % ALA, 0.5 % DHA, 0.9% C18:3 n‐6 gamma‐LA, 0.04 % AA and 0.1 % EPA (borage/fish oil) . Formula was given from enrolment to 9 months post term. | |
| Outcomes | Primary outcome was neurodevelopment at 18 months post‐term. Bayley Scales of Infant Development (MDI, PDI) at 18 months post‐term. Knoblock, Passamanik & Sherrard's Developmental Screening Inventory at 9 months post‐term. Neurological impairment at 9 and 18 months post‐term. Growth in hospital and at 9 and 18 months post‐term. Adverse events. | |
| Notes | Supported by a grant from H. J. Heinz Company who also provided the study formulas. | |
| Risk of bias | ||
| Bias | Authors' judgement | Support for judgement |
| Random sequence generation (selection bias) | Low risk | Yes. Infants were randomised, double‐blind, stratified by birthweight (< & > 1200g), centre‐wise in permuted blocks by independent personnel to receive supplemented or control formula. |
| Allocation concealment (selection bias) | Low risk | Yes "dietary allocations stored in sealed opaque envelopes" |
| Blinding (performance bias and detection bias) | Low risk | Blinding of intervention: yes Blinding of outcome measurement: yes |
| Incomplete outcome data (attrition bias) | Low risk | Follow‐up rate of primary outcome 80% to 87% |
| Selective reporting (reporting bias) | Low risk | |
| Other bias | Low risk | |
| Methods | Double blind, randomised, controlled study, multicentre, USA. Infants were randomised, double‐blind, to 3 groups based on gender and stratified by birth weight (750 to 1250 g/1251 to 1800 g) in permuted blocks to receive supplemented or control formula. Intervention was blinded. Outcome assessors were blinded. Follow‐up rate of anthropometrics at 4 months was 92% and 77% in treatment and control group respectively. Follow‐up rate at 12 months was 77% in both treatment and control group. | |
| Participants | 40 infants < 33 wk gestation and between 750 and 1800 g birth weight and < 28 days (control n = 13, fungal/fish n = 13, egg‐TG/fish N = 14). Supplemented groups: fungal/fish: BW 1424 ± 331 g, GA 30.6 ± 2.5 wk; egg/fish: BW 1367 ± 242 g, GA 30.4 ± 2.1 wk; control group BW 1322 ± 270 g, GA 30.0 ± 2.3 wk. Exclusions include serious congenital malformations, major surgery, asphyxia, PVL and IVH > grade 2 and serious systemic infection. | |
| Interventions | Infants were fed preterm formula until term‐corrected age then post‐discharge nutrient‐enriched formula until 12 months post‐term. There were two supplemented groups (fungal/fish oil or egg‐TG/fish oil) and, for this meta‐analysis and review, we chose the fungal/fish group as microbial oils are more similar to human milk fat than egg‐TG. Supplemented formula contained 0.42% AA and 0.27% DHA until term, and then 0.42% AA and 0.16% DHA until 12 months. Control formula contained 16% to 19% LA and 2.5% ALA. Infants in all groups also received human milk, for example at term, 33% control and 50% supplemented infants consumed human milk at least once per day. | |
| Outcomes | Primary outcome was body composition as measured by absorptiometric x‐ray techniques (DEXA) at 4 months post‐term. Other outcomes included body composition and anthropometrics at 35 wk and 40 wk corrected age, 4 months and 12 months post‐term. Biochemical outcomes included blood fatty acid profiles. | |
| Notes | 20 of the 60 participants of this study are already included in the multicentre trial O'Connor 2001. The authors clarified methodological details and provided anthropometric raw data of the 40 infants who were not included in O'Connor 2001. | |
| Risk of bias | ||
| Bias | Authors' judgement | Support for judgement |
| Random sequence generation (selection bias) | Low risk | Infants were randomised, double‐blind, to 3 groups based on gender and stratified by birth weight (750 to 1250 g/1251 to 1800 g) in permuted blocks to receive supplemented or control formula. |
| Allocation concealment (selection bias) | Low risk | Yes |
| Blinding (performance bias and detection bias) | Low risk | Blinding of intervention: yes Blinding of outcome measurement: yes |
| Incomplete outcome data (attrition bias) | Low risk | Follow‐up rate of primary outcome of body composition at 4 months post‐term: 77% to 92% Follow‐up rate at 12 months post‐term: 77% |
| Selective reporting (reporting bias) | Low risk | |
| Other bias | Low risk | |
| Methods | Double‐blind randomised controlled study, multicentre, North America. Double‐blind prospective randomised trial (blinding of assessment unclear). Infants randomised to 1 of 3 formulae by computer‐generated randomisation schedules. 2 different codes were used for each of the formulae to ensure blinding. Follow‐up was complete. | |
| Participants | 194 healthy preterm infants BW 846 to 1560 g. Exclusion: small for gestational age, > 24 days of age when full enteral feeds tolerated, NEC or other GI disease, impaired vision, disease/congenital malformation that may impair growth. Supplemented GA 29.7 ± 1.7 wk, BW 1.28 ± 0.18 g, n = 66. Control GA 29.5 ± 1.7 wk, BW 1.23 ± 0.18 g, n = 62. | |
| Interventions | There were 3 preterm formulas: control (21% to 22% LA, 3% to 3.1% ALA); 2 supplemented (0.34% DHA from DHA‐enriched oil, or 0.33% DHA and 0.60% AA from algal/fungal oils; neither had EPA). For this meta‐analysis and review, we chose the supplement with DHA and AA. Formulae were fed from when 50 kcal/kg/d was tolerated, for at least 28 days until discharge. Term formula without DHA and AA was fed after discharge. | |
| Outcomes | RBC fatty acids at discharge and 48 wk PMA. Anthropometrics at 40, 48 and 57 wk PMA. Visual acuity (Teller acuity cards) at 48 and 57 wk PMA. | |
| Notes | Sponsored by Mead Johnson Nutritionals, Indiana. | |
| Risk of bias | ||
| Bias | Authors' judgement | Support for judgement |
| Random sequence generation (selection bias) | Low risk | Yes (computer‐generated randomisation schedules) |
| Allocation concealment (selection bias) | Unclear risk | Method used for allocation concealment not clear |
| Blinding (performance bias and detection bias) | Unclear risk | Blinding of intervention: yes Blinding of outcome measurement: can't tell |
| Incomplete outcome data (attrition bias) | Low risk | 173/194 "completed the premature formula feeding phase" "All infants with available data were included in the analysis of result". For growth, lowest follow‐up was 77%. For visual acuity, follow‐up rates were: 51/62 control & 57/66 DHA + ARA at 48 weeks and 46/62 control & 55/66 DHA + ARA at 57 weeks |
| Selective reporting (reporting bias) | Low risk | |
| Other bias | Low risk | |
| Methods | Infants were randomised, double‐blind, to 2 groups to receive supplemented or control formula. Allocation was concealed using sealed opaque envelopes. Intervention was blinded. Outcome assessors were blinded. Follow‐up rate of anthropometrics at 3 months and 6 months post‐term was 100%. | |
| Participants | 23 healthy preterm infants, BW 700 to 1500 g. Exclusion: major neonatal morbidity (e.g. congenital malformations, respiratory treatment for more than 10 days, congenital infection, NEC, bowel resection), postnatal age > 21 days, supplemental oxygen, or treatments that could influence growth and development (e.g. diuretics or corticosteroids), failure to achieve full enteral feeds (150 ml/kg/d) by 21 days of life, maternal history of substance abuse, diabetes, hyperlipidaemia, or abnormal dietary patterns (strict vegetarian diet). Supplemented GA 29.4 ± 1.4 wk, BW 1.28 ± 0.17 kg, n = 11. Control GA 29.7 ± 1.7 wk, BW 1.24 ± 0.16 kg, n = 12. | |
| Interventions | Enteral feeding of all infants was started during the first week of life using pooled, pasturized breast milk. Formula feeding began during the first 3 weeks of life if mothers had decided not to breast feed. Infants were fed preterm formula from enrolment until term‐corrected age. After this point, term formula was given until 4 months post‐term. Control preterm formula contained 18.0% LA and 1.6% ALA. Supplemented preterm formula contained 17.8% LA, 1.1% ALA, 0.37% DHA, 0.02% AA and 0.05% EPA (LCPUFA from fish oil). | |
| Outcomes | RBC fatty acids and anthropometrics at enrolment, discharge, term‐corrected age, 3 and 6 months post‐term. Primary outcome was RBC DHA content. | |
| Notes | This study also reported on a non‐randomised control group of breast‐fed infants (n = 10) who are not subject of this review. | |
| Risk of bias | ||
| Bias | Authors' judgement | Support for judgement |
| Random sequence generation (selection bias) | Low risk | Yes |
| Allocation concealment (selection bias) | Low risk | Yes (using sealed envelopes) |
| Blinding (performance bias and detection bias) | Low risk | Blinding of intervention: yes Blinding of outcome measurement: yes |
| Incomplete outcome data (attrition bias) | Low risk | Follow‐up complete |
| Selective reporting (reporting bias) | Low risk | |
| Other bias | Low risk | |
| Methods | Double‐blind, randomised controlled study, multicentre, UK and North America. Infants were randomised to 3 groups based on centre, gender, BW stratified 750 to 1250 g and 1251 to 1800 g. Infants were enrolled from 8 centres in UK and North America. It is assumed that the study was double‐blind but this is not clearly stated. Assessment was blinded and follow‐up was complete. | |
| Participants | 470 infants < 33 wk gestation and between BW 750 and 1805 g and < 28 days age (control n = 144, fungal/fish n = 140, egg‐TG/fish N = 143, human milk exclusively n = 43). Exclusions include serious congenital malformations, major surgery, asphyxia, PVL and IVH > grade 2 and serious systemic infection. Supplemented group BW 1305 ± 293. | |
| Interventions | Infants fed preterm formula until term corrected age then post‐discharge (nutrient‐enriched) formula until 12 months post‐term. There were 2 supplemented groups (fish/fungal oil or egg‐TG/fish oil) and, for this meta‐analysis and review, we chose the fish/fungal group as microbial oils are more similar to human milk fat than egg‐TG, and there were minimal differences between fish/fungal and egg‐TG/fish groups. Supplemented formula contained 0.42% AA and 0.26% DHA until term, and then 0.42% AA and 0.16% DHA until 12 months. Control formula contained 16% to 19% LA and 2.5% ALA. Infants in all groups also received human milk, for example at term, 35% control and 28% supplemented infants consumed human milk at least once per day. | |
| Outcomes | Primary outcome was Bayley Scales of Infant development at 12 months. Visual acuity was assessed by Teller acuity cards at 2, 4 and 6 months' corrected age, and by VEP in 2/8 centres at 4 and 6 months' corrected age. Fagan test of Infant Intelligence was administered at 6 and 9 months' corrected age. MacArthur Communicative Development Inventories was administered at 9 and 14 months' corrected age. Growth was measured at term and 2, 4, 6, 9 and 12 months. | |
| Notes | Sponsored by Ross Products Division, Abbott Laboratories, Ohio. | |
| Risk of bias | ||
| Bias | Authors' judgement | Support for judgement |
| Random sequence generation (selection bias) | Low risk | Yes |
| Allocation concealment (selection bias) | Low risk | Yes Stratification by gender and birth weight |
| Blinding (performance bias and detection bias) | Low risk | Blinding of intervention: yes Blinding of outcome measurement: yes |
| Incomplete outcome data (attrition bias) | Low risk | 80% of the enrolled infants completed the study to 12 months' corrected age. |
| Selective reporting (reporting bias) | Low risk | |
| Other bias | Low risk | |
| Methods | Outcome assessment was blinded but it is not stated whether randomisation and intervention were blinded. Follow‐up of subjects was complete. | |
| Participants | Supplemented group GA 30.7 ± 1.2 wk, BW 1281 ± 101 g. Control groups a) GA 30.9 ± 1.6 wk, BW 1340 ± 106 g, b) GA 29.6 ± 1.6 wk, BW 1224 ± 92 g. | |
| Interventions | Infants were fed study formulae, on average, from day 10 to day 45. Infants were randomised to the supplemented group who received soy/marine oil (LA 20.4%, ALA 1.4%, n‐6 0.1%, n‐3 1.0%) or control group a) corn oil (LA 24.2%, ALA 0.5%) or control group b) soy oil (LA 20.8%, ALA 2.7%). | |
| Outcomes | ERG at 36 wk and 57 wk PCA. VEP acuity at 36 & 57 wk PCA. FPL acuity at 57 wk PCA. Lipid peroxidation products (TBARS) or thiobarbituric acid reactive substances expressed as ‐azide/+azide × 100% which normalises for individual variation, high % suggests a high capacity for lipid peroxidation. Infant bleeding times 57 wk PCA. RBC membrane fluidity at 25 and 37 degrees. Growth at 40 wk, 48 wk and 57 wk PCA. | |
| Notes | For the purpose of this analysis, control group b) was used as the LA:ALA ratio is most similar to other studies and current commercial formula. | |
| Risk of bias | ||
| Bias | Authors' judgement | Support for judgement |
| Random sequence generation (selection bias) | Unclear risk | Can't tell |
| Allocation concealment (selection bias) | Unclear risk | Method used for allocation concealment not clear. |
| Blinding (performance bias and detection bias) | Low risk | Blinding of intervention: can't tell Blinding of outcome measurement: yes |
| Incomplete outcome data (attrition bias) | Low risk | Follow‐up rate of 95% (42/44). |
| Selective reporting (reporting bias) | Low risk | |
| Other bias | Low risk | |
| Methods | Double‐blind, randomised controlled study, single centre, Sweden. Double‐blind study with complete follow‐up. Infants were randomised using computer‐generated random list and applied by an independent research officer. Assessment was blinded and follow up was complete. | |
| Participants | Preterm infants (< 34 wk GA and < 1750 g). Supplemented group BW 1.282 ± 0.316 kg, GA 30.4 ± 1.5 wk, n = 22. Control group BW 1.30 ± 0.257 g, GA 30.4 ± 1.6 wk , n = 20. Inclusion criteria: normal neurological examination and cerebral ultrasounds. Exclusion criteria: significant cerebral damage, retinopathy, chronic disease or feeding problems. | |
| Interventions | Supplemented preterm and term formula contained 0.34% DHA and 0.68% AA from micro algae. LA and ALA levels are not given. Preterm formula was fed until a weight of 3 kg. Infants then received a term formula with or without supplement as per randomisation until 6 months' corrected age. | |
| Outcomes | Cerebral myelination assessed by magnetic resonance imaging (MRI). Bayley Scales of Infant Development (MDI, PDI), visual acuity by flash VEP and Teller cards, RBC and plasma fatty acids. | |
| Notes | Sponsored by Nutricia, Numico Research. | |
| Risk of bias | ||
| Bias | Authors' judgement | Support for judgement |
| Random sequence generation (selection bias) | Low risk | Yes (computer‐generated randomisation schedules) |
| Allocation concealment (selection bias) | Low risk | Yes |
| Blinding (performance bias and detection bias) | Low risk | Blinding of intervention: yes Blinding of outcome measurement: yes |
| Incomplete outcome data (attrition bias) | Low risk | Follow‐up complete |
| Selective reporting (reporting bias) | Low risk | |
| Other bias | Low risk | |
| Methods | Randomisation computerised and stratified by BW (750 to 1000 g, 1001 to 1500 g, 1501 to 2000 g). Blinding by coded labels and verified by "trained sensory panel". It is unclear whether assessment was blinded. Follow‐up was complete. | |
| Participants | Supplemented group BW 1522 ± 370 g, GA 31.0 ± 2.5 wk, n = 77. Control group BW 1484 ± 365, GA 30.8 ± 2.7, n = 78. Inclusion criteria: preterm BW 750 to 2000 g, 0 to 28 days of age, medically stable, received enteral feeds for < 24 h, AGA. Exclusion criteria: significant acute/chronic illness, systemic infections, major congenital malformations, IVH > grade 2, PVL, seizures. Withdrawal criteria: if BW > 1000g and full enteral feeds not attained by day 28; if BW 750 to 1000 g and full enteral feeds not attained by day 42; for all infants, if unable to tolerate full enteral feeds; or need for mechanical ventilation after full enteral feeds attained; or oxygen dependency at 36 wk PCA; and/or > 5‐day course steroids. Infants enrolled from 16 sites. | |
| Interventions | Supplemented preterm formula LA 12.1% fa, ALA 1.5% fa, AA 0.50% fa and DHA 0.35% (LCPUFA from single cell oil source). Control preterm formula LA 12.8% fa, ALA 1.4% fa, AA and DHA 0%. Infants were fed 1 of 2 preterm formulas, with or without LCPUFA, until 48 weeks PCA . All infants were then fed a standard term formula (unsupplemented) until 92 wk PCA. | |
| Outcomes | Anthropometrics, adverse events and plasma fatty acids were measured to 92 wk PCA. | |
| Notes | Sponsored by Wyeth Nutritionals International, Philadelphia, Pennsylvania, USA | |
| Risk of bias | ||
| Bias | Authors' judgement | Support for judgement |
| Random sequence generation (selection bias) | Low risk | Yes (computer‐generated randomisation schedules) |
| Allocation concealment (selection bias) | Low risk | Yes (coded labels) Stratification by birth weight |
| Blinding (performance bias and detection bias) | Unclear risk | Blinding of intervention: yes Blinding of outcome measurement: can't tell |
| Incomplete outcome data (attrition bias) | Low risk | Follow up complete. |
| Selective reporting (reporting bias) | Low risk | |
| Other bias | Low risk | |
AA = arachidonic acid
AGA = appropriate for gestational age
ALA = alpha linolenic acid
BW = birth weight
DHA = docosahexaenoic acid
EPA = eicosapentaenoic acid
ERG = electroretinogram
fa = fatty acid
g = gram(s)
GA = gestational age
h = hour(s)
IVH = intraventricular haemorrhage
LA = linoleic acid
NEC = necrotizing enterocolitis
PCA = postconceptional age
PVL = periventricular leukomalacia
RBC = red blood cell
wk = week(s)
Characteristics of excluded studies [ordered by study ID]
Ir a:
| Study | Reason for exclusion |
| Preterm infants in the intervention and control arm received human milk. It was not a RCT comparing LCPUFA versus no LCPUFA‐supplemented formula milk in preterm infants. | |
| Compared effects of formula containing different ratios of LCPUFA (2:1 AA:DHA (omega‐6: omega‐3) ratio to 1:1 AA:DHA ratio in preterm infants < 1500g and/or between 25 to 32 weeks' gestational age. It was not a RCT comparing LCPUFA versus no LCPUFA‐supplemented formula milk in preterm infants. | |
| Compared effects of enteral DHA supplementation (50mg/day) in addition to standard nutrition for preterm infants. Outcome measure was blood fatty acid levels, not clinical outcomes. | |
| Reported the effect of higher‐dose DHA supplementation compared with standard DHA on growth in infants who participated in the DINO trial (infants born < 33 weeks' gestation). It was not a RCT comparing LCPUFA‐supplemented versus unsupplemented formula milk. | |
| Reported the effect of higher‐dose DHA on growth of pre‐term infants receiving breast milk and/or formula to 18 months CA compared to standard feeding practice. It was not a RCT comparing LCPUFA‐supplemented versus unsupplemented formula milk. | |
| Follow up at 7 years' corrected age of infants who participated in the DINO RCT. Determined if improvements in cognitive outcome detected at 18 months' corrected age in infants born < 33 weeks' gestation receiving a high DHA compared with standard DHA diet were sustained in early childhood. It was not a RCT comparing LCPUFA‐supplemented versus unsupplemented formula milk. | |
| This was an RCT but published only in abstract form (conference proceedings). Data were inadequate to assess this study. | |
| This randomised study measured anthropometric data and fatty acid profiles within the study period of 28 days. The study was excluded because there were no follow‐up data beyond 28 days. | |
| This was an RCT but published only in abstract form (conference proceedings). Data were inadequate to assess this study. | |
| Compared neurodevelopmental outcome of preterm infants fed high‐dose DHA to standard dose DHA. It was not a RCT comparing LCPUFA‐supplemented versus unsupplemented formula milk. | |
| This trial compared LCPUFA supplemented formula with breast feeding and was not randomised. It was not a RCT comparing LCPUFA‐supplemented versus unsupplemented formula milk. | |
| Review article summarising Cochrane review of LCPUFA in term and preterm infants. | |
| Compared visual responses of preterm infants fed human milk and formula with high DHA concentration to standard DHA concentration. It was not a RCT comparing LCPUFA‐supplemented versus unsupplemented formula milk. | |
| Determined the effect of increasing the DHA concentration of human milk and formula on circulating fatty acids of preterm infants. It was not a RCT comparing LCPUFA‐supplemented versus unsupplemented formula milk. | |
| Follow up of DINO (DHA for the improvement of neurodevelopmental outcome in preterm infants) trial. Evaluated the effect of higher‐DHA milk on behaviour and language development in early childhood. It was not a RCT comparing LCPUFA‐supplemented versus unsupplemented formula milk. | |
| Determined associations between growth and erythrocyte(RBC) DHA and AA in preterm infants. It was not a RCT comparing LCPUFA‐supplemented versus unsupplemented formula milk. |
Data and analyses
| Outcome or subgroup title | No. of studies | No. of participants | Statistical method | Effect size |
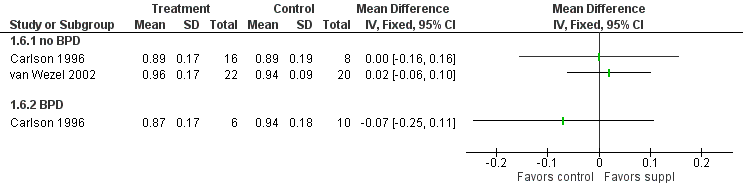
| 1 Visual acuity (log cycles/degree) at term Show forest plot | 1 | Mean Difference (IV, Fixed, 95% CI) | Totals not selected | |
| Analysis 1.1  Comparison 1 Supplement vs control, Outcome 1 Visual acuity (log cycles/degree) at term. | ||||
| 1.1 no BPD | 1 | Mean Difference (IV, Fixed, 95% CI) | 0.0 [0.0, 0.0] | |
| 1.2 BPD | 1 | Mean Difference (IV, Fixed, 95% CI) | 0.0 [0.0, 0.0] | |
| 2 Visual acuity (log cycles/degree) at 2 months post‐term Show forest plot | 3 | Mean Difference (IV, Fixed, 95% CI) | Totals not selected | |
| Analysis 1.2  Comparison 1 Supplement vs control, Outcome 2 Visual acuity (log cycles/degree) at 2 months post‐term. | ||||
| 2.1 no BPD | 3 | Mean Difference (IV, Fixed, 95% CI) | 0.0 [0.0, 0.0] | |
| 2.2 BPD | 1 | Mean Difference (IV, Fixed, 95% CI) | 0.0 [0.0, 0.0] | |
| 3 Visual acuity (log cycles/ degree) at 4 months post‐term Show forest plot | 3 | Mean Difference (IV, Fixed, 95% CI) | Totals not selected | |
| Analysis 1.3  Comparison 1 Supplement vs control, Outcome 3 Visual acuity (log cycles/ degree) at 4 months post‐term. | ||||
| 3.1 no BPD | 3 | Mean Difference (IV, Fixed, 95% CI) | 0.0 [0.0, 0.0] | |
| 3.2 BPD | 1 | Mean Difference (IV, Fixed, 95% CI) | 0.0 [0.0, 0.0] | |
| 4 Visual acuity (log cycles /degree) at 6 months post‐term Show forest plot | 2 | Mean Difference (IV, Fixed, 95% CI) | Totals not selected | |
| Analysis 1.4  Comparison 1 Supplement vs control, Outcome 4 Visual acuity (log cycles /degree) at 6 months post‐term. | ||||
| 4.1 no BPD | 2 | Mean Difference (IV, Fixed, 95% CI) | 0.0 [0.0, 0.0] | |
| 4.2 BPD | 1 | Mean Difference (IV, Fixed, 95% CI) | 0.0 [0.0, 0.0] | |
| 5 Visual acuity (log cycles/degree) at 9 months post‐term Show forest plot | 1 | Mean Difference (IV, Fixed, 95% CI) | Totals not selected | |
| Analysis 1.5  Comparison 1 Supplement vs control, Outcome 5 Visual acuity (log cycles/degree) at 9 months post‐term. | ||||
| 5.1 no BPD | 1 | Mean Difference (IV, Fixed, 95% CI) | 0.0 [0.0, 0.0] | |
| 5.2 BPD | 1 | Mean Difference (IV, Fixed, 95% CI) | 0.0 [0.0, 0.0] | |
| 6 Visual acuity (log cycles/degree) at 12 months post‐term Show forest plot | 2 | Mean Difference (IV, Fixed, 95% CI) | Totals not selected | |
| Analysis 1.6  Comparison 1 Supplement vs control, Outcome 6 Visual acuity (log cycles/degree) at 12 months post‐term. | ||||
| 6.1 no BPD | 2 | Mean Difference (IV, Fixed, 95% CI) | 0.0 [0.0, 0.0] | |
| 6.2 BPD | 1 | Mean Difference (IV, Fixed, 95% CI) | 0.0 [0.0, 0.0] | |
| 7 Rod ERG at 36 wk PCA Show forest plot | 1 | Mean Difference (IV, Fixed, 95% CI) | Totals not selected | |
| Analysis 1.7 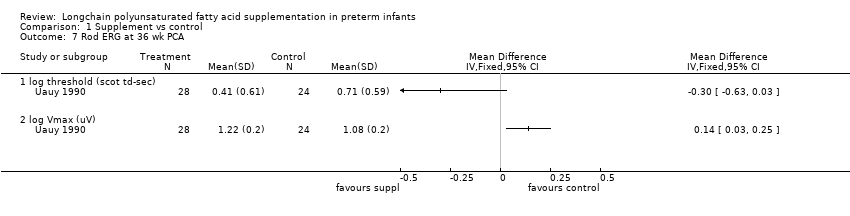 Comparison 1 Supplement vs control, Outcome 7 Rod ERG at 36 wk PCA. | ||||
| 7.1 log threshold (scot td‐sec) | 1 | Mean Difference (IV, Fixed, 95% CI) | 0.0 [0.0, 0.0] | |
| 7.2 log Vmax (uV) | 1 | Mean Difference (IV, Fixed, 95% CI) | 0.0 [0.0, 0.0] | |
| 8 ERG at 3 months post‐term, amplitude (uV) Show forest plot | 1 | Mean Difference (IV, Fixed, 95% CI) | Totals not selected | |
| Analysis 1.8  Comparison 1 Supplement vs control, Outcome 8 ERG at 3 months post‐term, amplitude (uV). | ||||
| 9 Rod ERG at 4 months post‐term Show forest plot | 1 | Mean Difference (IV, Fixed, 95% CI) | Totals not selected | |
| Analysis 1.9  Comparison 1 Supplement vs control, Outcome 9 Rod ERG at 4 months post‐term. | ||||
| 9.1 log threshold (scot td‐sec) | 1 | Mean Difference (IV, Fixed, 95% CI) | 0.0 [0.0, 0.0] | |
| 9.2 log Vmax (uV) | 1 | Mean Difference (IV, Fixed, 95% CI) | 0.0 [0.0, 0.0] | |
| 10 VEP at 3 months post‐term Show forest plot | 1 | Mean Difference (IV, Fixed, 95% CI) | Totals not selected | |
| Analysis 1.10 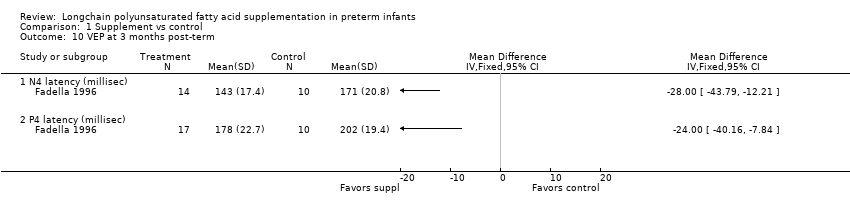 Comparison 1 Supplement vs control, Outcome 10 VEP at 3 months post‐term. | ||||
| 10.1 N4 latency (millisec) | 1 | Mean Difference (IV, Fixed, 95% CI) | 0.0 [0.0, 0.0] | |
| 10.2 P4 latency (millisec) | 1 | Mean Difference (IV, Fixed, 95% CI) | 0.0 [0.0, 0.0] | |
| 11 Fagan infant test at 12 months post‐term Show forest plot | 2 | Mean Difference (IV, Fixed, 95% CI) | Subtotals only | |
| Analysis 1.11 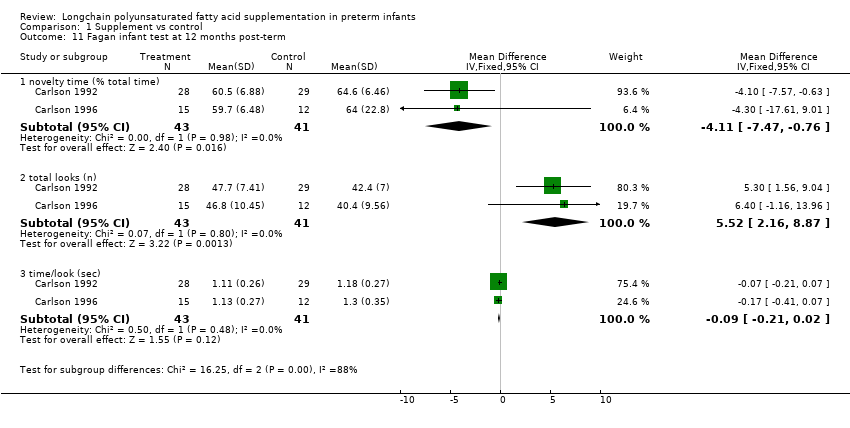 Comparison 1 Supplement vs control, Outcome 11 Fagan infant test at 12 months post‐term. | ||||
| 11.1 novelty time (% total time) | 2 | 84 | Mean Difference (IV, Fixed, 95% CI) | ‐4.11 [‐7.47, ‐0.76] |
| 11.2 total looks (n) | 2 | 84 | Mean Difference (IV, Fixed, 95% CI) | 5.52 [2.16, 8.87] |
| 11.3 time/look (sec) | 2 | 84 | Mean Difference (IV, Fixed, 95% CI) | ‐0.09 [‐0.21, 0.02] |
| 12 Fagan infant test at 9 months post‐term (% total time) Show forest plot | 2 | Mean Difference (IV, Fixed, 95% CI) | Subtotals only | |
| Analysis 1.12 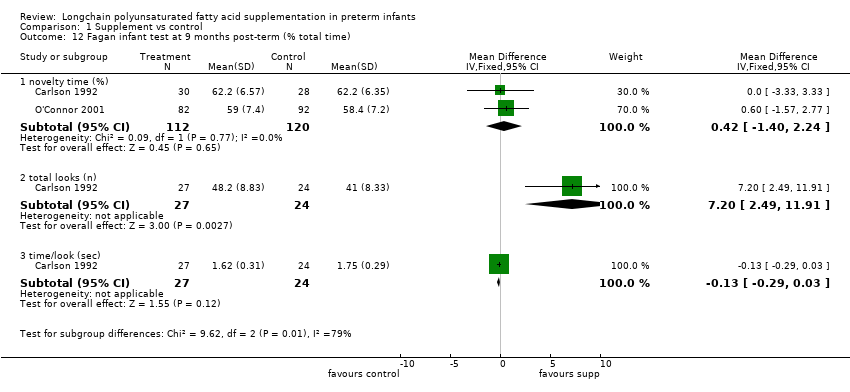 Comparison 1 Supplement vs control, Outcome 12 Fagan infant test at 9 months post‐term (% total time). | ||||
| 12.1 novelty time (%) | 2 | 232 | Mean Difference (IV, Fixed, 95% CI) | 0.42 [‐1.40, 2.24] |
| 12.2 total looks (n) | 1 | 51 | Mean Difference (IV, Fixed, 95% CI) | 7.20 [2.49, 11.91] |
| 12.3 time/look (sec) | 1 | 51 | Mean Difference (IV, Fixed, 95% CI) | ‐0.13 [‐0.29, 0.03] |
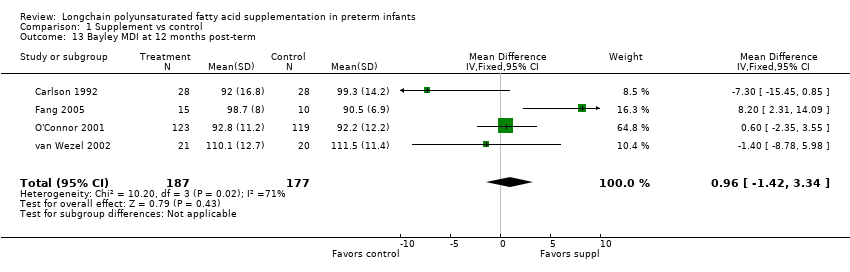
| 13 Bayley MDI at 12 months post‐term Show forest plot | 4 | 364 | Mean Difference (IV, Fixed, 95% CI) | 0.96 [‐1.42, 3.34] |
| Analysis 1.13  Comparison 1 Supplement vs control, Outcome 13 Bayley MDI at 12 months post‐term. | ||||
| 14 Bayley PDI at 12 months post‐term Show forest plot | 4 | 353 | Mean Difference (IV, Fixed, 95% CI) | 0.23 [‐2.77, 3.22] |
| Analysis 1.14 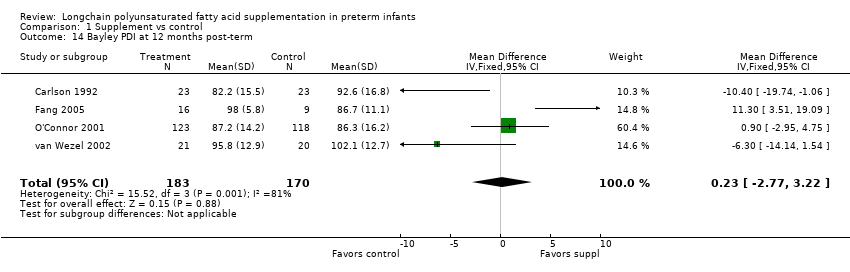 Comparison 1 Supplement vs control, Outcome 14 Bayley PDI at 12 months post‐term. | ||||
| 15 Weight at 6 wk post‐term (kg) Show forest plot | 1 | Mean Difference (IV, Fixed, 95% CI) | Subtotals only | |
| Analysis 1.15 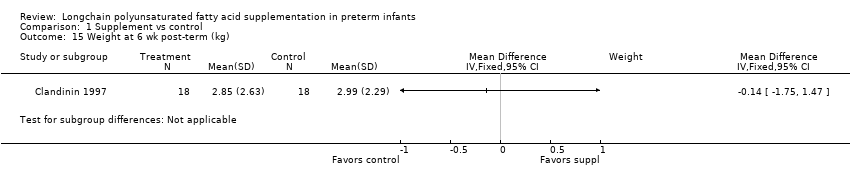 Comparison 1 Supplement vs control, Outcome 15 Weight at 6 wk post‐term (kg). | ||||
| 16 Length at 6 wk post‐term (cm) Show forest plot | 1 | Mean Difference (IV, Fixed, 95% CI) | Subtotals only | |
| Analysis 1.16  Comparison 1 Supplement vs control, Outcome 16 Length at 6 wk post‐term (cm). | ||||
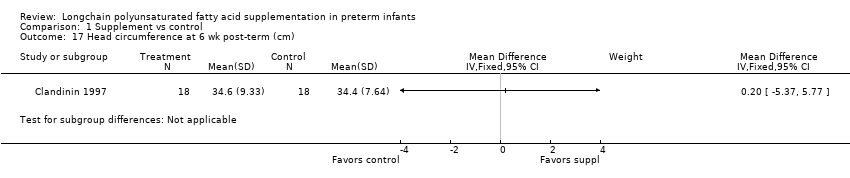
| 17 Head circumference at 6 wk post‐term (cm) Show forest plot | 1 | Mean Difference (IV, Fixed, 95% CI) | Subtotals only | |
| Analysis 1.17  Comparison 1 Supplement vs control, Outcome 17 Head circumference at 6 wk post‐term (cm). | ||||
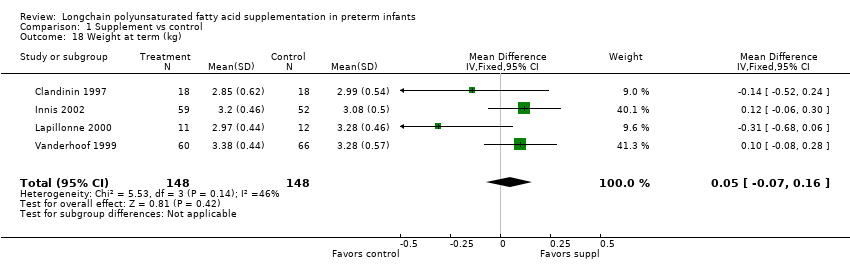
| 18 Weight at term (kg) Show forest plot | 4 | 296 | Mean Difference (IV, Fixed, 95% CI) | 0.05 [‐0.07, 0.16] |
| Analysis 1.18  Comparison 1 Supplement vs control, Outcome 18 Weight at term (kg). | ||||
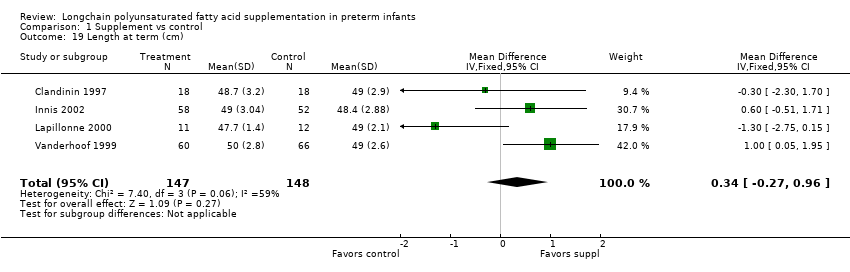
| 19 Length at term (cm) Show forest plot | 4 | 295 | Mean Difference (IV, Fixed, 95% CI) | 0.34 [‐0.27, 0.96] |
| Analysis 1.19  Comparison 1 Supplement vs control, Outcome 19 Length at term (cm). | ||||
| 20 Head circ at term (cm) Show forest plot | 3 | 185 | Mean Difference (IV, Fixed, 95% CI) | 0.18 [‐0.26, 0.62] |
| Analysis 1.20  Comparison 1 Supplement vs control, Outcome 20 Head circ at term (cm). | ||||
| 21 Weight at 2 months post‐term (kg) Show forest plot | 5 | 485 | Mean Difference (IV, Fixed, 95% CI) | 0.21 [0.08, 0.33] |
| Analysis 1.21  Comparison 1 Supplement vs control, Outcome 21 Weight at 2 months post‐term (kg). | ||||
| 22 Length at 2 months post‐term (cm) Show forest plot | 4 | 297 | Mean Difference (IV, Fixed, 95% CI) | 0.47 [0.00, 0.94] |
| Analysis 1.22  Comparison 1 Supplement vs control, Outcome 22 Length at 2 months post‐term (cm). | ||||
| 23 Head circumference at 2 months post‐term (cm) Show forest plot | 3 | 187 | Mean Difference (IV, Fixed, 95% CI) | 0.03 [‐0.33, 0.38] |
| Analysis 1.23  Comparison 1 Supplement vs control, Outcome 23 Head circumference at 2 months post‐term (cm). | ||||
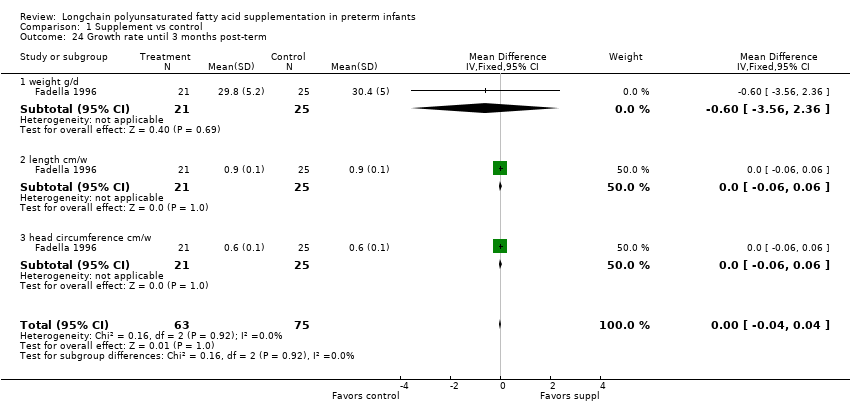
| 24 Growth rate until 3 months post‐term Show forest plot | 1 | 138 | Mean Difference (IV, Fixed, 95% CI) | ‐0.00 [‐0.04, 0.04] |
| Analysis 1.24  Comparison 1 Supplement vs control, Outcome 24 Growth rate until 3 months post‐term. | ||||
| 24.1 weight g/d | 1 | 46 | Mean Difference (IV, Fixed, 95% CI) | ‐0.60 [‐3.56, 2.36] |
| 24.2 length cm/w | 1 | 46 | Mean Difference (IV, Fixed, 95% CI) | 0.0 [‐0.06, 0.06] |
| 24.3 head circumference cm/w | 1 | 46 | Mean Difference (IV, Fixed, 95% CI) | 0.0 [‐0.06, 0.06] |
| 25 Weight at 4 months post‐term (kg) Show forest plot | 6 | 489 | Mean Difference (IV, Fixed, 95% CI) | 0.14 [‐0.01, 0.29] |
| Analysis 1.25 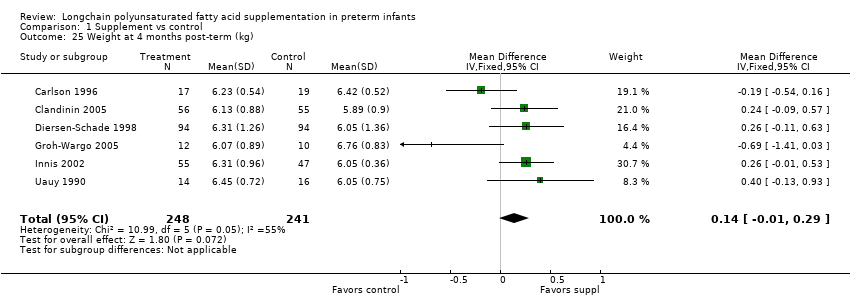 Comparison 1 Supplement vs control, Outcome 25 Weight at 4 months post‐term (kg). | ||||
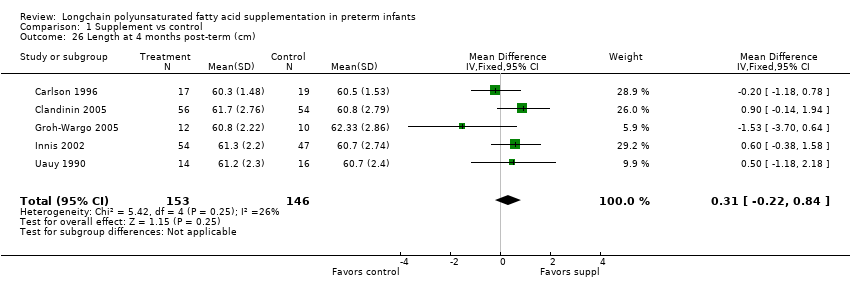
| 26 Length at 4 months post‐term (cm) Show forest plot | 5 | 299 | Mean Difference (IV, Fixed, 95% CI) | 0.31 [‐0.22, 0.84] |
| Analysis 1.26  Comparison 1 Supplement vs control, Outcome 26 Length at 4 months post‐term (cm). | ||||
| 27 Head circumference at 4 months post‐term (cm) Show forest plot | 4 | 198 | Mean Difference (IV, Fixed, 95% CI) | ‐0.09 [‐0.48, 0.30] |
| Analysis 1.27  Comparison 1 Supplement vs control, Outcome 27 Head circumference at 4 months post‐term (cm). | ||||
| 28 Weight at 12 months post‐term (kg) Show forest plot | 4 | 271 | Mean Difference (IV, Fixed, 95% CI) | ‐0.10 [‐0.31, 0.12] |
| Analysis 1.28  Comparison 1 Supplement vs control, Outcome 28 Weight at 12 months post‐term (kg). | ||||
| 29 Length at 12 months post‐term (cm) Show forest plot | 4 | 271 | Mean Difference (IV, Fixed, 95% CI) | 0.25 [‐0.33, 0.84] |
| Analysis 1.29 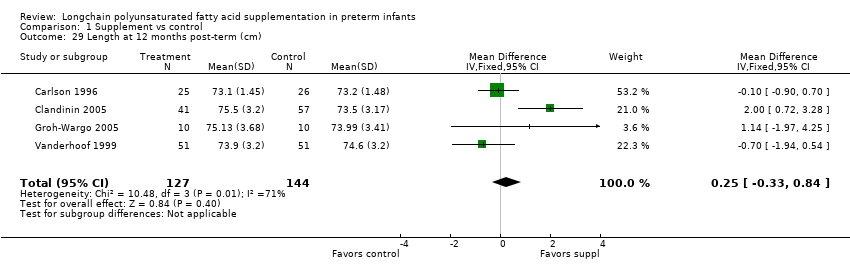 Comparison 1 Supplement vs control, Outcome 29 Length at 12 months post‐term (cm). | ||||
| 30 Head circumference at 12 months post‐term (cm) Show forest plot | 4 | 271 | Mean Difference (IV, Fixed, 95% CI) | ‐0.15 [‐0.53, 0.23] |
| Analysis 1.30  Comparison 1 Supplement vs control, Outcome 30 Head circumference at 12 months post‐term (cm). | ||||
| 31 Normalised weight at 12 months post‐term Show forest plot | 2 | 116 | Mean Difference (IV, Fixed, 95% CI) | ‐0.33 [‐0.56, ‐0.09] |
| Analysis 1.31 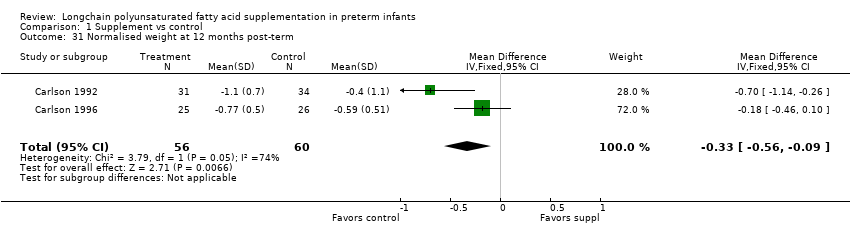 Comparison 1 Supplement vs control, Outcome 31 Normalised weight at 12 months post‐term. | ||||
| 32 Normalised length at 12 months post‐term Show forest plot | 2 | 116 | Mean Difference (IV, Fixed, 95% CI) | 0.03 [‐0.16, 0.22] |
| Analysis 1.32  Comparison 1 Supplement vs control, Outcome 32 Normalised length at 12 months post‐term. | ||||
| 33 Normalised head circumference at 12 months post‐term Show forest plot | 2 | 116 | Mean Difference (IV, Fixed, 95% CI) | ‐0.14 [‐0.38, 0.10] |
| Analysis 1.33 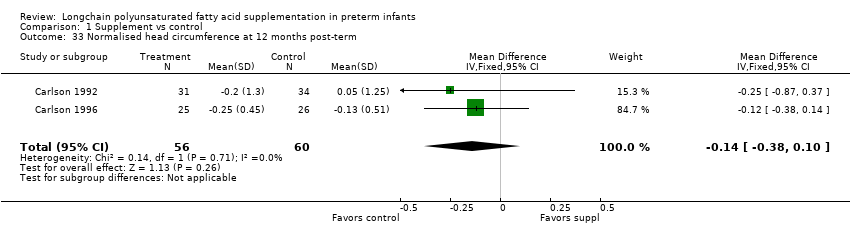 Comparison 1 Supplement vs control, Outcome 33 Normalised head circumference at 12 months post‐term. | ||||
| 34 Lipid peroxidation (TBARS ‐azide/+azide x 100%), 4 months post‐term Show forest plot | 1 | Mean Difference (IV, Fixed, 95% CI) | Totals not selected | |
| Analysis 1.34 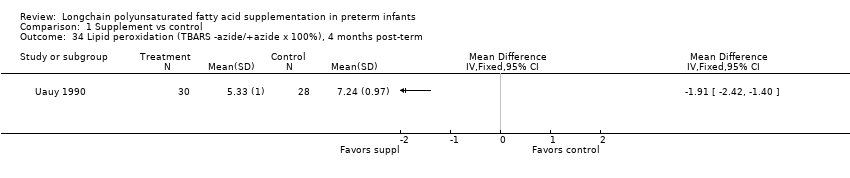 Comparison 1 Supplement vs control, Outcome 34 Lipid peroxidation (TBARS ‐azide/+azide x 100%), 4 months post‐term. | ||||
| 35 RBC fragility (hemolysis with 8% to 10% H2O2) , 4 months post‐term Show forest plot | 1 | Mean Difference (IV, Fixed, 95% CI) | Totals not selected | |
| Analysis 1.35  Comparison 1 Supplement vs control, Outcome 35 RBC fragility (hemolysis with 8% to 10% H2O2) , 4 months post‐term. | ||||
| 36 Infant bleeding time 4 months post‐term (ped device, min) Show forest plot | 1 | Mean Difference (IV, Fixed, 95% CI) | Totals not selected | |
| Analysis 1.36 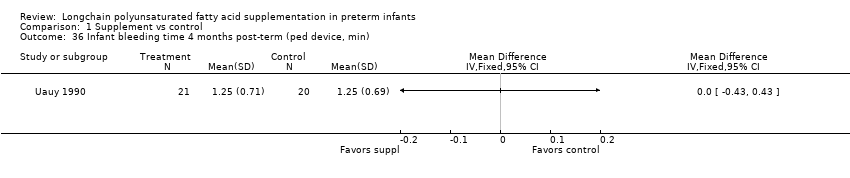 Comparison 1 Supplement vs control, Outcome 36 Infant bleeding time 4 months post‐term (ped device, min). | ||||
| 37 Bayley MDI at 18 months post‐term Show forest plot | 3 | 494 | Mean Difference (IV, Fixed, 95% CI) | 2.40 [‐0.33, 5.12] |
| Analysis 1.37 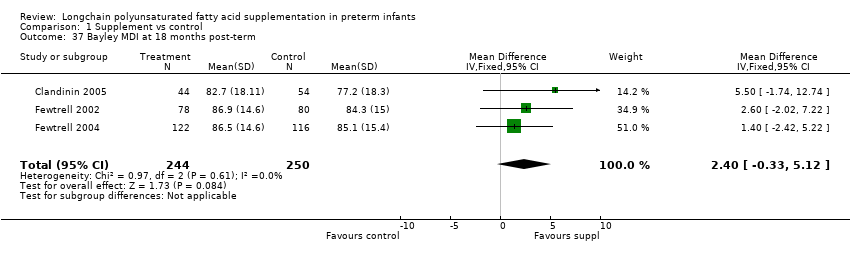 Comparison 1 Supplement vs control, Outcome 37 Bayley MDI at 18 months post‐term. | ||||
| 38 Bayley PDI at 18 months post‐term Show forest plot | 3 | 496 | Mean Difference (IV, Fixed, 95% CI) | 0.74 [‐1.90, 3.37] |
| Analysis 1.38  Comparison 1 Supplement vs control, Outcome 38 Bayley PDI at 18 months post‐term. | ||||
| 39 KPS Developmental Screening Inventory at 9 months post‐term (overall quotient) Show forest plot | 1 | 158 | Mean Difference (IV, Fixed, 95% CI) | 1.50 [‐1.70, 4.70] |
| Analysis 1.39  Comparison 1 Supplement vs control, Outcome 39 KPS Developmental Screening Inventory at 9 months post‐term (overall quotient). | ||||
| 40 Weight at 9 months post‐term Show forest plot | 2 | 374 | Mean Difference (IV, Fixed, 95% CI) | ‐0.01 [‐0.22, 0.21] |
| Analysis 1.40  Comparison 1 Supplement vs control, Outcome 40 Weight at 9 months post‐term. | ||||
| 41 Length at 9 months post‐term Show forest plot | 2 | 374 | Mean Difference (IV, Fixed, 95% CI) | 0.02 [‐0.58, 0.61] |
| Analysis 1.41  Comparison 1 Supplement vs control, Outcome 41 Length at 9 months post‐term. | ||||
| 42 Head circumference at 9 months post‐term Show forest plot | 2 | 374 | Mean Difference (IV, Fixed, 95% CI) | ‐0.03 [‐0.37, 0.30] |
| Analysis 1.42  Comparison 1 Supplement vs control, Outcome 42 Head circumference at 9 months post‐term. | ||||
| 43 Normailsed weight at 9 months post‐term Show forest plot | 1 | 158 | Mean Difference (IV, Fixed, 95% CI) | ‐0.35 [‐0.72, 0.02] |
| Analysis 1.43  Comparison 1 Supplement vs control, Outcome 43 Normailsed weight at 9 months post‐term. | ||||
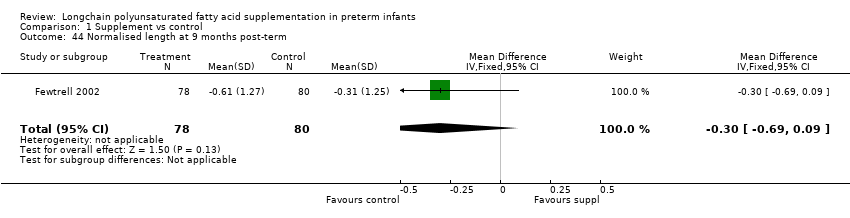
| 44 Normalised length at 9 months post‐term Show forest plot | 1 | 158 | Mean Difference (IV, Fixed, 95% CI) | ‐0.3 [‐0.69, 0.09] |
| Analysis 1.44  Comparison 1 Supplement vs control, Outcome 44 Normalised length at 9 months post‐term. | ||||
| 45 Normalised head circumference at 9 months post‐term Show forest plot | 1 | 158 | Mean Difference (IV, Fixed, 95% CI) | ‐0.10 [‐0.51, 0.31] |
| Analysis 1.45  Comparison 1 Supplement vs control, Outcome 45 Normalised head circumference at 9 months post‐term. | ||||
| 46 Weight at 18 months post‐term Show forest plot | 2 | 396 | Mean Difference (IV, Fixed, 95% CI) | ‐0.14 [‐0.39, 0.10] |
| Analysis 1.46 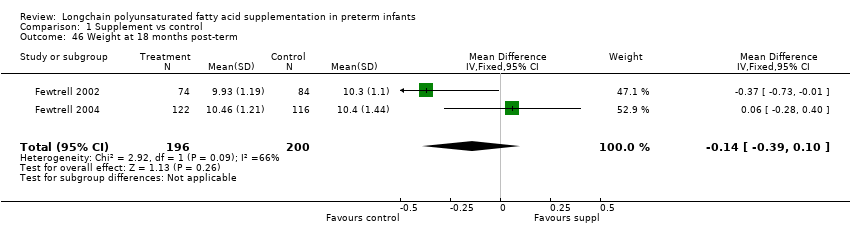 Comparison 1 Supplement vs control, Outcome 46 Weight at 18 months post‐term. | ||||
| 47 Length at 18 months post‐term Show forest plot | 2 | 396 | Mean Difference (IV, Fixed, 95% CI) | ‐0.28 [‐0.91, 0.35] |
| Analysis 1.47 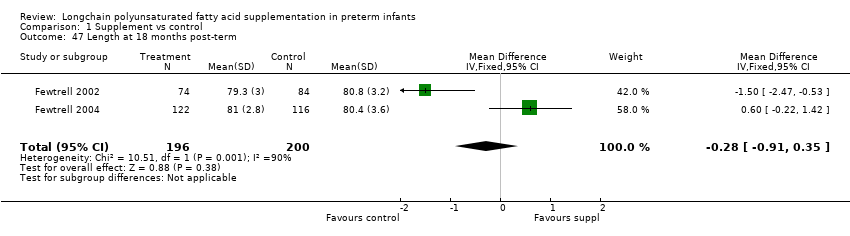 Comparison 1 Supplement vs control, Outcome 47 Length at 18 months post‐term. | ||||
| 48 Head circumference at 18 months post‐term Show forest plot | 2 | 396 | Mean Difference (IV, Fixed, 95% CI) | ‐0.18 [‐0.53, 0.18] |
| Analysis 1.48 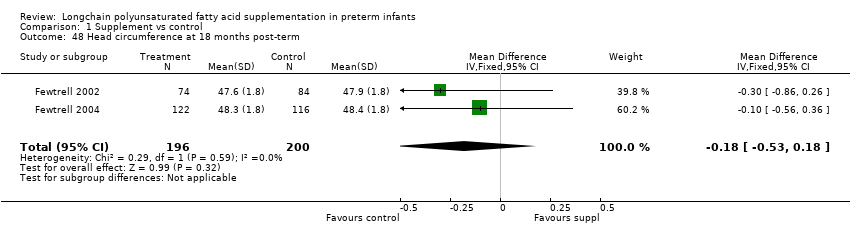 Comparison 1 Supplement vs control, Outcome 48 Head circumference at 18 months post‐term. | ||||
| 49 Normalised weight at 18 months post‐term Show forest plot | 1 | 158 | Mean Difference (IV, Fixed, 95% CI) | ‐0.33 [‐0.68, 0.02] |
| Analysis 1.49 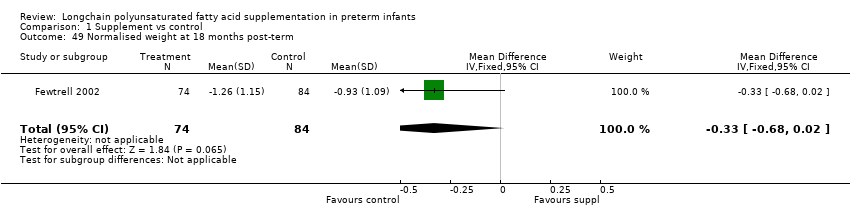 Comparison 1 Supplement vs control, Outcome 49 Normalised weight at 18 months post‐term. | ||||
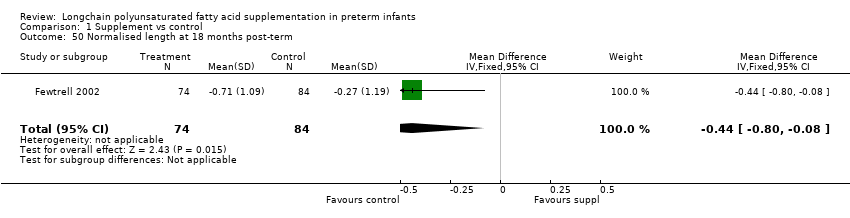
| 50 Normalised length at 18 months post‐term Show forest plot | 1 | 158 | Mean Difference (IV, Fixed, 95% CI) | ‐0.44 [‐0.80, ‐0.08] |
| Analysis 1.50  Comparison 1 Supplement vs control, Outcome 50 Normalised length at 18 months post‐term. | ||||
| 51 Normalised head circumference at 18 months post‐term Show forest plot | 1 | 158 | Mean Difference (IV, Fixed, 95% CI) | ‐0.10 [‐0.52, 0.32] |
| Analysis 1.51  Comparison 1 Supplement vs control, Outcome 51 Normalised head circumference at 18 months post‐term. | ||||
| 52 Fagan Infant test at 6m post‐term, novelty time (%total time) Show forest plot | 1 | 187 | Mean Difference (IV, Fixed, 95% CI) | ‐0.5 [‐2.64, 1.64] |
| Analysis 1.52 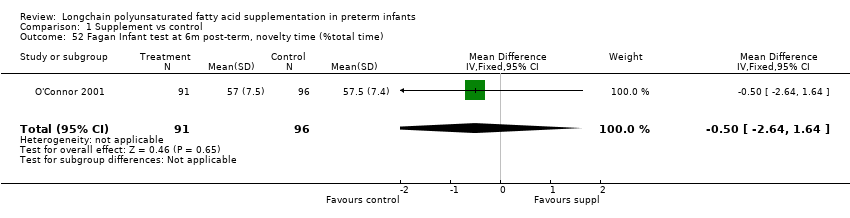 Comparison 1 Supplement vs control, Outcome 52 Fagan Infant test at 6m post‐term, novelty time (%total time). | ||||
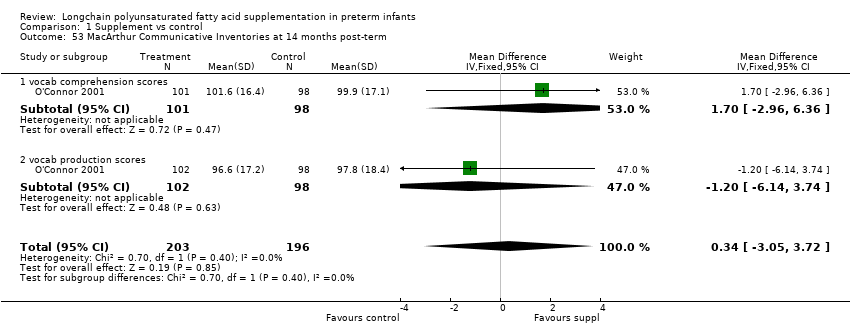
| 53 MacArthur Communicative Inventories at 14 months post‐term Show forest plot | 1 | 399 | Mean Difference (IV, Fixed, 95% CI) | 0.34 [‐3.05, 3.72] |
| Analysis 1.53  Comparison 1 Supplement vs control, Outcome 53 MacArthur Communicative Inventories at 14 months post‐term. | ||||
| 53.1 vocab comprehension scores | 1 | 199 | Mean Difference (IV, Fixed, 95% CI) | 1.70 [‐2.96, 6.36] |
| 53.2 vocab production scores | 1 | 200 | Mean Difference (IV, Fixed, 95% CI) | ‐1.20 [‐6.14, 3.74] |
| 54 Bayley MDI at 24 months post‐term Show forest plot | 1 | 42 | Mean Difference (IV, Fixed, 95% CI) | 4.10 [‐8.06, 16.26] |
| Analysis 1.54 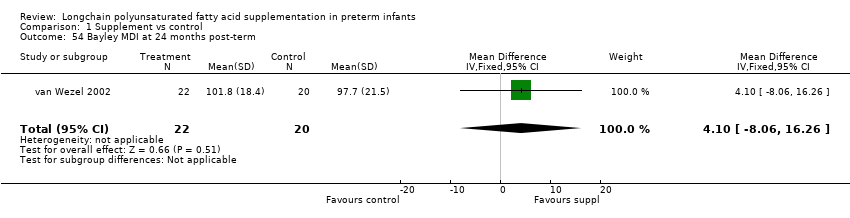 Comparison 1 Supplement vs control, Outcome 54 Bayley MDI at 24 months post‐term. | ||||
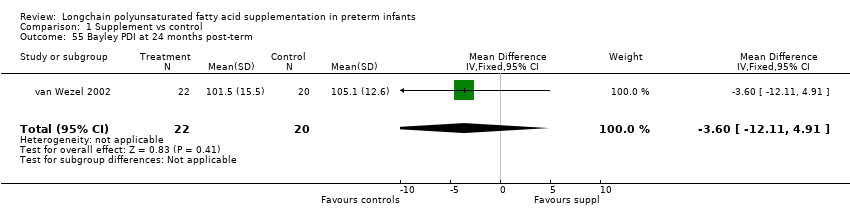
| 55 Bayley PDI at 24 months post‐term Show forest plot | 1 | 42 | Mean Difference (IV, Fixed, 95% CI) | ‐3.60 [‐12.11, 4.91] |
| Analysis 1.55  Comparison 1 Supplement vs control, Outcome 55 Bayley PDI at 24 months post‐term. | ||||
| 56 Weight at 10 years Show forest plot | 1 | 107 | Mean Difference (IV, Fixed, 95% CI) | 2.30 [‐1.45, 6.06] |
| Analysis 1.56  Comparison 1 Supplement vs control, Outcome 56 Weight at 10 years. | ||||
| 56.1 boys | 1 | 51 | Mean Difference (IV, Fixed, 95% CI) | ‐1.43 [‐7.08, 4.22] |
| 56.2 girls | 1 | 56 | Mean Difference (IV, Fixed, 95% CI) | 5.26 [0.23, 10.29] |
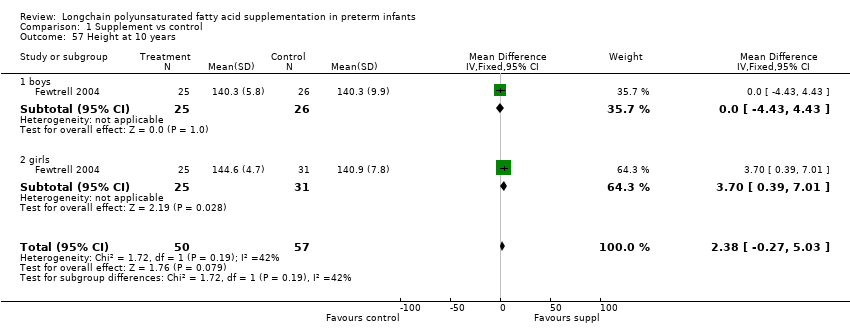
| 57 Height at 10 years Show forest plot | 1 | 107 | Mean Difference (IV, Fixed, 95% CI) | 2.38 [‐0.27, 5.03] |
| Analysis 1.57  Comparison 1 Supplement vs control, Outcome 57 Height at 10 years. | ||||
| 57.1 boys | 1 | 51 | Mean Difference (IV, Fixed, 95% CI) | 0.0 [‐4.43, 4.43] |
| 57.2 girls | 1 | 56 | Mean Difference (IV, Fixed, 95% CI) | 3.70 [0.39, 7.01] |
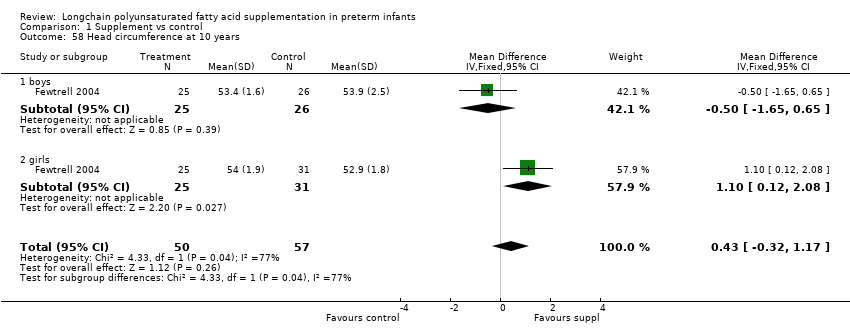
| 58 Head circumference at 10 years Show forest plot | 1 | 107 | Mean Difference (IV, Fixed, 95% CI) | 0.43 [‐0.32, 1.17] |
| Analysis 1.58  Comparison 1 Supplement vs control, Outcome 58 Head circumference at 10 years. | ||||
| 58.1 boys | 1 | 51 | Mean Difference (IV, Fixed, 95% CI) | ‐0.5 [‐1.65, 0.65] |
| 58.2 girls | 1 | 56 | Mean Difference (IV, Fixed, 95% CI) | 1.10 [0.12, 2.08] |
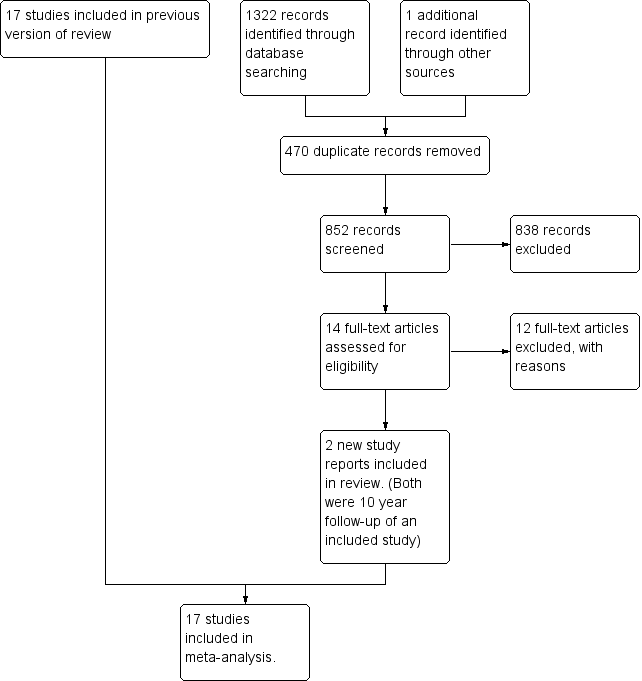
Study flow diagram.

Risk of bias graph: review authors' judgements about each risk of bias item presented as percentages across all included studies.
Forest plot of comparison: 1 Supplement vs control, outcome: 1.6 Visual acuity (log cycles/degree) at 12 months post‐term.
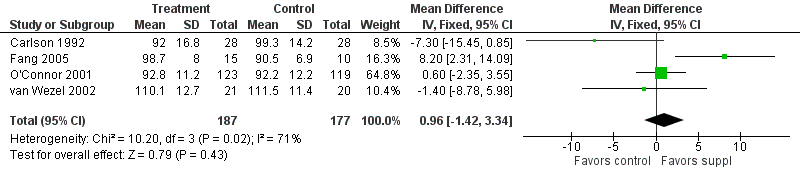
Forest plot of comparison: 1 Supplement vs control, outcome: 1.13 Bayley MDI at 12 months post‐term.

Forest plot of comparison: 1 Supplement vs control, outcome: 1.14 Bayley PDI at 12 months post‐term.

Forest plot of comparison: 1 Supplement vs control, outcome: 1.28 Weight at 12 months post‐term (kg).
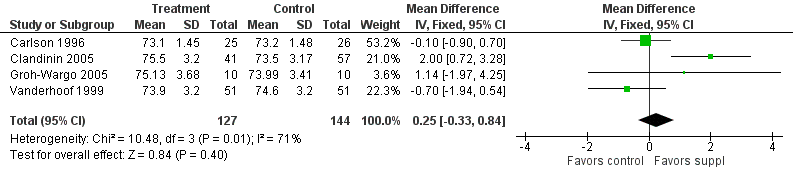
Forest plot of comparison: 1 Supplement vs control, outcome: 1.29 Length at 12 months post‐term (cm).

Forest plot of comparison: 1 Supplement vs control, outcome: 1.30 Head circumference at 12 months post‐term (cm).

Comparison 1 Supplement vs control, Outcome 1 Visual acuity (log cycles/degree) at term.
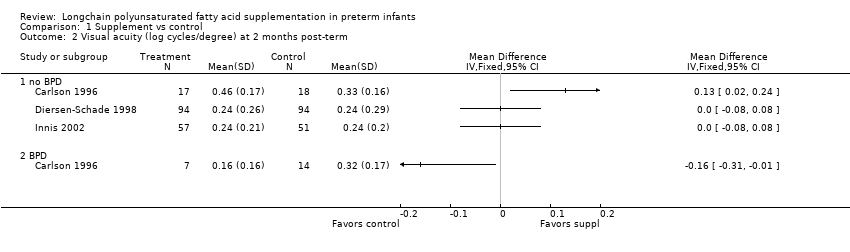
Comparison 1 Supplement vs control, Outcome 2 Visual acuity (log cycles/degree) at 2 months post‐term.
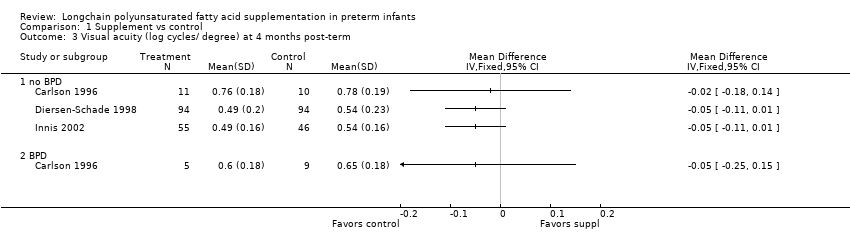
Comparison 1 Supplement vs control, Outcome 3 Visual acuity (log cycles/ degree) at 4 months post‐term.
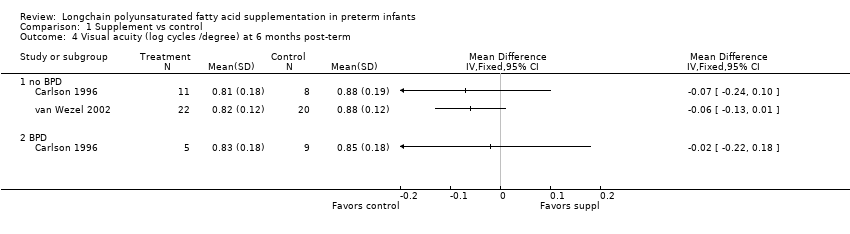
Comparison 1 Supplement vs control, Outcome 4 Visual acuity (log cycles /degree) at 6 months post‐term.

Comparison 1 Supplement vs control, Outcome 5 Visual acuity (log cycles/degree) at 9 months post‐term.

Comparison 1 Supplement vs control, Outcome 6 Visual acuity (log cycles/degree) at 12 months post‐term.

Comparison 1 Supplement vs control, Outcome 7 Rod ERG at 36 wk PCA.
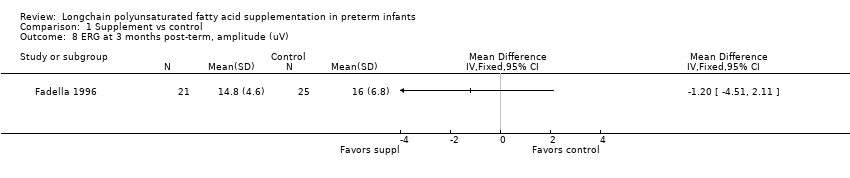
Comparison 1 Supplement vs control, Outcome 8 ERG at 3 months post‐term, amplitude (uV).
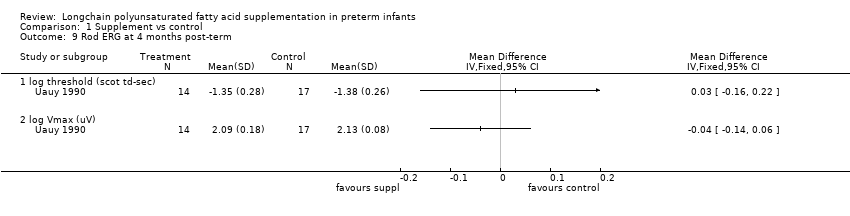
Comparison 1 Supplement vs control, Outcome 9 Rod ERG at 4 months post‐term.

Comparison 1 Supplement vs control, Outcome 10 VEP at 3 months post‐term.

Comparison 1 Supplement vs control, Outcome 11 Fagan infant test at 12 months post‐term.

Comparison 1 Supplement vs control, Outcome 12 Fagan infant test at 9 months post‐term (% total time).
Comparison 1 Supplement vs control, Outcome 13 Bayley MDI at 12 months post‐term.

Comparison 1 Supplement vs control, Outcome 14 Bayley PDI at 12 months post‐term.

Comparison 1 Supplement vs control, Outcome 15 Weight at 6 wk post‐term (kg).

Comparison 1 Supplement vs control, Outcome 16 Length at 6 wk post‐term (cm).
Comparison 1 Supplement vs control, Outcome 17 Head circumference at 6 wk post‐term (cm).
Comparison 1 Supplement vs control, Outcome 18 Weight at term (kg).
Comparison 1 Supplement vs control, Outcome 19 Length at term (cm).

Comparison 1 Supplement vs control, Outcome 20 Head circ at term (cm).

Comparison 1 Supplement vs control, Outcome 21 Weight at 2 months post‐term (kg).

Comparison 1 Supplement vs control, Outcome 22 Length at 2 months post‐term (cm).

Comparison 1 Supplement vs control, Outcome 23 Head circumference at 2 months post‐term (cm).
Comparison 1 Supplement vs control, Outcome 24 Growth rate until 3 months post‐term.

Comparison 1 Supplement vs control, Outcome 25 Weight at 4 months post‐term (kg).
Comparison 1 Supplement vs control, Outcome 26 Length at 4 months post‐term (cm).

Comparison 1 Supplement vs control, Outcome 27 Head circumference at 4 months post‐term (cm).

Comparison 1 Supplement vs control, Outcome 28 Weight at 12 months post‐term (kg).

Comparison 1 Supplement vs control, Outcome 29 Length at 12 months post‐term (cm).

Comparison 1 Supplement vs control, Outcome 30 Head circumference at 12 months post‐term (cm).

Comparison 1 Supplement vs control, Outcome 31 Normalised weight at 12 months post‐term.

Comparison 1 Supplement vs control, Outcome 32 Normalised length at 12 months post‐term.

Comparison 1 Supplement vs control, Outcome 33 Normalised head circumference at 12 months post‐term.

Comparison 1 Supplement vs control, Outcome 34 Lipid peroxidation (TBARS ‐azide/+azide x 100%), 4 months post‐term.

Comparison 1 Supplement vs control, Outcome 35 RBC fragility (hemolysis with 8% to 10% H2O2) , 4 months post‐term.

Comparison 1 Supplement vs control, Outcome 36 Infant bleeding time 4 months post‐term (ped device, min).

Comparison 1 Supplement vs control, Outcome 37 Bayley MDI at 18 months post‐term.

Comparison 1 Supplement vs control, Outcome 38 Bayley PDI at 18 months post‐term.

Comparison 1 Supplement vs control, Outcome 39 KPS Developmental Screening Inventory at 9 months post‐term (overall quotient).

Comparison 1 Supplement vs control, Outcome 40 Weight at 9 months post‐term.

Comparison 1 Supplement vs control, Outcome 41 Length at 9 months post‐term.

Comparison 1 Supplement vs control, Outcome 42 Head circumference at 9 months post‐term.

Comparison 1 Supplement vs control, Outcome 43 Normailsed weight at 9 months post‐term.
Comparison 1 Supplement vs control, Outcome 44 Normalised length at 9 months post‐term.

Comparison 1 Supplement vs control, Outcome 45 Normalised head circumference at 9 months post‐term.

Comparison 1 Supplement vs control, Outcome 46 Weight at 18 months post‐term.

Comparison 1 Supplement vs control, Outcome 47 Length at 18 months post‐term.

Comparison 1 Supplement vs control, Outcome 48 Head circumference at 18 months post‐term.

Comparison 1 Supplement vs control, Outcome 49 Normalised weight at 18 months post‐term.
Comparison 1 Supplement vs control, Outcome 50 Normalised length at 18 months post‐term.

Comparison 1 Supplement vs control, Outcome 51 Normalised head circumference at 18 months post‐term.

Comparison 1 Supplement vs control, Outcome 52 Fagan Infant test at 6m post‐term, novelty time (%total time).
Comparison 1 Supplement vs control, Outcome 53 MacArthur Communicative Inventories at 14 months post‐term.

Comparison 1 Supplement vs control, Outcome 54 Bayley MDI at 24 months post‐term.
Comparison 1 Supplement vs control, Outcome 55 Bayley PDI at 24 months post‐term.

Comparison 1 Supplement vs control, Outcome 56 Weight at 10 years.
Comparison 1 Supplement vs control, Outcome 57 Height at 10 years.
Comparison 1 Supplement vs control, Outcome 58 Head circumference at 10 years.
| LCPUFA supplemented formula compared with standard formula for clinical outcomes (visual function, neurodevelopment and physical growth) | ||||||
| Patient or population: Preterm infants on enteral feed Settings: Neonatal Intensive Care Units Intervention: LCPUFA supplemented formula Comparison: Standard Formula | ||||||
| Outcomes | Illustrative comparative risks* (95% CI) | Relative effect | No of Participants | Quality of the evidence | Comments | |
| Assumed risk | Corresponding risk | |||||
| Standard milk formula | LCPUFA supplemented milk formula | |||||
| Visual acuity at 12 months post‐term (log/cycles/degree) | Data could not be pooled | Data could not be pooled | NA | 82 | ⊕⊕⊝⊝ | Downgraded 2 levels due to very small sample, unclear random sequence generation in one of the RCTs. Meta‐analysis could not be performed. |
| Bayley MDI at 12 months post‐term | The mean MDI ranged across control groups from | The mean MDI ranged across the intervention groups from 92 to 110.1 | MD: 0.96 (95% CI: −1.42 to 3.34) | 364 | ⊕⊕⊝⊝ | Downgraded 2 levels. Reasons: small sample, unclear allocation concealment and random sequence generation in 2 of the RCTs, and very small effect size (MD) and high statistical heterogeneity (I² = 71%) |
| Bayley PDI at 12 months post‐term | The mean PDI ranged across control groups from 86.3 to 102.1 | The mean PDI ranged across the intervention groups from 82.2 to 98 | MD: 0.23 (95% CI: ‐2.77 to 3.22) | 353 (4 RCTs) | ⊕⊕⊝⊝ | Downgraded 2 levels. Reasons: small sample, unclear risk of allocation concealment in 2 of the RCTs. Very small effect size (MD) and high statistical heterogeneity (I² = 81%). |
| Weight at 12 months post‐term (kg) | The mean weight ranged across control groups from 8.85 kg to 9.62 kg | The mean weight ranged across the intervention groups from 9.02 kg to 9.36 kg | MD: −0.10 (95% CI: −0.31 to 0.12) | 271 (4 RCTs) | ⊕⊕⊝⊝ | Downgraded 2 levels. Reasons: small sample, high or unclear risk of attrition bias in 3 studies and unclear method of randomisation in 1 study. Very small effect size (MD) and high statistical heterogeneity (I² = 65%) |
| Length at 12 months post‐term (cm) | The mean length ranged across control groups from 73.2 cm to 74.6 cm | The mean length ranged across the intervention groups from 73.1 cm to 75.5 cm | MD: 0.25 (CI: −0.33 to 0.84) | 271 (4 RCTs) | ⊕⊕⊝⊝ | Downgraded 2 levels. Reasons: small sample, high or unclear risk of attrition bias in 3 included studies and unclear method of randomisation in 1 study. Very small effect size (MD) and high statistical heterogeneity (I² = 71%) |
| Head circumference at 12 months post‐term (cm) | The mean head circumference ranged across control group from 45.8 cm to 46.43 cm | The mean head circumference ranged across the intervention groups from 45.9 cm to 46.31 cm | MD: −0.15 (CI: −0.53 to 0.23) | 271 (4 RCTs) | ⊕⊕⊝⊝ | Downgraded 2 levels. Reasons: small sample, high or unclear risk of attrition bias in 3 included studies and unclear method of randomisation in one study. Very small effect size (MD). |
| *The basis for the assumed risk (e.g. the median control group risk across studies) is provided in footnotes. The corresponding risk (and its 95% confidence interval) is based on the assumed risk in the comparison group and the relative effect of the intervention (and its 95% CI). | ||||||
| GRADE Working Group grades of evidence | ||||||
| Outcome or subgroup title | No. of studies | No. of participants | Statistical method | Effect size |
| 1 Visual acuity (log cycles/degree) at term Show forest plot | 1 | Mean Difference (IV, Fixed, 95% CI) | Totals not selected | |
| 1.1 no BPD | 1 | Mean Difference (IV, Fixed, 95% CI) | 0.0 [0.0, 0.0] | |
| 1.2 BPD | 1 | Mean Difference (IV, Fixed, 95% CI) | 0.0 [0.0, 0.0] | |
| 2 Visual acuity (log cycles/degree) at 2 months post‐term Show forest plot | 3 | Mean Difference (IV, Fixed, 95% CI) | Totals not selected | |
| 2.1 no BPD | 3 | Mean Difference (IV, Fixed, 95% CI) | 0.0 [0.0, 0.0] | |
| 2.2 BPD | 1 | Mean Difference (IV, Fixed, 95% CI) | 0.0 [0.0, 0.0] | |
| 3 Visual acuity (log cycles/ degree) at 4 months post‐term Show forest plot | 3 | Mean Difference (IV, Fixed, 95% CI) | Totals not selected | |
| 3.1 no BPD | 3 | Mean Difference (IV, Fixed, 95% CI) | 0.0 [0.0, 0.0] | |
| 3.2 BPD | 1 | Mean Difference (IV, Fixed, 95% CI) | 0.0 [0.0, 0.0] | |
| 4 Visual acuity (log cycles /degree) at 6 months post‐term Show forest plot | 2 | Mean Difference (IV, Fixed, 95% CI) | Totals not selected | |
| 4.1 no BPD | 2 | Mean Difference (IV, Fixed, 95% CI) | 0.0 [0.0, 0.0] | |
| 4.2 BPD | 1 | Mean Difference (IV, Fixed, 95% CI) | 0.0 [0.0, 0.0] | |
| 5 Visual acuity (log cycles/degree) at 9 months post‐term Show forest plot | 1 | Mean Difference (IV, Fixed, 95% CI) | Totals not selected | |
| 5.1 no BPD | 1 | Mean Difference (IV, Fixed, 95% CI) | 0.0 [0.0, 0.0] | |
| 5.2 BPD | 1 | Mean Difference (IV, Fixed, 95% CI) | 0.0 [0.0, 0.0] | |
| 6 Visual acuity (log cycles/degree) at 12 months post‐term Show forest plot | 2 | Mean Difference (IV, Fixed, 95% CI) | Totals not selected | |
| 6.1 no BPD | 2 | Mean Difference (IV, Fixed, 95% CI) | 0.0 [0.0, 0.0] | |
| 6.2 BPD | 1 | Mean Difference (IV, Fixed, 95% CI) | 0.0 [0.0, 0.0] | |
| 7 Rod ERG at 36 wk PCA Show forest plot | 1 | Mean Difference (IV, Fixed, 95% CI) | Totals not selected | |
| 7.1 log threshold (scot td‐sec) | 1 | Mean Difference (IV, Fixed, 95% CI) | 0.0 [0.0, 0.0] | |
| 7.2 log Vmax (uV) | 1 | Mean Difference (IV, Fixed, 95% CI) | 0.0 [0.0, 0.0] | |
| 8 ERG at 3 months post‐term, amplitude (uV) Show forest plot | 1 | Mean Difference (IV, Fixed, 95% CI) | Totals not selected | |
| 9 Rod ERG at 4 months post‐term Show forest plot | 1 | Mean Difference (IV, Fixed, 95% CI) | Totals not selected | |
| 9.1 log threshold (scot td‐sec) | 1 | Mean Difference (IV, Fixed, 95% CI) | 0.0 [0.0, 0.0] | |
| 9.2 log Vmax (uV) | 1 | Mean Difference (IV, Fixed, 95% CI) | 0.0 [0.0, 0.0] | |
| 10 VEP at 3 months post‐term Show forest plot | 1 | Mean Difference (IV, Fixed, 95% CI) | Totals not selected | |
| 10.1 N4 latency (millisec) | 1 | Mean Difference (IV, Fixed, 95% CI) | 0.0 [0.0, 0.0] | |
| 10.2 P4 latency (millisec) | 1 | Mean Difference (IV, Fixed, 95% CI) | 0.0 [0.0, 0.0] | |
| 11 Fagan infant test at 12 months post‐term Show forest plot | 2 | Mean Difference (IV, Fixed, 95% CI) | Subtotals only | |
| 11.1 novelty time (% total time) | 2 | 84 | Mean Difference (IV, Fixed, 95% CI) | ‐4.11 [‐7.47, ‐0.76] |
| 11.2 total looks (n) | 2 | 84 | Mean Difference (IV, Fixed, 95% CI) | 5.52 [2.16, 8.87] |
| 11.3 time/look (sec) | 2 | 84 | Mean Difference (IV, Fixed, 95% CI) | ‐0.09 [‐0.21, 0.02] |
| 12 Fagan infant test at 9 months post‐term (% total time) Show forest plot | 2 | Mean Difference (IV, Fixed, 95% CI) | Subtotals only | |
| 12.1 novelty time (%) | 2 | 232 | Mean Difference (IV, Fixed, 95% CI) | 0.42 [‐1.40, 2.24] |
| 12.2 total looks (n) | 1 | 51 | Mean Difference (IV, Fixed, 95% CI) | 7.20 [2.49, 11.91] |
| 12.3 time/look (sec) | 1 | 51 | Mean Difference (IV, Fixed, 95% CI) | ‐0.13 [‐0.29, 0.03] |
| 13 Bayley MDI at 12 months post‐term Show forest plot | 4 | 364 | Mean Difference (IV, Fixed, 95% CI) | 0.96 [‐1.42, 3.34] |
| 14 Bayley PDI at 12 months post‐term Show forest plot | 4 | 353 | Mean Difference (IV, Fixed, 95% CI) | 0.23 [‐2.77, 3.22] |
| 15 Weight at 6 wk post‐term (kg) Show forest plot | 1 | Mean Difference (IV, Fixed, 95% CI) | Subtotals only | |
| 16 Length at 6 wk post‐term (cm) Show forest plot | 1 | Mean Difference (IV, Fixed, 95% CI) | Subtotals only | |
| 17 Head circumference at 6 wk post‐term (cm) Show forest plot | 1 | Mean Difference (IV, Fixed, 95% CI) | Subtotals only | |
| 18 Weight at term (kg) Show forest plot | 4 | 296 | Mean Difference (IV, Fixed, 95% CI) | 0.05 [‐0.07, 0.16] |
| 19 Length at term (cm) Show forest plot | 4 | 295 | Mean Difference (IV, Fixed, 95% CI) | 0.34 [‐0.27, 0.96] |
| 20 Head circ at term (cm) Show forest plot | 3 | 185 | Mean Difference (IV, Fixed, 95% CI) | 0.18 [‐0.26, 0.62] |
| 21 Weight at 2 months post‐term (kg) Show forest plot | 5 | 485 | Mean Difference (IV, Fixed, 95% CI) | 0.21 [0.08, 0.33] |
| 22 Length at 2 months post‐term (cm) Show forest plot | 4 | 297 | Mean Difference (IV, Fixed, 95% CI) | 0.47 [0.00, 0.94] |
| 23 Head circumference at 2 months post‐term (cm) Show forest plot | 3 | 187 | Mean Difference (IV, Fixed, 95% CI) | 0.03 [‐0.33, 0.38] |
| 24 Growth rate until 3 months post‐term Show forest plot | 1 | 138 | Mean Difference (IV, Fixed, 95% CI) | ‐0.00 [‐0.04, 0.04] |
| 24.1 weight g/d | 1 | 46 | Mean Difference (IV, Fixed, 95% CI) | ‐0.60 [‐3.56, 2.36] |
| 24.2 length cm/w | 1 | 46 | Mean Difference (IV, Fixed, 95% CI) | 0.0 [‐0.06, 0.06] |
| 24.3 head circumference cm/w | 1 | 46 | Mean Difference (IV, Fixed, 95% CI) | 0.0 [‐0.06, 0.06] |
| 25 Weight at 4 months post‐term (kg) Show forest plot | 6 | 489 | Mean Difference (IV, Fixed, 95% CI) | 0.14 [‐0.01, 0.29] |
| 26 Length at 4 months post‐term (cm) Show forest plot | 5 | 299 | Mean Difference (IV, Fixed, 95% CI) | 0.31 [‐0.22, 0.84] |
| 27 Head circumference at 4 months post‐term (cm) Show forest plot | 4 | 198 | Mean Difference (IV, Fixed, 95% CI) | ‐0.09 [‐0.48, 0.30] |
| 28 Weight at 12 months post‐term (kg) Show forest plot | 4 | 271 | Mean Difference (IV, Fixed, 95% CI) | ‐0.10 [‐0.31, 0.12] |
| 29 Length at 12 months post‐term (cm) Show forest plot | 4 | 271 | Mean Difference (IV, Fixed, 95% CI) | 0.25 [‐0.33, 0.84] |
| 30 Head circumference at 12 months post‐term (cm) Show forest plot | 4 | 271 | Mean Difference (IV, Fixed, 95% CI) | ‐0.15 [‐0.53, 0.23] |
| 31 Normalised weight at 12 months post‐term Show forest plot | 2 | 116 | Mean Difference (IV, Fixed, 95% CI) | ‐0.33 [‐0.56, ‐0.09] |
| 32 Normalised length at 12 months post‐term Show forest plot | 2 | 116 | Mean Difference (IV, Fixed, 95% CI) | 0.03 [‐0.16, 0.22] |
| 33 Normalised head circumference at 12 months post‐term Show forest plot | 2 | 116 | Mean Difference (IV, Fixed, 95% CI) | ‐0.14 [‐0.38, 0.10] |
| 34 Lipid peroxidation (TBARS ‐azide/+azide x 100%), 4 months post‐term Show forest plot | 1 | Mean Difference (IV, Fixed, 95% CI) | Totals not selected | |
| 35 RBC fragility (hemolysis with 8% to 10% H2O2) , 4 months post‐term Show forest plot | 1 | Mean Difference (IV, Fixed, 95% CI) | Totals not selected | |
| 36 Infant bleeding time 4 months post‐term (ped device, min) Show forest plot | 1 | Mean Difference (IV, Fixed, 95% CI) | Totals not selected | |
| 37 Bayley MDI at 18 months post‐term Show forest plot | 3 | 494 | Mean Difference (IV, Fixed, 95% CI) | 2.40 [‐0.33, 5.12] |
| 38 Bayley PDI at 18 months post‐term Show forest plot | 3 | 496 | Mean Difference (IV, Fixed, 95% CI) | 0.74 [‐1.90, 3.37] |
| 39 KPS Developmental Screening Inventory at 9 months post‐term (overall quotient) Show forest plot | 1 | 158 | Mean Difference (IV, Fixed, 95% CI) | 1.50 [‐1.70, 4.70] |
| 40 Weight at 9 months post‐term Show forest plot | 2 | 374 | Mean Difference (IV, Fixed, 95% CI) | ‐0.01 [‐0.22, 0.21] |
| 41 Length at 9 months post‐term Show forest plot | 2 | 374 | Mean Difference (IV, Fixed, 95% CI) | 0.02 [‐0.58, 0.61] |
| 42 Head circumference at 9 months post‐term Show forest plot | 2 | 374 | Mean Difference (IV, Fixed, 95% CI) | ‐0.03 [‐0.37, 0.30] |
| 43 Normailsed weight at 9 months post‐term Show forest plot | 1 | 158 | Mean Difference (IV, Fixed, 95% CI) | ‐0.35 [‐0.72, 0.02] |
| 44 Normalised length at 9 months post‐term Show forest plot | 1 | 158 | Mean Difference (IV, Fixed, 95% CI) | ‐0.3 [‐0.69, 0.09] |
| 45 Normalised head circumference at 9 months post‐term Show forest plot | 1 | 158 | Mean Difference (IV, Fixed, 95% CI) | ‐0.10 [‐0.51, 0.31] |
| 46 Weight at 18 months post‐term Show forest plot | 2 | 396 | Mean Difference (IV, Fixed, 95% CI) | ‐0.14 [‐0.39, 0.10] |
| 47 Length at 18 months post‐term Show forest plot | 2 | 396 | Mean Difference (IV, Fixed, 95% CI) | ‐0.28 [‐0.91, 0.35] |
| 48 Head circumference at 18 months post‐term Show forest plot | 2 | 396 | Mean Difference (IV, Fixed, 95% CI) | ‐0.18 [‐0.53, 0.18] |
| 49 Normalised weight at 18 months post‐term Show forest plot | 1 | 158 | Mean Difference (IV, Fixed, 95% CI) | ‐0.33 [‐0.68, 0.02] |
| 50 Normalised length at 18 months post‐term Show forest plot | 1 | 158 | Mean Difference (IV, Fixed, 95% CI) | ‐0.44 [‐0.80, ‐0.08] |
| 51 Normalised head circumference at 18 months post‐term Show forest plot | 1 | 158 | Mean Difference (IV, Fixed, 95% CI) | ‐0.10 [‐0.52, 0.32] |
| 52 Fagan Infant test at 6m post‐term, novelty time (%total time) Show forest plot | 1 | 187 | Mean Difference (IV, Fixed, 95% CI) | ‐0.5 [‐2.64, 1.64] |
| 53 MacArthur Communicative Inventories at 14 months post‐term Show forest plot | 1 | 399 | Mean Difference (IV, Fixed, 95% CI) | 0.34 [‐3.05, 3.72] |
| 53.1 vocab comprehension scores | 1 | 199 | Mean Difference (IV, Fixed, 95% CI) | 1.70 [‐2.96, 6.36] |
| 53.2 vocab production scores | 1 | 200 | Mean Difference (IV, Fixed, 95% CI) | ‐1.20 [‐6.14, 3.74] |
| 54 Bayley MDI at 24 months post‐term Show forest plot | 1 | 42 | Mean Difference (IV, Fixed, 95% CI) | 4.10 [‐8.06, 16.26] |
| 55 Bayley PDI at 24 months post‐term Show forest plot | 1 | 42 | Mean Difference (IV, Fixed, 95% CI) | ‐3.60 [‐12.11, 4.91] |
| 56 Weight at 10 years Show forest plot | 1 | 107 | Mean Difference (IV, Fixed, 95% CI) | 2.30 [‐1.45, 6.06] |
| 56.1 boys | 1 | 51 | Mean Difference (IV, Fixed, 95% CI) | ‐1.43 [‐7.08, 4.22] |
| 56.2 girls | 1 | 56 | Mean Difference (IV, Fixed, 95% CI) | 5.26 [0.23, 10.29] |
| 57 Height at 10 years Show forest plot | 1 | 107 | Mean Difference (IV, Fixed, 95% CI) | 2.38 [‐0.27, 5.03] |
| 57.1 boys | 1 | 51 | Mean Difference (IV, Fixed, 95% CI) | 0.0 [‐4.43, 4.43] |
| 57.2 girls | 1 | 56 | Mean Difference (IV, Fixed, 95% CI) | 3.70 [0.39, 7.01] |
| 58 Head circumference at 10 years Show forest plot | 1 | 107 | Mean Difference (IV, Fixed, 95% CI) | 0.43 [‐0.32, 1.17] |
| 58.1 boys | 1 | 51 | Mean Difference (IV, Fixed, 95% CI) | ‐0.5 [‐1.65, 0.65] |
| 58.2 girls | 1 | 56 | Mean Difference (IV, Fixed, 95% CI) | 1.10 [0.12, 2.08] |