Лекарства для дегельминтизации детей от почвенных гельминтов: влияние на показатели питания (упитанности), гемоглобин и успеваемость в школе
Información
- DOI:
- https://doi.org/10.1002/14651858.CD000371.pub6Copiar DOI

- Base de datos:
-
- Cochrane Database of Systematic Reviews
- Versión publicada:
-
- 23 julio 2015see what's new
- Tipo:
-
- Intervention
- Etapa:
-
- Review
- Grupo Editorial Cochrane:
-
Grupo Cochrane de Enfermedades infecciosas
- Clasificada:
-
- Pendiente de actualización
Authors currently updating
The update is due to be published in 2019.Evaluada: 6 February 2019
- Pendiente de actualización
- Copyright:
-
- Copyright © 2017 The Authors. Cochrane Database of Systematic Reviews published by John Wiley & Sons, Ltd. on behalf of The Cochrane Collaboration.
- This is an open access article under the terms of the Creative Commons Attribution‐Non‐Commercial Licence, which permits use, distribution and reproduction in any medium, provided the original work is properly cited and is not used for commercial purposes.
Cifras del artículo
Altmetric:
Citado por:
Autores
Contributions of authors
DTR wrote the protocol, applied inclusion criteria, assessed quality, extracted data, conducted data analysis, and wrote the first draft of the review. KSW and NM applied inclusion criteria, assessed quality, extracted data, conducted data analysis, and drafted the results of the update. SD assessed risk of bias and extracted data for a subset of the trials, and contributed to the analysis and the writing of the review. PG provided advice at all stages of the review production, applied inclusion criteria, assessed quality, quality assured data extraction, helped construct the comparisons, and helped write the review.
Sources of support
Internal sources
-
Liverpool School of Tropical Medicine, UK.
External sources
-
Department for International Development, UK.
-
Evidence and Programme Guidance Unit, Department of Nutrition for Health and Development, WHO, Switzerland.
Declarations of interest
This Cochrane Review is supported by a DFID grant aimed at ensuring the best possible systematic reviews, particularly Cochrane Reviews, are completed on topics relevant to the poor, particularly women, in low‐ and middle‐income countries. DFID does not participate in the selection of topics, in the conduct of the review, or in the interpretation of findings. The grant provides partial salary support for PG, SD, and the funds for the contract with Enhance Reviews Ltd.
PG receives additional salary support from the COUNTDOWN Research Consortium, which is funded by the DFID. COUNTDOWN is committed to trials and development of mass treatment programmes related to NTDs.
Acknowledgements
We thank all people who gave of their time and expertise to comment on this Cochrane Review and also the authors of the first version of this Cochrane Review (Dickson 2000a). We are grateful to Dr. David Sinclair for his advice and assistance in preparing 'Summary of findings' tables.
This document is an output from a project funded by the UK Department for International Development (DFID) for the benefit of developing countries. The views expressed are not necessarily those of DFID.
This 2015 review update was partly supported by a grant from the Evidence and Programme Guidance Unit, Department of Nutrition for Health and Development, WHO.
The academic editors for this Cochrane Review are Hellen Gelband and David Sinclair.
Version history
| Published | Title | Stage | Authors | Version |
| 2019 Sep 11 | Public health deworming programmes for soil‐transmitted helminths in children living in endemic areas | Review | David C Taylor‐Robinson, Nicola Maayan, Sarah Donegan, Marty Chaplin, Paul Garner | |
| 2015 Jul 23 | Deworming drugs for soil‐transmitted intestinal worms in children: effects on nutritional indicators, haemoglobin, and school performance | Review | David C Taylor‐Robinson, Nicola Maayan, Karla Soares‐Weiser, Sarah Donegan, Paul Garner | |
| 2012 Nov 14 | Deworming drugs for soil‐transmitted intestinal worms in children: effects on nutritional indicators, haemoglobin and school performance | Review | David C Taylor‐Robinson, Nicola Maayan, Karla Soares‐Weiser, Sarah Donegan, Paul Garner | |
| 2012 Jul 11 | Deworming drugs for soil‐transmitted intestinal worms in children: effects on nutritional indicators, haemoglobin and school performance | Review | David C Taylor‐Robinson, Nicola Maayan, Karla Soares‐Weiser, Sarah Donegan, Paul Garner | |
| 2007 Oct 17 | Deworming drugs for treating soil‐transmitted intestinal worms in children: effects on growth and school performance | Review | David C Taylor‐Robinson, Ashley P Jones, Paul Garner | |
| 2007 Apr 18 | Anthelmintic drugs for treating worms in children: effects on growth and cognitive performance | Review | Rumona C Dickson, Shally Awasthi, C Demellweek, Paula R Williamson | |
| 2000 Apr 24 | Anthelmintic drugs for treating worms in children: effects on growth and cognitive performance | Review | Rumona C Dickson, Shally Awasthi, Colin Demellweek, Paula R Williamson | |
Differences between protocol and review
Not applicable.
Notes
Not applicable.
Keywords
MeSH
Medical Subject Headings (MeSH) Keywords
- Anthelmintics [*therapeutic use];
- Body Weight;
- Child Development [drug effects];
- Cognition;
- Endemic Diseases;
- Helminthiasis [*drug therapy];
- *Intestinal Diseases, Parasitic [complications, drug therapy];
- *Nutritional Status;
- Public Health;
- Randomized Controlled Trials as Topic;
- Soil [*parasitology];
- *Weight Gain;
Medical Subject Headings Check Words
Child; Humans;
PICO


Study flow diagram.


Comparison 1 Infected children ‐ Single dose, Outcome 1 Weight (kg).

Comparison 1 Infected children ‐ Single dose, Outcome 2 Height (cm).

Comparison 1 Infected children ‐ Single dose, Outcome 3 Mid‐upper arm circumference (cm).

Comparison 1 Infected children ‐ Single dose, Outcome 4 Triceps skin fold thickness (mm).

Comparison 1 Infected children ‐ Single dose, Outcome 5 Subscapular skin fold thickness (mm).

Comparison 1 Infected children ‐ Single dose, Outcome 6 Body mass index.

Comparison 1 Infected children ‐ Single dose, Outcome 7 Haemoglobin (g/dL).

Comparison 2 Infected children ‐ Multiple dose, longest follow‐up, Outcome 1 Weight (kg).

Comparison 2 Infected children ‐ Multiple dose, longest follow‐up, Outcome 2 Height (cm).

Comparison 2 Infected children ‐ Multiple dose, longest follow‐up, Outcome 3 Body mass index.
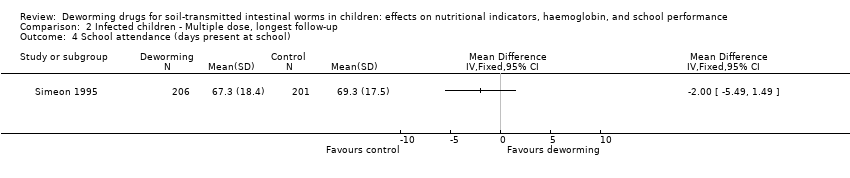
Comparison 2 Infected children ‐ Multiple dose, longest follow‐up, Outcome 4 School attendance (days present at school).

Comparison 2 Infected children ‐ Multiple dose, longest follow‐up, Outcome 5 Mid‐upper arm circumference (cm).

Comparison 2 Infected children ‐ Multiple dose, longest follow‐up, Outcome 6 Triceps skin fold thickness (mm).

Comparison 2 Infected children ‐ Multiple dose, longest follow‐up, Outcome 7 Subscapular skin fold thickness (mm).

Comparison 3 All children living in endemic area ‐ first dose, Outcome 1 Weight (kg).

Comparison 3 All children living in endemic area ‐ first dose, Outcome 2 Height (cm).

Comparison 3 All children living in endemic area ‐ first dose, Outcome 3 Mid‐upper arm circumference (cm).

Comparison 3 All children living in endemic area ‐ first dose, Outcome 4 Haemoglobin (g/dL).

Comparison 4 All children living in endemic area ‐ Multiple dose, longest follow‐up, Outcome 1 Weight (kg).

Comparison 4 All children living in endemic area ‐ Multiple dose, longest follow‐up, Outcome 2 Height (cm).

Comparison 4 All children living in endemic area ‐ Multiple dose, longest follow‐up, Outcome 3 Mid‐upper arm circumference (cm).

Comparison 4 All children living in endemic area ‐ Multiple dose, longest follow‐up, Outcome 4 Triceps skin fold thickness (mm).

Comparison 4 All children living in endemic area ‐ Multiple dose, longest follow‐up, Outcome 5 Haemoglobin (g/dL).

Comparison 4 All children living in endemic area ‐ Multiple dose, longest follow‐up, Outcome 6 School attendance (days present at school).

Comparison 5 All children living in endemic area ‐ Single dose (low risk of bias for allocation concealment), Outcome 1 Weight (kg).

Comparison 5 All children living in endemic area ‐ Single dose (low risk of bias for allocation concealment), Outcome 2 Height (cm).

Comparison 5 All children living in endemic area ‐ Single dose (low risk of bias for allocation concealment), Outcome 3 Mid‐upper arm circumference (cm).

Comparison 5 All children living in endemic area ‐ Single dose (low risk of bias for allocation concealment), Outcome 4 Haemoglobin (g/dL).

Comparison 6 All children living in endemic area ‐ Multiple dose (low risk of bias for allocation concealment), longest follow‐up, Outcome 1 Weight (kg).

Comparison 6 All children living in endemic area ‐ Multiple dose (low risk of bias for allocation concealment), longest follow‐up, Outcome 2 Height (cm).

Comparison 6 All children living in endemic area ‐ Multiple dose (low risk of bias for allocation concealment), longest follow‐up, Outcome 3 Haemoglobin (g/dL).

Comparison 7 All children living in endemic area ‐ All multiple ordered by year, Outcome 1 Weight (kg).
| In communities where intestinal helminths are endemic, what is the effect of multiple doses of deworming drugs given to all children? | ||||||
| Patient or population: School‐aged children | ||||||
| Outcomes | Illustrative comparative risks* (95% CI) | Relative effect | No of participants | Quality of the evidence | Comments | |
| Assumed risk | Corresponding risk | |||||
| Control | Deworming drugs | |||||
| Weight (kg) | The mean change in weight in the control arm ranged from 1.2 kg to 4.73 kg | The mean weight gain in the intervention groups was 0.08 kg more (0.11 kg less to 0.27 kg more) | — | 38,392 | ⊕⊕⊝⊝ Due to risk of bias and inconsistency | There may be little or no effect on weight gain |
| Height (cm) | The mean gain in height in the control groups ranged from 2.39 to 16.4 cm | The mean gain in height in the intervention groups was | — | 7057 | ⊕⊕⊕⊝ Due to risk of bias | Probably little or no effect on height |
| Haemoglobin (g/dL) | The mean change in haemoglobin in the control groups ranged from 0.26 to 1.75 g/dL | The mean haemoglobin in the intervention groups was | — | 3595 | ⊕⊕⊝⊝ Due to risk of bias and indirectness | There may be little or no effect on haemoglobin |
| Formal tests of cognition | — | None of the trials reported a benefit of deworming across multiple tests9 | — | 32,486 | ⊕⊕⊕⊝ Due to risk of bias | Probably little or no effect on cognition |
| Physical well‐being | — | — | — | — (0 trials) | — | We don't know if there is an effect on physical well‐being |
| School attendance | The mean school attendance in the control groups ranged from 66% to 90% | The mean school attendance in the intervention groups was | — | 20,243 | ⊕⊝⊝⊝ Due to risk of bias and indirectness | We don't know if there is an effect on school attendance |
| School performance | — | No difference in exam performances was detected in either trial | — | 32,659 (2 trials) | ⊕⊕⊕⊝ moderate17,18 | Probably little or no effect on school performance |
| Death (between ages 1 and 6 years) | 27 per 1000 | 25 per 1000 | RR 0.95 (0.89 to 1.92) | 1,005,135 | ⊕⊕⊝⊝ low20,21 Due to risk of bias and indirectness | May be little or no effect on death |
| *The basis for the assumed risk (eg the median control group risk across trials) is provided in footnotes. The corresponding risk (and its 95% CI) is based on the assumed risk in the comparison group and the relative effect of the intervention (and its 95% CI). | ||||||
| GRADE Working Group grades of evidence | ||||||
| 1Four cluster‐RCTs (302 clusters) and six individually RCTs (2552 participants). 9Awasthi 2000, with a follow‐up of two years, reported that there was no difference in development between treatment groups in terms of proportion with "normal" development. Ndibazza 2012 measured a range of cognitive tests with a follow‐up post‐treatment and found no effect of deworming. Miguel 2004 (Cluster) measured a range of cognitive tests with a follow‐up of two years, but no deworming effect was demonstrated. Stoltzfus 2001, with a follow‐up of 12 months, found that treatment had no significant effect on motor or language development. Watkins 1996, with a follow‐up of six months, found no difference on any of the tests between treatment groups. | ||||||
| Trial details | Outcome measures | Intervention | Control | Difference |
| Infected children identified by screening ‐ multiple dose | ||||
| Simeon 1995 | Mean % attendance (class registers ) N = 264
| Baseline 62.6 (SD 20.4) Follow‐up 67.3 (SD 18.4) | Baseline 66.3 (SD 20.8) Follow‐up 69.3 (SD 17.5) | 2.0% |
| All children living in endemic area‐ multiple dose | ||||
| Attendance at follow‐up only (class registers) N = 143 | 97.2% (iron group) 95.6% | 98% (iron group) 95.2% | ‐0.8% 0.4% | |
| Group 1 vs 2+3 (1 year follow‐up) | School participation N = 30,000 | 84.1% | 73.1% (group 2) 76.6% (group 3) | 9.3% (SE 3.0%) |
| Group 2 vs 3 (1 year follow‐up) | School participation N = 20,000 | 71.8% | 66.4% | 5.4% (SE 2.7%) |
| Group 1 vs 3 1999 (2 year follow‐up) | School participation N = 20,000 | 71.6% | 66.4% | 5.1% (SE 2.7) |
| Watkins 1996 | Attendance rates of children actively attending school. N = 243 | Baseline 92%, Follow‐up 88%, | Baseline 0.90, Follow‐up 89% | ‐3% |
| In infected children, what is the effect of a single dose of deworming drugs? | ||||||
| Patient or population: Children known to be infected with soil‐transmitted intestinal worms Control: No intervention | ||||||
| Outcomes | Illustrative comparative risks* (95% CI) | Relative effect | No of participants | Quality of the evidence | Comments | |
| Assumed risk | Corresponding risk | |||||
| Control | Deworming drugs | |||||
| Weight (kg) | The mean gain in weight in the control groups ranged from 0.54 to 2.2 kg | The gain in weight in the intervention groups ranged from 0.20 to 1.30 kg higher | Not pooled | 627 | ⊕⊕⊝⊝ Due to risk of bias and inconsistency | May increase average weight gain |
| Haemoglobin (g/dL) | The mean change in haemoglobin in the control groups ranged from ‐0.6 to ‐0.9 g/dL | The mean change in haemoglobin in the intervention groups was 0.10 g/dL higher | — | 247 | ⊕⊝⊝⊝ Due to risk of bias, inconsistency and indirectness | We don't know if there is an effect on average haemoglobin |
| Formal tests of cognition | — | — | Not pooled | 103 | ⊕⊝⊝⊝ Due to risk of bias and indirectness | We don't know if there is an effect on cognition |
| Physical well‐being | — | — | Not pooled5 | 280 (3 trials) | ⊕⊝⊝⊝ due to risk of bias and indirectness | We don't know if there is an effect on physical well‐being |
| School attendance | — | — | — | — (0 trials) | — | We don't know if there is an effect on school attendance |
| *The basis for the assumed risk (eg the median control group risk across trials) is provided in footnotes. The corresponding risk (and its 95% CI) is based on the assumed risk in the comparison group and the relative effect of the intervention (and its 95% CI). | ||||||
| GRADE Working Group grades of evidence | ||||||
| 1Downgraded by 1 for risk of bias: none of the trials adequately described allocation concealment. | ||||||
| Trial details | Outcome measures | Results |
| All children living in endemic area ‐ multiple dose | ||
| Albendazole versus placebo, 2 years | 2659 participants. Mathematics test score, Vietnamese test score. | No statistically significant differences in test results at start or end of trial. |
| Deworming package including albendazole versus placebo | 30,000 participants. Exam score performance (measured by Internationaal Christelijk Steunfonds Africa (ICS) administered English, Mathematics and Science‐Agriculture exams) in pupils in grades 3 to 8. | In the original trial and the pure replication, the trial authors reported no significant difference, but data was not reported. In the statistical replication, this was confirmed. |
| In communities where intestinal helminths are endemic, what is the effect of a single dose of deworming drugs given to all children? | ||||||
| Patient or population: All children Control: No intervention | ||||||
| Outcomes | Illustrative comparative risks* (95% CI) | Relative effect | No of participants | Quality of the evidence | Comments | |
| Assumed risk | Corresponding risk | |||||
| Control | Deworming drugs | |||||
| Weight (kg) | The mean weight gain in the control groups ranged from 0.45 kg to 1.19 kg | The mean weight gain in the intervention groups was 0.04 kg less (0.11 kg less to 0.04 kg more) | — | 2719 | ⊕⊕⊕⊝ Due to risk of bias | Probably little or no effect on average weight gain |
| Haemoglobin (g/dL) | The mean haemoglobin in the control groups ranged from 12.01 to 12.12 g/dL | The mean haemoglobin in the intervention groups was | — | 1005 | ⊕⊕⊕⊝ Due to risk of bias | Probably little or no effect on average haemoglobin |
| Formal tests of cognition | — | One trial reported that deworming had no effect, and the other that deworming reduces cognitive scores | Not pooled | 1361 | ⊕⊕⊝⊝ due to risk of bias and indirectness | There may be little or no effect on cognition |
| Physical well‐being | — | — | — | — (0 trials) | — | We don't know if there is an effect on physical well‐being |
| School attendance | — | — | — | — (0 trials) | — | We don't know if there is an effect on school attendance |
| *The basis for the assumed risk (eg the median control group risk across trials) is provided in footnotes. The corresponding risk (and its 95% CI) is based on the assumed risk in the comparison group and the relative effect of the intervention (and its 95% CI). | ||||||
| GRADE Working Group grades of evidence | ||||||
| 1Downgraded by 1 for risk of bias: none of the trials were classified as having low risk of bias. | ||||||
| Search set | CIDG SRa | CENTRAL | MEDLINEb | EMBASEb | LILACSb |
| 1 | helmint* | helmint* | helmint* | helmint$ | helmint* |
| 2 | Ancylostoma duodenale | Ancylostoma duodenale | Ancylostoma duodenale | Ancylostoma duodenale | Ancylostoma duodenale |
| 3 | Necator americanus | Necator americanus | Necator americanus | Necator americanus | Necator americanus |
| 4 | Ascaris | Ascaris | Ascaris | Ascaris | Ascaris |
| 5 | Enterobius vermicularis | Enterobius vermicularis | Enterobius vermicularis | Enterobius vermicularis | Enterobius vermicularis |
| 6 | trichuris | trichuris | trichuris | trichuris | trichuris |
| 7 | Strongyloid* | Strongyloid* | Strongyloid* | Strongyloid* | Strongyloid* |
| 8 | albendazole | hookworm* | hookworm* | hookworm$ | 1‐7/OR |
| 9 | mebendazole | roundworm* | roundworm* | roundworm$ | albendazole |
| 10 | piperazine | pinworm* | pinworm* | pinworm$ | mebendazole |
| 11 | levamisole | whipworm* | whipworm* | whipworm$ | piperazine |
| 12 | pyrantel | 1‐11/OR | 1‐11/OR | 1‐11/OR | levamisole |
| 13 | tiabendazole | albendazole | albendazole | albendazole | pyrantel |
| 14 | — | mebendazole | mebendazole | mebendazole | tiabendazole |
| 15 | — | piperazine | piperazine | piperazine | 9‐14/OR |
| 16 | — | levamisole | levamisole | levamisole | 8 and 15 |
| 17 | — | pyrantel | pyrantel | pyrantel | Limit 16 to human |
| 18 | — | tiabendazole | tiabendazole | tiabendazole | — |
| 19 | — | 13 or 14 or 15 or 16 or 17 or 18 | 13 or 14 or 15 or 16 or 17 or 18 | 13 or 14 or 15 or 16 or 17 or 18 | — |
| 20 | — | 12 and 19 | 12 and 19 | 12 and 19 | — |
| 21 | — | — | Limit 20 to human | Limit 20 to human | — |
| aCIDG Specialized Register. | |||||
| Community category (WHO 2002) | Prevalencea | Percentageb | School intervention |
| 1. High prevalence or high intensity | > 70% | > 10% | Targeted treatment of school‐age children 2 to 3 times per year |
| 2. Moderate prevalence and low intensity | > 50% but < 70% | < 10% | Targeted treatment of school‐age children once per year |
| 3. Low prevalence and low intensity | < 50% | < 10% | Selective treatment |
| Category (WHO 2006b) | Prevalencea | Action to be taken | |
| High risk community | > 50% | Targeted treatment of pre‐school and school‐age children 2 or 3 times per year | |
| Low risk community | > 20% but < 50% | Targeted treatment of pre‐school and school‐age children once per year | |
| aOf any worm infection. | |||
| Accompanying intervention | Details from trial | Trials |
| To both intervention and control | "The AWC workers, usually local women (plus assistants), give pre‐school education, give nutritional supplements to malnourished children, and record births and pre‐school deaths." | |
| "The parents of all children aged < 7 years were offered a range of health services at child health days, including vaccinations, vitamin A supplements, growth monitoring and promotion, and demonstrations of complementary feeding." | ||
| "The primary job responsibilities of the AWW [anganwadi worker] are to run a creche and provide primary health care and supplementary nutrition for children < six years of age and pregnant and lactating women." | ||
| All children received 10 mL of multivitamins (over two days) as an incentive at each time point. Each 5 mL of multivitamin contained: Vitamin A 3000 IU, Vitamin B2 2.0 mg, Nicotinamide 15.0 mg, Vitamin B1 1.5 mg, Vitamin B6 2.0 mg, Vitamin D2 400 IU, D panthenol 1.0 mg. | ||
| Children attended a mother and child health clinic | ||
| Children in both groups received treatment for other conditions in accordance with the IMCI guidelines. | ||
| Children were followed up for routine immunisations, and then quarterly, to age 5 years. Children received BCG and oral polio immunisations at birth, polio, diphtheria, pertussis, tetanus, hepatitis B and Haemophilus influenzae type B immunisations at 6, 10 and 14 weeks, and measles immunisation at 9 months. | ||
| Three schools received fortified soup with 20 mg elemental iron per portion, and 100 mg vitamin C per portion for 6 months. | ||
| Only in the intervention group | Treatment schools received worm prevention education through regular public health lectures, wall charts, and the training of teachers in each treatment school on worm prevention. Health education stressed the importance of hand washing to avoid ingesting roundworm and whipworm larvae, wearing shoes to avoid hookworm infection, and not swimming in infected fresh water to avoid schistosomiasis. | |
| No additional intervention reported | — | 37 trials |
| Infected children identified by screening ‐ single dose | |
| Nokes 1992 | Growth measured but not reported: 9 weeks cited as too short a follow‐up period to demonstrate a change. |
| Albendazole | No significant differences in median change in weight and weight‐for‐height z‐scores, and for mean change in weight‐for‐age, and height‐for‐age z‐scores at 12 months follow‐up. Weight: Median change in weight at follow‐up in treatment group 2.6 (range 1.2 to 7.2) and control group 2.5 (range 1.2 to 6.6) Height‐for‐age z‐score: Mean change at follow‐up in treatment group 1.1 (0.2) and in control group 1.1 (0.2). Weight‐for‐age z‐score: Median change at follow‐up in treatment group ‐1.0 (range 0.6 to 2.3) and in control group 0.8 (range 0.5 to 1.6). Weight‐for‐height z‐score: Mean change at follow‐up in treatment group 0.5 (0.6) and in control group 0.1 (0.6). |
| Albendazole | No significant differences in percentage stunted and sum of skinfolds at 6 months follow‐up. Percentage stunted (≤ ‐2 HAZ score): Mean at follow‐up in treatment group 66% (mean change from baseline ‐7.0) and in control group 69% (mean change from baseline ‐7.4). Sum of skinfolds: Mean at follow‐up in treatment group 12 mm (mean change from baseline 1 mm) and in control group 12 mm (mean change from baseline 1 mm). |
| Infected children identified by screening ‐ multiple dose | |
| Simeon 1995 | No significant difference in any reported outcome for whole group. |
| All children living in endemic area‐ single dose | |
| Beach 1999 | A nutritional benefit of treatment was not detectable after 4 months for the entire trial population (853 participants, no figures provided). Stratification by infection demonstrated small positive effects in the treatment group for some anthropometric outcomes. In Ascaris‐infected children (51), height gain was 0.62 cm > placebo in the combination treatment group (P = 0.01) at 4 months. In Trichuris‐infected children (158), weight gain was 0.56 kg > placebo in the combination treatment group (P = 0.01) at 4 months. |
| Fox 2005 | No results provided for whole trial population. Results for height and weight only presented in the narrative for subgroups infected with hookworm and Ascaris: no significant anthropometric changes detected (no figures quoted). In those infected with Trichuris, weight gain was greater in the albendazole group (difference compared to placebo 0.28 kg, P = 0.038). Adverse events: no serious adverse events (albendazole 0/46 vs placebo 0/43). Myalgia and cough were reported significantly more frequently in the placebo group compared to albendazole. |
| Greenberg 1981 | Treatment group tended to show worse nutrition than placebo. Comparison showed no significant difference for all measured anthropometric variables for the total group and for subgroups defined by severity of infection (no figures provided). |
| Kloetzel 1982 | No significant difference was found between the groups. Results reported as the proportion of treatment or control group that improved, deteriorated, or experienced no change. Unclear which anthropological measures were used in this categorization process. Proportions in each category were not significantly different between trial arms (improved: 51% in mebendazole group vs 49% in control; deteriorated: 35% in mebendazole group vs 33% in control; no change: 14% in mebendazole group vs 18% in control; no significance test results quoted). |
| Koroma 1996 | Significant increases in weight‐for‐height, weight‐for‐age, and height‐for‐age z‐scores recorded in rural and urban treatment groups at 6 months. |
| Michaelsen 1985 | No significant difference in change in mean for haemoglobin. (tetrachloroethylene 0.22 g/100 mL vs placebo 0.09 g/100 mL; quoted as non‐significant) or weight for height at 5 months (tetrachloroethylene ‐1.3% of WHO reference mean vs placebo ‐0.4%; quoted as non‐significant). Adverse events: 17% (19/119: results not given for separate trial arms) of the children suffered adverse effects (nausea and ataxia) that began one and a half hours after treatment. All symptoms disappeared within four hours. Tetrachlorethylene is not in current use as a deworming drug. |
| Albendazole | No significant differences in weight‐for‐height, weight‐for‐age, and height‐for‐age z‐scores and skin fold thickness at 4 months. There was no statistically significant effect of deworming on weight, height, HAZ scores, WAZ scores, or WHZ scores. There were no statistically significant differences in skin fold thickness after four months of intervention. |
| Albendazole | No adverse events reported. No significant difference in BMI at 21 months follow‐up in children aged 19 years and less. Body mass index (kg/m2): median at follow‐up in treatment group 21.56 (IQR 19.44‐24.12) and in placebo group 22.42 (IQR 19.68 ‐ 25.56). |
| All children living in endemic area ‐ multiple dose | |
| Albendazole | During the trial there were 23 deaths, 13 were in the usual care arm and 10 were in the treatment arm. |
| Albendazole | Deworming showed no effect for death MD in deaths per child‐care centre at ages 1·0–6·0 was 0·16 (SE 0·11); mortality ratio 0·95, 95% CI 0·89 to 1·02). |
| Goto 2009 | No significant differences in mean z‐scores or prevalence of stunting, underweight or wasting between the intervention groups were found, and the changes between intervals (eg between weeks 0 to 12, 0 to 24, 0 to 36, 12 to 24, etc.) did not differ significantly between groups. |
| Hadju 1997 | No significant differences detected between treatment groups on basis of multivariate analyses controlling for age, sex, and ‘times’. |
| Hall 2006 (Cluster) | Trial authors reported no difference in final and change in height. MUAC and subscapular skinfold thickness improved significantly in the control group compared to the albendazole group (7.87 vs 7.61, P = 0.005 and 1.22 vs 1.05, P = 0.005 respectively). These results do not appear to have been adjusted for cluster randomization. The results that show no effect, however, will not remain non‐significant even after appropriate adjustment, though the CIs may change. |
| Lai 1995 | No difference in height or weight between treatment and control group at the end of 2‐year follow‐up. SDs not provided. Results stratified for males and females: |
| Le Huong 2007 | No obvious trend in nutrition variable. Anthropometric indices were calculated using WHO/NCHS reference data. Being wasted, stunted and underweight was defined by z‐scores ,< ‐ 2SD for weight‐for‐height, height‐for‐age and weight‐for‐age, respectively. |
| Albendazole | No effect on nutrition or haemoglobin demonstrated For haemoglobin a sample of around 4% (778/20,000) of the quasi‐randomized comparison of group 1 vs group 2 in 1998 was analysed. Height and weight data was collected on all individuals in standards 3‐8 (9102/20000) Difference in weight‐for age z‐score (treatment ‐ control): 0.00 (SE 0.04). Difference in height‐for‐age z‐score end value (treatment ‐ control): 0.09 (SE 0.05). |
| Albendazole | During the trial there were 16 deaths, 8 were in the placebo arm and 8 were in the treatment arm. No significant differences in mean z‐scores for weight‐for‐height, weight‐for‐age, and height‐for‐age z‐scores at 5 years of age. Height‐for‐age z‐score: at follow‐up in treatment group ‐1.33 (1.34) and in control group ‐1.27 (1.20). Weight‐for‐age z‐score: at follow‐up in treatment group ‐0.88 (0.95) and in control group ‐0.87 (0.91). Weight‐for‐height z‐score: at follow‐up in treatment group ‐0.13 (1.28) and in control group ‐0.17 (1.19). |
| Rousham 1994 (Cluster) | ANOVAS of the change in z‐scores revealed no significant improvement with treatment. Change in weight‐for‐age and weight‐for‐height z‐scores were significantly worse in the treatment group. Height‐for‐age z‐score (mebendazole 0.25 vs 0.17 in placebo group, P 'non‐significant'), weight‐for‐age z‐score (mebendazole 0.03 vs 0.12 in placebo group, P < 0.05), weight‐for‐height z‐score (mebendazole ‐0.25 vs ‐0.05 in placebo group, P < 0.001), and MUAC were presented (mebendazole 0.33 vs 0.23 in placebo group, P 'non‐significant'). |
| Stoltzfus 2001 | Mebendazole is reported as significantly reducing the prevalence of mild wasting malnutrition in a subgroup of children aged < 30 months only adjusted odds ratio for mebendazole 0.38 (95% CI 0.16 to 0.90) for weight‐for‐height z‐score < ‐1. Mebendazole is reported as significantly reducing the prevalence of poor appetite across the whole group (adjusted odds ratio for mebendazole 0.52 (95% CI 0.30 to 0.89) for weight‐for‐height z‐score < ‐1). Mebendazole had no impact on iron indices. Adjusted effect on motor scores had a tendency to favour mebendazole, but this was not significant. |
| Stoltzfus 1997 (Cluster) | Weight gain: in a subgroup of under 10 year olds, the twice‐yearly treated group experienced significantly greater weight gain (kg) compared to control (2.38 (SE 0.08) vs 2.11 (SE 0.08), P < 0.05). In the thrice‐yearly treatment group the difference was not significant (2.31 (SE 0.08) vs 2.11 (SE 0.08), no P value stated). |
| Willett 1979 | No statistical difference in nutrition in terms of height and weight differences between the 2 groups. Growth rates presented are adjusted for a number of variables. Weight gain (kg/year) in levamisole group 2.08 vs 1.92 in placebo group (P = 0.06). Height gain (cm/year) in levamisole group 7.58 vs 7.73 in placebo group (no significance quoted). |
| Trial details | Outcome measures | Results |
| Infected children identified by screening ‐ single dose | ||
| Mebendazole vs placebo, 1 month | Card sorting task; cancellation task (number of letter 's' in text deleted in a time period). | Changes in cognitive scores are not clearly reported since "the dose of mebendazole was inadequate to free children from infection". |
| Nokes 1992 2.25 months | Digit span (forward and backward); arithmetic and coding from Wechsler Intelligence Scale for Children; fluency; listening comprehension from the Clinical Evaluation of Language functions; matching familiar figures test. | Mean test scores pre‐ and post‐intervention presented with CIs No comment made on significance of unadjusted data. Results of multiple regression suggest a greater improvement in treated children in 3/10 tests (fluency, digit span forwards, digit span backwards). |
| Infected children identified by screening ‐ multiple dose | ||
| Simeon 1995 | 1. Main trial (264 children) 2. Subgroup 1 (189 children 189 infected children from original population) 3. Subgroup 2 (97 children from grade 5) |
|
| All children living in endemic area ‐ single dose | ||
| Albendazole | Cognitive performance was measured using Raven's Colored Matrices and also a series of cognitive tests from Wechsler's Intelligence Scale for Children III: digit span backward and forward, block design and coding. | Deworming had no significant effect on any of the cognitive tests. |
| Solon 2003 16 weeks | Cognitive ability was measured using a standardized written mental‐abilities test called the Primary Mental Abilities Test for Filipino Children (PMAT‐FC). The test covers general knowledge and comprehension, verbal relationships, fundamental mathematical comprehension and skills, numerical sequencing, and ability to perceive and apply relationships based on meaningless stimuli. | Deworming had either no effect or a negative effect on mental ability scores. Data was not reported. |
| All children living in endemic area ‐ multiple dose | ||
| Albendazole vs placebo, 2 years | 1045 participants. Developmental status (Denver Questionnaire). | No difference in development between treatment groups in terms of proportion with "normal" development. |
| Deworming package including albendazole vs placebo 1 year | 30,000 participants. Cognitive tests including picture search, Raven matrix, verbal fluency, digit span, Spanish learning, and a dynamic test using syllogisms measured for all three school groups in 2000. | Outcome data not reported for cognitive tests, though authors state: "Deworming treatment effects are not significantly different than zero for any component of the cognitive exam (results available on request)". |
| Albendazole vs placebo, post‐treatment | 870 participants. Block design, Picture vocabulary scale, Sentence repetition, Verbal fluency, Counting span, Running memory, Picture search, Wisconsin card sort test, Tap once tap twice task, Shapes task, Tower of London. | Deworming had no significant effect on any of the cognitive tests. |
| Stoltzfus 2001 | 359 participants. Motor and language development by parents reporting gross motor and language milestones using scoring system developed specifically for the trial. | Unadjusted data not reported. |
| Watkins 1996 | 212 participants. Interamerican vocabulary test; Interamerican reading test; Peabody picture vocabulary test. | All outcome measures reported as unadjusted scores. |
| Trial details | Outcome measures | Results |
| Infected children identified by screening ‐ single dose | ||
| Albendazole | VO2 max estimate (mL kg‐1 min‐1), 20 m running laps completed grip strength (kg), standing broad jump distance (cm). Mean values reported. | No effect was detected on any of the measures of physical well‐being (99 in the albendazole group and 95 in the control) |
| Albendazole vs placebo, 6 months follow‐up | Harvard Step Test | Deworming significantly improved children’s physical well‐being in a non‐randomly selected subgroup of children (33/171) Treatment group: mean = 80, SD = 5.51, N = 18 Placebo group: mean = 74, SD = 4.65, N = 15 MD = 6.00, 95% CI 2.53 to 9.4 |
| Albendazole vs placebo, 8 months follow‐up | Harvard Step Test | Deworming significantly improved children’s physical well‐being in a non‐random subgroup of children (54/328) Treatment group: mean = 82, SD = 3.64, N = 27 Placebo group: mean = 76, SD = 3.57, N = 26 MD = 6.00, 95% CI 4.06 to 7.94 |
| Outcome or subgroup title | No. of studies | No. of participants | Statistical method | Effect size |
| 1 Weight (kg) Show forest plot | 5 | 627 | Mean Difference (IV, Random, 95% CI) | 0.75 [0.24, 1.26] |
| 2 Height (cm) Show forest plot | 5 | 647 | Mean Difference (IV, Random, 95% CI) | 0.25 [0.01, 0.49] |
| 3 Mid‐upper arm circumference (cm) Show forest plot | 4 | 396 | Mean Difference (IV, Fixed, 95% CI) | 0.49 [0.39, 0.58] |
| 4 Triceps skin fold thickness (mm) Show forest plot | 3 | 352 | Mean Difference (IV, Random, 95% CI) | 1.34 [0.72, 1.97] |
| 5 Subscapular skin fold thickness (mm) Show forest plot | 2 | 339 | Mean Difference (IV, Fixed, 95% CI) | 1.29 [1.13, 1.44] |
| 6 Body mass index Show forest plot | 1 | Mean Difference (IV, Fixed, 95% CI) | Totals not selected | |
| 7 Haemoglobin (g/dL) Show forest plot | 2 | 247 | Mean Difference (IV, Random, 95% CI) | 0.10 [‐0.65, 0.86] |
| Outcome or subgroup title | No. of studies | No. of participants | Statistical method | Effect size |
| 1 Weight (kg) Show forest plot | 1 | Mean Difference (Fixed, 95% CI) | Totals not selected | |
| 2 Height (cm) Show forest plot | 1 | Mean Difference (IV, Fixed, 95% CI) | Totals not selected | |
| 3 Body mass index Show forest plot | 1 | Mean Difference (IV, Fixed, 95% CI) | Totals not selected | |
| 4 School attendance (days present at school) Show forest plot | 1 | Mean Difference (IV, Fixed, 95% CI) | Totals not selected | |
| 5 Mid‐upper arm circumference (cm) Show forest plot | 1 | Mean Difference (IV, Fixed, 95% CI) | Totals not selected | |
| 6 Triceps skin fold thickness (mm) Show forest plot | 1 | Mean Difference (IV, Fixed, 95% CI) | Totals not selected | |
| 7 Subscapular skin fold thickness (mm) Show forest plot | 1 | Mean Difference (IV, Fixed, 95% CI) | Totals not selected | |
| Outcome or subgroup title | No. of studies | No. of participants | Statistical method | Effect size |
| 1 Weight (kg) Show forest plot | 7 | 2719 | Mean Difference (IV, Fixed, 95% CI) | ‐0.04 [‐0.11, 0.04] |
| 1.1 High prevalence | 2 | 290 | Mean Difference (IV, Fixed, 95% CI) | 0.02 [‐0.15, 0.18] |
| 1.2 Moderate prevalence | 2 | 873 | Mean Difference (IV, Fixed, 95% CI) | 0.08 [‐0.10, 0.27] |
| 1.3 Low prevalence | 3 | 1556 | Mean Difference (IV, Fixed, 95% CI) | ‐0.09 [‐0.19, 0.01] |
| 2 Height (cm) Show forest plot | 5 | 1974 | Mean Difference (IV, Random, 95% CI) | ‐0.12 [‐0.33, 0.10] |
| 2.1 High prevalence | 1 | 227 | Mean Difference (IV, Random, 95% CI) | 0.06 [‐0.08, 0.20] |
| 2.2 Moderate prevalence | 1 | 191 | Mean Difference (IV, Random, 95% CI) | ‐0.20 [‐0.47, 0.07] |
| 2.3 Low prevalence | 3 | 1556 | Mean Difference (IV, Random, 95% CI) | ‐0.26 [‐0.74, 0.21] |
| 3 Mid‐upper arm circumference (cm) Show forest plot | 3 | 911 | Mean Difference (IV, Random, 95% CI) | 0.04 [‐0.19, 0.26] |
| 3.1 High prevalence | 1 | 207 | Mean Difference (IV, Random, 95% CI) | 0.09 [‐0.03, 0.21] |
| 3.2 Moderate prevalence | 1 | 482 | Mean Difference (IV, Random, 95% CI) | 0.19 [‐0.01, 0.40] |
| 3.3 Low prevalence | 1 | 222 | Mean Difference (IV, Random, 95% CI) | ‐0.3 [‐0.52, ‐0.08] |
| 4 Haemoglobin (g/dL) Show forest plot | 3 | 1005 | Mean Difference (IV, Fixed, 95% CI) | 0.06 [‐0.05, 0.17] |
| 4.1 Moderate prevalence | 2 | 658 | Mean Difference (IV, Fixed, 95% CI) | 0.06 [‐0.06, 0.17] |
| 4.2 Low prevalence | 1 | 347 | Mean Difference (IV, Fixed, 95% CI) | 0.06 [‐0.24, 0.36] |
| Outcome or subgroup title | No. of studies | No. of participants | Statistical method | Effect size |
| 1 Weight (kg) Show forest plot | 10 | 2656 | Mean Difference (Random, 95% CI) | 0.08 [‐0.11, 0.27] |
| 1.1 High prevalence | 2 | 306 | Mean Difference (Random, 95% CI) | 0.04 [‐0.08, 0.16] |
| 1.2 Moderate prevalence | 3 | 859 | Mean Difference (Random, 95% CI) | 0.11 [‐0.03, 0.25] |
| 1.3 Low prevalence | 5 | 1491 | Mean Difference (Random, 95% CI) | 0.06 [‐0.46, 0.57] |
| 2 Height (cm) Show forest plot | 7 | 1847 | Mean Difference (IV, Fixed, 95% CI) | 0.02 [‐0.14, 0.17] |
| 2.1 High prevalence | 1 | 227 | Mean Difference (IV, Fixed, 95% CI) | 0.06 [‐0.13, 0.25] |
| 2.2 Moderate prevalence | 1 | 129 | Mean Difference (IV, Fixed, 95% CI) | 0.10 [‐0.46, 0.66] |
| 2.3 Low prevalence | 5 | 1491 | Mean Difference (IV, Fixed, 95% CI) | ‐0.14 [‐0.46, 0.18] |
| 3 Mid‐upper arm circumference (cm) Show forest plot | 3 | 534 | Mean Difference (IV, Random, 95% CI) | ‐0.03 [‐0.25, 0.18] |
| 3.1 High prevalence | 1 | 207 | Mean Difference (IV, Random, 95% CI) | 0.08 [‐0.06, 0.22] |
| 3.2 Moderate prevalence | 1 | 129 | Mean Difference (IV, Random, 95% CI) | 0.06 [‐0.22, 0.33] |
| 3.3 Low prevalence | 1 | 198 | Mean Difference (IV, Random, 95% CI) | ‐0.35 [‐0.65, ‐0.05] |
| 4 Triceps skin fold thickness (mm) Show forest plot | 1 | Mean Difference (IV, Random, 95% CI) | Subtotals only | |
| 4.1 Moderate prevalence | 1 | 130 | Mean Difference (IV, Random, 95% CI) | ‐0.30 [‐1.28, 0.68] |
| 5 Haemoglobin (g/dL) Show forest plot | 7 | 3595 | Mean Difference (IV, Fixed, 95% CI) | ‐0.02 [‐0.08, 0.04] |
| 5.1 Moderate prevalence | 2 | 464 | Mean Difference (IV, Fixed, 95% CI) | 0.02 [‐0.15, 0.19] |
| 5.2 Low prevalence | 5 | 3131 | Mean Difference (IV, Fixed, 95% CI) | ‐0.02 [‐0.09, 0.04] |
| 6 School attendance (days present at school) Show forest plot | 2 | 293 | Mean Difference (Random, 95% CI) | 0.02 [‐0.04, 0.08] |
| 6.1 High prevalence | 2 | 293 | Mean Difference (Random, 95% CI) | 0.02 [‐0.04, 0.08] |
| Outcome or subgroup title | No. of studies | No. of participants | Statistical method | Effect size |
| 1 Weight (kg) Show forest plot | 2 | 1029 | Mean Difference (IV, Fixed, 95% CI) | 0.04 [‐0.11, 0.19] |
| 1.1 Moderate prevalence | 1 | 682 | Mean Difference (IV, Fixed, 95% CI) | 0.5 [‐0.28, 1.28] |
| 1.2 Low prevalence | 1 | 347 | Mean Difference (IV, Fixed, 95% CI) | 0.02 [‐0.13, 0.17] |
| 2 Height (cm) Show forest plot | 1 | Mean Difference (IV, Fixed, 95% CI) | Totals not selected | |
| 2.1 Low prevalence | 1 | Mean Difference (IV, Fixed, 95% CI) | 0.0 [0.0, 0.0] | |
| 3 Mid‐upper arm circumference (cm) Show forest plot | 1 | Mean Difference (IV, Fixed, 95% CI) | Subtotals only | |
| 3.1 Moderate prevalence | 1 | 482 | Mean Difference (IV, Fixed, 95% CI) | 0.19 [‐0.01, 0.40] |
| 4 Haemoglobin (g/dL) Show forest plot | 2 | 814 | Mean Difference (IV, Fixed, 95% CI) | 0.05 [‐0.07, 0.17] |
| 4.1 Moderate prevalence | 1 | 467 | Mean Difference (IV, Fixed, 95% CI) | 0.05 [‐0.08, 0.17] |
| 4.2 Low prevalence | 1 | 347 | Mean Difference (IV, Fixed, 95% CI) | 0.06 [‐0.24, 0.36] |
| Outcome or subgroup title | No. of studies | No. of participants | Statistical method | Effect size |
| 1 Weight (kg) Show forest plot | 2 | Mean Difference (Fixed, 95% CI) | 0.01 [‐0.13, 0.15] | |
| 1.1 High prevalence | 1 | Mean Difference (Fixed, 95% CI) | 0.0 [‐0.14, 0.14] | |
| 1.2 Moderate prevalence | 1 | Mean Difference (Fixed, 95% CI) | 0.5 [‐0.42, 1.42] | |
| 2 Height (cm) Show forest plot | 1 | Mean Difference (IV, Fixed, 95% CI) | Totals not selected | |
| 2.1 Low prevalence | 1 | Mean Difference (IV, Fixed, 95% CI) | 0.0 [0.0, 0.0] | |
| 3 Haemoglobin (g/dL) Show forest plot | 1 | Mean Difference (IV, Fixed, 95% CI) | Subtotals only | |
| 3.1 Moderate prevalence | 1 | 326 | Mean Difference (IV, Fixed, 95% CI) | ‐0.02 [‐0.21, 0.16] |
| Outcome or subgroup title | No. of studies | No. of participants | Statistical method | Effect size |
| 1 Weight (kg) Show forest plot | 10 | Mean Difference (Random, 95% CI) | 0.09 [‐0.10, 0.28] | |