Scolaris Content Display Scolaris Content Display

Comparison 1 Inositol supplementation versus control, Outcome 1 Death.
Figuras y tablas -
Analysis 1.1

Comparison 1 Inositol supplementation versus control, Outcome 1 Death.

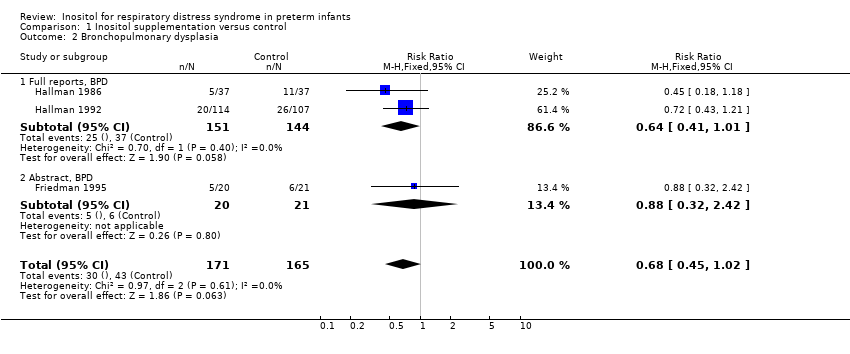
Comparison 1 Inositol supplementation versus control, Outcome 2 Bronchopulmonary dysplasia.
Figuras y tablas -
Analysis 1.2

Comparison 1 Inositol supplementation versus control, Outcome 2 Bronchopulmonary dysplasia.

Comparison 1 Inositol supplementation versus control, Outcome 3 Death or Bronchopulmonary Dysplasia.
Figuras y tablas -
Analysis 1.3

Comparison 1 Inositol supplementation versus control, Outcome 3 Death or Bronchopulmonary Dysplasia.

Comparison 1 Inositol supplementation versus control, Outcome 4 Intraventricular hemorrhage, any grade.
Figuras y tablas -
Analysis 1.4

Comparison 1 Inositol supplementation versus control, Outcome 4 Intraventricular hemorrhage, any grade.

Comparison 1 Inositol supplementation versus control, Outcome 5 Intraventricular hemorrhage, grades III or IV.
Figuras y tablas -
Analysis 1.5

Comparison 1 Inositol supplementation versus control, Outcome 5 Intraventricular hemorrhage, grades III or IV.

Comparison 1 Inositol supplementation versus control, Outcome 6 Retinopathy of prematurity, stage 4 or needing treatment.
Figuras y tablas -
Analysis 1.6

Comparison 1 Inositol supplementation versus control, Outcome 6 Retinopathy of prematurity, stage 4 or needing treatment.

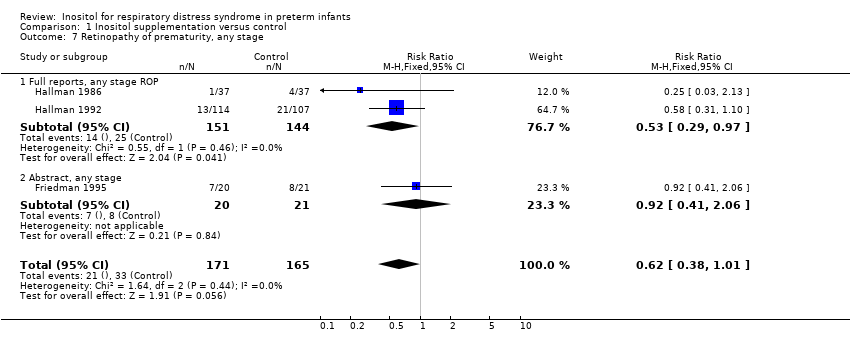
Comparison 1 Inositol supplementation versus control, Outcome 7 Retinopathy of prematurity, any stage.
Figuras y tablas -
Analysis 1.7

Comparison 1 Inositol supplementation versus control, Outcome 7 Retinopathy of prematurity, any stage.

Comparison 1 Inositol supplementation versus control, Outcome 8 Necrotizing Enterocolitis.
Figuras y tablas -
Analysis 1.8

Comparison 1 Inositol supplementation versus control, Outcome 8 Necrotizing Enterocolitis.

Comparison 1 Inositol supplementation versus control, Outcome 9 Sepsis.
Figuras y tablas -
Analysis 1.9

Comparison 1 Inositol supplementation versus control, Outcome 9 Sepsis.

Comparison 1. Inositol supplementation versus control

Outcome or subgroup title

No. of studies

No. of participants

Statistical method

Effect size

1 Death Show forest plot

2

295

Risk Ratio (M‐H, Fixed, 95% CI)

0.48 [0.28, 0.80]

2 Bronchopulmonary dysplasia Show forest plot

3

336

Risk Ratio (M‐H, Fixed, 95% CI)

0.68 [0.45, 1.02]

2.1 Full reports, BPD

2

295

Risk Ratio (M‐H, Fixed, 95% CI)

0.64 [0.41, 1.01]

2.2 Abstract, BPD

1

41

Risk Ratio (M‐H, Fixed, 95% CI)

0.88 [0.32, 2.42]

3 Death or Bronchopulmonary Dysplasia Show forest plot

2

295

Risk Ratio (M‐H, Fixed, 95% CI)

0.56 [0.42, 0.77]

4 Intraventricular hemorrhage, any grade Show forest plot

2

307

Risk Ratio (M‐H, Fixed, 95% CI)

0.82 [0.61, 1.11]

5 Intraventricular hemorrhage, grades III or IV Show forest plot

2

307

Risk Ratio (M‐H, Fixed, 95% CI)

0.55 [0.32, 0.95]

6 Retinopathy of prematurity, stage 4 or needing treatment Show forest plot

2

262

Risk Ratio (M‐H, Fixed, 95% CI)

0.09 [0.01, 0.67]

7 Retinopathy of prematurity, any stage Show forest plot

3

336

Risk Ratio (M‐H, Fixed, 95% CI)

0.62 [0.38, 1.01]

7.1 Full reports, any stage ROP

2

295

Risk Ratio (M‐H, Fixed, 95% CI)

0.53 [0.29, 0.97]

7.2 Abstract, any stage

1

41

Risk Ratio (M‐H, Fixed, 95% CI)

0.92 [0.41, 2.06]

8 Necrotizing Enterocolitis Show forest plot

2

307

Risk Ratio (M‐H, Fixed, 95% CI)

0.96 [0.39, 2.37]

9 Sepsis Show forest plot

2

307

Risk Ratio (M‐H, Fixed, 95% CI)

0.83 [0.53, 1.29]

Figuras y tablas -
Comparison 1. Inositol supplementation versus control