Assisted reproductive technologies for male subfertility
Referencias
References to studies included in this review
References to studies excluded from this review
References to studies awaiting assessment
Additional references
References to other published versions of this review
Characteristics of studies
Characteristics of included studies [ordered by study ID]
| Methods | Design: cross‐over alternating Pre‐cross‐over data: available Power calculation: not stated ITT: no ITT Number of couples randomised: 75 Number of couples analysed: 56 Number of couples included in this review: 30 Number of started cycles: not stated Number of completed cycles: 95 Number of drop‐outs: 17 before starting first treatment cycles (failed to return (n = 9), refused randomisation (n = 5), other subfertility factors (n = 3)) and 27 during the study (moved out of the geographical area (n = 3), failed to return (n = 6), cross‐over (n = 18)). 2 couples became pregnant before the initiation of the first treatment cycle Number of cancelled cycles: not stated Centre: single‐centre, private infertility practice of the University of Texas, Southwestern Medical Center at Dallas, TX, USA | |
| Participants | Couples: male (n = 26) and unexplained (n = 30) subfertility Definition male subfertility: sperm concentration < 20 million/mL, total motility < 50%, normal morphology < 50%, or a combination of these (WHO 1987) Number of semen samples: 2 Age of women (whole group): mean 33 years (range 24‐41) Duration of subfertility: mean 3.5 years (range 2.4‐5.5) Primary/secondary subfertility: not stated Ovulatory status: BBT, luteal progesterone > 10 ng/mL or in‐phase late luteal endometrial biopsy Tubal patency: DLS, HSG, or both PCT: not stated Previous treatment: endocrinologically/surgically correctable factors were treated, no previous ART Exclusion criteria: sperm antibodies | |
| Interventions | Comparison: IUI with OH cycles vs. IUI in natural cycles Treatment duration: maximum of 4 cycles Method OH: CC 50 mg days 5‐9 Timing ovulation for IUI in natural cycles: LH surge urine Timing ovulation for IUI + OH cycles: measurement follicles > 18 mm Ovulation induction (IUI + OH cycles): hCG 10,000 IM when ≥ 1 follicles 18 mm Number of IUI per cycle: 1 or 2 Timing IUI in natural cycles: first on day of LH peak, a second next day when possible Timing IUI + OH cycles: single IUI 32 hours after injection Sperm preparation: wash (human tubal fluid) and centrifugation Number of inseminated spermatozoa: not stated Cancellation criteria: women exhibiting an anovulatory cycle at any time during the study | |
| Outcomes | PR per couple for the first cycle, PR per completed cycle OHSS: not stated Miscarriage rate: not stated Multiple PR: not stated Ectopic PR: not stated Definition/diagnosis pregnancy: gestational sac confirmed by USS | |
| Notes | Large number of drop‐outs. Authors supplied unpublished pre‐cross‐over data. No stratification by diagnosis category of subfertility, unequal division of couples between treatment options | |
| Risk of bias | ||
| Bias | Authors' judgement | Support for judgement |
| Random sequence generation (selection bias) | Low risk | Computer‐generated random numbers table |
| Allocation concealment (selection bias) | Unclear risk | Unclear |
| Blinding (performance bias and detection bias) | Low risk | No blinding stated, but outcome was not likely to be influenced |
| Incomplete outcome data (attrition bias) | Unclear risk | Less than 95% of the couples included in analysis |
| Selective reporting (reporting bias) | Unclear risk | No protocol available, adverse effects not stated |
| Other bias | High risk | Cross‐over design |
| Methods | Design: parallel study Power calculation (for whole group): stated ITT: done Number of couples randomised: 602 (male subfertility, n = 57) Number of couples analysed: 602 (male subfertility, n = 57) Number of couples included in this review: 36 Number of started cycles: 104 Number of completed cycles: 97 Number of drop‐outs: 4 (personal reasons (n = 2), medical reasons (n = 2)) Number of cancelled cycles: 7 (no embryo transfer (n = 4), no IUI (n = 3)) Centre: multicentre, 17 centres, the Netherlands | |
| Participants | Couples: unexplained (n = 545) and mild male (n = 57) subfertility Definition male subfertility: pre‐wash TMSC 3‐10 million Number of semen samples: not stated Mean age of women (whole group): IUI + OH 34 years (SD ± 3.67), IVF‐SET 33 years (SD ± 3.39), IVF‐MNC 33 years (SD ± 3.50) Duration of subfertility (mean (IQR) for whole group): IUI + OH 2.30 years (1.82‐3.13), IVF‐SET 2.13 years (1.73‐3.01), IVF‐MNC 2.14 years (1.77‐2.81) Primary/secondary subfertility: mixed Ovulatory status: done Tubal patency: chlamydia antibody test, HSG or DLS PCT: not stated Previous treatment: none Exclusion criteria: anovulation, double‐sided tubal disease, severe endometriosis, premature ovarian failure and endocrine disorders | |
| Interventions | Comparison: IVF‐SET (n = 18) vs. IVF‐MNC (n = 21) vs. IUI in cycles with OH (n = 18) Treatment duration: maximum 12 months (3 cycles of IVF‐SET plus subsequent cryo cycles, 6 cycles of IVF‐MNC or 6 cycles of IUI with COH) Method OH for IVF‐SET: long or short agonist or antagonist protocol (adhere to local stimulation protocols), COH using FSH 150 IU Method OH for IVF‐MNC: daily injections of GnRH antagonist 0.25 mg and FSH 150 IU when the leading follicle had a diameter of ≥ 14 mm Method OH for IUI: CC 100 mg (cycle day 3‐7) or FSH 75 IU (daily) Timing ovulation for IVF‐SET: measurement of ≥ 2 follicles of ≥ 18 mm Timing ovulation for IVF‐MNC: measurement of a follicle of 17‐18 mm Timing ovulation for IUI + OH cycles: measurement of at least 1 follicle of 17‐18 mm Ovulation induction for IVF: hCG 10,000 IU Ovulation induction for IUI + OH cycles: hCG 5000 IU Number of IUI per cycle: 1 Timing IUI + OH cycles: 36 hours after hCG Semen preparation: not stated Number of inseminated spermatozoa: not stated Embryo transfer: 2‐4 days after oocyte retrieval 1 good‐quality embryo or 2 embryos if no good embryos were available After results of pilot study only SET Luteal phase support (IVF): hCG 1500 IU on day 5, 8 and 11 after oocyte retrieval Cancellation criteria IUI: OHSS (> 3 follicles ≥ 16 mm or > 5 follicles > 12 mm) Cancellation criteria IVF: not stated | |
| Outcomes | Live birth and PR per couple OHSS: stated Miscarriage rate: stated Multiple PR: stated Ectopic PR: not stated Definition/diagnosis pregnancy: confirmed by USS | |
| Notes | Power calculation: 200 couples were needed per treatment group to obtain an 80% power to detect a difference of 12.5% between IUI with COH and IVF‐SET Inclusion criteria: women aged 18‐38 years, an unfavourable prognosis for natural conception (Hunault < 30%) and diagnosis of unexplained or mild male subfertility. Author supplied separate data for male subfertility. No stratification by diagnosis category of subfertility | |
| Risk of bias | ||
| Bias | Authors' judgement | Support for judgement |
| Random sequence generation (selection bias) | Low risk | A web‐based generated program |
| Allocation concealment (selection bias) | Low risk | Unique numbers with allocation code |
| Blinding (performance bias and detection bias) | Low risk | No blinding stated, but outcome was not likely to be influenced |
| Incomplete outcome data (attrition bias) | Low risk | Complete outcome data |
| Selective reporting (reporting bias) | Low risk | Protocol available (Bensdorp 2009) |
| Other bias | Low risk | No other bias |
| Methods | Design: cross‐over alternating Pre‐cross‐over data: available Power Calculation: stated ITT: done Number of couples randomised: 74 Number of couples analysed: 74 Number of couples included in this review: 74 Number of started cycles: 320 Number of completed cycles: 308 Number of drop‐outs: 6 (personal reasons) Number of cancelled cycles: 12 (premature or missed LH surge (n = 7), OHSS (n = 5)) Centre: single centre, Utrecht, the Netherlands | |
| Participants | Couples: male subfertility Definition male subfertility: concentration < 20 million/mL, motility < 40%, normal morphology < 40%, or a combination of these Number of semen samples: ≥ 2 Age of women: 30.7 years (range 24‐39) Duration of subfertility: 3.1 years (range 2‐9) Primary/secondary subfertility: mixed Ovulatory status: BBT and luteal progesterone > 9.7 ng/mL Tubal patency: HSG, DLS, or both PCT: done Previous treatment: not stated Exclusion criteria: sperm antibodies, cervical factor | |
| Interventions | Comparison: IUI with OH cycles vs. IUI in natural cycles Treatment duration: maximum 6 cycles Method OH: HMG 75 IU/day up to HMG 150 IU/day starting on cycle day 3 Timing ovulation for IUI in natural cycles: LH surge blood Timing ovulation for IUI + OH cycles: measurement follicles ≥ 18 mm or LH surge blood Ovulation induction (IUI + OH cycles): hCG 5000 IU Number of IUI per cycle: 1 Timing IUI in natural cycles: 26 hours after LH surge Timing IUI + OH cycles: 38‐40 hours after hCG Sperm preparation: wash (Ham's F10) and Percoll Number of inseminated spermatozoa: no conception observed below threshold of < 1 million motile spermatozoa Cancellation criteria: ≥ 4 follicles ≥ 18 mm or oestradiol > 1635 pg/mL, premature LH surge, no LH surge detected | |
| Outcomes | PR and live birth rate per started and completed cycle OHSS rate: stated Miscarriage rate: stated Multiple PR: stated Ectopic PR: not stated Definition/diagnosis pregnancy: hCG in urine + USS at 6‐7 weeks | |
| Notes | Power calculation: 150 cycles per treatment would be needed to detect an 8% difference (numbers based on previous studies) between natural cycles vs. stimulated cycles | |
| Risk of bias | ||
| Bias | Authors' judgement | Support for judgement |
| Random sequence generation (selection bias) | Unclear risk | Not stated |
| Allocation concealment (selection bias) | Low risk | Opaque sealed envelopes |
| Blinding (performance bias and detection bias) | Low risk | No blinding stated, but outcome was not likely to be influenced |
| Incomplete outcome data (attrition bias) | Low risk | Complete outcome data, adequate description of drop‐outs |
| Selective reporting (reporting bias) | Unclear risk | No protocol available |
| Other bias | High risk | Cross‐over design |
| Methods | Design: cross‐over alternating Pre‐cross‐over data: not stated Power calculation: stated ITT: not stated Number of couples randomised: not stated Number of couples analysed: 73 Number of couples included in this review: 63 Number of started cycles: 384 Number of completed cycles: 384 Number of drop‐outs: not stated Number of cancelled cycles: none Centre: single centre, L'Aquila, Italy | |
| Participants | Couples: male subfertility (OAT) (n = 63), immunological subfertility (n = 10) Definition male subfertility: motile sperm count < 10 million/mL (due to oligozoospermia (< 20 million/mL), asthenozoospermia (< 50% progressive motility)), teratozoospermia (normal sperm morphology < 15%), immunological subfertility, or a combination of these Number of semen samples: ≥ 2 Age of women: ≤ 40 years Duration of subfertility: ≥ 2 years Primary/secondary subfertility: primary Ovulatory status: mid‐luteal phase progesterone ≥ 10 ng/mL, day 3 FSH < 10 IU/mL Tubal patency: HSG, DLS, or both PCT: done Previous treatment: not stated Exclusion criteria: < 1 million motile spermatozoa after semen preparation | |
| Interventions | Comparison: TI in natural cycles vs. IUI with OH cycles vs. IUI in natural cycles Treatment duration: maximum 9 cycles (6 IUI cycles) Method OH: CC 50 mg/day (cycle day 3‐7) and hMG 75 IU/day (cycle day 8 and 9) Timing of ovulation: LH surge urine or measurement of at least 1 follicle ≥ 20 mm when no LH surge was detected Ovulation induction (when no LH surge was detected): hCG 10,000 IU Number of IUI per cycle: 1 or 2 Timing IUI: the day after LH surge and in 2 consecutive days if the LH surge was detected in the evening or 39‐41 hours after hCG Timing intercourse: the day after LH surge Sperm preparation: swim up procedure Number of inseminated spermatozoa: not stated Cancellation criteria: not stated | |
| Outcomes | PR per completed cycle, authors supplied live birth rates per completed cycle OHSS: stated Miscarriage rate: stated Multiple PR: stated Ectopic PR: not stated Definition/diagnosis pregnancy: intrauterine gestational sac detected by USS | |
| Notes | Authors supplied unpublished pre‐cross‐over data. No stratification by diagnosis category of subfertility (male subfertility and immunological subfertility) | |
| Risk of bias | ||
| Bias | Authors' judgement | Support for judgement |
| Random sequence generation (selection bias) | Unclear risk | Not stated |
| Allocation concealment (selection bias) | High risk | On chronological basis |
| Blinding (performance bias and detection bias) | Low risk | No blinding stated, but outcome was not likely to be influenced |
| Incomplete outcome data (attrition bias) | Low risk | Authors supplied unpublished pre‐cross‐over data |
| Selective reporting (reporting bias) | Unclear risk | No protocol available |
| Other bias | High risk | Cross‐over design |
| Methods | Design: parallel study Power calculation (for whole group): stated ITT: done Number of couples randomised: 258 Number of couples analysed: 258 Number of couples included in this review: 77 Number of started cycles: 963 (male subfertility = 293) Number of completed cycles: 184 Number of drop‐outs (whole group): > 10% Number of cancelled cycles (whole group): > 10% Centre: single centre, Vrije Universitieit Medical Centre, Amsterdam, the Netherlands | |
| Participants | Couples: male (n = 77) and unexplained (n = 179) subfertility Definition male subfertility: TMSC of < 20 million progressively motile sperm Number of semen samples: 3 out of 5 Mean age of women (only male subfertility): IUI + OH 31.7 years (SD ± 3.92), IUI in natural cycle 31.6 years (SD ± 3.73), IVF 32.1 years (SD ± 4.20) Duration of subfertility (only male subfertility): IUI + OH 4.2 years (SD ± 1.9), IUI in natural cycle 3.9 years (SD ± 1.7), IVF 4.5 years (SD ± 2.8) Primary/secondary subfertility: mixed Ovulatory status: BBT, endometrial biopsy Tubal patency: DLS + HSG PCT: done Previous treatment: not stated Exclusion criteria: cycle disorders, untreated endometriosis, bilateral occluded tubes or semen sample yielded < 1 million progressively motile spermatozoa after processing, > 20% carried antibodies or > 50% had no acrosome | |
| Interventions | Comparison: IUI with OH cycles vs. IUI in natural cycles vs. IVF Treatment duration: maximum 6 cycles Method OH for IUI: FSH 75 IU (starting dose) Method OH for IVF: women < 38 years: 'long' protocol: GnRH agonist and FSH or hMG 150‐225 IU; women > 38 years: 'short' protocol Timing ovulation for IUI in natural cycles: LH surge urine Timing ovulation for IUI + OH cycles: measurement 1‐3 follicles > 18 mm or LH surge urine Timing ovulation for IVF: measurement at least 1 follicle > 18 mm and 3 follicles > 16 mm Ovulation induction (IUI + OH cycles and IVF): hCG 10,000 IU Number of IUI per cycle: 1 Timing IUI in natural cycles: 20‐30 hours after LH surge Timing IUI + OH cycles: 20‐30 hours after LH surge, 40‐42 hours after hCG when no LH surge was detected Semen preparation: Percoll gradient technique Number of inseminated spermatozoa: not stated Embryo transfer: 48‐72 hours after oocyte retrieval: women ≤ 35 years: maximum 2 embryos; women > 35 years: maximum 3 embryos Luteal phase support (IVF): 3 doses of progesterone 200 mg/day intravaginally, in case of breakthrough bleeding hCG 1500 IU every 48 hour Cancellation criteria IUI: > 3 follicles of ≥ 18 mm or > 6 follicles of ≥ 14 mm Cancellation criteria IVF: serum oestradiol > 20,000 nmol/L | |
| Outcomes | Live birth rate per couple (PR include only pregnancies that resulted in at least 1 live birth) OHSS: stated Miscarriage rate: not stated Multiple PR: stated Ectopic PR: not stated Definition/diagnosis pregnancy: LH urine and USS confirmation | |
| Notes | Power calculation: 80 couples were needed per treatment group to obtain a 90% power to detect a difference of 9% between IUI and IVF. Stratification for woman's age, duration of subfertility, diagnosis, category of subfertility, presence of either 1 or 2 ovaries | |
| Risk of bias | ||
| Bias | Authors' judgement | Support for judgement |
| Random sequence generation (selection bias) | Low risk | Computer‐generated randomisation schedule |
| Allocation concealment (selection bias) | Low risk | Numbered masked and sealed envelopes |
| Blinding (performance bias and detection bias) | Low risk | No blinding stated, but outcome was not likely to be influenced |
| Incomplete outcome data (attrition bias) | Low risk | Complete outcome data, adequate description of drop‐outs/cancellations |
| Selective reporting (reporting bias) | Unclear risk | No protocol available |
| Other bias | Low risk | No other bias |
| Methods | Design: cross‐over after 3 cycles Pre‐cross‐over data: available Power calculation: not stated ITT: not stated Number of couples randomised: 62 Number of couples analysed: 62 Number of couples included in this review: 62 Number of started cycles: 314, before cross‐over 172 Number of completed cycles: 258, before cross‐over 143 Number of drop‐outs: not stated Number of cancelled cycles: 56 Centre: single centre, Athens, Greece | |
| Participants | Couples: male subfertility Definition male subfertility: sperm concentration < 20 million/mL, progressive motility < 30%, normal morphology < 40%, or a combination of these Number of semen samples: 3 Age of women: mean 30.5 years (SD ± 2.6) Duration of subfertility: mean 5.8 years (SD ± 3.9) Primary/secondary subfertility: mixed Ovulatory status: BBT, luteal progesterone ≥ 32 nmol/L and in‐phase endometrial biopsy Tubal patency: HSG and DLS PCT: not stated Previous treatment: not stated Exclusion criteria: abnormal serum levels of testosterone, dehydroepiandrosterone‐sulphate, prolactin or thyroid‐stimulating hormone in women | |
| Interventions | Comparison: IUI with OH cycles vs. TI with OH Treatment duration: maximum 6 cycles Method OH: day 3‐9 hMG 75 IU/day, if no increase in serum oestradiol was observed, dose increased to hMG 150 IU/day for next 5 days Timing ovulation: measurement of follicle > 16 mm and oestradiol ≤ 5500 pmol/L, 24 hours after last hMG Ovulation induction: hCG 10,000 IU Number of IUI per cycle: 1 Timing IUI: 36‐40 hours after hCG administration Timing intercourse: 36‐40 hours after hCG administration Sperm preparation: wash (Ham's 10) 2‐layer Percoll gradient (40% and 90%) Number of inseminated spermatozoa: not stated Cancellation criteria: OH | |
| Outcomes | PR per completed and per started cycle OHSS: not stated Miscarriage: not stated Multiple PR: not stated Ectopic PR: not stated Definition/diagnosis pregnancy: hCG serum and gestational sac on USS | |
| Notes | ||
| Risk of bias | ||
| Bias | Authors' judgement | Support for judgement |
| Random sequence generation (selection bias) | Unclear risk | Not stated |
| Allocation concealment (selection bias) | Unclear risk | Unclear |
| Blinding (performance bias and detection bias) | Low risk | No blinding stated, but outcome was not likely to be influenced |
| Incomplete outcome data (attrition bias) | Low risk | Complete outcome data (pre‐ and after cross‐over) |
| Selective reporting (reporting bias) | Unclear risk | No protocol available, adverse effects not stated |
| Other bias | High risk | Cross‐over design |
| Methods | Design: parallel Power calculation: not stated ITT: unclear Number of couples randomised: 932 Number of couples analysed: not stated Number of couples included in this review: 254 Number of started cycles: 4676 Number of completed cycles: 2678 Number of drop‐outs: 167 Number of cancelled cycles: 292 Centre: multicentre, 10 clinical sites, USA | |
| Participants | Couples: male and unexplained subfertility Definition male subfertility: sperm concentration < 20 million/mL, motility < 50% Number of semen samples: not stated Age of women (whole group): 32 years (SD ± 4) Duration of subfertility: IUI in natural cycle 34 months (SD ± 4), IUI with OH cycle 35 (SD ± 5) Primary/secondary subfertility: mixed Ovulatory status: in phase endometrial biopsy Tubal patency: DLS + HSG PCT: not stated Previous treatment: none Exclusion criteria: antisperm antibodies | |
| Interventions | Comparison: IUI with OH cycles vs. IUI in natural cycles (ICI in natural cycles vs. ICI with OH cycles) Treatment duration: maximum 6 cycles Method OH: FSH 150 IU days 3‐7, from day 8 onwards dose adjusted Timing ovulation for IUI in natural cycles: LH surge urine Timing ovulation for IUI + OH cycles: measurement of 2 follicles ≥ 18 mm, serum oestradiol concentration 500‐3000 pg/mL Ovulation induction (IUI + OH cycles): hCG 10,000 IU Number of IUI per cycle: 1 Timing IUI in natural cycles: day after LH surge Timing IUI + OH cycles: 36‐40 hours after hCG Sperm preparation: Ham's F‐10 Number of inseminated spermatozoa: not stated Cancellation criteria: if no surge in urinary excretion LH for IUI in natural cycle or for IUI + OH if serum oestradiol after 3 days > 3000 pg/mL | |
| Outcomes | Live birth per couple or cycle, PR per couple or cycle OHSS rate: stated Miscarriage rate: stated Multiple PR: stated Ectopic PR: stated Definition/diagnosis pregnancy: hCG measured on day 15 and 17 | |
| Notes | Author provided separate data for male subfertility, but states that randomisation might not hold | |
| Risk of bias | ||
| Bias | Authors' judgement | Support for judgement |
| Random sequence generation (selection bias) | Low risk | Computer‐generated permuted block procedure |
| Allocation concealment (selection bias) | Low risk | Locked computer files |
| Blinding (performance bias and detection bias) | Low risk | No blinding stated, but outcome was not likely to be influenced |
| Incomplete outcome data (attrition bias) | Low risk | Author supplied separate data for male subfertility |
| Selective reporting (reporting bias) | Unclear risk | No protocol available |
| Other bias | Low risk | No other bias |
| Methods | Design: cross‐over alternating Pre‐cross‐over data: partly extractable Power calculation: not stated ITT: not stated Number of couples randomised: 35 Number of couples analysed: 35 Number of couples included in this review: 21 Number of started cycles: not stated Number of completed cycles: 39 Number of drop‐outs: not stated Number of cancelled cycles: not stated Centre: single centre, Adelaide, Australia | |
| Participants | Couples: male subfertility Definition male subfertility: ≥ 2 of the following criteria: sperm density < 40 million/mL, motility < 45%, normal morphology < 40%, < 60 million motile spermatozoa Number of semen samples: ≥ 3 Age of women: not stated Duration of subfertility: > 3 years, not further specified Primary/secondary subfertility: not stated Ovulatory status: luteal progesterone > 20 nmol/L Tubal patency: laparoscopic tubal dye insufflation test PCT: done Previous treatment: not stated Exclusion criteria: positive PCT | |
| Interventions | Comparison: IUI in natural cycles vs. TI in natural cycles vs. natural cycles Treatment duration: maximum 12 cycles Timing ovulation natural cycles: symptothermal methods Timing ovulation TI in natural cycles and IUI in natural cycles: LH surge Ovulation induction: none Timing IUI: day of LH surge Timing intercourse: day after LH surge Number of inseminations: 1 Number of inseminated spermatozoa: stated Cancellation criteria: not stated | |
| Outcomes | PR per completed cycle OHSS: not stated Miscarriage rate: not stated Multiple PR: not stated Ectopic PR: not stated Definition/diagnosis pregnancy: not further defined | |
| Notes | Pre‐cross‐over data only partly available. No reply from author, received letter back as wrongly addressed | |
| Risk of bias | ||
| Bias | Authors' judgement | Support for judgement |
| Random sequence generation (selection bias) | Unclear risk | Not stated |
| Allocation concealment (selection bias) | Unclear risk | Unclear |
| Blinding (performance bias and detection bias) | Low risk | No blinding stated, but outcome was not likely to be influenced |
| Incomplete outcome data (attrition bias) | Low risk | Pre‐cross‐over data partly available |
| Selective reporting (reporting bias) | Unclear risk | No protocol available, adverse effects not stated |
| Other bias | High risk | Cross‐over design |
| Methods | Design: parallel Power calculation: not stated ITT: no Number of couples randomised: 200 Number of couples analysed: 184 Number of couples included in this review: 81 Number of started cycles: not stated Number of completed cycles: 462, 213 for male subfertility Number of drop‐outs/cancelled cycles: 16; 11 for male subfertility (family problems (n = 5), poor response to ovulation induction (n = 3), exaggerated response to ovulation induction (n = 8) Centre: single centre, Cagliari, Italy | |
| Participants | Couples: male (n = 92) and unexplained (n = 108) subfertility Definition male subfertility: sperm concentration 10‐20 million/mL, progressive motility 15‐25%, total motility 30‐50%, normal morphology 30‐50% Number of semen samples: ≥ 2 Age of women: 34.2 years (SD ± 4.8, range 27‐36) Duration of subfertility: 51.2 months (SD ± 14.3) Primary/secondary subfertility: not stated Ovulatory status: in‐phase endometrial biopsy, USS evidence ovulation, female endocrine profile Tubal patency: DLS, HSG PCT: done Previous treatments: all couples had received 3 cycles CC‐induced TI and 3 cycles CC‐induced IUI Exclusion criteria: severe male subfertility, female factor subfertility | |
| Interventions | Comparison: IUI with OH cycles vs. TI with OH cycles Treatment duration: maximum 3 cycles Method OH: 3 ampoules FSH starting from cycle day 3, personally adjusted to endocrine monitoring and USS Timing of ovulation induction: measurement of at least 2 follicle ≥ 16 mm and oestradiol 800‐1500 pg/mL Ovulation induction: 10.000 hCG 36 hours after last injection FSH Number of IUI per cycle: 1 Timing of IUI: 30‐36 hours after hCG Timing intercourse: 12 hours after hCG Sperm preparation: wash (Menezo B2) and swim unconventional layering technique Number of inseminated spermatozoa: not stated Cancellation criteria: oestradiol > 1500 pg/mL or poor response to OH | |
| Outcomes | PR per couple PR per completed cycle OHSS: stated Miscarriage rate: stated Multiple PR: stated Ectopic PR: stated Definition/diagnosis pregnancy: hCG (> 25 IU/L) in serum always confirmed by USS | |
| Notes | ||
| Risk of bias | ||
| Bias | Authors' judgement | Support for judgement |
| Random sequence generation (selection bias) | Low risk | Computer‐generated random numbers table |
| Allocation concealment (selection bias) | Low risk | Numbered sealed envelopes |
| Blinding (performance bias and detection bias) | Low risk | No blinding stated, but outcome was not likely to be influenced |
| Incomplete outcome data (attrition bias) | Unclear risk | Less than 95% of the couples included in analysis |
| Selective reporting (reporting bias) | Unclear risk | No protocol available |
| Other bias | Low risk | No other bias |
| Methods | Design: cross‐over alternating Pre‐cross‐over data: available Power calculation: not stated ITT: not stated Number of couples randomised: 76 Number of couples analysed: 76 Number of couples included in this review: 59 Number of started cycles: 249 Number of completed cycles: 202 Number of drop‐outs: not stated Number of cancelled cycles: 47 Centre: single centre, University Hospital Utrecht, the Netherlands | |
| Participants | Couples: male subfertility Definition male subfertility: sperm concentration < 20 million/mL, total motility < 40%, normal morphology < 40%, or a combination of these Number of semen samples: 4 Age of women: 32 years (range 24‐39) Duration of subfertility: 4.5 years (range 2‐10) Primary/secondary subfertility: mixed Ovulatory status: BBT, luteal progesterone ≥ 31 nmol/L Tubal patency: DLS, HSG PCT: done Previous fertility treatment: not stated Exclusion criteria: sperm antibodies | |
| Interventions | Comparison: IUI with OH cycles vs. TI with OH cycles Treatment duration: maximum 6 cycles Method OH: 150 IU HMG/day starting from cycle day 3 Timing ovulation: measurement of leading follicle ≥ 18 mm and LH surge Ovulation induction: hCG 10,000 IU Number of IUI per cycle: 1 Timing IUI: 38‐40 hours after hCG injections or following morning in case LH surged Timing intercourse: evening next day, or same evening in case LH surged Method of semen preparation; Wash (Ham's F10) and Percoll gradient technique Number of inseminated spermatozoa: not stated Cancellation criteria: ≥ 4 follicles ≥ 18 mm or oestradiol > 6000 pmol/L | |
| Outcomes | Live birth per cycle, PR per completed cycle, PR per started cycle OHSS: stated Miscarriage rate: stated Multiple PR: stated Ectopic PR: not stated Abruptio placenta: stated Definition/diagnosis pregnancy: HCG urine and USS confirmation | |
| Notes | ||
| Risk of bias | ||
| Bias | Authors' judgement | Support for judgement |
| Random sequence generation (selection bias) | Low risk | Random number table |
| Allocation concealment (selection bias) | Low risk | Numbered sealed opaque envelopes |
| Blinding (performance bias and detection bias) | Low risk | No blinding stated, but outcome was not likely to be influenced |
| Incomplete outcome data (attrition bias) | Low risk | Complete outcome data |
| Selective reporting (reporting bias) | Unclear risk | No protocol available |
| Other bias | High risk | Cross‐over design |
ART: assisted reproductive technique; BBT: basal body temperature; CC: clomiphene citrate; COH: controlled ovarian hyperstimulation; DLS: diagnostic laparoscopic surgery; FSH: follicle‐stimulating hormone; GnRH: gonadotropin‐releasing hormone; hCG: human chorionic gonadotrophin; hMG: human menopausal gonadotrophin; HSG: hysterosalpingography; ICI: intra‐cervical insemination; IQR: interquartile range; IM: intramuscular; ITT: intention to treat; IU: international unit; IUI: intra‐uterine insemination; IVF: in vitro fertilisation; LH: luteinising hormone; MNC: modified natural cycle; n: number of couples; OAT: oligoasthenoteratozoospermia; OH: ovarian hyperstimulation; OHSS: ovarian hyperstimulation syndrome; PCT: post coital test; PR: pregnancy rate; SD: standard deviation; SET: single embryo transfer; TI: timed intercourse; TMSC: total motile sperm count; USS: ultrasound scan.
Characteristics of excluded studies [ordered by study ID]
| Study | Reason for exclusion |
| Oocytes were randomly divided between IVF and ICSI, no outcome data available per couple | |
| Oocytes were randomly divided between IVF and ICSI, no outcome data available per couple | |
| Unexplained subfertility couples | |
| Number of couples receiving IUI and TI was not stated | |
| Authors could not provide pre‐cross‐over data | |
| Different comparison: IUI vs. ICI | |
| Not an RCT, but a retrospective study | |
| Unexplained subfertility couples | |
| Biochemical pregnancies only, no response from the author | |
| Oocytes were randomised between IVF and ICSI, no outcome data available per couple | |
| Oocytes were randomised between IVF and ICSI, no outcome data available per couple | |
| Preliminary report, different comparison: IUI vs. ICI | |
| Not an RCT, but an observational study | |
| Not an RCT, correspondence | |
| Not an RCT, an observational study | |
| Authors could not provide pre‐cross‐over data | |
| Authors could not provide pre‐cross‐over data | |
| Compares IUI both with different forms of OH | |
| Oocytes were randomly divided between IVF and ICSI, no outcome data available per couple | |
| Oocytes were randomly divided between IVF and ICSI, no outcome data available per couple | |
| Authors could not provide pre‐cross‐over data | |
| Oocytes were randomly divided between IVF and ICSI, no outcome data available per couple | |
| Authors could not provide pre‐cross‐over data | |
| Different comparison: ICI in natural cycle vs. ICI with OH | |
| Not an RCT, but a retrospective study | |
| Not an RCT: quasi randomised, biochemical pregnancies only | |
| Oocytes were randomly divided between IVF and ICSI, no outcome data available per couple | |
| Not an RCT: oocytes were quasi randomised between IVF and ICSI | |
| Not an RCT: quasi randomised, based on hospital case record number | |
| Incomplete data on treatment of control group | |
| Authors could not provide pre‐cross‐over data | |
| Oocytes were randomly divided between IVF and ICSI, no outcome data available per couple | |
| Oocytes were randomly divided between IVF and ICSI, no outcome data available per couple | |
| Oocytes were randomly divided between IVF and ICSI, no outcome data available per couple | |
| Not an RCT | |
| Not an RCT: quasi randomised, patient preference |
ICI: intra‐cervical insemination; ICSI: intracytoplasmic sperm injection; IUI: intra‐uterine insemination; IVF: in vitro fertilisation; OH: ovarian hyperstimulation; RCT: randomised controlled trial; TI: timed intercourse.
Characteristics of studies awaiting assessment [ordered by study ID]
| Methods | Design: cross‐over alternating Pre‐cross‐over data: not stated Power calculation: not stated ITT: not done, could not be extracted Number of couples randomised: not stated Number of couples analysed: 50 Number of started cycles: not stated Number of completed cycles: 495 Number of drop‐outs: not stated Number of cancelled cycles: not stated Centre: single centre, Chulalongkorn University, Bangkok, Thailand |
| Participants | Couples: male subfertility Definition male subfertility: sperm concentration 1‐20 million/mL, motility < 50%, normal morphology < 30%, or a combination of these (WHO 1992) Number of semen samples: 2 Age of women: mean 25.5 years (range 23‐37) Duration of subfertility: mean 3.7 years (range 2‐15) Primary/secondary subfertility: not stated Ovulatory status: BBT Tubal patency: DLS and HSG PCT: not stated Previous treatments: not stated Exclusion criteria: severe oligospermia < 1 million/mL, semen with evidence of bacterial infection, women with endometriosis, hormonal, tubal or ovulatory disturbance diagnosed |
| Interventions | Comparison: IUI with OH cycles vs. TI in natural cycles Treatment duration: maximum 4‐6 cycles Method of OH: CC 100 mg/day (cycle day 3‐7) Ovulation induction: none Number of IUI per cycle: 1, sometimes 2 Timing of IUI: timed by USS, BBT and LH surge urine Timing of intercourse: evening of the day of the LH surge and on the following day Sperm preparation: wash and swim up, Ham's F‐10 medium Number of inseminated spermatozoa: no conception observed below threshold of < 5 million motile spermatozoa Cancellation criteria: not stated |
| Outcomes | PR per completed cycle OHSS: not stated Miscarriage rate: stated Multiple PR: stated Ectopic PR: not stated Definition/diagnosis pregnancy: hCG in blood and confirmation by USS, clinical examination |
| Notes | Quality of spermatozoa in terms of their concentration and motility before and after sperm washing was compared No pre‐cross‐over data available, no reply from author |
| Methods | Design: cross‐over alternating Pre‐cross‐data: not stated Power calculation: not stated ITT: not stated Number of couples randomised: 36 Number of couples analysed: 36 Number of started cycles: not stated Number of completed cycles: 110 Number of drop‐outs: not stated Number of cancelled cycles: not stated Centre: single centre, Riyadh, Saudi Arabia |
| Participants | Couples: male subfertility Definition male subfertility: sperm count 1‐20 million/mL or motility 10‐30% with > 1 million total spermatozoa Number of semen samples: 3 Age of women: 27 years (SD ± 3.7) Duration of subfertility: 6.5 years (SD ± 3.0) Primary/secondary subfertility: not stated Ovulatory status: not stated Tubal patency: HSG PCT: not stated Previous treatment: not stated Exclusion criteria: not stated |
| Interventions | Comparison: IUI with OH cycles vs. TI with OH cycles Treatment duration: maximum 6 cycles Method OH: hMG 150 IU/day started from cycle day 3 (adjusting to woman's response), buserelin acetate spray 500 μg/day started from cycle day 2 Timing of ovulation: measurement of 3‐5 follicles > 15 mm and appropriate plasma oestradiol concentration (800 pmol/L per follicle) Ovulation induction: hCG 10,000 IU Number of IUI per cycle: 1 Timing of IUI: 34 hours after hCG Timing of intercourse: 36 hours after hCG Luteal support: progesterone 200 mg/day Sperm preparation: Percoll gradient technique Number of inseminated spermatozoa: not stated Cancellation criteria: not stated |
| Outcomes | PR per completed cycle OHSS: not stated Miscarriage rate: not stated Multiple PR: not stated Ectopic PR: not stated Definition/diagnosis pregnancy: USS 6‐7 weeks' gestational sac |
| Notes | No pre‐cross‐over data available, no reply from author |
| Methods | Design: cross‐over alternating Pre‐cross‐over data: not stated Power calculation: not stated ITT: not stated Number of couples randomised: not stated Number of couples analysed: not stated Number of started cycles: not stated Number of completed cycles: 509 Number of drop‐outs: not stated Number of cancelled cycles: not stated Centre: single centre, Los Angeles, USA |
| Participants | Couples: male subfertility Definition male subfertility: assessment of at least 2 abnormalities:
Number of semen samples: 3 Age of women: < 41 years, not specified Duration of subfertility: ≥ 3 years, not specified Primary/secondary subfertility: primary Ovulatory status: normal endocrine profile (LH, FSH, prolactin) Tubal patency: tested, not further specified PCT: not stated Previous treatment: not stated Exclusion criteria: sperm antibodies, endometriosis, sperm count < 100,000 after preparation |
| Interventions | Comparison: IUI in natural cycles vs. TI in natural cycles Treatment duration: maximum 12 cycles Timing of ovulation: LH surge urine Ovulation induction: none Number of IUI per cycle: 1 Timing of IUI: first of second day after LH surge Timing of intercourse: day of LH surge Sperm preparation: swim up procedure Number of inseminated spermatozoa: stated Cancellation criteria: not stated |
| Outcomes | PR per completed cycle OHSS: not stated Miscarriage rate: stated Multiple PR: not stated Ectopic PR: stated Definition/diagnosis pregnancy: not stated |
| Notes | Stratified for moderate semen defect and severe semen defect Compared IUI within 24 hours and within 48 hours after LH surge No pre‐cross‐over data available, no reply from author |
BBT: basal body temperature; CC: clomiphene citrate; DLS: diagnostic laparoscopic surgery; FSH: follicle‐stimulating hormone; hCG: human chorionic gonadotrophin, hMG: human menopausal gonadotrophin; HSG: hysterosalpingography; ITT: intention to treat; IUI: intra‐uterine insemination; LH: luteinising hormone; OH: ovarian hyperstimulation; OHSS: ovarian hyperstimulation syndrome; PCT= post coital test, PR: pregnancy rate; SD: standard deviation; TI: timed intercourse; USS: ultrasound scan.
Data and analyses
| Outcome or subgroup title | No. of studies | No. of participants | Statistical method | Effect size |
| 1 Pregnancy rate per couple (all cycles) Show forest plot | 2 | 62 | Odds Ratio (M‐H, Fixed, 95% CI) | 4.57 [0.21, 101.61] |
| Analysis 1.1  Comparison 1 Intra‐uterine insemination (IUI) versus timed intercourse (TI) both in natural cycles (NC), Outcome 1 Pregnancy rate per couple (all cycles). | ||||
| Outcome or subgroup title | No. of studies | No. of participants | Statistical method | Effect size |
| 1 Live birth rate per couple (all cycles) Show forest plot | 1 | 81 | Odds Ratio (M‐H, Fixed, 95% CI) | 0.89 [0.30, 2.59] |
| Analysis 2.1  Comparison 2 Intra‐uterine insemination (IUI) versus timed intercourse (TI) both in cycles with ovarian hyperstimulation (OH), Outcome 1 Live birth rate per couple (all cycles). | ||||
| 2 OHSS per couple Show forest plot | 1 | 59 | Odds Ratio (M‐H, Fixed, 95% CI) | 0.0 [0.0, 0.0] |
| Analysis 2.2  Comparison 2 Intra‐uterine insemination (IUI) versus timed intercourse (TI) both in cycles with ovarian hyperstimulation (OH), Outcome 2 OHSS per couple. | ||||
| 3 Pregnancy rate per couple (all cycles) Show forest plot | 3 | 202 | Odds Ratio (M‐H, Fixed, 95% CI) | 1.51 [0.74, 3.07] |
| Analysis 2.3 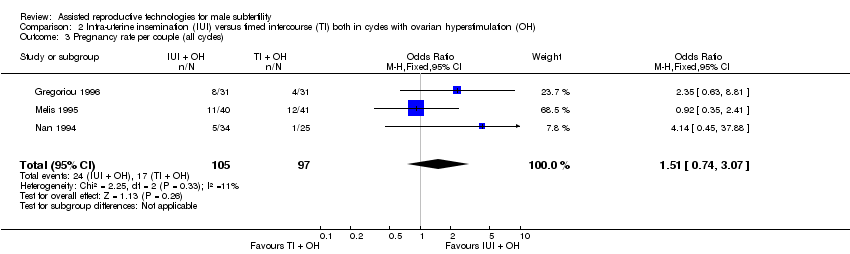 Comparison 2 Intra‐uterine insemination (IUI) versus timed intercourse (TI) both in cycles with ovarian hyperstimulation (OH), Outcome 3 Pregnancy rate per couple (all cycles). | ||||
| 4 Multiple pregnancy rate per couple Show forest plot | 1 | 81 | Odds Ratio (M‐H, Fixed, 95% CI) | 3.15 [0.12, 79.69] |
| Analysis 2.4  Comparison 2 Intra‐uterine insemination (IUI) versus timed intercourse (TI) both in cycles with ovarian hyperstimulation (OH), Outcome 4 Multiple pregnancy rate per couple. | ||||
| 5 Miscarriage rate per couple Show forest plot | 1 | 81 | Odds Ratio (M‐H, Fixed, 95% CI) | 1.03 [0.19, 5.42] |
| Analysis 2.5  Comparison 2 Intra‐uterine insemination (IUI) versus timed intercourse (TI) both in cycles with ovarian hyperstimulation (OH), Outcome 5 Miscarriage rate per couple. | ||||
| Outcome or subgroup title | No. of studies | No. of participants | Statistical method | Effect size |
| 1 Live birth rate per couple (all cycles) Show forest plot | 1 | 44 | Odds Ratio (M‐H, Fixed, 95% CI) | 3.14 [0.12, 81.35] |
| Analysis 4.1 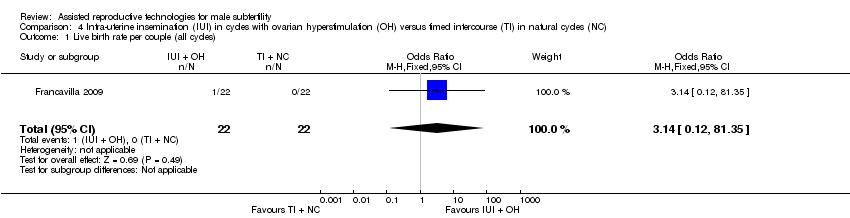 Comparison 4 Intra‐uterine insemination (IUI) in cycles with ovarian hyperstimulation (OH) versus timed intercourse (TI) in natural cycles (NC), Outcome 1 Live birth rate per couple (all cycles). | ||||
| 2 Pregnancy rate per couple (all cycles) Show forest plot | 1 | 44 | Odds Ratio (M‐H, Fixed, 95% CI) | 3.14 [0.12, 81.35] |
| Analysis 4.2 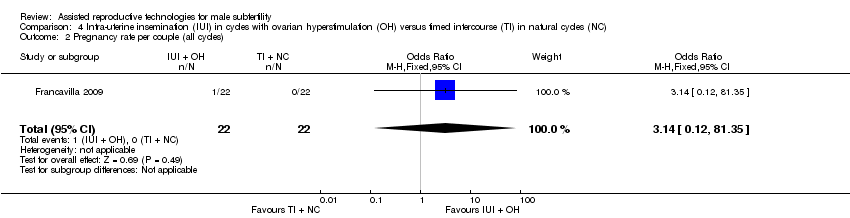 Comparison 4 Intra‐uterine insemination (IUI) in cycles with ovarian hyperstimulation (OH) versus timed intercourse (TI) in natural cycles (NC), Outcome 2 Pregnancy rate per couple (all cycles). | ||||
| Outcome or subgroup title | No. of studies | No. of participants | Statistical method | Effect size |
| 1 Live birth rate per couple (all cycles) Show forest plot | 3 | 346 | Odds Ratio (M‐H, Fixed, 95% CI) | 1.34 [0.77, 2.33] |
| Analysis 5.1 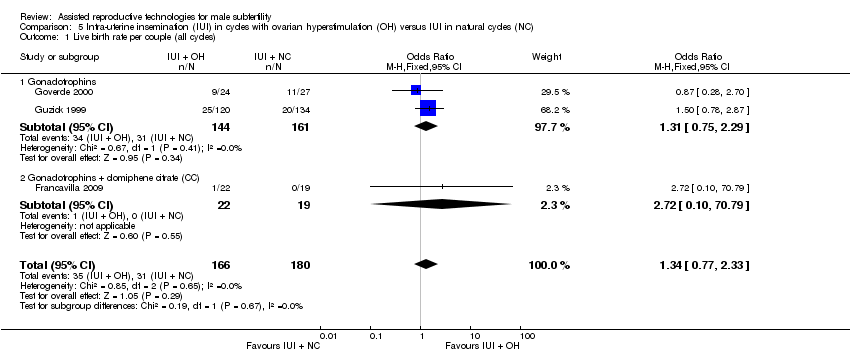 Comparison 5 Intra‐uterine insemination (IUI) in cycles with ovarian hyperstimulation (OH) versus IUI in natural cycles (NC), Outcome 1 Live birth rate per couple (all cycles). | ||||
| 1.1 Gonadotrophins | 2 | 305 | Odds Ratio (M‐H, Fixed, 95% CI) | 1.31 [0.75, 2.29] |
| 1.2 Gonadotrophins + clomiphene citrate (CC) | 1 | 41 | Odds Ratio (M‐H, Fixed, 95% CI) | 2.72 [0.10, 70.79] |
| 2 Pregnancy rate per couple (all cycles) Show forest plot | 4 | 399 | Odds Ratio (M‐H, Fixed, 95% CI) | 1.68 [1.00, 2.82] |
| Analysis 5.2 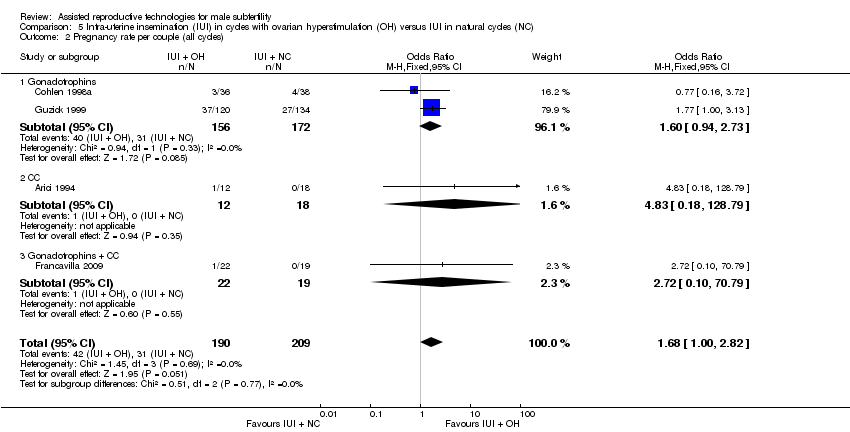 Comparison 5 Intra‐uterine insemination (IUI) in cycles with ovarian hyperstimulation (OH) versus IUI in natural cycles (NC), Outcome 2 Pregnancy rate per couple (all cycles). | ||||
| 2.1 Gonadotrophins | 2 | 328 | Odds Ratio (M‐H, Fixed, 95% CI) | 1.60 [0.94, 2.73] |
| 2.2 CC | 1 | 30 | Odds Ratio (M‐H, Fixed, 95% CI) | 4.83 [0.18, 128.79] |
| 2.3 Gonadotrophins + CC | 1 | 41 | Odds Ratio (M‐H, Fixed, 95% CI) | 2.72 [0.10, 70.79] |
| 3 Miscarriage rate per couple Show forest plot | 2 | 115 | Odds Ratio (M‐H, Fixed, 95% CI) | 1.06 [0.20, 5.63] |
| Analysis 5.3 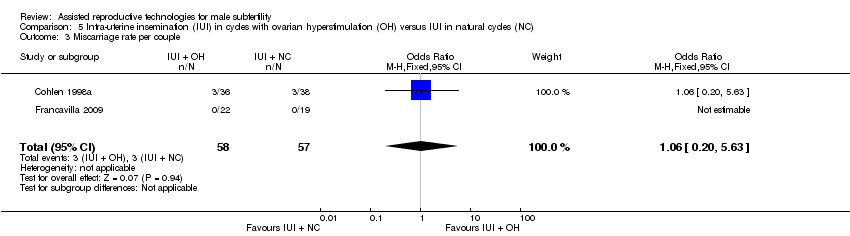 Comparison 5 Intra‐uterine insemination (IUI) in cycles with ovarian hyperstimulation (OH) versus IUI in natural cycles (NC), Outcome 3 Miscarriage rate per couple. | ||||
| Outcome or subgroup title | No. of studies | No. of participants | Statistical method | Effect size |
| 1 Live birth rate per couple (all cycles) Show forest plot | 1 | 53 | Odds Ratio (M‐H, Fixed, 95% CI) | 0.77 [0.25, 2.35] |
| Analysis 8.1 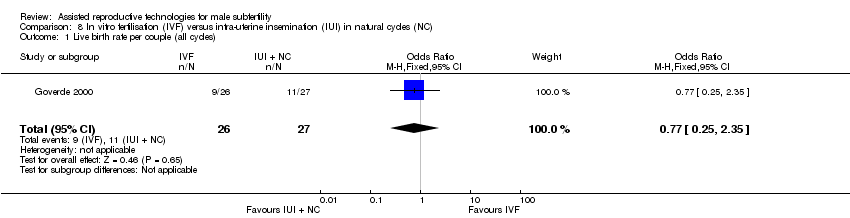 Comparison 8 In vitro fertilisation (IVF) versus intra‐uterine insemination (IUI) in natural cycles (NC), Outcome 1 Live birth rate per couple (all cycles). | ||||
| Outcome or subgroup title | No. of studies | No. of participants | Statistical method | Effect size |
| 1 Live birth rate per couple (all cycles) Show forest plot | 2 | 86 | Odds Ratio (M‐H, Fixed, 95% CI) | 1.03 [0.43, 2.45] |
| Analysis 9.1  Comparison 9 In vitro fertilisation (IVF) versus intra‐uterine insemination (IUI) in cycles with ovarian hyperstimulation (OH), Outcome 1 Live birth rate per couple (all cycles). | ||||
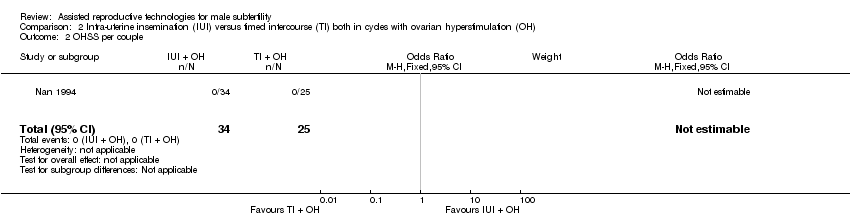
| 2 OHSS per couple Show forest plot | 1 | 36 | Odds Ratio (M‐H, Fixed, 95% CI) | 0.0 [0.0, 0.0] |
| Analysis 9.2  Comparison 9 In vitro fertilisation (IVF) versus intra‐uterine insemination (IUI) in cycles with ovarian hyperstimulation (OH), Outcome 2 OHSS per couple. | ||||
| 3 Pregnancy rate per couple (all cycles) Show forest plot | 1 | 36 | Odds Ratio (M‐H, Fixed, 95% CI) | 1.27 [0.33, 4.97] |
| Analysis 9.3  Comparison 9 In vitro fertilisation (IVF) versus intra‐uterine insemination (IUI) in cycles with ovarian hyperstimulation (OH), Outcome 3 Pregnancy rate per couple (all cycles). | ||||
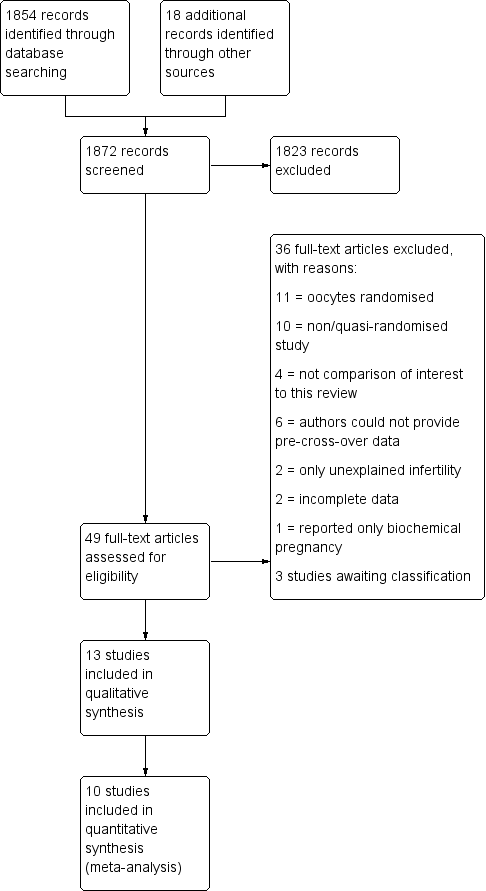
Study flow diagram.
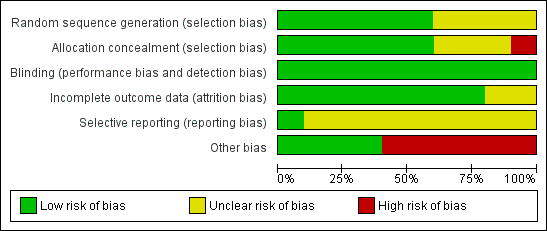
Risk of bias graph: review authors' judgements about each risk of bias item presented as percentages across all included studies.

Risk of bias summary: review authors' judgements about each risk of bias item for each included study.

Forest plot of comparison: 1 Intra‐uterine insemination (IUI) versus timed intercourse (TI) both in natural cycles (NC), outcome: 1.1 Pregnancy rate per couple (all cycles).

Forest plot of comparison: 2 Intra‐uterine insemination (IUI) versus timed intercourse (TI) both in cycles with ovarian hyperstimulation (OH), outcome: 2.3 Pregnancy rate per couple (all cycles).

Forest plot of comparison: 4 Intra‐uterine insemination (IUI) in cycles with ovarian hyperstimulation (OH) versus timed intercourse (TI) in natural cycles (NC), outcome: 4.2 Pregnancy rate per couple (all cycles).

Forest plot of comparison: 5 Intra‐uterine insemination (IUI) in natural cycles (NC) versus IUI in cycles with ovarian hyperstimulation (OH) versus IUI in natural cycles (NC), outcome: 5.2 Pregnancy rate per couple (all cycles).
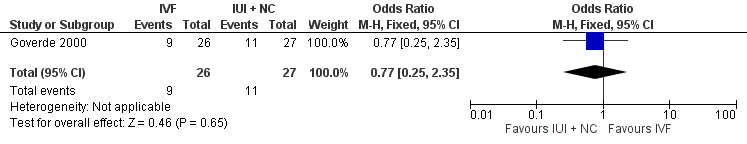
Forest plot of comparison: 8 In vitro fertilisation (IVF) versus intra‐uterine insemination (IUI) in natural cycles (NC), outcome: 8.1 Live birth rate per couple (all cycles).

Forest plot of comparison: 9 In vitro fertilisation (IVF) versus intra‐uterine insemination (IUI) in cycles with ovarian hyperstimulation (OH), outcome: 9.1 Live birth rate per couple (all cycles).

Comparison 1 Intra‐uterine insemination (IUI) versus timed intercourse (TI) both in natural cycles (NC), Outcome 1 Pregnancy rate per couple (all cycles).

Comparison 2 Intra‐uterine insemination (IUI) versus timed intercourse (TI) both in cycles with ovarian hyperstimulation (OH), Outcome 1 Live birth rate per couple (all cycles).
Comparison 2 Intra‐uterine insemination (IUI) versus timed intercourse (TI) both in cycles with ovarian hyperstimulation (OH), Outcome 2 OHSS per couple.

Comparison 2 Intra‐uterine insemination (IUI) versus timed intercourse (TI) both in cycles with ovarian hyperstimulation (OH), Outcome 3 Pregnancy rate per couple (all cycles).

Comparison 2 Intra‐uterine insemination (IUI) versus timed intercourse (TI) both in cycles with ovarian hyperstimulation (OH), Outcome 4 Multiple pregnancy rate per couple.

Comparison 2 Intra‐uterine insemination (IUI) versus timed intercourse (TI) both in cycles with ovarian hyperstimulation (OH), Outcome 5 Miscarriage rate per couple.

Comparison 4 Intra‐uterine insemination (IUI) in cycles with ovarian hyperstimulation (OH) versus timed intercourse (TI) in natural cycles (NC), Outcome 1 Live birth rate per couple (all cycles).

Comparison 4 Intra‐uterine insemination (IUI) in cycles with ovarian hyperstimulation (OH) versus timed intercourse (TI) in natural cycles (NC), Outcome 2 Pregnancy rate per couple (all cycles).

Comparison 5 Intra‐uterine insemination (IUI) in cycles with ovarian hyperstimulation (OH) versus IUI in natural cycles (NC), Outcome 1 Live birth rate per couple (all cycles).

Comparison 5 Intra‐uterine insemination (IUI) in cycles with ovarian hyperstimulation (OH) versus IUI in natural cycles (NC), Outcome 2 Pregnancy rate per couple (all cycles).

Comparison 5 Intra‐uterine insemination (IUI) in cycles with ovarian hyperstimulation (OH) versus IUI in natural cycles (NC), Outcome 3 Miscarriage rate per couple.

Comparison 8 In vitro fertilisation (IVF) versus intra‐uterine insemination (IUI) in natural cycles (NC), Outcome 1 Live birth rate per couple (all cycles).

Comparison 9 In vitro fertilisation (IVF) versus intra‐uterine insemination (IUI) in cycles with ovarian hyperstimulation (OH), Outcome 1 Live birth rate per couple (all cycles).

Comparison 9 In vitro fertilisation (IVF) versus intra‐uterine insemination (IUI) in cycles with ovarian hyperstimulation (OH), Outcome 2 OHSS per couple.

Comparison 9 In vitro fertilisation (IVF) versus intra‐uterine insemination (IUI) in cycles with ovarian hyperstimulation (OH), Outcome 3 Pregnancy rate per couple (all cycles).
| IUI in natural cycles compared to TI in natural cycles for male subfertility | ||||||
| Patient or population: couples with male subfertility | ||||||
| Outcomes | Illustrative comparative risks* (95% CI) | Relative effect | No of couples (studies) | Quality of the evidence | Comments | |
| Assumed risk | Corresponding risk | |||||
| TI in natural cycles | IUI in natural cycles | |||||
| Live birth rate | Not reported in any included studies | ‐ | ‐ | |||
| OHSS | Not reported in any included studies | ‐ | ‐ | |||
| Pregnancy rate per couple (all cycles) | 0 per 1000 | 0 per 1000 | OR 4.57 | 62 | ⊕⊝⊝⊝ | ‐ |
| *The basis for the assumed risk was the median control group risk across studies. The corresponding risk (and its 95% confidence interval) is based on the assumed risk in the comparison group and the relative effect of the intervention (and its 95% CI). | ||||||
| GRADE Working Group grades of evidence | ||||||
| 1 Risk of bias was very serious: 1. Francavilla 2009, allocation concealment: high risk (on chronological basis), 2. Francavilla 2009, other bias: high risk (no stratification by diagnosis category of subfertility). | ||||||
| IUI in stimulated cycles compared to TI in stimulated cycles for male subfertility | ||||||
| Patient or population: couples with male subfertility | ||||||
| Outcomes | Illustrative comparative risks* (95% CI) | Relative effect | No of couples (studies) | Quality of the evidence | Comments | |
| Assumed risk | Corresponding risk | |||||
| TI in stimulated cycles | IUI in stimulated cycles | |||||
| Live birth rate per couple (all cycles) | 220 per 1000 | 200 per 1000 | OR 0.89 | 81 | ⊕⊕⊝⊝ | ‐ |
| OHSS per couple Follow‐up: 6 months | See comment | See comment | Not estimable | 59 (1 study) | ⊕⊕⊝⊝ | ‐ |
| Pregnancy rate per couple (all cycles) | 175 per 1000 | 243 per 1000 | OR 1.51 | 202 | ⊕⊝⊝⊝ | ‐ |
| Multiple pregnancy rate per couple | 0 per 1000 | 0 per 1000 | OR 3.15 | 81 | ⊕⊕⊝⊝ | ‐ |
| Miscarriage rate per couple | 73 per 1000 | 75 per 1000 | OR 1.03 | 81 | ⊕⊕⊝⊝ | ‐ |
| *The basis for the assumed risk was the median control group risk across studies. The corresponding risk (and its 95% confidence interval) is based on the assumed risk in the comparison group and the relative effect of the intervention (and its 95% CI). | ||||||
| GRADE Working Group grades of evidence | ||||||
| 1 There was very serious imprecision, with small sample size. | ||||||
| IUI in stimulated cycles compared to TI in natural cycles for male subfertility | ||||||
| Patient or population: couples with male subfertility | ||||||
| Outcomes | Illustrative comparative risks* (95% CI) | Relative effect | No of couples (studies) | Quality of the evidence | Comments | |
| Assumed risk | Corresponding risk | |||||
| TI in natural cycles | IUI in stimulated cycles | |||||
| Live birth rate per couple (all cycles) | 0 per 1000 | 0 per 1000 | OR 3.14 | 44 | ⊕⊝⊝⊝ | ‐ |
| OHSS | Not reported in any included studies | ‐ | ||||
| Pregnancy rate per couple (all cycles) | 0 per 1000 | 0 per 1000 | OR 3.14 | 44 | ⊕⊝⊝⊝ | ‐ |
| *The basis for the assumed risk was the median control group risk across studies. The corresponding risk (and its 95% confidence interval) is based on the assumed risk in the comparison group and the relative effect of the intervention (and its 95% CI). | ||||||
| GRADE Working Group grades of evidence | ||||||
| 1 Risk of bias was very serious: 1. Allocation concealment: high risk (on chronological basis), 2. Other bias: high risk (no stratification by diagnosis category of subfertility). | ||||||
| IUI in stimulated cycles compared to IUI in natural cycles for male subfertility | ||||||
| Patient or population: couples with male subfertility | ||||||
| Outcomes | Illustrative comparative risks* (95% CI) | Relative effect | No of couples | Quality of the evidence | Comments | |
| Assumed risk | Corresponding risk | |||||
| IUI in natural cycles | IUI in stimulated cycles | |||||
| Live birth rate per couple (all cycles) | 172 per 1000 | 218 per 1000 | OR 1.34 | 346 | ⊕⊝⊝⊝ | ‐ |
| OHSS | Not reported in any included studies | ‐ | ‐ | |||
| Pregnancy rate per couple (all cycles) | 148 per 1000 | 226 per 1000 | OR 1.68 | 399 | ⊕⊝⊝⊝ | ‐ |
| Miscarriage rate per couple | 53 per 1000 | 56 per 1000 | OR 1.06 | 115 | ⊕⊝⊝⊝ | ‐ |
| *The basis for the assumed risk was the median control group risk across studies. The corresponding risk (and its 95% confidence interval) is based on the assumed risk in the comparison group and the relative effect of the intervention (and its 95% CI). | ||||||
| GRADE Working Group grades of evidence | ||||||
| 1 Risk of bias was very serious: 1. Francavilla 2009, allocation concealment: high risk (on chronological basis), 2. Arici 1994, Francavilla 2009, and Guzick 1999, other bias: high risk (no stratification by diagnosis category of subfertility. | ||||||
| IVF compared to IUI in natural cycles for male subfertility | ||||||
| Patient or population: couples with male subfertility | ||||||
| Outcomes | Illustrative comparative risks* (95% CI) | Relative effect | No of couples (studies) | Quality of the evidence | Comments | |
| Assumed risk | Corresponding risk | |||||
| IUI in natural cycles | IVF | |||||
| Live birth rate per couple (all cycles) | 407 per 1000 | 346 per 1000 | OR 0.77 | 53 | ⊕⊕⊝⊝ | ‐ |
| OHSS | Not reported in any included studies | ‐ | ‐ | |||
| *The basis for the assumed risk was the median control group risk across studies. The corresponding risk (and its 95% confidence interval) is based on the assumed risk in the comparison group and the relative effect of the intervention (and its 95% CI). | ||||||
| GRADE Working Group grades of evidence | ||||||
| 1 There was very serious imprecision, with small sample sizes. | ||||||
| IVF compared to IUI in stimulated cycles for male subfertility | ||||||
| Patient or population: couples with male subfertility | ||||||
| Outcomes | Illustrative comparative risks* (95% CI) | Relative effect | No of couples (studies) | Quality of the evidence | Comments | |
| Assumed risk | Corresponding risk | |||||
| IUI in stimulated cycles | IVF | |||||
| Live birth rate per couple (all cycles) | 452 per 1000 | 460 per 1000 | OR 1.03 | 86 | ⊕⊝⊝⊝ | ‐ |
| OHSS per couple | See comment | See comment | Not estimable | 36 | ⊕⊝⊝⊝ | No OHSS occurred |
| Pregnancy rate per couple (all cycles) | 611 per 1000 | 666 per 1000 | OR 1.27 | 36 | ⊕⊝⊝⊝ | ‐ |
| *The basis for the assumed risk was the median control group risk across studies. The corresponding risk (and its 95% confidence interval) is based on the assumed risk in the comparison group and the relative effect of the intervention (and its 95% CI). | ||||||
| GRADE Working Group grades of evidence | ||||||
| 1 Risk of bias was serious: Bensdorp 2015, other bias: high risk (no stratification by diagnosis category of subfertility). | ||||||
| Outcome or subgroup title | No. of studies | No. of participants | Statistical method | Effect size |
| 1 Pregnancy rate per couple (all cycles) Show forest plot | 2 | 62 | Odds Ratio (M‐H, Fixed, 95% CI) | 4.57 [0.21, 101.61] |
| Outcome or subgroup title | No. of studies | No. of participants | Statistical method | Effect size |
| 1 Live birth rate per couple (all cycles) Show forest plot | 1 | 81 | Odds Ratio (M‐H, Fixed, 95% CI) | 0.89 [0.30, 2.59] |
| 2 OHSS per couple Show forest plot | 1 | 59 | Odds Ratio (M‐H, Fixed, 95% CI) | 0.0 [0.0, 0.0] |
| 3 Pregnancy rate per couple (all cycles) Show forest plot | 3 | 202 | Odds Ratio (M‐H, Fixed, 95% CI) | 1.51 [0.74, 3.07] |
| 4 Multiple pregnancy rate per couple Show forest plot | 1 | 81 | Odds Ratio (M‐H, Fixed, 95% CI) | 3.15 [0.12, 79.69] |
| 5 Miscarriage rate per couple Show forest plot | 1 | 81 | Odds Ratio (M‐H, Fixed, 95% CI) | 1.03 [0.19, 5.42] |
| Outcome or subgroup title | No. of studies | No. of participants | Statistical method | Effect size |
| 1 Live birth rate per couple (all cycles) Show forest plot | 1 | 44 | Odds Ratio (M‐H, Fixed, 95% CI) | 3.14 [0.12, 81.35] |
| 2 Pregnancy rate per couple (all cycles) Show forest plot | 1 | 44 | Odds Ratio (M‐H, Fixed, 95% CI) | 3.14 [0.12, 81.35] |
| Outcome or subgroup title | No. of studies | No. of participants | Statistical method | Effect size |
| 1 Live birth rate per couple (all cycles) Show forest plot | 3 | 346 | Odds Ratio (M‐H, Fixed, 95% CI) | 1.34 [0.77, 2.33] |
| 1.1 Gonadotrophins | 2 | 305 | Odds Ratio (M‐H, Fixed, 95% CI) | 1.31 [0.75, 2.29] |
| 1.2 Gonadotrophins + clomiphene citrate (CC) | 1 | 41 | Odds Ratio (M‐H, Fixed, 95% CI) | 2.72 [0.10, 70.79] |
| 2 Pregnancy rate per couple (all cycles) Show forest plot | 4 | 399 | Odds Ratio (M‐H, Fixed, 95% CI) | 1.68 [1.00, 2.82] |
| 2.1 Gonadotrophins | 2 | 328 | Odds Ratio (M‐H, Fixed, 95% CI) | 1.60 [0.94, 2.73] |
| 2.2 CC | 1 | 30 | Odds Ratio (M‐H, Fixed, 95% CI) | 4.83 [0.18, 128.79] |
| 2.3 Gonadotrophins + CC | 1 | 41 | Odds Ratio (M‐H, Fixed, 95% CI) | 2.72 [0.10, 70.79] |
| 3 Miscarriage rate per couple Show forest plot | 2 | 115 | Odds Ratio (M‐H, Fixed, 95% CI) | 1.06 [0.20, 5.63] |
| Outcome or subgroup title | No. of studies | No. of participants | Statistical method | Effect size |
| 1 Live birth rate per couple (all cycles) Show forest plot | 1 | 53 | Odds Ratio (M‐H, Fixed, 95% CI) | 0.77 [0.25, 2.35] |
| Outcome or subgroup title | No. of studies | No. of participants | Statistical method | Effect size |
| 1 Live birth rate per couple (all cycles) Show forest plot | 2 | 86 | Odds Ratio (M‐H, Fixed, 95% CI) | 1.03 [0.43, 2.45] |
| 2 OHSS per couple Show forest plot | 1 | 36 | Odds Ratio (M‐H, Fixed, 95% CI) | 0.0 [0.0, 0.0] |
| 3 Pregnancy rate per couple (all cycles) Show forest plot | 1 | 36 | Odds Ratio (M‐H, Fixed, 95% CI) | 1.27 [0.33, 4.97] |