Assisted reproductive technologies for male subfertility
Abstract
Background
Intra‐uterine insemination (IUI), in vitro fertilisation (IVF) and intracytoplasmic sperm injection (ICSI) are frequently used fertility treatments for couples with male subfertility. The use of these treatments has been subject of discussion. Knowledge on the effectiveness of fertility treatments for male subfertility with different grades of severity is limited. Possibly, couples are exposed to unnecessary or ineffective treatments on a large scale.
Objectives
To evaluate the effectiveness and safety of different fertility treatments (expectant management, timed intercourse (TI), IUI, IVF and ICSI) for couples whose subfertility appears to be due to abnormal sperm parameters.
Search methods
We searched for all publications that described randomised controlled trials (RCTs) of the treatment for male subfertility. We searched the Cochrane Menstrual Disorders and Subfertility Group Specialised Register, the Cochrane Central Register of Controlled Trials (CENTRAL), MEDLINE, EMBASE, CINAHL, PsycINFO and the National Research Register from inception to 14 April 2015, and web‐based trial registers from January 1985 to April 2015. We applied no language restrictions. We checked all references in the identified trials and background papers and contacted authors to identify relevant published and unpublished data.
Selection criteria
We included RCTs comparing different treatment options for male subfertility. These were expectant management, TI (with or without ovarian hyperstimulation (OH)), IUI (with or without OH), IVF and ICSI. We included only couples with abnormal sperm parameters.
Data collection and analysis
Two review authors independently selected the studies, extracted data and assessed risk of bias. They resolved disagreements by discussion with the rest of the review authors. We performed statistical analyses in accordance with the guidelines for statistical analysis developed by The Cochrane Collaboration. The quality of the evidence was rated using the GRADE methods. Primary outcomes were live birth and ovarian hyperstimulation syndrome (OHSS) per couple randomised.
Main results
The review included 10 RCTs (757 couples). The quality of the evidence was low or very low for all comparisons. The main limitations in the evidence were failure to describe study methods, serious imprecision and inconsistency.
IUI versus TI (five RCTs)
Two RCTs compared IUI with TI in natural cycles. There were no data on live birth or OHSS. We found no evidence of a difference in pregnancy rates (2 RCTs, 62 couples: odds ratio (OR) 4.57, 95% confidence interval (CI) 0.21 to 102, very low quality evidence; there were no events in one of the studies).
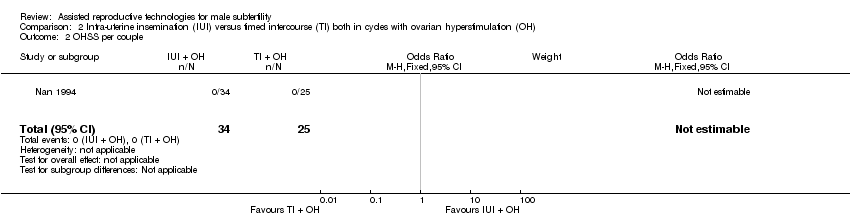
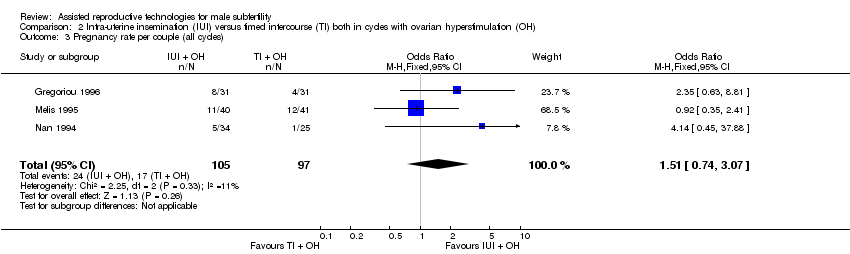
Three RCTs compared IUI with TI both in cycles with OH. We found no evidence of a difference in live birth rates (1 RCT, 81 couples: OR 0.89, 95% CI 0.30 to 2.59; low quality evidence) or pregnancy rates (3 RCTs, 202 couples: OR 1.51, 95% CI 0.74 to 3.07; I2 = 11%, very low quality evidence). One RCT reported data on OHSS. None of the 62 women had OHSS.
One RCT compared IUI in cycles with OH with TI in natural cycles. We found no evidence of a difference in live birth rates (1 RCT, 44 couples: OR 3.14, 95% CI 0.12 to 81.35; very low quality evidence). Data on OHSS were not available.
IUI in cycles with OH versus IUI in natural cycles (five RCTs)
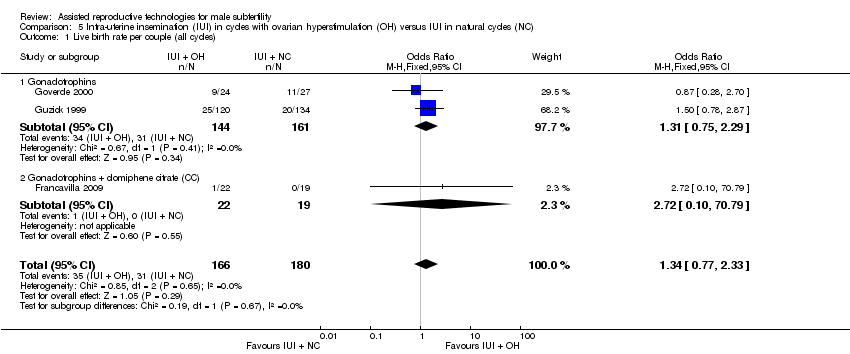
We found no evidence of a difference in live birth rates (3 RCTs, 346 couples: OR 1.34, 95% CI 0.77 to 2.33; I2 = 0%, very low quality evidence) and pregnancy rates (4 RCTs, 399 couples: OR 1.68, 95% CI 1.00 to 2.82; I2 = 0%, very low quality evidence). There were no data on OHSS.
IVF versus IUI in natural cycles or cycles with OH (two RCTs)
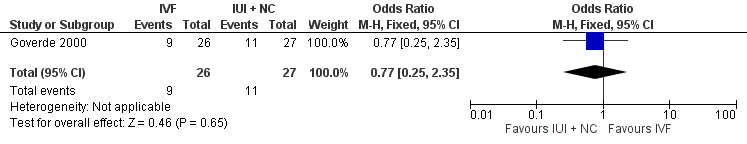
We found no evidence of a difference in live birth rates between IVF versus IUI in natural cycles (1 RCT, 53 couples: OR 0.77, 95% CI 0.25 to 2.35; low quality evidence) or IVF versus IUI in cycles with OH (2 RCTs, 86 couples: OR 1.03, 95% CI 0.43 to 2.45; I2 = 0%, very low quality evidence). One RCT reported data on OHSS. None of the women had OHSS.
Overall, we found no evidence of a difference between any of the groups in rates of live birth, pregnancy or adverse events (multiple pregnancy, miscarriage). However, most of the evidence was very low quality.
There were no studies on IUI in natural cycles versus TI in stimulated cycles, IVF versus TI, ICSI versus TI, ICSI versus IUI (with OH) or ICSI versus IVF.
Authors' conclusions
We found insufficient evidence to determine whether there was any difference in safety and effectiveness between different treatments for male subfertility. More research is needed.
PICO
Plain language summary
Treatments for male subfertility
Review question
Cochrane authors reviewed the evidence about the effectiveness of different treatments for couples with male subfertility.
Background
Intra‐uterine insemination (IUI), in vitro fertilisation (IVF) and intracytoplasmic sperm injection (ICSI) are frequently‐used fertility treatments for couples with low male fertility (subfertility). In IUI, the man's sperm is prepared and placed in the womb (uterus). Thus, the sperm is close to the place where the embryo is made (conception site). IUI can be performed with or without ovarian hyperstimulation (OH). In an OH cycle, women receive drugs to stimulate the ovaries (the organs that produce the eggs (called oocytes)) to increase the number of available oocytes. The main side effects of these drugs are multiple pregnancy (production of two or more embryos (early stage in the development of a baby)) and ovarian hyperstimulation syndrome (OHSS; the ovaries produce too many eggs). In IVF and ICSI, the fertilisation (where the egg and sperm are together and produce an embryo) is outside the body. The oocytes are retrieved from the woman using an ultrasound‐guided needle, piercing the vaginal wall to reach the ovaries. Through this needle, follicular fluid, which contains the oocyte, can be aspirated. It is common to remove between 10 and 15 oocytes. In IVF, the eggs are mixed with the sperm in a culture dish. In ICSI, sperm are injected directly into the oocytes to cause fertilisation. The fertilised oocytes are treated for two to six days in a medium that contains nutrients and are then placed in the uterus.
Study characteristics
We searched medical databases for randomised controlled trials (clinical studies where people are randomly put into one of two or more treatment groups) investigating male subfertility. We found 10 randomised controlled trials, all comparing different treatments for couples with male subfertility, with a total of 757 couples. The studies evaluated the following treatment options: timed intercourse (TI; where sex occurred at a recommended time in the menstrual cycle) (with or without OH), IUI (with or without OH), IVF and ICSI. The evidence was current to April 2015. We were mainly interested in how many women had live births and OHSS.
Key results
We found no evidence of a difference in live birth or pregnancy rates between treatments. We also found no evidence of a difference between any of the groups in rates of adverse effects (multiple pregnancy, miscarriage). Available data on OHSS was too limited for us to draw any conclusions.
Quality of the evidence
Most of the evidence was of low or very low quality. The main limitations were failure to describe study methods, small sample sizes and inconsistency in how trials were conducted. Evidence was available for only six of the 14 comparisons that we evaluated. More research is needed.
Authors' conclusions
Summary of findings
| IUI in natural cycles compared to TI in natural cycles for male subfertility | ||||||
| Patient or population: couples with male subfertility | ||||||
| Outcomes | Illustrative comparative risks* (95% CI) | Relative effect | No of couples (studies) | Quality of the evidence | Comments | |
| Assumed risk | Corresponding risk | |||||
| TI in natural cycles | IUI in natural cycles | |||||
| Live birth rate | Not reported in any included studies | ‐ | ‐ | |||
| OHSS | Not reported in any included studies | ‐ | ‐ | |||
| Pregnancy rate per couple (all cycles) | 0 per 1000 | 0 per 1000 | OR 4.57 | 62 | ⊕⊝⊝⊝ | ‐ |
| *The basis for the assumed risk was the median control group risk across studies. The corresponding risk (and its 95% confidence interval) is based on the assumed risk in the comparison group and the relative effect of the intervention (and its 95% CI). | ||||||
| GRADE Working Group grades of evidence | ||||||
| 1 Risk of bias was very serious: 1. Francavilla 2009, allocation concealment: high risk (on chronological basis), 2. Francavilla 2009, other bias: high risk (no stratification by diagnosis category of subfertility). | ||||||
| IUI in stimulated cycles compared to TI in stimulated cycles for male subfertility | ||||||
| Patient or population: couples with male subfertility | ||||||
| Outcomes | Illustrative comparative risks* (95% CI) | Relative effect | No of couples (studies) | Quality of the evidence | Comments | |
| Assumed risk | Corresponding risk | |||||
| TI in stimulated cycles | IUI in stimulated cycles | |||||
| Live birth rate per couple (all cycles) | 220 per 1000 | 200 per 1000 | OR 0.89 | 81 | ⊕⊕⊝⊝ | ‐ |
| OHSS per couple Follow‐up: 6 months | See comment | See comment | Not estimable | 59 (1 study) | ⊕⊕⊝⊝ | ‐ |
| Pregnancy rate per couple (all cycles) | 175 per 1000 | 243 per 1000 | OR 1.51 | 202 | ⊕⊝⊝⊝ | ‐ |
| Multiple pregnancy rate per couple | 0 per 1000 | 0 per 1000 | OR 3.15 | 81 | ⊕⊕⊝⊝ | ‐ |
| Miscarriage rate per couple | 73 per 1000 | 75 per 1000 | OR 1.03 | 81 | ⊕⊕⊝⊝ | ‐ |
| *The basis for the assumed risk was the median control group risk across studies. The corresponding risk (and its 95% confidence interval) is based on the assumed risk in the comparison group and the relative effect of the intervention (and its 95% CI). | ||||||
| GRADE Working Group grades of evidence | ||||||
| 1 There was very serious imprecision, with small sample size. | ||||||
| IUI in stimulated cycles compared to TI in natural cycles for male subfertility | ||||||
| Patient or population: couples with male subfertility | ||||||
| Outcomes | Illustrative comparative risks* (95% CI) | Relative effect | No of couples (studies) | Quality of the evidence | Comments | |
| Assumed risk | Corresponding risk | |||||
| TI in natural cycles | IUI in stimulated cycles | |||||
| Live birth rate per couple (all cycles) | 0 per 1000 | 0 per 1000 | OR 3.14 | 44 | ⊕⊝⊝⊝ | ‐ |
| OHSS | Not reported in any included studies | ‐ | ||||
| Pregnancy rate per couple (all cycles) | 0 per 1000 | 0 per 1000 | OR 3.14 | 44 | ⊕⊝⊝⊝ | ‐ |
| *The basis for the assumed risk was the median control group risk across studies. The corresponding risk (and its 95% confidence interval) is based on the assumed risk in the comparison group and the relative effect of the intervention (and its 95% CI). | ||||||
| GRADE Working Group grades of evidence | ||||||
| 1 Risk of bias was very serious: 1. Allocation concealment: high risk (on chronological basis), 2. Other bias: high risk (no stratification by diagnosis category of subfertility). | ||||||
| IUI in stimulated cycles compared to IUI in natural cycles for male subfertility | ||||||
| Patient or population: couples with male subfertility | ||||||
| Outcomes | Illustrative comparative risks* (95% CI) | Relative effect | No of couples | Quality of the evidence | Comments | |
| Assumed risk | Corresponding risk | |||||
| IUI in natural cycles | IUI in stimulated cycles | |||||
| Live birth rate per couple (all cycles) | 172 per 1000 | 218 per 1000 | OR 1.34 | 346 | ⊕⊝⊝⊝ | ‐ |
| OHSS | Not reported in any included studies | ‐ | ‐ | |||
| Pregnancy rate per couple (all cycles) | 148 per 1000 | 226 per 1000 | OR 1.68 | 399 | ⊕⊝⊝⊝ | ‐ |
| Miscarriage rate per couple | 53 per 1000 | 56 per 1000 | OR 1.06 | 115 | ⊕⊝⊝⊝ | ‐ |
| *The basis for the assumed risk was the median control group risk across studies. The corresponding risk (and its 95% confidence interval) is based on the assumed risk in the comparison group and the relative effect of the intervention (and its 95% CI). | ||||||
| GRADE Working Group grades of evidence | ||||||
| 1 Risk of bias was very serious: 1. Francavilla 2009, allocation concealment: high risk (on chronological basis), 2. Arici 1994, Francavilla 2009, and Guzick 1999, other bias: high risk (no stratification by diagnosis category of subfertility. | ||||||
| IVF compared to IUI in natural cycles for male subfertility | ||||||
| Patient or population: couples with male subfertility | ||||||
| Outcomes | Illustrative comparative risks* (95% CI) | Relative effect | No of couples (studies) | Quality of the evidence | Comments | |
| Assumed risk | Corresponding risk | |||||
| IUI in natural cycles | IVF | |||||
| Live birth rate per couple (all cycles) | 407 per 1000 | 346 per 1000 | OR 0.77 | 53 | ⊕⊕⊝⊝ | ‐ |
| OHSS | Not reported in any included studies | ‐ | ‐ | |||
| *The basis for the assumed risk was the median control group risk across studies. The corresponding risk (and its 95% confidence interval) is based on the assumed risk in the comparison group and the relative effect of the intervention (and its 95% CI). | ||||||
| GRADE Working Group grades of evidence | ||||||
| 1 There was very serious imprecision, with small sample sizes. | ||||||
| IVF compared to IUI in stimulated cycles for male subfertility | ||||||
| Patient or population: couples with male subfertility | ||||||
| Outcomes | Illustrative comparative risks* (95% CI) | Relative effect | No of couples (studies) | Quality of the evidence | Comments | |
| Assumed risk | Corresponding risk | |||||
| IUI in stimulated cycles | IVF | |||||
| Live birth rate per couple (all cycles) | 452 per 1000 | 460 per 1000 | OR 1.03 | 86 | ⊕⊝⊝⊝ | ‐ |
| OHSS per couple | See comment | See comment | Not estimable | 36 | ⊕⊝⊝⊝ | No OHSS occurred |
| Pregnancy rate per couple (all cycles) | 611 per 1000 | 666 per 1000 | OR 1.27 | 36 | ⊕⊝⊝⊝ | ‐ |
| *The basis for the assumed risk was the median control group risk across studies. The corresponding risk (and its 95% confidence interval) is based on the assumed risk in the comparison group and the relative effect of the intervention (and its 95% CI). | ||||||
| GRADE Working Group grades of evidence | ||||||
| 1 Risk of bias was serious: Bensdorp 2015, other bias: high risk (no stratification by diagnosis category of subfertility). | ||||||
Background
Description of the condition
Male subfertility is a common condition among subfertile couples. It has been estimated to be directly responsible for approximately 30% of problems with conception and to be a contributory factor in 50% (Crosignani 1994; Hull 1985). Over time, different definitions of male subfertility have been used. A normal quality semen sample was described as having a sperm concentration of 20 million/mL or greater, total motility 50% or greater, normal morphology in 50% or greater and no sperm antibodies (WHO 1987). In 1992, The World Health Organization (WHO) changed its criteria for normal sperm morphology from 50% to 30% (WHO 1992). When strict criteria for morphology were used, greater than 14% was considered normal (Kruger 1993). Since 2010, the reference values for a normal quality semen sample have been revised and the most important changes to the reference limits were semen volume of 1.5 mL or greater, a sperm concentration of 15 million/mL or greater, total motility 40% or greater and normal morphology in 4% or greater (Cooper 2010; WHO 2010). Despite the worldwide use of the WHO criteria, these are unable to distinguish men who are likely to father a child from men who are not. However, the correlation that has been established is a continuous one between total motile sperm count (TMSC) and the probability of natural conception (van der Steeg 2011). In couples undergoing intra‐uterine insemination (IUI), the TMSC also appears to have a consistent, direct relationship with the pregnancy rate, but there is no definite predictive threshold for success (Tijani 2010). The post‐wash TMSC probably has the most predictive value because it reflects both sperm concentration and motility as well as the effects of sperm processing (van Weert 2004). Because of the different definitions for male subfertility worldwide it is difficult to estimate what proportion of fertility treatments are associated with this indication, or how it affects the overall success rate.
Description of the intervention
IUI is a frequently used fertility treatment for couples with male subfertility (Cohlen 2005; Goverde 2000). In IUI, a small volume of prepared semen is injected trans‐cervically into the uterine cavity around the expected time of ovulation. The rationale behind this procedure is to bypass the cervix and to bring the semen closer to the released oocyte. In addition, washing of semen and the selection of motile sperm (by semen preparation) might further increase the chances of fertilisation (Duran 2002a). It has been argued that the method of sperm preparation might influence the probability of conception (Duran 2002b), but there is insufficient evidence to recommend any specific preparation technique (Boomsma 2007). IUI can be used with or without ovarian hyperstimulation (OH), which increases the number of available oocytes at the site of conception. It has also been suggested that it would overcome subtle ovulation disorders that cannot be detected by routine investigations (Zikopoulos 2005). OH is achieved by administering drugs such as anti‐oestrogens (e.g. clomiphene citrate) or gonadotrophins, sometimes combined with gonadotrophin‐releasing hormone (GnRH) agonists or, more recently, antagonists (Cantineau 2007).
In natural cycles, the pre‐ovulatory luteinising hormone (LH) surge is the best indicator of the initiation of ovulation (WHO 1980). Ovulation occurs 35 to 38 hours after the onset of the LH rise in blood (Hoff 1983; Testart 1982). In stimulated cycles, the chances of adequate timing are increased by the administration of an ovulatory triggering injection of human chorionic gonadotrophin (hCG). In order to time the hCG injection, the diameter of the largest follicle (mostly 16 to 18 mm) is determined with sonographic measurements. It has been determined that the largest follicle is the most probable to rupture and will do so approximately 38 hours after the hCG injection (Andersen 1995; Martinez 1991). Therefore, it is most favourable to inseminate around 35 to 45 hours after hCG administration.
Other, more invasive and expensive, fertility treatments for couples with male subfertility are in vitro fertilisation (IVF) and intracytoplasmic sperm injection (ICSI). Both methods use controlled ovarian hyperstimulation (COH), which pursues three main objectives: hypophyseal activity suppression, multiple follicle growth stimulation and ovulation induction. Hypophyseal activity suppression, by a GnRH agonist or antagonist, prevents premature ovulation and allows for the timed collection of mature oocytes. Follicle‐stimulating hormone (FSH), sometimes combined with LH, is used to stimulate the growth of multiple follicles. Ovulation is induced by hCG or a GnRH agonist and is indicated when multiple follicles of 16 mm or greater are present with sonographic measurements. The optimal timing for ovulation induction remains uncertain, and more studies are necessary to explore the optimal timing (Mochtar 2011; Tarlatzis 2006). Oocyte harvesting is performed approximately 36 hours after hCG or GnRH agonist administration. In IVF, the retrieved oocytes and spermatozoa are put together in a culture dish to achieve fertilisation; for ICSI, a single selected sperm is injected directly into the cytoplasm of the oocyte. The purpose of ICSI is to overcome a potential failure of the sperm to activate the oocyte to initiate fertilisation. After fertilisation, the fertilised oocytes are cultured in a growth medium for two to six days and monitored for embryonic development. Based on morphological criteria for quality, one or two embryos are transferred into the uterine cavity and supernumerary good‐quality embryos are cryopreserved. Luteal phase supplementation with progesterone or hCG is necessary to sustain endometrial stimulation.
How the intervention might work
IUI, IVF and ICSI are used to improve the live birth rates in couples experiencing male subfertility.
Why it is important to do this review
The use of fertility treatments in male subfertility has been under debate. Some authors consider that IUI should be offered as first‐line therapy before IVF and ICSI are offered (Bhattachary 2000; Cohlen 2005; Goverde 2000; Gregoriou 1996; Nan 1994). Other authors have questioned its effectiveness in male subfertility (Guzick 1998). It has also been suggested that IUI in male subfertility would be advantageous only when a certain threshold value of motile sperm count can be achieved (van Voorhis 2001; van Weert 2004). When OH is used to enhance the effectiveness of IUI, the prevalence of ovarian hyperstimulation syndrome (OHSS) and multiple pregnancy rates increases. The most recent National Institute for Health and Care Excellence (NICE) guideline states that for mild male subfertility, routine use of IUI, either with or without OH is not appropriate. Instead, expectant management for two years is recommended, before considering IVF (NICE 2013). Other authors recommend expectant management (for at least six months) over IUI (or another fertility treatment) in couples with unexplained subfertility or moderate male factor (TMSC greater than three million) and a good or intermediate prognosis for natural conception (Hunault 2004; Steures 2006). IVF, introduced in the late 1970s as a treatment for tubal infertility, was also proposed as a therapeutic option for male subfertility (Cohen 1984). Direct and randomised comparisons between IVF and IUI are scarce and in favour of the latter in terms of cost‐effectiveness (Bensdorp 2015; Goverde 2000; Tjon‐Kon‐Fat 2015). However, there is no clear cutoff value for semen quality to support the choice for IVF or IUI. ICSI provided the possibility of genetic offspring even to people with severely compromised semen parameters (Palermo 1992). More recently, the use of ICSI has increased, also for men with borderline or even normal semen characteristics, without clear evidence of its benefits (Bhattachary 2001; Kim 2007) or even its possible harm (Boulet 2015). The cutoff values for semen parameters used to decide between conventional IVF and ICSI are generally experience‐based (Tournaye 2012), and vary per country/centre/laboratory. Performing a split IVF‐ICSI cycle in which sibling oocytes are either inseminated conventionally or micro‐injected, may prevent complete fertilisation failure in one out of four IVF cycles for moderate male factor subfertility (Kihaile 2003; van der Westenlaken 2005).
This review investigated the benefits and disadvantages of expectant management or timed intercourse (TI), IUI with or without OH, IVF and ICSI in couples with male subfertility.
Objectives
To evaluate the effectiveness and safety of different fertility treatments (expectant management, timed intercourse (TI), IUI, IVF and ICSI) for couples whose subfertility appears to be due to abnormal sperm parameters.
Methods
Criteria for considering studies for this review
Types of studies
We included both published and unpublished randomised controlled trials (RCTs). We assessed the method of randomisation to determine whether the studies were truly randomised. In the case of cross‐over trials, we only included them if pre‐cross‐over data were available. We incorporated trials that included a subset of participants with male subfertility if data were available for that subset.
Types of participants
Couples with male subfertility who had been trying to conceive for at least one year were eligible for inclusion. We included all couples with male factor subfertility, including oligo‐, terato‐, asthenospermia, or a combination of these, preferably measured by two separate semen samples.
Routine fertility evaluation should have consisted of confirmed ovulatory status (basal body temperature (BBT) chart, mid‐luteal progesterone or sonographic evidence of ovulation) and low risk for tubal pathology according to the medical history (Coppus 2007).
Types of interventions
We included RCTs with at least one of the following comparisons:
-
IUI versus TI or expectant management both in natural cycles;
-
IUI versus TI both in cycles with OH;
-
IUI in natural cycles versus TI in cycles with OH;
-
IUI in cycles with OH versus TI or expectant management in natural cycles;
-
IUI in natural cycles versus IUI in cycles with OH;
-
IVF versus TI or expectant management in natural cycles;
-
IVF versus TI in cycles with OH;
-
IVF versus IUI in natural cycles;
-
IVF versus IUI in cycles with OH;
-
ICSI versus TI or expectant management in natural cycles;
-
ICSI versus TI in cycles with OH;
-
ICSI versus IUI in natural cycles;
-
ICSI versus IUI in cycles with OH;
-
ICSI versus IVF.
We excluded trials comparing methods using insemination other than IUI, such as intracervical insemination (ICI), gamete intrafallopian transfer (GIFT) and fallopian tube sperm perfusion. In addition, we excluded trials comparing different types of ovarian stimulation protocol, as this is the subject of a different review (Cantineau 2007).
Types of outcome measures
Primary outcomes
-
Live birth rate, defined as delivery of a live foetus after 20 completed weeks of gestational age, per couple.
-
Incidence of OHSS per couple.
Secondary outcomes
-
(Clinical) pregnancy rates, defined as evidence of a gestational sac, confirmed by ultrasound, per couple.
-
Multiple pregnancy rates.
-
Miscarriage rates.
-
Total fertilisation failure rates per couple during IVF.
Search methods for identification of studies
Electronic searches
We searched for all published and unpublished RCTs that described (or might have described) treatments for male subfertility with no language restrictions. Marian Showell, Trials Search Co‐ordinator of the Cochrane Gynaecology and Fertility Group, performed a search of the following:
-
the Cochrane Menstrual Disorders and Subfertility Group Specialised Register of controlled trials (inception to April 2015) (Appendix 1);
-
the Cochrane Central Register of Controlled Trials (CENTRAL; inception to April 2015) (Appendix 2);
-
MEDLINE (inception to April 2015) (Appendix 3);
-
EMBASE (inception to April 2015) (Appendix 4);
-
PsycINFO (inception to April 2015) (Appendix 5);
-
CINAHL (inception to April 2015) (Appendix 6).
We placed no language restrictions.
We combined the MEDLINE search with the Cochrane highly sensitive search strategy for identifying RCTs, which appears in the Cochrane Handbook of Systematic Reviews of Interventions (Section 6.4.11) (Higgins 2011). We combined the EMBASE, PsycINFO and CINAHL searches with trial filters developed by the Scottish Intercollegiate Guidelines Network (SIGN) (www.sign.ac.uk/methodology/filters.html#random).
Other electronic sources of trials included the following:
-
trial registers for ongoing and registered trials:
-
ClinicalTrials.gov, a service of the US National Institutes of Health (clinicaltrials.gov/ct2/home), and the WHO International Clinical Trials Registry Platform search portal (www.who.int/trialsearch/Default.aspx);
-
-
conference abstracts in the Web of Knowledge (wokinfo.com/);
-
OpenSIGLE database for grey literature from Europe (opensigle.inist.fr/);
-
LILACS database, as a source of trials from the Portuguese and Spanish speaking world (regional.bvsalud.org/php/index.php?lang=en) (choose 'LILACS' in 'all sources' drop‐down box);
-
PubMed (www.ncbi.nlm.nih.gov/pubmed/).
We searched the databases using the medical subject headings (MeSH terms) and keywords in Appendix 7.
Searching other resources
We checked the reference lists of all identified studies for relevant articles. We performed a handsearch of abstracts of the American Society for Reproductive Medicine (1999 to April 2015) and the European Society for Human Reproduction and Embryology (1997 to April 2015) meetings.
When important information was lacking from the original publications, we tried to contact the authors. We incorporated additional information in the review.
Data collection and analysis
Selection of studies
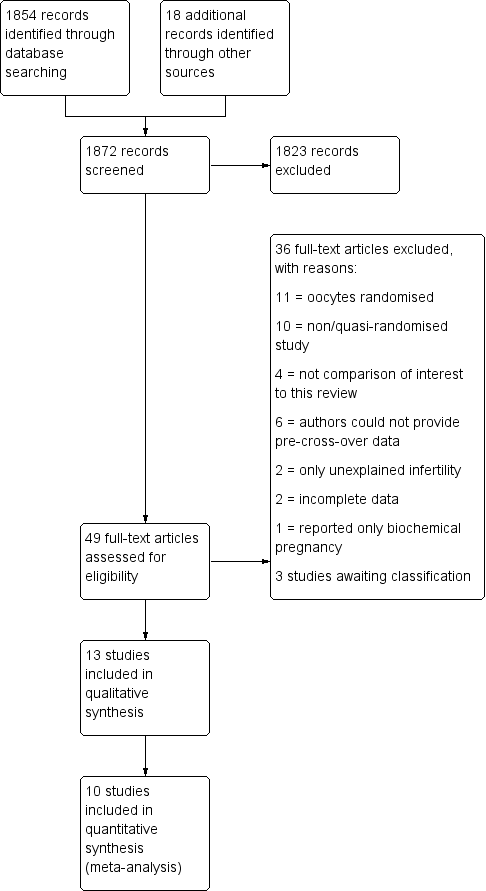
After screening the titles and abstracts retrieved by the search, we obtained full texts of all potentially eligible studies. Two review authors (MC and MvW) independently selected the trials to be included according to the above‐mentioned criteria. We resolved disagreements by consensus or through arbitration by a third review author (AB). We documented the selection process with a PRISMA flow chart (Figure 1).

Study flow diagram.
Data extraction and management
The same two review authors independently used a data extraction form to extract data from published reports. We resolved disagreements by consensus or through arbitration by a third review author (AB). This data extraction form included information on the type of study, quality of the selected studies, types of participants, types of interventions and the types of outcome measures (Appendix 8). An analysis of agreement between the two review authors on assessment of the method of randomisation and study design resulted in 100% agreement.
Assessment of risk of bias in included studies
As part of the data collection process, two review authors (MC and MvW) independently extracted data for trial characteristics that have been recognised as potential sources of bias, such as the method used in generating the allocation sequence, how allocation was concealed and differences in drop‐out rates between study arms. We used the criteria outlined in the Cochrane Handbook for Systematic Reviews of Interventions Version 5.1.0 (Higgins 2011). Where there was uncertainty, we contacted the authors to clarify aspects of study design. We resolved disagreements by consensus or through arbitration by a third review author (AB).
Two review authors independently assessed the included studies for risk of bias using the Cochrane 'Risk of bias' assessment tool outlined in the Cochrane Handbook for Systematic Reviews of Interventions Version 5.1.0 using the following domains (Higgins 2011):
-
selection bias (random sequence generation and allocation concealment);
-
performance bias (blinding of participants and personnel);
-
detection bias (blinding of outcome assessors);
-
attrition bias (incomplete outcome data);
-
reporting bias (selective reporting);
-
other bias.
These domains were assessed to have:
-
high risk of bias;
-
unclear risk of bias;
-
low risk of bias.
We resolved disagreements by discussion or by consulting a third review author. We described all judgements fully and presented the conclusions in the 'Risk of bias' table, which was incorporated into the interpretation of review findings by means of sensitivity analyses.
We judged that blinding of the researcher, the personnel or the participants could not influence any of the outcomes. Therefore, we assessed all included trials at low risk of bias for blinding.
Measures of treatment effect
We performed statistical analyses in accordance with the guidelines for statistical analysis developed by Cochrane, outlined in the Cochrane Handbook for Systematic Reviews of Interventions Version 5.1.0 (Higgins 2011).
All outcomes were binary. We expressed results for each included study as Mantel‐Haenszel odds ratios (ORs) with 95% confidence intervals (CI).
Unit of analysis issues
The primary analysis was per couple randomised. If an included study only reported per cycle data, we contacted the author for additional information. We planned to include studies that could not provide us with per couple data in the review but not in the meta‐analysis, and describe them separately. We included both parallel group and cross‐over trials in the analysis. For cross‐over trials, we used only pre‐cross‐over data. Furthermore, we counted multiple live births (e.g. twins or triplets) as one live birth event.
Dealing with missing data
For missing data, we attempted to contact the authors. When we could not obtain the missing data from the authors, we explained the assumptions we made in the extraction and analysis of the data. We analysed only the available data.
Assessment of heterogeneity
We noted statistical heterogeneity between the results of different studies by visually inspecting the scatter in the data points on the graphs and the overlap in their CIs and using the I2 statistics. Following the Cochrane Handbook for Systematic Reviews of Interventions, we judged an I2 value greater than 50% to indicate substantial heterogeneity. We used a random‐effects model for sensitivity analysis and explored the original trials for clinical and methodological heterogeneity.
Assessment of reporting biases
Publication bias might influence the interpretation of the pooled results. To detect publication bias, we used a funnel plot, plotting sample size versus effect size, if there were sufficient studies. This plot is only relevant when five or more studies per comparison are included. The graph is symmetrical when bias is absent.
Data synthesis
If appropriate, we combined the data in a meta‐analysis using Review Manager 5 (RevMan 2014), using a fixed‐effect model and presenting OR with 95% CI. For reporting purposes, we translated primary outcomes to absolute risks.
We considered live birth rate and pregnancy outcomes as a positive consequence of treatment. For adverse outcomes such as OHSS, multiple pregnancy rate, miscarriage rate and total fertilisation failure, which are negative consequences, higher numbers were considered to be detrimental (increased odds signify relative harm). This needs to be take into consideration when interpreting the analyses.
Subgroup analysis and investigation of heterogeneity
A priori, we planned to perform separate subgroup analyses if there were more than two studies in each subgroup, for trials with different ovarian stimulation protocols (oral ovulation induction agents (anti‐oestrogens) versus gonadotrophins (FSH, human menopausal gonadotropin (hMG)).
Sensitivity analysis
We conducted sensitivity analyses for the primary outcomes, to examine stability regarding the pooled outcomes.
-
Restriction to studies without high risk of bias.
-
Use of a random‐effects model.
-
Use of risk ratio (RR) rather than OR.
Overall quality of the body of evidence: 'Summary of findings' table
We prepared a 'Summary of findings' table using GRADEpro software. This table evaluated the overall quality of the body of evidence for the review outcomes using GRADE criteria (study limitations, i.e. risk of bias, consistency of effect, imprecision, indirectness and publication bias). We justified, documented and incorporated judgements about evidence quality (high, moderate or low) into reporting of results for each outcome.
Results
Description of studies
Results of the search
The search strategy identified 2778 studies; after removing duplicates, 1854 studies remained. Handsearching identified another 18 studies. One review author (MC) screened the titles and abstracts and selected 49 studies for further evaluation. We excluded 36 studies with reasons and three studies were awaiting classification. Finally, the review included 10 studies (see Figure 1).
Included studies
Study design
Four of the 10 studies used a parallel design (Bensdorp 2015; Goverde 2000; Guzick 1999; Melis 1995). Bensdorp 2015 and Guzick 1999 published no separate data for male subfertility, but after correspondence with the first author and the author of another review (Veltman‐Verhulst 2012), we could extract relevant data. Six studies used a cross‐over design (Arici 1994; Cohlen 1998a; Francavilla 2009; Gregoriou 1996; Kerin 1984; Nan 1994). We only pooled pre‐cross‐over data in the meta‐analysis. Three studies were three‐arm trials (Bensdorp 2015; Francavilla 2009; Goverde 2000).
Elementary details concerning the studies are displayed in the Characteristics of included studies table.
Participants
The number of participants (couples) reported in the 10 included studies was 757. The sample size ranged from 21 to 254 couples.
Interventions
1. IUI versus TI or expectant management both in natural cycles
We extracted suitable data from one trial comparing IUI versus TI (Kerin 1984). The authors of Francavilla 2009 supplied unpublished pre‐cross‐over data. In Kerin 1984, one of the treatment arms instructed the participants to have "a single act of vaginal intercourse on the day the couple thought they were most fertile as detected by symptom thermal methods of ovulation detection", which can be considered to be expected management. No specifications regarding the number of outcomes were reported for this treatment arm.
2. IUI versus TI both in cycles with OH
One parallel trial addressed IUI versus TI both in cycles with OH (Melis 1995), and another two trials provided data after the first treatment period after one (Gregoriou 1996) and three (Nan 1994) cycles.
3. IUI in natural cycles versus TI in cycles with OH
We found no trials comparing IUI in natural cycles versus TI in cycles with OH.
4. IUI in cycles with OH versus TI or expectant management in natural cycles
The authors of Francavilla 2009 supplied unpublished pre‐cross‐over data.
5. IUI in cycles with OH versus IUI in natural cycles
Two parallel trials (Goverde 2000; Guzick 1999), and three cross‐over trials reported and provided data comparing IUI in natural cycles versus IUI in cycles with OH (Arici 1994; Cohlen 1998a; Francavilla 2009). Arici 1994 and Francavilla 2009 submitted unpublished data to another review from which we could extract separate data. Cohlen 1998a provided pre‐cross‐over per couple data.
6. IVF versus TI or expectant management in natural cycles
We found no trials comparing IVF versus TI or expectant management in natural cycles.
7. IVF versus TI in cycles with OH
We found no trials comparing IVF versus TI in cycles with OH.
8. IVF versus IUI in natural cycles
One parallel trial compared IVF versus IUI in natural cycles (Goverde 2000).
9. IVF versus IUI in cycles with OH
Two parallel trials compared IVF versus IUI in cycles with OH (Bensdorp 2015; Goverde 2000).
10. ICSI versus TI or expectant management in natural cycles
We found no trials comparing ICSI versus TI or expectant management in natural cycles.
11. ICSI versus TI in cycles with OH
We found no trials comparing ICSI versus TI in cycles with OH.
12. ICSI versus IUI in natural cycles
We found no trials comparing ICSI versus IUI in natural cycles.
13. ICSI versus IUI in cycles with OH
We found no trials comparing ICSI versus IUI in cycles with OH.
14. ICSI versus IVF
We found no trials comparing ICSI versus IVF.
Outcomes
Five studies provided our main outcome of interest; live birth rate per couple (Bensdorp 2015; Francavilla 2009; Goverde 2000; Guzick 1999; Melis 1995).The other five studies could provide data on pregnancy per couple (Arici 1994; Cohlen 1998a; Gregoriou 1996; Kerin 1984; Nan 1994). As most trials did not mention the results after each cycle separately, it was not possible to calculate cumulative pregnancy rates.
Two studies supplied information about OHSS in the mild male subfertility population (Bensdorp 2015; Nan 1994). For four studies, the OHSS data was not provided separately for the population with mild male subfertility (Francavilla 2009; Goverde 2000; Guzick 1999; Melis 1995). One study only provided the post‐cross‐over OHSS data (Cohlen 1998a).
Seven studies reported adverse outcomes (Bensdorp 2015; Cohlen 1998a; Goverde 2000; Guzick 1999; Kerin 1984; Melis 1995; Nan 1994). Six studies reported miscarriage or abortion (Bensdorp 2015; Cohlen 1998a; Francavilla 2009; Goverde 2000; Guzick 1999; Melis 1995). Eight studies reported multiple pregnancies (Bensdorp 2015; Cohlen 1998a; Francavilla 2009; Goverde 2000; Guzick 1999; Melis 1995; Kerin 1984; Nan 1994), and four studies reported ectopic pregnancies (Goverde 2000; Guzick 1999; Kerin 1984; Melis 1995).
Two studies did not state any adverse outcomes (Arici 1994; Gregoriou 1996).
Often the details on adverse effects were not provided for male subfertility separately, or at the end of the trial of post‐cross‐over. Therefore, we could not use these data in the review.
Excluded studies
We excluded 36 studies for the following reasons: 10 studies were not RCTs (retrospective or commentary design, not randomised or quasi randomised) (Elizur 2004; Galle 1990; Goverde 2001; Hewitt 1985; Moolenaar 2015; Nulsen 1993; Plachot 2002; Prentice 1995; Xie 2015; Zayed 1997). Eleven studies randomised oocytes instead of couples (Aboulghar 1995; Aboulghar 1996; Fan 2012; Fishel 2000; Kastrop 1999; Kihaile 2003; Li 2004; Pisarska 1999; Tournaye 2002; van der Westerlaken 2006; Verheyen 1999). In four studies, none of the comparisons of interest was included (Cruz 1986; Friedman 1989; Karlström 2000; Melis 1987). Two studies did not include male subfertility participants (Agarwal 2004; Elzeiny 2014). Two studies published incomplete data (Buvat 1990; Soliman 1993) and one study reported on biochemical pregnancies only (Evans 1991). To this date, we have received no response from the authors for additional information. Six studies with a cross‐over design could not supply their pre‐cross‐over data (Crosignani 1994; Ho 1989; Ho 1992; Kirby 1991; Martinez 1991; te Velde 1989). It is advocated that a particular concern with the cross‐over design is the risk of a carry‐over effect (Elbourne 2002; Khan 1996; McDonnell 2004). It may have been a source of bias and, therefore, we excluded these studies from the review. See the Characteristics of excluded studies table.
Studies awaiting classification
Three studies used a cross‐over design where no pre‐cross‐over data were published (Aribarg 1995; Jaroudi 1998; Kerin 1987). We attempted to contact authors to get these pre‐cross‐over data, but to this date, we have received no response.
Risk of bias in included studies
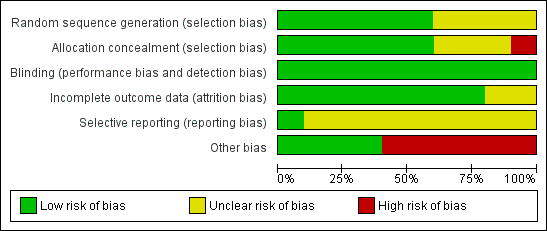
Figure 2 presents our judgements about each methodological quality item, presented as percentages across all included studies, and Figure 3 summarises our judgements about each methodological quality item for each included study.

Risk of bias graph: review authors' judgements about each risk of bias item presented as percentages across all included studies.

Risk of bias summary: review authors' judgements about each risk of bias item for each included study.
Study design
Of the 10 studies, four had a parallel design (Bensdorp 2015; Goverde 2000; Guzick 1999; Melis 1995). Six studies were of cross‐over alternating design, thus couples were initially randomised to one of the interventions and then alternated between treatment arms on each cycle. In Gregoriou 1996, the cross‐over took place after three cycles.
Allocation
The methods of randomisation or allocation concealment were generally poor in the published information, which might increase the risk for selection bias. However, we received additional information about allocation methods for some studies.
Random sequence generation
Five studies mentioned the use of a computer‐generated program for randomisation (Arici 1994; Bensdorp 2015; Goverde 2000; Guzick 1999; Melis 1995). One study used a random number table, not further specified (Nan 1994). The random sequence generation remained unclear for the other studies (Cohlen 1998a; Francavilla 2009; Gregoriou 1996; Kerin 1984). Sixty percent of the studies were at low risk of bias and 40% of the studies were at unclear risk of bias.
Allocation concealment
Four studies explicitly stated concealment of allocation (Bensdorp 2015; Cohlen 1998a; Goverde 2000; Melis 1995). After we had received additional information about allocation, we deemed two other trials at low risk of bias in this domain (Guzick 1999; Nan 1994). Concealment of allocation was done by the use of sealed opaque envelopes, locked computer files or white and black discs from a blinded bag. We deemed one study at high risk allocation concealment (Francavilla 2009). Concealment of allocation was done on chronological basis. The concealment of allocation was unclear for the other studies (Arici 1994; Gregoriou 1996; Kerin 1984). Sixty percent of the studies were at low risk of bias, 10% of the studies were at high risk of bias and 30% of the studies were at unclear risk of bias.
Blinding
None of the studies reported blinding. In trials comparing TI versus IUI or IUI versus IVF it is of course impossible to blind the participants. In trials of IUI with and without OH, blinding could technically be performed. However, often stimulation is administered intramuscularly, so blinding might be considered unethical. All studies were at low risk of bias with respect to blinding as we determined that it was unlikely to influence our review outcomes.
Incomplete outcome data
Nine studies reported information on drop‐outs, cancelled cycles, or both (Arici 1994; Bensdorp 2015; Cohlen 1998a; Francavilla 2009; Goverde 2000; Guzick 1999; Kerin 1984 ; Melis 1995; Nan 1994). The number of drop‐outs varied from 0% to 25%, the number of cancelled cycles varied from 4% to 19%. One study reported the drop‐out of 17 couples before the start of the first treatment cycle (failed to return, refused randomisation, other subfertility factors) and included 75% (56/75) of the couples in their analysis (Arici 1994). One study reported the drop‐out of 11 couples and included 88% (81/92) of the couples in their analysis (Melis 1995). Six studies reported on their drop‐outs and analysed 100% of the couples included in their study (Bensdorp 2015; Cohlen 1998a; Goverde 2000; Gregoriou 1996; Kerin 1984; Nan 1994). The proportion of analysed couples remained unclear in two studies (Francavilla 2009; Guzick 1999).
Four studies stated that the most important reasons for cancelling a cycle were a premature or missed LH surge and OHSS (Cohlen 1998a; Goverde 2000; Gregoriou 1996; Nan 1994). Furthermore, Goverde 2000 reported that in 37 cycles there was no fertilisation after insemination of the aspirated oocytes during IVF. Melis 1995 stated that the most important reasons for cancelling a cycle were a poor response to ovulation induction and exaggerated response to ovulation induction.
Eighty percent of the studies were at low risk of bias and 20% of the studies were at unclear risk of bias.
Selective reporting
A total of 50% of the included studies reported live birth rates. The remaining studies defined (clinical) pregnancy rates (see Characteristics of included studies table). Ten percent of the studies were at low risk of bias and 90% of the studies were at unclear risk of bias.
Other potential sources of bias
Six studies used a cross‐over design and there might be selectivity in availability of the data (Arici 1994; Cohlen 1998a; Francavilla 2009; Gregoriou 1996; Kerin 1984; Nan 1994). Forty percent of the studies were at low risk of bias and 60% of the studies were at high risk of bias.
Effects of interventions
See: Summary of findings for the main comparison IUI in natural cycles compared to TI in natural cycles for male subfertility; Summary of findings 2 IUI in stimulated cycles compared to TI in stimulated cycles for male subfertility; Summary of findings 3 IUI in stimulated cycles compared to TI in natural cycles for male subfertility; Summary of findings 4 IUI in stimulated cycles compared to IUI in natural cycles for male subfertility; Summary of findings 5 IVF compared to IUI in natural cycles for male subfertility; Summary of findings 6 IVF compared to IUI in stimulated cycles for male subfertility
See: summary of findings Table for the main comparison; summary of findings Table 2; summary of findings Table 3; summary of findings Table 4; summary of findings Table 5; summary of findings Table 6.
Overall the meta‐analyses included 10 studies with 757 couples. Three studies were three‐arm trials, in which each full group has been used twice in a pair‐wise comparison between arms.
1. IUI versus TI or expectant management both in natural cycles
Two studies compared IUI with TI both in natural cycles (Kerin 1984; Francavilla 2009).
Live birth rate per couple
Neither of the studies reported on live births.
OHSS
Neither of the studies reported on OHSS.
Pregnancy rate per couple
Both studies reported clinical pregnancy rate. There was no evidence of a difference in pregnancy rate per couple for IUI versus TI in natural cycles (2 trials, 62 couples: OR 4.57, 95% CI 0.21 to 101.61; very low quality evidence). There were no events in one of the studies (Figure 4; Analysis 1.1).
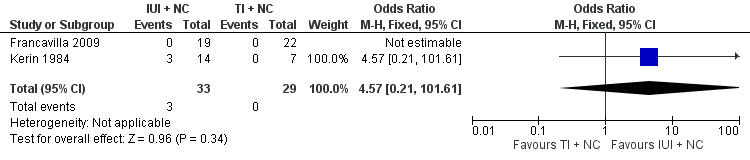
Forest plot of comparison: 1 Intra‐uterine insemination (IUI) versus timed intercourse (TI) both in natural cycles (NC), outcome: 1.1 Pregnancy rate per couple (all cycles).
Multiple pregnancy
Neither of the studies reported on multiple pregnancy.
Miscarriage
Neither of the studies reported on miscarriage.
2. IUI versus TI both in cycles with OH
Three studies compared IUI with TI both in cycles with OH (Gregoriou 1996; Melis 1995; Nan 1994).
Live birth rate per couple
One study reported on live birth rate. There was no evidence of a difference in live birth rate per couple for IUI versus TI in stimulated cycles (1 trial, 81 couples: OR 0.89, 95% CI 0.30 to 2.59; low quality evidence) (Analysis 2.1). In absolute terms, this result implied that a 22% success rate using TI with OH would become between 2% and 38% using IUI with OH.
OHSS
OHSS occurred in none of the cycles (Nan 1994) (Analysis 2.2).
Pregnancy rate per couple
There was no evidence of a difference in pregnancy rate per couple for IUI versus TI in stimulated cycles (3 trials, 202 couples: OR 1.51, 95% CI 0.74 to 3.07; I2 = 11%, very low quality evidence) (Figure 5; Analysis 2.3).

Forest plot of comparison: 2 Intra‐uterine insemination (IUI) versus timed intercourse (TI) both in cycles with ovarian hyperstimulation (OH), outcome: 2.3 Pregnancy rate per couple (all cycles).
Multiple pregnancy
There was no evidence of a difference in multiple pregnancy rate between IUI and TI in stimulated cycles (1 trial, 81 couples: OR 3.15, 95% CI 0.12 to 79.69; low quality evidence) (Analysis 2.4).
Miscarriage
There was no evidence of a difference in miscarriage rate per couple for IUI versus TI in stimulated cycles (1 trial, 81 couples: OR 1.03, 95% CI 0.19 to 5.42; low quality evidence) (Analysis 2.5).
3. IUI in natural cycles versus TI in cycles with OH
We found no trials comparing IUI in natural cycles versus TI in cycles with OH.
4. IUI in cycles with OH versus TI or expectant management in natural cycles
One study compared IUI with OH versus TI with natural cycles (Francavilla 2009).
Live birth rate per couple
One study reported on live birth rate. There was no evidence of a difference in live birth rate per couple for IUI with OH versus TI in natural cycles (1 trial, 44 couples: OR 3.14, 95% CI 0.12 to 81.35; very low quality evidence) (Analysis 4.1). In the TI group, there were no live births (0 of 29 couples), in the IUI group, 9% of couples had a live birth (3/33 couples).
OHSS
There were no (pre‐cross‐over) data available.
Pregnancy rate per couple
There was no evidence of a difference in pregnancy rate per couple for IUI with OH versus TI in natural cycles (1 trial, 44 couples: OR 3.14, 95% CI 0.12 to 81.35; very low quality evidence) (Figure 6; Analysis 4.2).
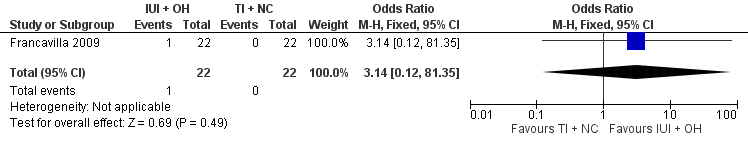
Forest plot of comparison: 4 Intra‐uterine insemination (IUI) in cycles with ovarian hyperstimulation (OH) versus timed intercourse (TI) in natural cycles (NC), outcome: 4.2 Pregnancy rate per couple (all cycles).
Multiple pregnancy
There were no (pre‐cross‐over) data available.
Miscarriage
There were no miscarriages reported.
5 IUI in cycles with OH versus IUI in natural cycles
Five studies compared IUI in cycles with OH with IUI in natural cycles (Arici 1994; Cohlen 1998a; Francavilla 2009; Goverde 2000; Guzick 1999).
Live birth rate per couple
One study reported on live births per treatment arm (Goverde 2000). Francavilla 2009 and Guzick 1999 provided data on live birth rate for the male subfertility group after we contacted them. There was no evidence of a difference in live birth rate per couple for IUI with OH versus IUI in natural cycles (3 trials, 346 couples: OR 1.34, 95% CI 0.77 to 2.33; I2 = 0%, very low quality evidence) (Analysis 5.1). In absolute terms, this result implied that a 17% success rate using IUI in natural cycles would become between 13% and 30% using IUI with OH.
OHSS
None of the studies reported on OHSS.
Pregnancy rate per couple
Four studies reported on pregnancy rate per couple, after one cycle (Arici 1994; Cohlen 1998a; Francavilla 2009) or several cycles (Guzick 1999). There was no evidence of a difference in pregnancy rate per couple for IUI with OH versus IUI in natural cycles (4 trials, 399 couples: OR 1.68, 95% CI 1.00 to 2.82; I2 = 0%, very low quality evidence) (Figure 7; Analysis 5.2).

Forest plot of comparison: 5 Intra‐uterine insemination (IUI) in natural cycles (NC) versus IUI in cycles with ovarian hyperstimulation (OH) versus IUI in natural cycles (NC), outcome: 5.2 Pregnancy rate per couple (all cycles).
Multiple pregnancy
None of the studies reported on multiple pregnancy.
Miscarriage
Two studies reported on miscarriage rate (Cohlen 1998a; Guzick 1999). There was no evidence of a difference in miscarriage rate per couple for IUI with OH versus IUI in natural cycles (2 trials, 115 couples: OR 1.06, 95% CI 0.20 to 5.63; very low quality evidence). There were no events in one of the studies (Analysis 5.3).
6. IVF versus TI or expectant management in natural cycles
We found no trials comparing IVF versus TI or expectant management in natural cycles.
7. IVF versus TI in cycles with OH
We found no trials comparing IVF versus TI in cycles with OH.
8. IVF versus IUI in natural cycles
One study compared IVF with IUI in natural cycles (Goverde 2000).
Live birth rate per couple
There was no evidence of a difference in live birth rate per couple for IVF versus IUI in natural cycles (1 trial, 53 couples: OR 0.77, 95% CI 0.25 to 2.35; low quality evidence) (Figure 8; Analysis 8.1). In absolute terms, this result implied that a 41% success rate using IUI in natural cycles would become between 9% and 61% using IVF.

Forest plot of comparison: 8 In vitro fertilisation (IVF) versus intra‐uterine insemination (IUI) in natural cycles (NC), outcome: 8.1 Live birth rate per couple (all cycles).
OHSS
Severe OHSS occurred in three women of the IVF group for the whole study arm of whom the majority had unexplained subfertility. It was unclear whether any of the couples with mild male subfertility developed OHSS.
Pregnancy rate per couple
None of the studies reported on pregnancy rate.
Multiple pregnancy
None of the studies reported on multiple pregnancy.
Miscarriage
None of the studies reported on miscarriage.
Total fertilisation failure
Total fertilisation failure occurred in 37 IVF cycles (male and unexplained subfertility).
9. IVF versus IUI in cycles with OH
Two studies compared IVF with IUI with OH cycles (Bensdorp 2015; Goverde 2000).
Live birth rate per couple
There was no evidence of a difference in live birth rate per couple for IVF versus IUI cycles with OH (2 trials, 86 couples: OR 1.03, 95% CI 0.43 to 2.45; I2 = 0%, very low quality evidence) (Figure 9; Analysis 9.1). In absolute terms, this result implied that a 45% success rate using IUI cycles with OH would become between 25% and 66% using IVF.

Forest plot of comparison: 9 In vitro fertilisation (IVF) versus intra‐uterine insemination (IUI) in cycles with ovarian hyperstimulation (OH), outcome: 9.1 Live birth rate per couple (all cycles).
OHSS
OHSS occurred in none of the IVF or IUI with OH cycles (Bensdorp 2015) (Analysis 9.2).
Pregnancy rate per couple
There was no evidence of a difference in pregnancy rate per couple for IVF versus IUI cycles with OH (1 trial, 36 couples: OR 1.27, 95% CI 0.33 to 4.97; low quality evidence) (Analysis 9.3).
Multiple pregnancy
Bensdorp 2015 reported two twins, one in the IUI with OH group, one in the IVF with single embryo transfer group.
Miscarriage
Bensdorp 2015 reported two miscarriages, one in the IUI with OH group, one in the IVF with single embryo transfer group.
Total fertilisation failure
Goverde 2000 reported total fertilisation failure in 37 IVF cycles (male and unexplained subfertility).
10. ICSI versus TI or expectant management in natural cycles
We found no trials comparing ICSI versus TI or expectant management in natural cycles.
11. ICSI versus TI in cycles with OH
We found no trials comparing ICSI versus TI in cycles with OH.
12. ICSI versus IUI in natural cycles
We found no trials comparing ICSI versus IUI in natural cycles.
13. ICSI versus IUI in cycles with OH
We found no trials comparing ICSI versus IUI in cycles with OH.
14. ICSI versus IVF
We found no trials comparing ICSI versus IVF.
Sensitivity analyses
The use of RRs and use of a random‐effects model did not substantially alter the findings for any of the comparisons and outcomes.
Discussion
Summary of main results
The aim of this review was to investigate the effectiveness and safety of treatments for couples with male subfertility with regard to live birth rates. Because RCTs are considered to provide the best assessment of the effectiveness of treatments (Johnson 2003), we included only RCTs in this review. The meta‐analyses could include 10 studies, see summary of findings Table for the main comparison; summary of findings Table 2; summary of findings Table 3; summary of findings Table 4; summary of findings Table 5; and summary of findings Table 6. These studies reported data on six of the proposed comparisons and included 757 couples with male subfertility who underwent 4400 cycles. The trials in this review revealed that there is no evidence that one of the treatment options is superior to another. However, the available evidence is limited due to small sample size and lack of high quality trials.
Overall completeness and applicability of evidence
The primary outcome for this review was live birth rate per couple. Not all of the trials reported this outcome. Furthermore, evidence was available for only six of the 14 comparisons that we evaluated. We found RCTs to compare expectant management or TI with IUI, IUI with and without OH and IUI with IVF. Unfortunately, we found no RCTs comparing IVF and ICSI. Although these treatments are used on a large scale for male subfertility globally, we only found studies comparing IVF and ICSI in couples with male subfertility with random allocation of oocytes to fertilisation by insemination or injection only (Aboulghar 1995; Aboulghar 1996; Fan 2012; Fishel 2000; Kastrop 1999; Kihaile 2003; Li 2004; Pisarska 1999; Tournaye 2002; van der Westerlaken 2006; Verheyen 1999). Embryos, irrespective of mode of fertilisation, were transferred according to quality. Therefore, we could draw no conclusions on the effect of IVF or ICSI on pregnancy rate in these studies.
Only a few studies reported on adverse effects. Globally, OHSS and multiple pregnancy rates are considered to be an adverse outcome in subfertility practice (Dias 2006; Healy 2004). The risk of perinatal mortality and maternal morbidity associated with multiple pregnancy has become increasingly unacceptable. Therefore, the aim in fertility treatment is shifting from focusing on pregnancy rates alone to the birth of healthy term singletons (Fauser 2005). The use of OH, as part of the IUI treatment, increases the number of available oocytes at the site of conception and thereby might increase the prevalence of OHSS and multiple pregnancy rates. We could not establish on what scale IUI with OH influence OHSS and multiple pregnancy rates in this review. In the literature, only a few studies reported on the differences in multiple pregnancy rates between fertility treatments (Bensdorp 2015; Mansour 2014; Practice Committee of the ASRM 2012; Sullivan 2013). Bensdorp 2015 found no difference in OHSS or multiple pregnancy rate between IUI with OH and IVF with single embryo transfer in couples experiencing male and unexplained subfertility. Unfortunately, other studies did not report on OHSS rates for couples with male subfertility separately and, therefore, we could draw no firm conclusion from this study for couples experiencing male subfertility, due to the lack of power.
WHO criteria are often applied when defining normal semen quality, but they have little prognostic value. Pregnancy has been achieved with IUI with semen that was below these thresholds (Dickey 1999), and also men whose sperm met these standards have been found infertile (Hamilton 2015). In addition, the distinction between male subfertility (semen parameters below the levels of normality defined by WHO) and unexplained subfertility (semen parameters above the levels of normality defined by WHO) is indefinite. Many trials have been performed to analyse the relationship between semen quality and parameters or the TMSC and natural fertility. For clinical practice, it would be useful to have a test that could distinguish subfertile men with good chances of conception from those with poor odds, rather than discriminating between fertile and subfertile men (Verhoeve 2006). There is evidence for a continuous correlation between TMSC and the probability of natural conception (van der Steeg 2011). The predictive capacity of threshold values for (post‐wash) TMSC, progressive motility as well as the role of sperm morphology are yet to be established (Matorras 1995; Ombelet 1997). It appears that semen quality contributes to the effectiveness of IUI (Duran 2002a; Ombelet 2003; Steures 2004; Tijani 2010; Wainer 2004), and that there is a threshold below which IUI is no longer effective (Dickey 1999; van Weert 2004). Furthermore, semen quality seems to play a role in predicting total fertilisation failure in IVF cycles (Repping 2002; Rhemrev 2001).
Other screening tests have been proposed in male subfertility, such as sperm deoxyribonucleic acid (DNA) integrity tests. There are several techniques to measure gross sperm DNA fragmentation (e.g. the sperm chromatin structure assay (SCSA), the sperm chromatin dispersion test (SCD), the TUNEL (terminal deoxyribonucleotide transferase‐mediated dUTP‐X Nick end‐labelling) assay and the Comet assay). An association between the presence of DNA abnormalities in sperm and pregnancy outcome has been established (Avendano 2010; Bakos 2008; Duran 2002a; Simon 2014). In view of the debatable accuracy of these tests to predict pregnancy rates, they do not seem to be of use in practice (Practice Committee of the ASRM 2013).
Quality of the evidence
The quality of the evidence for most comparisons was low or very low. The method of randomisation and allocation concealment were unclear in some trials. Blinding could not be performed due to the nature of the interventions, but this was unlikely to affect the outcomes in this review. The trials included in the meta‐analysis had several limitations, which were most prominent in the oldest studies. These studies had small sample sizes, used a cross‐over design, had a limited duration of follow‐up that was unequal between the studies and the definition of male subfertility and the clinical protocols used varied among the studies. Methodological quality within studies with a cross‐over design in fertility trials have been under debate. A cross‐over design could result in an overestimation of the treatment effect (Khan 1996; Norman 2000). Whether this overestimation could be statistically corrected for or whether it is clinically relevant remains unclear (Cohlen 1998b; McDonnell 2004; Vail 2003), therefore, we only used the pre‐cross‐over data. Furthermore, most studies have determined pregnancy rates as the endpoint, while live birth rate was our primary outcome. The latest updated Cochrane guidelines for analysing and presenting results emphasise the use of pregnancy and live birth per woman or couple in the meta‐analysis. However, in practice such data are not always available.
Potential biases in the review process
Our searches aimed to identify all potentially eligible studies. Besides the potential biases discussed above, there might be some bias due to differential definitions of male subfertility. The trials used different definitions with respect to the numbers of semen samples required, how many and which parameters were assessed, and the thresholds that were subsequently applied for inclusion. Most of the trials used the WHO criteria, in accordance with the year of the study performed.
Agreements and disagreements with other studies or reviews
Conclusion of the previous version of this review and another review were in line with our findings (Bensdorp 2007a; Tournaye 2012). The Cochrane review on the use of IUI in couples experiencing unexplained subfertility found evidence of a higher pregnancy rate in IUI versus TI, both in stimulated cycles (Veltman‐Verhulst 2012). This review also found a higher live birth rate in IUI with OH cycles versus IUI in natural cycles. There was no evidence of a difference in multiple pregnancy rates. In the Cochrane review on the use of IVF versus expectant management or IUI with OH in couples experiencing unexplained subfertility the evidence of a difference was inconclusive (Pandian 2012).
Study flow diagram.
Risk of bias graph: review authors' judgements about each risk of bias item presented as percentages across all included studies.

Risk of bias summary: review authors' judgements about each risk of bias item for each included study.

Forest plot of comparison: 1 Intra‐uterine insemination (IUI) versus timed intercourse (TI) both in natural cycles (NC), outcome: 1.1 Pregnancy rate per couple (all cycles).

Forest plot of comparison: 2 Intra‐uterine insemination (IUI) versus timed intercourse (TI) both in cycles with ovarian hyperstimulation (OH), outcome: 2.3 Pregnancy rate per couple (all cycles).

Forest plot of comparison: 4 Intra‐uterine insemination (IUI) in cycles with ovarian hyperstimulation (OH) versus timed intercourse (TI) in natural cycles (NC), outcome: 4.2 Pregnancy rate per couple (all cycles).

Forest plot of comparison: 5 Intra‐uterine insemination (IUI) in natural cycles (NC) versus IUI in cycles with ovarian hyperstimulation (OH) versus IUI in natural cycles (NC), outcome: 5.2 Pregnancy rate per couple (all cycles).
Forest plot of comparison: 8 In vitro fertilisation (IVF) versus intra‐uterine insemination (IUI) in natural cycles (NC), outcome: 8.1 Live birth rate per couple (all cycles).

Forest plot of comparison: 9 In vitro fertilisation (IVF) versus intra‐uterine insemination (IUI) in cycles with ovarian hyperstimulation (OH), outcome: 9.1 Live birth rate per couple (all cycles).

Comparison 1 Intra‐uterine insemination (IUI) versus timed intercourse (TI) both in natural cycles (NC), Outcome 1 Pregnancy rate per couple (all cycles).

Comparison 2 Intra‐uterine insemination (IUI) versus timed intercourse (TI) both in cycles with ovarian hyperstimulation (OH), Outcome 1 Live birth rate per couple (all cycles).
Comparison 2 Intra‐uterine insemination (IUI) versus timed intercourse (TI) both in cycles with ovarian hyperstimulation (OH), Outcome 2 OHSS per couple.
Comparison 2 Intra‐uterine insemination (IUI) versus timed intercourse (TI) both in cycles with ovarian hyperstimulation (OH), Outcome 3 Pregnancy rate per couple (all cycles).

Comparison 2 Intra‐uterine insemination (IUI) versus timed intercourse (TI) both in cycles with ovarian hyperstimulation (OH), Outcome 4 Multiple pregnancy rate per couple.

Comparison 2 Intra‐uterine insemination (IUI) versus timed intercourse (TI) both in cycles with ovarian hyperstimulation (OH), Outcome 5 Miscarriage rate per couple.

Comparison 4 Intra‐uterine insemination (IUI) in cycles with ovarian hyperstimulation (OH) versus timed intercourse (TI) in natural cycles (NC), Outcome 1 Live birth rate per couple (all cycles).

Comparison 4 Intra‐uterine insemination (IUI) in cycles with ovarian hyperstimulation (OH) versus timed intercourse (TI) in natural cycles (NC), Outcome 2 Pregnancy rate per couple (all cycles).
Comparison 5 Intra‐uterine insemination (IUI) in cycles with ovarian hyperstimulation (OH) versus IUI in natural cycles (NC), Outcome 1 Live birth rate per couple (all cycles).

Comparison 5 Intra‐uterine insemination (IUI) in cycles with ovarian hyperstimulation (OH) versus IUI in natural cycles (NC), Outcome 2 Pregnancy rate per couple (all cycles).

Comparison 5 Intra‐uterine insemination (IUI) in cycles with ovarian hyperstimulation (OH) versus IUI in natural cycles (NC), Outcome 3 Miscarriage rate per couple.

Comparison 8 In vitro fertilisation (IVF) versus intra‐uterine insemination (IUI) in natural cycles (NC), Outcome 1 Live birth rate per couple (all cycles).

Comparison 9 In vitro fertilisation (IVF) versus intra‐uterine insemination (IUI) in cycles with ovarian hyperstimulation (OH), Outcome 1 Live birth rate per couple (all cycles).

Comparison 9 In vitro fertilisation (IVF) versus intra‐uterine insemination (IUI) in cycles with ovarian hyperstimulation (OH), Outcome 2 OHSS per couple.

Comparison 9 In vitro fertilisation (IVF) versus intra‐uterine insemination (IUI) in cycles with ovarian hyperstimulation (OH), Outcome 3 Pregnancy rate per couple (all cycles).
| IUI in natural cycles compared to TI in natural cycles for male subfertility | ||||||
| Patient or population: couples with male subfertility | ||||||
| Outcomes | Illustrative comparative risks* (95% CI) | Relative effect | No of couples (studies) | Quality of the evidence | Comments | |
| Assumed risk | Corresponding risk | |||||
| TI in natural cycles | IUI in natural cycles | |||||
| Live birth rate | Not reported in any included studies | ‐ | ‐ | |||
| OHSS | Not reported in any included studies | ‐ | ‐ | |||
| Pregnancy rate per couple (all cycles) | 0 per 1000 | 0 per 1000 | OR 4.57 | 62 | ⊕⊝⊝⊝ | ‐ |
| *The basis for the assumed risk was the median control group risk across studies. The corresponding risk (and its 95% confidence interval) is based on the assumed risk in the comparison group and the relative effect of the intervention (and its 95% CI). | ||||||
| GRADE Working Group grades of evidence | ||||||
| 1 Risk of bias was very serious: 1. Francavilla 2009, allocation concealment: high risk (on chronological basis), 2. Francavilla 2009, other bias: high risk (no stratification by diagnosis category of subfertility). | ||||||
| IUI in stimulated cycles compared to TI in stimulated cycles for male subfertility | ||||||
| Patient or population: couples with male subfertility | ||||||
| Outcomes | Illustrative comparative risks* (95% CI) | Relative effect | No of couples (studies) | Quality of the evidence | Comments | |
| Assumed risk | Corresponding risk | |||||
| TI in stimulated cycles | IUI in stimulated cycles | |||||
| Live birth rate per couple (all cycles) | 220 per 1000 | 200 per 1000 | OR 0.89 | 81 | ⊕⊕⊝⊝ | ‐ |
| OHSS per couple Follow‐up: 6 months | See comment | See comment | Not estimable | 59 (1 study) | ⊕⊕⊝⊝ | ‐ |
| Pregnancy rate per couple (all cycles) | 175 per 1000 | 243 per 1000 | OR 1.51 | 202 | ⊕⊝⊝⊝ | ‐ |
| Multiple pregnancy rate per couple | 0 per 1000 | 0 per 1000 | OR 3.15 | 81 | ⊕⊕⊝⊝ | ‐ |
| Miscarriage rate per couple | 73 per 1000 | 75 per 1000 | OR 1.03 | 81 | ⊕⊕⊝⊝ | ‐ |
| *The basis for the assumed risk was the median control group risk across studies. The corresponding risk (and its 95% confidence interval) is based on the assumed risk in the comparison group and the relative effect of the intervention (and its 95% CI). | ||||||
| GRADE Working Group grades of evidence | ||||||
| 1 There was very serious imprecision, with small sample size. | ||||||
| IUI in stimulated cycles compared to TI in natural cycles for male subfertility | ||||||
| Patient or population: couples with male subfertility | ||||||
| Outcomes | Illustrative comparative risks* (95% CI) | Relative effect | No of couples (studies) | Quality of the evidence | Comments | |
| Assumed risk | Corresponding risk | |||||
| TI in natural cycles | IUI in stimulated cycles | |||||
| Live birth rate per couple (all cycles) | 0 per 1000 | 0 per 1000 | OR 3.14 | 44 | ⊕⊝⊝⊝ | ‐ |
| OHSS | Not reported in any included studies | ‐ | ||||
| Pregnancy rate per couple (all cycles) | 0 per 1000 | 0 per 1000 | OR 3.14 | 44 | ⊕⊝⊝⊝ | ‐ |
| *The basis for the assumed risk was the median control group risk across studies. The corresponding risk (and its 95% confidence interval) is based on the assumed risk in the comparison group and the relative effect of the intervention (and its 95% CI). | ||||||
| GRADE Working Group grades of evidence | ||||||
| 1 Risk of bias was very serious: 1. Allocation concealment: high risk (on chronological basis), 2. Other bias: high risk (no stratification by diagnosis category of subfertility). | ||||||
| IUI in stimulated cycles compared to IUI in natural cycles for male subfertility | ||||||
| Patient or population: couples with male subfertility | ||||||
| Outcomes | Illustrative comparative risks* (95% CI) | Relative effect | No of couples | Quality of the evidence | Comments | |
| Assumed risk | Corresponding risk | |||||
| IUI in natural cycles | IUI in stimulated cycles | |||||
| Live birth rate per couple (all cycles) | 172 per 1000 | 218 per 1000 | OR 1.34 | 346 | ⊕⊝⊝⊝ | ‐ |
| OHSS | Not reported in any included studies | ‐ | ‐ | |||
| Pregnancy rate per couple (all cycles) | 148 per 1000 | 226 per 1000 | OR 1.68 | 399 | ⊕⊝⊝⊝ | ‐ |
| Miscarriage rate per couple | 53 per 1000 | 56 per 1000 | OR 1.06 | 115 | ⊕⊝⊝⊝ | ‐ |
| *The basis for the assumed risk was the median control group risk across studies. The corresponding risk (and its 95% confidence interval) is based on the assumed risk in the comparison group and the relative effect of the intervention (and its 95% CI). | ||||||
| GRADE Working Group grades of evidence | ||||||
| 1 Risk of bias was very serious: 1. Francavilla 2009, allocation concealment: high risk (on chronological basis), 2. Arici 1994, Francavilla 2009, and Guzick 1999, other bias: high risk (no stratification by diagnosis category of subfertility. | ||||||
| IVF compared to IUI in natural cycles for male subfertility | ||||||
| Patient or population: couples with male subfertility | ||||||
| Outcomes | Illustrative comparative risks* (95% CI) | Relative effect | No of couples (studies) | Quality of the evidence | Comments | |
| Assumed risk | Corresponding risk | |||||
| IUI in natural cycles | IVF | |||||
| Live birth rate per couple (all cycles) | 407 per 1000 | 346 per 1000 | OR 0.77 | 53 | ⊕⊕⊝⊝ | ‐ |
| OHSS | Not reported in any included studies | ‐ | ‐ | |||
| *The basis for the assumed risk was the median control group risk across studies. The corresponding risk (and its 95% confidence interval) is based on the assumed risk in the comparison group and the relative effect of the intervention (and its 95% CI). | ||||||
| GRADE Working Group grades of evidence | ||||||
| 1 There was very serious imprecision, with small sample sizes. | ||||||
| IVF compared to IUI in stimulated cycles for male subfertility | ||||||
| Patient or population: couples with male subfertility | ||||||
| Outcomes | Illustrative comparative risks* (95% CI) | Relative effect | No of couples (studies) | Quality of the evidence | Comments | |
| Assumed risk | Corresponding risk | |||||
| IUI in stimulated cycles | IVF | |||||
| Live birth rate per couple (all cycles) | 452 per 1000 | 460 per 1000 | OR 1.03 | 86 | ⊕⊝⊝⊝ | ‐ |
| OHSS per couple | See comment | See comment | Not estimable | 36 | ⊕⊝⊝⊝ | No OHSS occurred |
| Pregnancy rate per couple (all cycles) | 611 per 1000 | 666 per 1000 | OR 1.27 | 36 | ⊕⊝⊝⊝ | ‐ |
| *The basis for the assumed risk was the median control group risk across studies. The corresponding risk (and its 95% confidence interval) is based on the assumed risk in the comparison group and the relative effect of the intervention (and its 95% CI). | ||||||
| GRADE Working Group grades of evidence | ||||||
| 1 Risk of bias was serious: Bensdorp 2015, other bias: high risk (no stratification by diagnosis category of subfertility). | ||||||
| Outcome or subgroup title | No. of studies | No. of participants | Statistical method | Effect size |
| 1 Pregnancy rate per couple (all cycles) Show forest plot | 2 | 62 | Odds Ratio (M‐H, Fixed, 95% CI) | 4.57 [0.21, 101.61] |
| Outcome or subgroup title | No. of studies | No. of participants | Statistical method | Effect size |
| 1 Live birth rate per couple (all cycles) Show forest plot | 1 | 81 | Odds Ratio (M‐H, Fixed, 95% CI) | 0.89 [0.30, 2.59] |
| 2 OHSS per couple Show forest plot | 1 | 59 | Odds Ratio (M‐H, Fixed, 95% CI) | 0.0 [0.0, 0.0] |
| 3 Pregnancy rate per couple (all cycles) Show forest plot | 3 | 202 | Odds Ratio (M‐H, Fixed, 95% CI) | 1.51 [0.74, 3.07] |
| 4 Multiple pregnancy rate per couple Show forest plot | 1 | 81 | Odds Ratio (M‐H, Fixed, 95% CI) | 3.15 [0.12, 79.69] |
| 5 Miscarriage rate per couple Show forest plot | 1 | 81 | Odds Ratio (M‐H, Fixed, 95% CI) | 1.03 [0.19, 5.42] |
| Outcome or subgroup title | No. of studies | No. of participants | Statistical method | Effect size |
| 1 Live birth rate per couple (all cycles) Show forest plot | 1 | 44 | Odds Ratio (M‐H, Fixed, 95% CI) | 3.14 [0.12, 81.35] |
| 2 Pregnancy rate per couple (all cycles) Show forest plot | 1 | 44 | Odds Ratio (M‐H, Fixed, 95% CI) | 3.14 [0.12, 81.35] |
| Outcome or subgroup title | No. of studies | No. of participants | Statistical method | Effect size |
| 1 Live birth rate per couple (all cycles) Show forest plot | 3 | 346 | Odds Ratio (M‐H, Fixed, 95% CI) | 1.34 [0.77, 2.33] |
| 1.1 Gonadotrophins | 2 | 305 | Odds Ratio (M‐H, Fixed, 95% CI) | 1.31 [0.75, 2.29] |
| 1.2 Gonadotrophins + clomiphene citrate (CC) | 1 | 41 | Odds Ratio (M‐H, Fixed, 95% CI) | 2.72 [0.10, 70.79] |
| 2 Pregnancy rate per couple (all cycles) Show forest plot | 4 | 399 | Odds Ratio (M‐H, Fixed, 95% CI) | 1.68 [1.00, 2.82] |
| 2.1 Gonadotrophins | 2 | 328 | Odds Ratio (M‐H, Fixed, 95% CI) | 1.60 [0.94, 2.73] |
| 2.2 CC | 1 | 30 | Odds Ratio (M‐H, Fixed, 95% CI) | 4.83 [0.18, 128.79] |
| 2.3 Gonadotrophins + CC | 1 | 41 | Odds Ratio (M‐H, Fixed, 95% CI) | 2.72 [0.10, 70.79] |
| 3 Miscarriage rate per couple Show forest plot | 2 | 115 | Odds Ratio (M‐H, Fixed, 95% CI) | 1.06 [0.20, 5.63] |
| Outcome or subgroup title | No. of studies | No. of participants | Statistical method | Effect size |
| 1 Live birth rate per couple (all cycles) Show forest plot | 1 | 53 | Odds Ratio (M‐H, Fixed, 95% CI) | 0.77 [0.25, 2.35] |
| Outcome or subgroup title | No. of studies | No. of participants | Statistical method | Effect size |
| 1 Live birth rate per couple (all cycles) Show forest plot | 2 | 86 | Odds Ratio (M‐H, Fixed, 95% CI) | 1.03 [0.43, 2.45] |
| 2 OHSS per couple Show forest plot | 1 | 36 | Odds Ratio (M‐H, Fixed, 95% CI) | 0.0 [0.0, 0.0] |
| 3 Pregnancy rate per couple (all cycles) Show forest plot | 1 | 36 | Odds Ratio (M‐H, Fixed, 95% CI) | 1.27 [0.33, 4.97] |