| Comparison | Study ID | Age Distirbution | Subfertility Years | Prime/second subfert | Nr semen samples | Sperm parameters | Previous treatment | Stimulation method | Nr Inseminations |
| IUI in NC vs TI in NC | Ho 1989 | Mean 31.6 ys (SD 3.7) | Mean 5.3 ys (SD 2.9) | Not stated | 3 | pre‐wash: sperm count: 20.09 million/ml (SD ± 20.64) , or motility 44.68 % (SD 13.75), TMSC 34.31 (SD 45.72) post wash: sperm count: 3.16 million/ml (SD 5.23) , or motility 80.66 % (SD 13.22), TMSC 1.51 (SD 2.98) | 14 women received CC and subsequently all ovulated. Most of the men were previously investigated and treated (no further specification. | Stimulation not used | For the first 79 cycles 1 insemination, for the following 35 cycles 2 inseminations |
| Kerin 1984 | Not stated | > 3 yrs | Not stated | Not stated | Original ejaculate: Median Sperm conc 24 million/ml (Range 4‐340), Motility 26% (Range 12‐40), TMSC 17 million (1.8‐547) Inseminated preparation Sperm concentration 3.5 million/ml (range 0.8‐25), Motility 66% (55‐80), TMSC 0.78 (range 0.16‐6.1) | Not stated | Stimulation not used | One insemination |
| Kerin 1987 | < 41 yrs | > 3 yrs | Not stated | 3 | Pre‐wash: Semen conceptual cycles: 25 million/ml (mean), 30% motility, 41 % morphology, TMSC 22 million Nonconceptual cycles; 25 million /ml, 38% motility, 42 normal morphology, TMSC 28 million Washed semen conceptional cycles: 2.8 million/ml, 70% motility, 68% normal morphology, TMSC .62 million Non conceptional; 3.0 million per ml, 73% motility, 70% morphology, TMSC .72 million | Not stated | Stimulation not used | One insemination |
| Kirby 1991 | Not stated | >/= 2 yrs | Not stated | 3 | Not stated, but couples were only accepted if >100.000 motile sperm were recovered in a trial sperm washing | Not stated | Stimulation not used | One insemination |
| te Velde | Not stated | Mean 5.2 yrs (range 3‐12) for the whole group | Mixed in 88% there was primary infertility | 3 | Concentration 11.8 million (range 3‐19, motility 22% (20‐40) morphology 36% (range 24‐48) | Not stated | Stimulation not used | One insemination |
| | | | | | | | | |
| UI in NC vs TI + OH | ‐ | ‐ | ‐ | ‐ | ‐ | ‐ | ‐ | ‐ | |
| | | | | | | | | |
| IUI vs IUI + OH | Arici 1994 | Mean 33 yrs (24‐41) (For whole group) | Mean 3.5 yrs (range 1‐15) | Not stated | >/=2 | Not stated | Endocrinological or surgically correctable factors were treated, but ART not stated | CC 50 mg | IUI + NC : Double IUI + OH :Single |
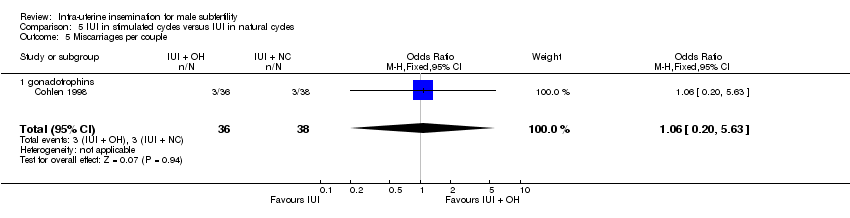
| Cohlen 1998 | Median 30.7 ys (24‐39yrs) | Mean 3.1 ys (range 2‐9 ys) | Mixed 82 % primary | 2 | Not stated for whole group | Not stated | hMG 75 IU ‐150 IU | One insemination |
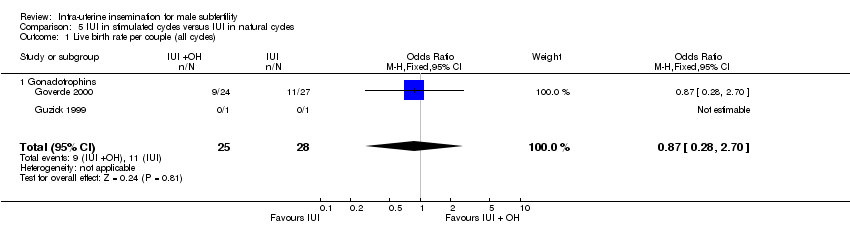
| Goverde 2000 | IUI + NC:31.6 (+/‐ 3.7) IUI+OH (31.7 (+/‐3.9) | IUI + NC : 3.9 (+/‐ 1.7 yrs) IUI + OH:4.2 ( +/‐1.9) | Mixed 86.5% primary | 5 | Not stated | Not stated | hMG 75 IU starting dose | One insemination |
| Guzick 1998 | IUI + NC: 32 yrs +/‐ 4 IUI + OH :32 yrs +/‐ 4 | IUI + NC 3.8 yrs (+/‐ 2.6) IUI + OH: 3.5 yrs (+/‐ 2.2) | Mixed 60 % primary subfertility | Not stated | For whole group: Median sperm count :IUI + NC: 41 million per ml, IUI + OH 48 million/ml , Median sperm motility (%) IUI + NC: 51, IUI+ OH 49 | No | FSH 150 IU | |
| | | | | | | | | |
| IUI+OH vs TI in NC | Aribarg 1995 | Median 25.5 yrs, range 23‐37) | Mean 3.7yrs (2‐15 ys) | Not stated | 2 | pre wash: Sperm concentration (million/ml) 10.5 +/‐5.4, Motility (%) 40.0 | Not stated | CC 100 mg | One insemination, sometimes two if ovulation had not occured after US detection) |
| Ho 1992 | Mean 32.3 yrs (SD ± 3.4 ) | Mean 4.4 yrs (SD ± 2.9) | Mixed 86.7% primary | 3 | pre‐ processing count 48.9 million/ ml ± 40.0, Motility (%) 49.6 ± 15.9, After processing Count (million/ml) 13.4 ± 14.3, motility (%) 74.9 ± 18.3 | Not stated | FSH 75 IU + LH 75 IU | One insemination, sometimes two if ovulation had not occured after US detection) |
| | | | | | | | | |
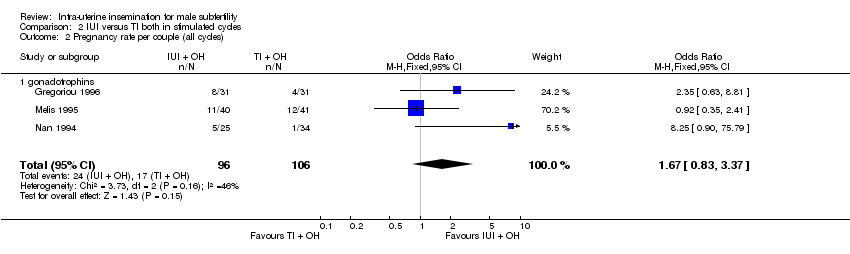
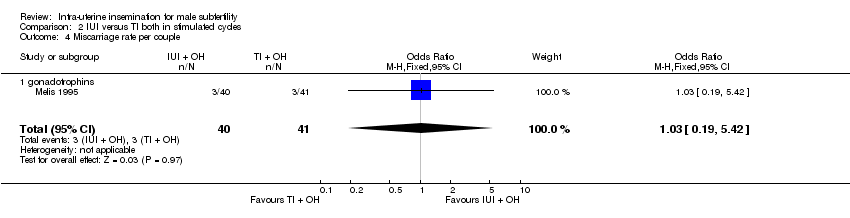
| IUI+OH vs TI + OH | Crosignani 1994 | Not stated | Not stated | Not stated | Not stated | Not stated | Not stated | Not stated | Not stated |
| Gregoriou 1996 | Mean 30.5 yrs (SD ± 2.6) | Mean 5.8 yrs ( ± 3.9) | Mixed 84% with primary infertility | 3 | Not stated | Not stated | hMG 75 IU‐150 IU | One insemination |
| Jaroudi 1998 | mean 27 ys (SD ± 3.7) | 6.5 yrs (SD ± 3) | Mixed 72% with primary infertility | 3 | Abnormal morphology 58 (SD ± 26). Average sperm count 41 million (SD ± 33), average motility was 25% (SD ± 25), | Not stated | hMG 150 IU | One insemination |
| Melis 1995 | Mean 34.2 yrs (SD ± 4.8 ) | Mean 4.3 yrs ( ± 1.2 yrs) | Not stated | 2 | Sperm count 15.0 million /ml, progressive motility 21.5%, Total motility 45.1% | All couples had undergone 3 cycles of CC associated with TI and three cycles of CC and IUI without conceiving before enrolment in this trial | FSH 225 IU | One insemination |
| Nan 1994 | Mean 32 yrs (range 24‐39) | Mean 4.5 yrs (range 2‐10) | Mixed, 80% primary | 4 | Not stated | Not stated | hMG 150 IU | One insemination |
| Martinez | Mean 33 yrs ( ± 2.9 yrs) | Mean 6.3 ys (SD ± 2.8 ys, range 3‐14 ys | Not stated. | 2 or more | Not stated | For the whole group; 27 were previously treated with IUI in either spontaneous or CC stimulated cycles and had failed to conceive. Three had received ICSI, 3,6 or 12 times, One couple had 2 cycles of GIFT | hMG 75 IU | One insemination |
| | | | | | | | | |