| 1 Perineal tear: skin or superficial tissue without compromising muscle Show forest plot | 2 | 1448 | Risk Ratio (M‐H, Fixed, 95% CI) | 1.14 [0.76, 1.71] |
|
| 2 Perineal tear: perineal muscle without anal muscles Show forest plot | 1 | 421 | Risk Ratio (M‐H, Fixed, 95% CI) | 0.72 [0.37, 1.40] |
|
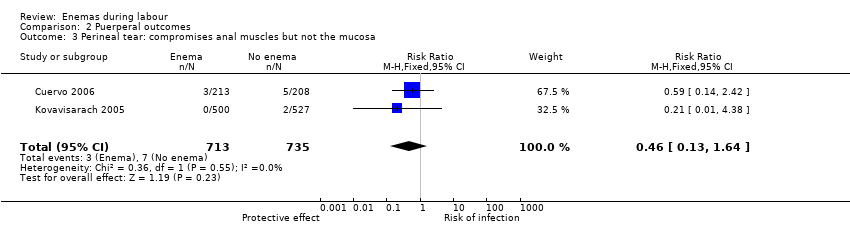
| 3 Perineal tear: compromises anal muscles but not the mucosa Show forest plot | 2 | 1448 | Risk Ratio (M‐H, Fixed, 95% CI) | 0.46 [0.13, 1.64] |
|
| 4 Perineal tear: complete tear that compromises anal mucosa Show forest plot | 1 | 421 | Risk Ratio (M‐H, Fixed, 95% CI) | 2.93 [0.12, 71.51] |
|
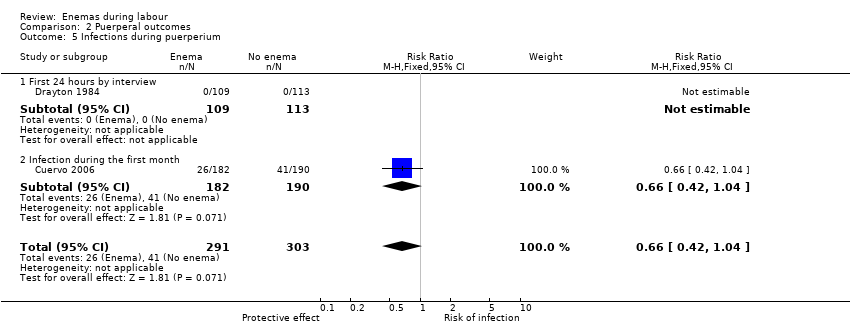
| 5 Infections during puerperium Show forest plot | 2 | 594 | Risk Ratio (M‐H, Fixed, 95% CI) | 0.66 [0.42, 1.04] |
|
| 5.1 First 24 hours by interview | 1 | 222 | Risk Ratio (M‐H, Fixed, 95% CI) | 0.0 [0.0, 0.0] |
| 5.2 Infection during the first month | 1 | 372 | Risk Ratio (M‐H, Fixed, 95% CI) | 0.66 [0.42, 1.04] |
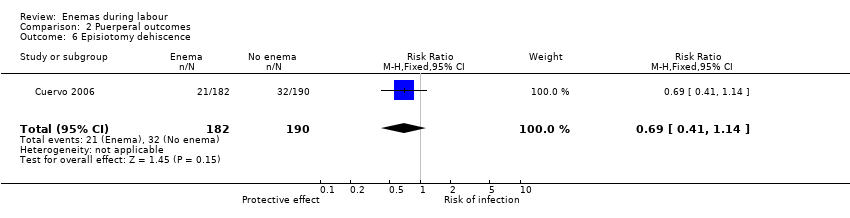
| 6 Episiotomy dehiscence Show forest plot | 1 | 372 | Risk Ratio (M‐H, Fixed, 95% CI) | 0.69 [0.41, 1.14] |
|
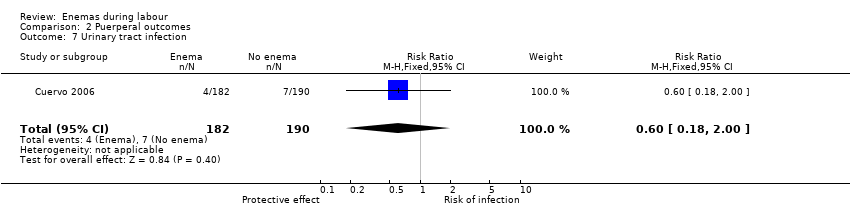
| 7 Urinary tract infection Show forest plot | 1 | 372 | Risk Ratio (M‐H, Fixed, 95% CI) | 0.60 [0.18, 2.00] |
|
| 8 Pelvic infection: infected episiotomy Show forest plot | 1 | 372 | Risk Ratio (M‐H, Fixed, 95% CI) | 0.60 [0.18, 2.00] |
|
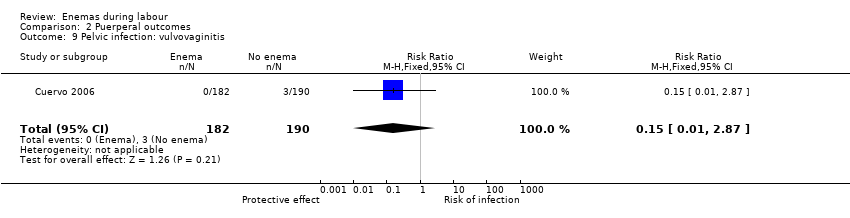
| 9 Pelvic infection: vulvovaginitis Show forest plot | 1 | 372 | Risk Ratio (M‐H, Fixed, 95% CI) | 0.15 [0.01, 2.87] |
|
| 10 Pelvic infection: endometritis Show forest plot | 1 | 372 | Risk Ratio (M‐H, Fixed, 95% CI) | 0.26 [0.03, 2.31] |
|
| 11 Pelvic infection: myometritis Show forest plot | 1 | 372 | Risk Ratio (M‐H, Fixed, 95% CI) | 3.13 [0.13, 76.37] |
|
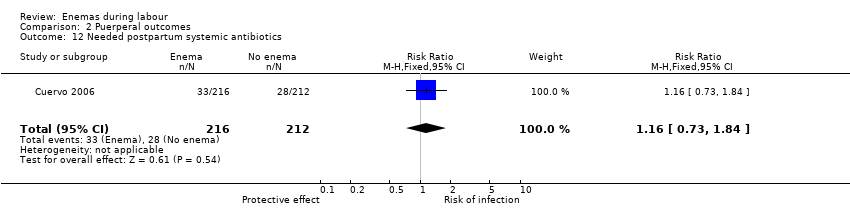
| 12 Needed postpartum systemic antibiotics Show forest plot | 1 | 428 | Risk Ratio (M‐H, Fixed, 95% CI) | 1.16 [0.73, 1.84] |
|
| 13 No episiotomy wound ‐ no further tear Show forest plot | 1 | 1027 | Risk Ratio (M‐H, Fixed, 95% CI) | 0.74 [0.43, 1.27] |
|
| 14 No episiotomy wound ‐ further tear: 1st degree tear Show forest plot | 1 | 1027 | Risk Ratio (M‐H, Fixed, 95% CI) | 1.17 [0.63, 2.19] |
|
| 15 Episiotomy wound ‐ no further tear Show forest plot | 1 | 1027 | Risk Ratio (M‐H, Fixed, 95% CI) | 1.01 [0.98, 1.05] |
|
| 16 Episiotomy wound ‐ further tear: 3rd degree tear Show forest plot | 1 | 1027 | Risk Ratio (M‐H, Fixed, 95% CI) | 0.21 [0.01, 4.38] |
|
| 17 Intrapartum infection rates Show forest plot | 1 | 152 | Risk Ratio (M‐H, Fixed, 95% CI) | 4.62 [1.03, 20.68] |
|