Planejamento de alta hospitalar
Referencias
References to studies included in this review
References to studies excluded from this review
References to ongoing studies
Additional references
References to other published versions of this review
Characteristics of studies
Characteristics of included studies [ordered by study ID]
| Methods | RCT | |
| Participants | A culturally and linguistically diverse group of patients who were admitted to hospital as an emergency, and had to have a 'medical home' defined as having an established primary care provider to be discharged to; patients were excluded if previously enrolled in the study, discharged to another institution or residing in long‐term care facility. Number of patients recruited: T = 47, C = 49 Number with diabetes: T = 12/47, C = 18/49 Number with heart failure: T = 5/47, C = 5/49 Number with COPD: T = 6/47, C = 6/49 Number with depression: T = 23/47, C = 19/49 Number of patients recruited: T = 47, C = 49 Mean age: T = 58 years, C = 54 years Sex (female): T = 27/47 (57.4%), C = 30/49 (61%) Non‐English‐speaking: T = 19/47 (40%), C = 9/49 (18.4%) | |
| Interventions | Setting: a safety net 100 bed community teaching hospital affiliated with Harvard Medical School, USA Pre‐admission assessment: no Case finding on admission: not clear Inpatient assessment and preparation of a discharge plan based on individual patient needs: A comprehensive Patient Discharge Form was provided to patients in one of 3 languages (English, Spanish and Portuguese). The form sought to identify communication problems that occur during the transition of care, including patients' lack of knowledge about their condition and any gaps in outpatient follow‐up care or follow‐up of test results. Implementation of the discharge plan: the Discharge Form was electronically transferred to the RN at the patient's primary care facility, a primary care RN contacted the patient and reviewed the Discharge Form and the medication included in the discharge‐transfer plan Monitoring phase: by primary care RN who telephoned the patient to assess their medical status, review the Patient Discharge Form, assess patient concerns and confirm scheduled follow‐up appointments. Immediate interventions were arranged as needed, and the discharge form and telephone notes were forwarded electronically to the primary care provider who reviewed the form. Control: discharged according to existing hospital practice, which consisted of receiving discharge instructions handwritten in English. Communication between the discharge physician and primary care physician was done on an as‐needed basis. | |
| Outcomes | Hospital length of stay and readmission rates Follow‐up: at 21 and 31 d | |
| Notes | 24/120 patients were excluded after randomisation. | |
| Risk of bias | ||
| Bias | Authors' judgement | Support for judgement |
| Random sequence generation (selection bias) | Unclear risk | Not described |
| Allocation concealment (selection bias) | Unclear risk | Not described |
| Blinding (performance bias and detection bias) | Low risk | Main outcome measure was readmission rates |
| Incomplete outcome data (attrition bias) | Low risk | Follow‐up data for > 80% |
| Selective reporting (reporting bias) | Unclear risk | Not able to judge from available information |
| Baseline data | High risk | Comparison at end of treatment only |
| Methods | RCT | |
| Participants | Patients recruited within 48 h of an emergency or unplanned admission to the medical admissions unit, aged ≥ 55 years and taking 3 regular drugs or more. Patients were excluded if transferred to another hospital, admitted or transferred to a nursing home, if patient or care giver was unable to communicate with pharmacist, had mental illness or alcohol‐related admission, or if home visit or follow‐up was declined on admission. Number of patients recruited: T = 119, C = 124 Mean age: T = 73 years, C = 75 years Sex (female): T = 41/119 (34%), C = 42/124 (34%) Living alone: T = 27/119, C = 34/124 | |
| Interventions | Setting: Antrim Hospital, a 426‐bed district general hospital in Northern Ireland Pre‐admission assessment: no Case finding on admission: not described Inpatient assessment and preparation of a discharge plan based on individual patient needs: use of a comprehensive medication history service, provision of an intensive clinical pharmacy service including management of patients' own drugs brought to hospital, personalised medicines record and patient counselling to explain changes at discharge. Implementation of the discharge plan: discharge letter outlining complete drug history on admission and explanation of changes to medication during hospital and variances to discharge prescription. This was faxed to GP and community pharmacist. Personalised medicine card, discharge counselling, labelling of dispensed medications under the same headings for follow‐up Monitoring: medicines helpline Control: standard clinical pharmacy service | |
| Outcomes | Patient satisfaction, knowledge of medicines, hoarding of medicines Readmissions and length of stay data not reported | |
| Notes | — | |
| Risk of bias | ||
| Bias | Authors' judgement | Support for judgement |
| Random sequence generation (selection bias) | Low risk | Computer‐generated random number |
| Allocation concealment (selection bias) | Unclear risk | Allocation concealment was not described |
| Blinding (performance bias and detection bias) | High risk | Low risk for readmission data and high risk for knowledge of medicines and GP and community pharmacists' views. |
| Incomplete outcome data (attrition bias) | High risk | Follow‐up of patients: 67% (162/243) Low response rate in survey of GPs (55% response rate) and community pharmacists (56% response rate) |
| Selective reporting (reporting bias) | Unclear risk | Not able to judge from available information |
| Baseline data | Low risk | Baseline data reported |
| Methods | RCT | |
| Participants | Patients aged ≥ 18 years, with heart failure who were prescribed ≥ 5 medicines at discharge; patients were excluded if living in a nursing home or unable to provide informed consent. Number of patients recruited: T = 41, C = 44 Mean age (SD): T = 74 (12), C = 72 (10) Sex (female): T = 14/41 (41%), C = 11/44 (25%) | |
| Interventions | Setting: Department of Cardiology in a teaching hospital in Tilburg, Netherlands Pre‐admission assessment: no Case finding on admission: not described Inpatient assessment and preparation of a discharge plan based on individual patient needs: the clinical pharmacist identified potential prescription errors in the discharge medication, developed a discharge medication list and discussed with the cardiologist. Implementation of the discharge plan: patients received verbal and written information about side effects and changes in their hospital drug therapy from a clinical pharmacist at discharge. A discharge medication list was faxed to the community pharmacy and given as written information to the patient; this contained information on dose adjustments and discontinued medications. Monitoring: not described Control: regular care, verbal and written information about their drug therapy from a nurse at hospital discharge, the prescription was made by the physician and given to the patient to give to the GP | |
| Outcomes | Adherence to medication, prescribing errors (an error in the process of prescribing) and discrepancies (a restart of a discontinued medication, discontinuation of prescribed discharge medication, use of higher or lower dose, more or less frequent use than prescribed and incorrect time of taking medication) | |
| Notes | — | |
| Risk of bias | ||
| Bias | Authors' judgement | Support for judgement |
| Random sequence generation (selection bias) | Low risk | Random number table |
| Allocation concealment (selection bias) | Unclear risk | Not described |
| Blinding (performance bias and detection bias) | Low risk | Low risk for count of prescribing errors, unclear risk for adherence |
| Incomplete outcome data (attrition bias) | Low risk | Loss to follow‐up = 2/89 |
| Selective reporting (reporting bias) | Unclear risk | Not able to judge from available information |
| Baseline data | Low risk | Majority of characteristics similar at baseline |
| Methods | RCT | |
| Participants | Patients aged ≥ 70 years and admitted with a medical condition, neurological condition, or recovering from surgery, were screened for risk factors that would prolong their hospital length of stay Number of patients recruited: T = 417, C = 418 Mean age: T = 66.6 years, C = 67.9 years | |
| Interventions | Setting: Veterans Affairs Hospital, Seattle, USA Pre‐admission assessment: no Case finding on admission: patients screened for risk factors that may prolong length of stay, increase risk of readmission, or discharge to a nursing home Inpatient assessment and preparation of a discharge plan based on individual patient needs: during discharge planning. information on support systems, living situation, finances and areas of need were obtained from the medical notes; interviews with the patient and family, and consulting with the physician and nurse Implementation of the discharge plan: discharge planning initiated on day 3 of hospital admission, and these patients were referred to a social worker. Plans were implemented with measurable goals using goal attainment scaling. Monitoring: not reported Control: received discharge planning only if referred by medical staff and usually on the 9th day of hospital admission, or not at all | |
| Outcomes | Hospital length of stay, readmission to hospital, discharge destination, health status Follow‐up at 3 months | |
| Notes | Also validated an instrument to assess high‐risk patients Intervention implemented on day 3 of hospital admission | |
| Risk of bias | ||
| Bias | Authors' judgement | Support for judgement |
| Random sequence generation (selection bias) | Unclear risk | Not described |
| Allocation concealment (selection bias) | Unclear risk | Not described |
| Blinding (performance bias and detection bias) | Low risk | Yes, for objective measures |
| Incomplete outcome data (attrition bias) | Low risk | All patients randomised accounted for at follow‐up |
| Selective reporting (reporting bias) | Unclear risk | Not able to judge from available information |
| Baseline data | Low risk | Baseline data reported |
| Methods | RCT | |
| Participants | Patients aged ≥ 18 years, English‐ or Spanish‐ speaking, admitted with diagnosis of hypertension, hyperlipidaemia, HF, coronary artery disease, MI, stroke, TIA, asthma, COPD or receiving oral anticoagulation, with life expectancy of ≥ 6 months and without cognitive impairment, dementia or severe psychiatric diagnosis Number of patients recruited: enhanced T = 314, minimum T = 315, C = 316 Mean age (SD): 61.0 (12.2) | |
| Interventions | Setting: Academic health centre, Iowa, US Pre‐admission assessment: no Case finding on admission: electronic medical records screened for eligibility, followed by patient screening Inpatient assessment and preparation of a discharge plan based on individual patient needs: patients in Minimum and Enhanced Intervention received admission medication reconciliation and pharmacist visits every 2‐3 d during inpatient stay for education Implementation of the discharge plan: patients in Minimum and Enhanced Intervention received counselling and discharge medication list; PCP and community pharmacist of patients in Enhanced Intervention received copy of care plan (6‐24 h postdischarge) with medication list and patient‐specific concerns, among others Monitoring: patients in Enhanced Intervention received call 3‐5 d postdischarge Control: medication reconciliation at admission as per hospital policy, nurse discharge counselling and discharge medication list. The discharge summary was transcribed and received in the mail by the PCP several days or weeks after discharge | |
| Outcomes | Medication appropriateness, adverse events, preventable adverse events, composite variable of combined hospital readmission, emergency department visit or unscheduled office visit. Follow‐up at 30 and 90 d postdischarge | |
| Notes | Fidelity assessment conducted to assess which intervention components were delivered | |
| Risk of bias | ||
| Bias | Authors' judgement | Support for judgement |
| Random sequence generation (selection bias) | Low risk | Statistician‐generated blinded randomisation scheme, sequentially numbered envelopes |
| Allocation concealment (selection bias) | Low risk | Unit of allocation by patient, with sealed opaque envelope |
| Blinding (performance bias and detection bias) | Unclear risk | Pharmacists unaware of patients allocation to Minimum Intervention or Enhanced Intervention until discharge; status of RAs who assessed baseline and follow‐up unclear |
| Incomplete outcome data (attrition bias) | Low risk | 9 patients lost to follow‐up (3 per group: Enhanced Intervention = 311/314; Minimum Intervention = 312/315; Control = 313/316) |
| Selective reporting (reporting bias) | Unclear risk | Some of the secondary outcomes were analysed in aggregate; however, they were also reported separately and it was possible to extract sufficient information |
| Baseline data | Low risk | Baseline data reported, similar characteristics; control group less likely to forget medication but not related with main outcome |
| Methods | RCT | |
| Participants | Patients aged ≥ 80 years, admitted to 2 internal medicine wards; excluded if admitted previously to the study wards during the study period or had scheduled admissions Number of patients recruited: T = 182, C = 186 Mean age (SD): T = 86.6 (4.2), C = 87.1 (14.1) Sex (female): T = 105 (57.7%), C = 111 (59.7%) | |
| Interventions | Setting: teaching hospital, Upsalla, Sweden Pre‐admission assessment: no Case finding on admission: no Inpatient assessment and preparation of a discharge plan based on individual patient needs: study pharmacists compiled a comprehensive list of current medications, after which they reviewed the drugs. Advice on drug selection, dosages, and monitoring needs was given to the patient's physician, who was responsible for the final decision. Patients were educated and monitored throughout the admission process Implementation of discharge plan: PCP contacted and given discharge medications, which included rationale for changes and monitoring needs for newly commenced drugs. All information was approved by ward physicians Monitoring: follow‐up telephone call to patients 2 months after discharge Control: standard care without pharmacists' involvement in the healthcare team at the ward level | |
| Outcomes | Frequency of hospital visits 12 months after (last included patient) discharge from hospital; number of readmissions, ED visits, and costs | |
| Notes | — | |
| Risk of bias | ||
| Bias | Authors' judgement | Support for judgement |
| Random sequence generation (selection bias) | Low risk | Randomisation was performed in blocks of 20 (each block contained 10 intervention and 10 control allocations) |
| Allocation concealment (selection bias) | Low risk | Block randomisation with a closed‐envelope technique. The randomisation process was performed by the clinical trials group at the Hospital Pharmacy. |
| Blinding (performance bias and detection bias) | Low risk | Objective measures of outcome using routine data. |
| Incomplete outcome data (attrition bias) | Low risk | T: 13 died before discharge and 4 withdrew; C: 14 died and 1 withdrew (< 8%) |
| Selective reporting (reporting bias) | Low risk | Main outcome is the same as reported for the trial registry (https://clinicaltrials.gov/show/NCT00661310) |
| Baseline data | Low risk | Baseline data reported |
| Methods | RCT | |
| Participants | Patients aged ≥ 60 years (later lowered to 55 to improve recruitment), admitted unexpectedly to the internal or family medicine, cardiology, or neurology departments; English‐, Spanish‐ or Mandarin‐speaking, likely to be discharged home and able to consent Number of patients recruited: T = 347, C = 352 Mean age (SD): T = 66.5 years (9.0), C = 66.0 years (9.0) Sex (female): T = 159/347 (46%), C = 145/352 (41%) | |
| Interventions | Setting: safety‐net hospital, San Francisco, USA Pre‐admission assessment: no Case finding on admission: electronic medical records screened for eligibility, followed by meeting with attending physician Inpatient assessment and preparation of a discharge plan based on individual patient needs: RN provided disease‐specific patient education either in the patient's preferred language or via a trained interpreter; motivational interviewing and coaching for engagement; written materials provided Implementation of discharge plan: from admission to discharge, with outreach visit by RN within 24 h of discharge; PCP contacted and given inpatient physicians' contact. Monitoring: NP called patients 1‐3 and 6‐10 d after discharge to assess adherence to medication, provide further education if required, help solve barriers to attending follow‐up appointments, among others Control: bedside RN's review of the discharge instructions, received by all patients. If requested by the medical team, the hospital pharmacy provided a 10 d medication supply and a social worker assisted with discharge. The admitting team was responsible for liaising with the patients' PCP | |
| Outcomes | ED visits or readmissions (30, 90 and 180 d), non‐ED ambulatory care visits, mortality (180 d) | |
| Notes | Fidelity assessment conducted to measure which intervention components were delivered. Age criterion was changed halfway from ≥ 60 to ≥ 55 years to increase the number of eligible participants. Authors provided supplementary data (readmissions and ED visits were presented as an aggregated outcome, access provided to separate outcomes) | |
| Risk of bias | ||
| Bias | Authors' judgement | Support for judgement |
| Random sequence generation (selection bias) | Low risk | Statistician‐generated randomised tables of treatment assignment in blocks of 50 for each language |
| Allocation concealment (selection bias) | Low risk | Pairs of envelopes containing the treatment assignment and labelled with the study identification number |
| Blinding (performance bias and detection bias) | Low risk | Blinded outcome assessment and objective primary outcome |
| Incomplete outcome data (attrition bias) | Low risk | Follow‐up at 180 d = 90% All drop‐outs accounted for |
| Selective reporting (reporting bias) | Low risk | Trial registration provides same primary outcomes as reported here |
| Baseline data | Low risk | Baseline data reported |
| Methods | RCT | |
| Participants | Patients admitted with CHF, who lived within the regional home care radius (60 km), were expected to be discharged to home nursing care and were not cognitively impaired Number of patients recruited: T = 92, C = 100 Mean age (SD): T = 75.5 years (10.4), C = 75.7 years (9.7) Sex (female): T = 43/92 (47%), C = 44/100 (44%) | |
| Interventions | Setting: large urban teaching hospital, Ottawa, Canada Pre‐admission assessment: no Case finding on admission: patients' notes were flagged as a signal to the primary nurse to follow a checklist for Transitional Care Inpatient assessment and preparation of a discharge plan based on individual patient needs: comprehensive discharge planning, which included hospital and community nurses working together to smooth transition from hospital to home (Transitional Care intervention); a structured evidence based protocol was used for counselling and education for heart failure self‐management (Partners in Care for Congestive Heart Failure). The protocol followed AHCPR guidelines. Home nursing visits ‐ the same number as the control group. Implementation of discharge plan: from admission to discharge, with telephone outreach within 24 h of discharge Monitoring: not reported Control: received usual care for hospital‐to‐home transfer, which involved completion of a medical history, nursing assessment form and a multidisciplinary plan. Discharge planning meetings took place weekly. A regional home care coordinator consulted with the hospital team as required. Patients received the same number of home nurse visits as the intervention group. | |
| Outcomes | Health‐related quality of life, symptom distress and functioning. Emergency room visits and readmissions at 12 weeks. | |
| Notes | — | |
| Risk of bias | ||
| Bias | Authors' judgement | Support for judgement |
| Random sequence generation (selection bias) | Low risk | Computer‐generated schedule of random numbers |
| Allocation concealment (selection bias) | Low risk | Random allocation by a research co‐ordinator |
| Blinding (performance bias and detection bias) | High risk | High risk for patient assessed outcomes Low risk for objective measure of readmission |
| Incomplete outcome data (attrition bias) | Low risk | 157/200 (81%) completed the study |
| Selective reporting (reporting bias) | Unclear risk | Not able to judge from available information |
| Baseline data | Low risk | Baseline data reported |
| Methods | RCT | |
| Participants | Patients aged ≥ 65 years admitted to 4 wards, including surgical Number of patients recruited: T = 135, C = 138 Mean age: T = 76.5 years, C = 76.6 years | |
| Interventions | Setting: hospital in suburb of Copenhagen, Denmark Pre‐admission assessment: no Case finding on admission: not reported Inpatient assessment and preparation of a discharge plan based on individual patient needs: patients had daily contact with the project nurse who discussed their illness with them and discharge arrangements Implementation of the discharge plan: there was liaison between hospital and primary care staff. Project nurse visited patients at home after discharge and could make one repeat visit. Monitoring: not reported Control: described as usual care | |
| Outcomes | Hospital length of stay, readmission to hospital, discharge destination | |
| Notes | Details of measures of outcome not provided. Translated from Danish. Intervention implemented at time of admission. | |
| Risk of bias | ||
| Bias | Authors' judgement | Support for judgement |
| Random sequence generation (selection bias) | Unclear risk | Not described |
| Allocation concealment (selection bias) | Unclear risk | Not described |
| Blinding (performance bias and detection bias) | Low risk | Yes, for objective outcome measures |
| Incomplete outcome data (attrition bias) | Unclear risk | Not described |
| Selective reporting (reporting bias) | Unclear risk | Not able to judge from available information |
| Baseline data | Low risk | Baseline data reported |
| Methods | RCT | |
| Participants | Patients who were emergency admissions to the medical teaching service and who were going to be discharged home. Participants had to have a telephone, comprehend the study details and consent process in English and have plans to be discharged to a US community. Number of participants recruited: T = 373, C = 376 Mean age (SD): T: 50.1 (15.1), C: 49.6 (15.3) Sex (female): T = 178/373 (48%), C = 200/376 ( 53%) | |
| Interventions | Setting: Large urban safety net hospital with an ethnically diverse patient population; Boston Medical Centre, Massachusetts, USA Pre‐admission assessment: no Case finding on admission: the nurse discharge advocate (DA) completed the (re‐engineered discharge) RED intervention components Inpatient assessment and preparation of a discharge plan based on individual patient needs: with information collected from the hospital team and the participant, the DA created the after‐hospital care plan (AHCP), which contained medical provider contact information, dates for appointments and tests, an appointment calendar, a colour‐coded medication schedule, a list of tests with pending results at discharge, an illustrated description of the discharge diagnosis, and information about what to do if a problem arises. Information for the AHCP was manually entered into a Microsoft Word template, printed, and spiral‐bound to produce an individualised, colour booklet Implementation of the discharge plan: the DA used scripts from the training manual to review the contents of the AHCP with the participant. On the day of discharge the AHCP and discharge summary were faxed to the primary care provider (PCP). Monitoring phase: clinical pharmacist telephoned the participants 2‐4 d after the index discharge to reinforce the discharge plan by using a scripted interview. The pharmacist had access to the AHCP and hospital discharge summary and, over several days, made at least 3 attempts to reach each participant. The pharmacist asked participants to bring their medications to the telephone to review them and address medication‐related problems; the pharmacist communicated these issues to the PCP or DA Additional information on the intervention available at www.bu.edu/fammed/projectred/index.html Control: usual care | |
| Outcomes | Readmission, patient satisfaction and cost | |
| Notes | Readmission data obtained from the authors | |
| Risk of bias | ||
| Bias | Authors' judgement | Support for judgement |
| Random sequence generation (selection bias) | Low risk | Index cards in opaque envelopes randomly arranged |
| Allocation concealment (selection bias) | Low risk | The authors state that the research assistants could not selectively choose potential participants for enrolment or predict assignment |
| Blinding (performance bias and detection bias) | Low risk | Research staff doing follow‐up telephone calls and reviewing hospital records were blinded to study group assignment |
| Incomplete outcome data (attrition bias) | Low risk | Follow‐up at 30 d > 80% Similar proportion in both groups |
| Selective reporting (reporting bias) | Unclear risk | Not able to judge from available information |
| Baseline data | Low risk | Baseline data collected at recruitment |
| Methods | RCT | |
| Participants | Elderly acute care medical patients Number of patients recruited: T = 39, C = 41 Mean age: T = 80.1 years, C = 80.5 years Sex (female): T = 19/39 (49%), C = 23/41 (56%) | |
| Interventions | Setting: 500‐bed, non‐profit acute care teaching hospital, Texas, USA Pre‐admission assessment: no Case finding on admission: not reported Inpatient assessment and preparation of a discharge plan based on individual patient needs: discharge planning emphasised communication with the patient and family. A primary nurse assessed patients' postdischarge needs. A comprehensive discharge planning protocol was developed, which included an assessment of health status, orientation level, knowledge and perception of health status, pattern of resource use, functional status, skill level, motivation, and demographic data. Implementation of the discharge plan: by the primary nurse and other members of the healthcare team. A follow‐up visit was made to assess discharge placement. Monitoring: not reported Control: care not described | |
| Outcomes | Hospital length of stay, re‐admission to hospital, discharge destination, health status | |
| Notes | Not clear when intervention implemented | |
| Risk of bias | ||
| Bias | Authors' judgement | Support for judgement |
| Random sequence generation (selection bias) | Low risk | Random number schedule described |
| Allocation concealment (selection bias) | Low risk | Allocation provided by the statistics department |
| Blinding (performance bias and detection bias) | Low risk | For objective measures of outcome |
| Incomplete outcome data (attrition bias) | Low risk | All patients randomised accounted for at follow‐up |
| Selective reporting (reporting bias) | Unclear risk | Not able to judge from available information |
| Baseline data | Low risk | Baseline data reported |
| Methods | RCT | |
| Participants | Patients hospitalised for acute coronary syndrome or acute decompensated HF, English‐ or Spanish‐speaking, expected to stay in hospital for more than 3 h, likely to be discharged home, without dementia, active psychosis, bipolar disorder or delirium, without hearing or vision impairment Number recruited: T = 423, C = 428 Mean age (SD): T = 61 years (14.4), C = 59 years (13.8) | |
| Interventions | Setting: Tertiary care academic hospitals, Nashville and Boston, US Pre‐admission assessment: no Case finding on admission: not reported Inpatient assessment and preparation of a discharge plan based on individual patient needs: at the first meeting, the pharmacist assessed the patient's understanding and needs, communicating with the treating physician if medication discrepancies were identified Implementation of the discharge plan: second meeting occurred before discharge and patient was given tailored counselling and low‐literacy adherence aids; if discharge occurred same day as enrolment, then single session was conducted for assessment and implementation of discharge plan. Monitoring: call 1‐4 d after discharge by unblinded research assistant; if outstanding needs identified, pharmacist would perform follow‐up call, liaising with in‐ and outpatient physician if necessary Control: physicians and nurses performed medication reconciliation and provided discharge counselling; medication reconciliation was facilitated by electronic records. At one of the sites there were additional features (reminders to complete a preadmission medication list and integration with order entry) | |
| Outcomes | Number of clinically important medication errors at 30 d (composite measure of preventable or ameliorable ADEs and potential ADEs due to medication discrepancies or non‐adherence); preventable or ameliorable ADEs; potential ADEs due to medication discrepancies or non‐adherence; preventable or ameliorable ADEs judged to be serious, life‐threatening, or fatal. | |
| Notes | — | |
| Risk of bias | ||
| Bias | Authors' judgement | Support for judgement |
| Random sequence generation (selection bias) | Low risk | Randomisation was stratified by study site and diagnosis, in permuted blocks of 2‐6 patients, by a computer programme that maintained allocation concealment |
| Allocation concealment (selection bias) | Low risk | One unblinded research coordinator at each site administered the randomisation, contacted study pharmacists who then delivered the intervention to eligible patients, and participated in the individualised telephone follow‐up |
| Blinding (performance bias and detection bias) | Low risk | Main outcome determined by 2 independent clinicians following standardised validated methodology |
| Incomplete outcome data (attrition bias) | Low risk | Follow‐up at 30 d for > 80%; similar % of drop‐outs in both groups |
| Selective reporting (reporting bias) | Low risk | Slight discrepancies between protocol and publication, for secondary outcomes and 1 minor inclusion criterion |
| Baseline data | Low risk | Intervention group is slightly older, groups similar other than that |
| Methods | RCT | |
| Participants | Patients admitted with COPD exacerbation with reduced pulmonary function, aged ≥ 35 years, not at terminal stages of disease Number recruited: T = 118, C = 135 Mean age (SD): T = 71 years (9), C = 71 years (9) | |
| Interventions | Setting: specialised pulmonary hospital, Slovenia Pre‐admission assessment: no Case finding on admission: not reported Inpatient assessment and preparation of a discharge plan based on individual patient needs: the discharge coordinator assessed patient and home care needs, involving both the patient and the care giver. Implementation of the discharge plan: the discharge co‐ordinator communicated the discharge plan to PCP, community nurses, and other providers of home services, as required by the patient's needs. Monitoring: phone call at 48 h postdischarge to assess adjustment process, followed by phone calls scheduled as required until a final home visit at 7‐10 d postdischarge Control: care as usual, which included routine patient education with written and verbal information about COPD, supervised inhaler use, respiratory physiotherapy as indicated, and disease related communication between medical staff with patients and their care givers. | |
| Outcomes | Number of patients hospitalised due to worsening COPD, time to COPD hospitalisation, all‐cause mortality, all‐cause hospitalisation, days alive and out of hospital, health‐related quality of life. | |
| Notes | Steering and end‐point committee closed enrolment at 83% of the planned sample due to re‐hospitalisation of patients already assessed for eligibility and seasonal variation of COPD. Information about the communication between discharge coordinators and providers of home services, including timing and frequency, was not reported in detail. The authors provided supplementary unpublished data | |
| Risk of bias | ||
| Bias | Authors' judgement | Support for judgement |
| Random sequence generation (selection bias) | Low risk | Software to generate random numbers/allocation sequence |
| Allocation concealment (selection bias) | Low risk | Allocation independent of researchers and healthcare providers |
| Blinding (performance bias and detection bias) | Low risk | Objective measure for primary outcome |
| Incomplete outcome data (attrition bias) | Low risk | Follow‐up at 180 d for > 80%; similar % of drop‐outs in both groups |
| Selective reporting (reporting bias) | Low risk | One of the secondary outcomes not reported (healthcare costs), all other outcomes reported |
| Baseline data | Low risk | Baseline data provided, no differences between groups |
| Methods | RCT | |
| Participants | Patients with confirmed congestive heart failure (CHF), who also had to be at risk for early readmission as defined by the presence of 1 or more of the following criteria: history of CHF, documented knowledge deficits of treatment plan or disease process, potential or ongoing lack of adherence to treatment plan, previous CHF hospital admission, living alone, and ≥ 4 hospitalisations in the past 5 years Number recruited: T = 141, C = 146 Mean age (SD): T = 70.6 years (11.4), C = 70.8 years (12.2) | |
| Interventions | Setting: 550‐bed academic medical centre, which serves the largely rural geographic areas of Vermont and upstate New York, USA Pre‐admission assessment: no Case finding on admission: no Inpatient assessment and preparation of a discharge plan based on individual patient needs: early discharge planning and co‐ordination of care and individualised and comprehensive patient and family education Implementation of the discharge plan: case manager (CM) assisted in the co‐ordination of care by facilitating the discharge plan and obtaining needed consultations from social services, dietary services and physical/occupational therapy. When indicated, arrangements were made for additional services or support once the patient had returned home. The CM also facilitated communication in the hospital among the patient and family, attending physician, cardiology team, and other medical care practitioners through participating in daily rounds, documenting patient needs in the medical record, submitting progress reports to the PCP, involving the patient and family in developing the plan of care, collaborating with the home health agencies and providing informational and emotional support to the patient and family. Monitoring: 12 weeks of enhanced telephone follow‐up and surveillance Control: inpatient treatments included social service evaluation (25% for usual care group), dietary consultation (15% usual care), PT/OT (17% usual care), medication and CHF education by staff nurses and any other hospital services. Postdischarge care was conducted by the patient's own local physician. The home care service figures were 44%. | |
| Outcomes | Readmissions, mortality, hospital bed days, resource use and patient satisfaction. Follow‐up at 3 months. | |
| Notes | — | |
| Risk of bias | ||
| Bias | Authors' judgement | Support for judgement |
| Random sequence generation (selection bias) | Unclear risk | Not described |
| Allocation concealment (selection bias) | Unclear risk | Not described |
| Blinding (performance bias and detection bias) | Low risk | Objective measure of the primary outcome readmission, and the secondary outcome length of stay |
| Incomplete outcome data (attrition bias) | Low risk | Loss to follow‐up: 53/287; ≥ 81% retained T = 122/141; C = 112/146 |
| Selective reporting (reporting bias) | Unclear risk | Not able to judge from available information |
| Baseline data | Low risk | Baseline data reported |
| Methods | RCT Investigators used the double consent of a Zelen randomised consent design after assessing patients for eligibility; informed consent was obtained following randomisation. | |
| Participants | Medical patients aged ≥ 70 years; patients were excluded if expected to be discharged in less than 5 d, had poor chance of 3‐month survival or were receiving palliative care Mean age (SD): T = 85.8 years (6.0); C = 86.4 years (6.3) Sex (female): T = 221/317 (70%); C = 218/348 (63%) Number of patients randomised using Zelen design: T = 528; C = 517 (total 1,045) and of these T = 317 and C = 348 participated in the RCT | |
| Interventions | Setting: 5 university‐affiliated hospitals and 1 private clinic; Paris, France Pre‐admission assessment: not possible Case finding on admission: the intervention focused on 3 risk factors: drug related problems, under‐diagnosis and untreated depression (screened with the 4‐item Geriatric Depression Scale, and if the DSM‐IV criteria were positive) and protein energy malnutrition Inpatient assessment and preparation of a discharge plan based on individual patient needs: the intervention was implemented after admission to the acute geriatric unit (AGU) and had 3 components, a comprehensive chronic medication review according to geriatric prescribing principles and which involved the patient and their care giver, education on self‐management of disease and detailed transition of care communication with outpatient health professionals and the GP. These were adapted from disease management programmes for inpatients with multiple chronic conditions. Implementation of the discharge plan: the intervention was implemented by a dedicated geriatrician in addition to the care provided by the usual geriatrician of the AGU. The dedicated geriatrician provided recommendations to the AGU geriatrician who made final decisions. GPs were contacted regarding changes in treatment. Monitoring: follow‐up by a geriatrician. Control: received standard medical care from the AGU healthcare team without involvement of the intervention‐dedicated geriatrician. AGUs are hospital units with their own physical location and structure that are specialised in the care of elderly people with acute medical disorders, including acute exacerbations of chronic diseases. AGUs implement comprehensive geriatric assessment. | |
| Outcomes | Emergency hospitalisation, emergency room visit, mortality, cost Follow‐up time: 6 months from discharge | |
| Notes | — | |
| Risk of bias | ||
| Bias | Authors' judgement | Support for judgement |
| Random sequence generation (selection bias) | Low risk | Computer‐generated randomisation scheme in various sized blocks stratified according to centre |
| Allocation concealment (selection bias) | Low risk | A central randomisation service in the trial organisation centre |
| Blinding (performance bias and detection bias) | Low risk | Objective measure of the primary outcome of readmission and secondary outcome of costs using hospital days. Data on readmission rates were verified by checking administrative databases. |
| Incomplete outcome data (attrition bias) | Low risk | Outcome data reported for all participants recruited |
| Selective reporting (reporting bias) | Unclear risk | Not able to judge from available information |
| Baseline data | Low risk | Majority of baseline characteristics similar between groups |
| Methods | RCT | |
| Participants | Patients hospitalised with a hip fracture, aged ≥ 65 years, who had a Barthel score of at least 70 points prior to their hip fracture. Number of patients recruited: T = 26; C = 24 Sex (female): 18/50 (36%) Mean age (SD): 78.8 years (7.0) | |
| Interventions | Setting: 4 orthopaedic wards in a 2800 bed medical centre in Taipei, Taiwan Pre‐admission assessment: no Case finding on admission: no Inpatient assessment and preparation of a discharge plan based on individual patient needs: structured assessment of discharge planning needs within 48h of admission; systematic individualised nursing instruction based on the individual's needs. Implementation of the discharge plan: nurses coordinated resources and arranged referral placements. 2 postdischarge home visits were conducted to provide support and consultation Monitoring: nurses monitored services Control: non‐structured discharge planning provided by nurses who used their professional judgement. | |
| Outcomes | Hospital length of stay, readmission, functional status, quality of life, patient satisfaction at 2 weeks and 3 months postdischarge | |
| Notes | — | |
| Risk of bias | ||
| Bias | Authors' judgement | Support for judgement |
| Random sequence generation (selection bias) | Unclear risk | Patients were assigned to 1 of 4 wards: 2 were designated the intervention group and 2 the control. The sequence generation of random assignment was not described. |
| Allocation concealment (selection bias) | Unclear risk | Patients were assigned to 1 of 4 wards "by doctors who were not aware of the study process." |
| Blinding (performance bias and detection bias) | Unclear risk | Blinding of researchers conducted follow‐up assessments is not described. |
| Incomplete outcome data (attrition bias) | Low risk | Data collected on all recruited patients |
| Selective reporting (reporting bias) | Unclear risk | Not able to judge from available information |
| Baseline data | Low risk | Similar characteristics at baseline |
| Methods | Pilot RCT | |
| Participants | Patients aged ≥ 18 years, taking oral anticoagulation or newly ordered insulin or more than 8 regular medicines or new diagnosis requiring at least 4 long‐term medicines, expected to live > 1 month, German‐speaking, no cognitive impairment; excluded if PCP or local visiting nurse association not involved in the study Number of patients recruited: T = 30, C = 30 Mean age (SD): T = 75.1 years (9.49), C = 75.2 (12.4) Sex (female): T = 15/30 (50%), C = 19/30 (63%) | |
| Interventions | Setting: teaching hospital in Baden, Switzerland Pre‐admission assessment: no Case finding on admission: all patients admitted to hospital were screened for eligibility Inpatient assessment and preparation of a discharge plan based on individual patient needs: the nurse care manager assessed patients with a battery of tests Implementation of the discharge plan: the NCM liaised with the ward team and jointly developed a discharge plan, which included self‐management techniques; the PCP and community nursing team received a copy of the discharge form, as well as a letter at the end of the intervention, and further contacts were done as needed Monitoring: structured call 24 h postdischarge and home visit at the end of the intervention Control: best usual care (no additional information provided) | |
| Outcomes | Composite endpoint (death, rehospitalisation, unplanned urgent medical evaluation within 5 d of discharge, and adverse medicine reaction requiring discontinuation of the medicine), satisfaction with discharge process, care giver burden, health‐related quality of life | |
| Notes | Pilot study; insufficient data to be included in the pooled analysis, authors contacted but no further data obtained | |
| Risk of bias | ||
| Bias | Authors' judgement | Support for judgement |
| Random sequence generation (selection bias) | Low risk | Block randomisation |
| Allocation concealment (selection bias) | Unclear risk | Not reported |
| Blinding (performance bias and detection bias) | High risk | Interview‐based data (patients, nurses, and PCP) |
| Incomplete outcome data (attrition bias) | Low risk | Drop‐outs accounted for |
| Selective reporting (reporting bias) | Unclear risk | Not able to judge from available information |
| Baseline data | High risk | Baseline data provided; patients in treatment group had higher comorbidity (T = 3.2 ± 2.29, C = 2.5 ± 2.45) |
| Methods | RCT | |
| Participants | Patients admitted to a general medical clinic, excluded if admitted to intensive care unit or not expected to survive for more than 48 h Number of patients recruited: T = 136, C = 131 Mean age: T = 66.3 years, C = 64.3 years Sex (female): T = 73/136 (54%), C = 72/131 (55%) | |
| Interventions | Setting: 2 clinical teaching units, Ottawa, Canada Pre‐admission assessment: no Case finding on admission: no Inpatient assessment and preparation of a discharge plan based on individual patient needs: a nurse employed as a team co‐ordinator acted as a liaison between members of the medical team and collected patient information Implementation of the discharge plan: the nurse facilitated discharge planning Monitoring: not reported Control: standard medical care | |
| Outcomes | Hospital length of stay, readmission to hospital, discharge destination, patient satisfaction | |
| Notes | Baseline data recorded only on age, sex, diagnosis Not clear when intervention implemented | |
| Risk of bias | ||
| Bias | Authors' judgement | Support for judgement |
| Random sequence generation (selection bias) | Low risk | Computer‐generated blocks |
| Allocation concealment (selection bias) | Unclear risk | Allocation procedure not described |
| Blinding (performance bias and detection bias) | Low risk | Yes for objective measures of outcome |
| Incomplete outcome data (attrition bias) | Low risk | All patients randomised accounted for at follow‐up |
| Selective reporting (reporting bias) | Unclear risk | Not able to judge from available information |
| Baseline data | Low risk | Baseline data reported |
| Methods | RCT | |
| Participants | Patients admitted to an acute psychiatric ward; patients were excluded if previously admitted, too ill, not registered with a GP or had no fixed address. Number of patients recruited: T = 168, C = 175 Mean age (SD): T = 40 (12), C = 41 (12.8) Sex (female): T = 83/168 (49%), C = 80/175 (46%) | |
| Interventions | Setting: Acute psychiatric wards, Aberdeen, Scotland Pre admission assessment: no Case finding on admission: no Inpatient assessment and preparation of a discharge plan based on individual patient need: not clear Implementation of the discharge plan: psychiatrist telephoned GP to discuss patient and make an appointment for the patient to see the GP within 1 week following discharge. A copy of the discharge summary was given to the patient to hand‐deliver to the GP. A copy was also sent by post. Monitoring: no Control: received standard care, patients advised to make an appointment to see their GP and were given a copy of the discharge summary to hand‐deliver to the GP | |
| Outcomes | Readmission, mental health status, discharge process, cost. Follow‐up at 1 month for patient assessed outcomes, 6 months for readmissions | |
| Notes | — | |
| Risk of bias | ||
| Bias | Authors' judgement | Support for judgement |
| Random sequence generation (selection bias) | Low risk | Independent computer programme |
| Allocation concealment (selection bias) | Low risk | Independent to researchers |
| Blinding (performance bias and detection bias) | Low risk | Objective measures used for readmission, consultations and length of stay. Validated standardised patient assessed outcomes also measured. |
| Incomplete outcome data (attrition bias) | Unclear risk | Less than 80% for patient assessed: 1 month completion T = 106/168 (63%), C = 111/175 (63%) |
| Selective reporting (reporting bias) | Unclear risk | Not able to judge from available information |
| Baseline data | Low risk | Baseline data collected on day of discharge: baseline completion T = 132/168 (79%), C = 133/175 (76%) |
| Methods | RCT | |
| Participants | Patients aged ≥ 70 years admitted from emergency department who were not receiving regular care from an attending internist on staff; patients were excluded if admitted to intensive care unit or surgical ward. Number of patients recruited: T = 51, C = 60 Mean age (SD): T = 80.1 years (6.6), C = 80.1 years (6.4) Sex (female): T = 25/51 (49%), C = 38/60 (63%) | |
| Interventions | Setting: private, non‐profit, academic medical centre, Chicago, USA Pre‐admission assessment: no Case finding on admission: not clear Inpatient assessment and preparation of a discharge plan based on individual patient needs: A geriatric evaluation and management team (GEM) assessed the patients' mental and physical health status and psychosocial condition to determine level of rehabilitation required and social needs. A geriatrician and social worker were the core team members. Implementation of the discharge plan: team meetings with the GEM and nurse specialist and physical therapist took place twice a week to discuss patients' medical condition, living situation, family and social supports, and patient and family's understanding of the patient's condition. The social worker was responsible for identifying and co‐ordinating community resources and ensuring the posthospital treatment place was in place at the time of discharge and 2 weeks later. The nurse specialist co‐ordinated the transfer to home healthcare. Patients who did not have a primary care provider received outpatient care at the hospital. Monitoring: not reported Control: received 'usual care' by medical house staff and an attending physician. Social workers and discharge planners were available on request. | |
| Outcomes | Hospital length of stay, discharge destination, health service costs | |
| Notes | Intervention implemented at time of admission | |
| Risk of bias | ||
| Bias | Authors' judgement | Support for judgement |
| Random sequence generation (selection bias) | Low risk | Card indicating assignment to the intervention or control group were placed sequentially in opaque sealed envelopes |
| Allocation concealment (selection bias) | Low risk | Sealed envelopes provided by admitting clerk |
| Blinding (performance bias and detection bias) | Low risk | Yes for objective measures of outcome |
| Incomplete outcome data (attrition bias) | Low risk | 141 patients initially randomised, of these 25 were ineligible and 5 were transferred to surgical services, leaving 111 to be analysed |
| Selective reporting (reporting bias) | Unclear risk | Not able to judge from available information |
| Baseline data | Low risk | Baseline data reported |
| Methods | RCT | |
| Participants | Patients aged ≥ 70 years, admitted to medical ward and cardiac surgery, English‐speaking, alert and orientated at admission, and able to use telephone after discharge Number of patients recruited: T = 140, C = 136 Mean age (SD): 76 years | |
| Interventions | Setting: Hospital of the University of Pennsylvania, USA Pre‐admission assessment: no Case finding on admission: not clear Inpatient assessment and preparation of a discharge plan based on individual patient needs: the discharge plan included a comprehensive assessment of the needs of the elderly patient and their care giver, an education component for the patient and family and interdisciplinary communication regarding discharge status Implementation of the discharge plan: implemented by geriatric nurse specialist and extended from admission to 2 weeks postdischarge with ongoing evaluation of the effectiveness of the discharge plan Monitoring: not reported Control: received the routine discharge planning available in the hospital | |
| Outcomes | Hospital length of stay, readmission to hospital, health status, health service costs | |
| Notes | Intervention implemented at time of admission | |
| Risk of bias | ||
| Bias | Authors' judgement | Support for judgement |
| Random sequence generation (selection bias) | Unclear risk | Not described |
| Allocation concealment (selection bias) | Unclear risk | Not described |
| Blinding (performance bias and detection bias) | Low risk | Yes, for objective measures |
| Incomplete outcome data (attrition bias) | Low risk | All patients included in the final sample accounted for |
| Selective reporting (reporting bias) | Unclear risk | Not able to judge from available information |
| Baseline data | Low risk | Baseline data reported |
| Methods | RCT | |
| Participants | Patients aged ≥ 75 years, on 4 or more medicines who were discharged from 3 acute wards and 1 long‐stay ward. Each patient had a mean of 3 chronic medical conditions, and was on a mean of 6 drugs (SD 2) at discharge. Number of patients recruited: T = 181, C = 181 Mean age (SD): 84 years (5.2) Sex (female): T = 112/181 (62%), C = 119/181 (66%) | |
| Interventions | Setting: Three acute and one long‐stay hospital, London, UK Pre‐admission assessment: no Case finding on admission: not clear Inpatient assessment and preparation of a discharge plan based on individual patient needs: a hospital pharmacist assessed patients' medication, rationalised the drug treatment, provided information and liaised with care giver and community professionals. An aim was to optimise communication between secondary and primary care professionals. Follow‐up visit by community hospital at 7‐14 d after discharge to check medication and intervene if necessary. Subsequent visits arranged if appropriate. Implementation of the discharge plan: a copy of the discharge plan was given to the patient, care giver, community pharmacist and GP Monitoring: follow‐up in the community by a pharmacist Control: discharged from hospital following standard procedures, which included a letter of discharge to the GP. The pharmacist did not provide a review of medications or follow‐up in the community | |
| Outcomes | Hospital readmission, mortality, quality of life, client satisfaction, knowledge and adherence to prescribed drugs, consultation with GP | |
| Notes | — | |
| Risk of bias | ||
| Bias | Authors' judgement | Support for judgement |
| Random sequence generation (selection bias) | Low risk | Computer generated random numbers |
| Allocation concealment (selection bias) | Low risk | Allocation by independent pharmacist at the health authority's central community pharmacy office |
| Blinding (performance bias and detection bias) | Low risk | Blinding of objective outcomes |
| Incomplete outcome data (attrition bias) | Low risk | At each follow‐up time the number of deaths and readmissions were accounted for. 2 control patients moved away prior to 6‐month follow‐up |
| Selective reporting (reporting bias) | Unclear risk | Not able to judge from available information |
| Baseline data | Low risk | Baseline data reported |
| Methods | RCT | |
| Participants | Patients aged ≥ 65, hospitalised for falling and able to return home; excluded if cognitively impaired (MM < 24), did not have a phone, lived further away than 30 km, or if the falls were secondary to cardiac, neurologic, vascular, or therapeutic problems. Number recruited: T = 30, C = 30 Age (SD): T = 83.5 years (9.1), C = 82.9 years (6.3) Sex (female): T = 23/30 (76%), C = 24/30 (80%) | |
| Interventions | Setting: acute geriatric department in les Bateliers Hospital; Lille, France Pre‐admission assessment: no Case finding on admission: all admitted patients during the trial period were screened for inclusion and exclusion criteria. Baseline information obtained at beginning of hospitalisation. Inpatient assessment and preparation of a discharge plan based on individual patient needs: 2 h home visit by occupational therapist and a physical medicine/rehabilitation doctor to evaluate patient abilities in home environment ‐ ADL, IADL, transfers, mobility and environmental hazards. Enabled observation of patient in real conditions of life. Social supports addressed by social worker. Implementation of the discharge plan: modification of home hazards and safety advice in home situation, adaptation of recommendations and prescriptions, particularly for physical therapy, speedy evaluation of technical aids and social supports needed Monitoring: telephone follow‐up was conducted by an occupational therapist to check if the home modifications were completed and assist if necessary Control: received physical therapy and were informed of home safety and social assistance if required. No home visit. | |
| Outcomes | Functional status, falls, readmissions, mortality and residential care at 6 and 12 months | |
| Notes | Intervention includes pre‐discharge home visits | |
| Risk of bias | ||
| Bias | Authors' judgement | Support for judgement |
| Random sequence generation (selection bias) | Low risk | Random number table |
| Allocation concealment (selection bias) | Unclear risk | Not described |
| Blinding (performance bias and detection bias) | Low risk | For objective measure of outcome only (readmission and mortality) |
| Incomplete outcome data (attrition bias) | Low risk | All patients randomised accounted for at follow‐up |
| Selective reporting (reporting bias) | Unclear risk | Not able to judge from available information |
| Baseline data | Unclear risk | Baseline data reported |
| Methods | RCT | |
| Participants | Medical and surgical patients, excluded if admitted for short stay or into units with their own discharge process, previously enrolled in the study, confused or intoxicated, and ≥ 85 years. Number of patients recruited: hospital A: T = 421, C = 420; hospital B: T = 375, C = 384 Mean age (SD): hospital A: T = 53 years (19), C = 53 years (18); hospital B: T = 56 years (18), C = 56 years (18) Sex (female): hospital A: T = 188/421 (45%), C = 184/420 (44%); hospital B: T = 217/374 (58%), C = 210/384 (55%) | |
| Interventions | Setting: 2 academic hospitals, Newfoundland, Canada Pre‐admission assessment: no Case finding on admission: developed a questionnaire to identify patients requiring discharge planning Inpatient assessment and preparation of a discharge plan based on individual patient needs: assessment was based on the questionnaire which covered the patient's social circumstances at home; if the admission was an emergency admission or a readmission; the use of allied health and community services; mobility and activities of daily living; medical or surgical condition Implementation of the discharge plan: referrals to allied health professionals following completion of the questionnaire for discharge planning Monitoring: not reported Control: did not receive the questionnaire; discharge planning occurred if the discharge planning nurses identified a patient or received a referral | |
| Outcomes | Hospital length of stay at 6 and 12 months | |
| Notes | Also validated an instrument to assess high‐risk patients Intervention implemented at time of admission | |
| Risk of bias | ||
| Bias | Authors' judgement | Support for judgement |
| Random sequence generation (selection bias) | Unclear risk | Not described |
| Allocation concealment (selection bias) | Low risk | Sealed envelopes |
| Blinding (performance bias and detection bias) | Low risk | Yes for objective measures of outcome |
| Incomplete outcome data (attrition bias) | Low risk | All patients randomised accounted for at follow‐up |
| Selective reporting (reporting bias) | Unclear risk | Not able to judge from available information |
| Baseline data | Low risk | Baseline data reported |
| Methods | RCT | |
| Participants | Patients with chronic obstructive pulmonary disease, cardiovascular disease, or both; patients had to be registered with a PCP and have at least two community care providers. Number of patients recruited: T = 91, C = 98 Mean age (SD): T = 74.8years (6.7), C = 75.4 (7.9) years Sex: (female): T = 57/91 (62%), C = 58/98 (59%) | |
| Interventions | Setting: 2 tertiary hospitals in Western Australia Pre‐admission assessment: no Case finding on admission: no Inpatient assessment and preparation of a discharge plan based on individual patient needs: Discharge planning was based on the Australian Enhanced Primary Care Initiative and tailored to each patient. The discharge plan was developed 24‐48 h prior to discharge. Problems were identified from hospital notes and patient/care giver consultation, goals were developed and agreed upon with the patient/care giver based on personal circumstances, and interventions and community service providers were identified who met patient needs and who were accessible and agreeable to the patient. Implementation of the discharge plan: the discharge plan was faxed to the GP and consultation with the GP was scheduled within 7 d postdischarge. Copies faxed to all service providers identified on the care plan. Monitoring: research nurse followed up if GP did not respond in 24 h and the GP scheduled a consultation (within 7 d postdischarge) for patient review Control: patients were discharged under the hospitals' existing processes following standard practice of Western Australia, where all patients have a discharge summary completed, which is copied to their GP | |
| Outcomes | SF‐12, patient satisfaction and views of the discharge process and GP views of the discharge planning process at 7 d postdischarge | |
| Notes | — | |
| Risk of bias | ||
| Bias | Authors' judgement | Support for judgement |
| Random sequence generation (selection bias) | Unclear risk | Not described |
| Allocation concealment (selection bias) | Low risk | Described as an "allocation concealment technique" |
| Blinding (performance bias and detection bias) | High risk | Blinding for objective measures of outcome |
| Incomplete outcome data (attrition bias) | Low risk | 61/189 patients did not return surveys (32% drop‐out), GP 70.4% response rate at 7 d postdischarge |
| Selective reporting (reporting bias) | Unclear risk | Not able to judge from available information |
| Baseline data | Low risk | At discharge from hospital |
| Methods | RCT | |
| Participants | Patients aged 70 years, with CHF; patients were excluded if at low risk, resided outside the catchment area, discharged to a nursing home or long‐term care facility, had other illnesses likely to result in readmission, denied consent, or other logistic reasons. Number of patients recruited: T = 63, C = 35 Mean age (SD): T = 80.0 years (6.3), C = 77.3 years (6.1) Sex (female): T = 38/63 (60%), C = 20/35 (57%) Ethnicity: number white T = 29/63, C = 20/35 | |
| Interventions | Setting: Jewish Hospital at Washington University Medical Centre, USA Pre‐admission assessment: yes Case finding on admission: screened for CHF and stratified into readmission risk categories Inpatient assessment and preparation of a discharge plan based on individual patient needs: patients were visited daily by RN to discuss CHF using a booklet developed for the trial and assess and discuss medications, providing a medication card with timing and dosing of all drugs; dietary advice was provided by dietician and study nurse, and patients were given a low‐sodium diet. Implementation of the discharge plan: a social care worker and member of the home care team met with patient to facilitate discharge planning and ease transition. Economic, social and transport problems were identified and managed. The home care nurse visited the patient at home within 48 h of hospital discharge and then 3 times in the first week and at regular intervals thereafter; at each visit the teaching materials, medication, and diet and activity guidelines were reinforced, and any new problems were discussed. Monitoring: Study nurse contacted patients by phone, and patients were encouraged to call researchers or personal physician with any new problems or questions. Control: all conventional treatments as requested by the patient's attending physician. These included social service evaluation, dietary and medical teaching, home care and all other available hospital services. Control group received study education materials and formal assessment of medications. The social service consultations and home care referrals were lower (29% versus 34%). | |
| Outcomes | Length of stay, readmission to hospital, readmission days quality of life, cost at 3 months follow‐up | |
| Notes | — | |
| Risk of bias | ||
| Bias | Authors' judgement | Support for judgement |
| Random sequence generation (selection bias) | Low risk | 2:1 treatment:control allocated |
| Allocation concealment (selection bias) | Unclear risk | Not described |
| Blinding (performance bias and detection bias) | Low risk | For objective measures of outcome (readmission, mortality) |
| Incomplete outcome data (attrition bias) | Low risk | All patients randomised accounted for at follow‐up |
| Selective reporting (reporting bias) | Unclear risk | Not able to judge from available information |
| Baseline data | Low risk | Baseline data reported |
| Methods | RCT | |
| Participants | Patients aged ≥ 70 years, with confirmed heart failure and at least 1 of the following risk factors for early readmission: prior history of heart failure, 4 or more hospitalisations in the preceding 5 years, congestive heart failure precipitated by acute MI or uncontrolled hypertension. Patients were excluded if resided outside catchment area, planned discharge to a long‐term care facility, severe dementia or psychiatric illness, life expectancy of less than 3 months, refused to participate or other logistic reasons. Number recruited: T = 142, C = 140 Mean age (SD): T = 80.1 years (5,9), C = 78.4 years (6.1) Sex (female): T = 96/142 (68%), C = 83/140 (59%) Ethnicity: non‐white 55% Living alone: T = 58/142 (41%), C = 62/140 (44%) | |
| Interventions | Setting: Jewish Hospital at Washington University Medical Centre, US Pre‐admission assessment: no Case finding on admission: yes Inpatient assessment and preparation of a discharge plan based on individual patient needs: included using a teaching booklet, individualised dietary assessment and instruction by a dietician with reinforcement by the cardiovascular research nurse, consultation with social services to facilitate discharge planning and care after discharge, assessment of medications by geriatric cardiologist, intensive follow‐up after discharge though the hospital's home care services, plus individualised home visits and telephone contact with the study team. Implementation of the discharge plan: with social services Monitoring: not clear Control: received all standard treatment and services ordered by their primary physicians | |
| Outcomes | Mortality, readmission to hospital, quality of life, cost at 3 months follow‐up. Quality of life and cost data were collected from a subgroup of patients only: quality of life = 126, cost = 57 | |
| Notes | — | |
| Risk of bias | ||
| Bias | Authors' judgement | Support for judgement |
| Random sequence generation (selection bias) | Low risk | Computer‐generated list of random numbers |
| Allocation concealment (selection bias) | Low risk | Neither patient nor members of the study team were aware of the treatment assignment until after randomisation |
| Blinding (performance bias and detection bias) | Low risk | For objective measures of outcome (mortality, readmissions and death) |
| Incomplete outcome data (attrition bias) | Low risk | All patients randomised accounted for at follow‐up |
| Selective reporting (reporting bias) | Unclear risk | Not able to judge from available information |
| Baseline data | Low risk | Baseline data reported |
| Methods | RCT | |
| Participants | Patients discharged from a psychiatric hospital or care of the elderly ward;patients were excluded if they were prescribed medication at discharge, received a primary diagnosis of drug or alcohol abuse or dementia, and refused home visits after discharge. Number of patients recruited: T = 51, C = 46 Mean age (SD): 47 (17) Sex (female): 61 (63%) | |
| Interventions | Setting: psychiatric hospital in South Glasgow, Scotland Pre‐admission assessment: no Case finding on admission: no Inpatient assessment and preparation of a discharge plan based on individual patient needs: pre‐discharge assessment with a pharmacy checklist which assessed patient's knowledge and identified particular problems, such as therapeutic drug monitoring, compliance aid requirements and side effects Implementation of the discharge plan: a pharmacy discharge plan was supplied to the patients' community pharmacist for the intervention group Monitoring: not clear Control: care not described | |
| Outcomes | Readmission to hospital, readmission due to non‐compliance, medication problems after being discharged from hospital | |
| Notes | — | |
| Risk of bias | ||
| Bias | Authors' judgement | Support for judgement |
| Random sequence generation (selection bias) | Low risk | Table of generated numbers with a randomised permuted block size of 6 |
| Allocation concealment (selection bias) | Low risk | Randomisation by the project pharmacist |
| Blinding (performance bias and detection bias) | High risk | Not possible to blind patients |
| Incomplete outcome data (attrition bias) | Unclear risk | > 30% attrition at 12 weeks |
| Selective reporting (reporting bias) | Unclear risk | Not able to judge from available information |
| Baseline data | Low risk | Baseline data reported |
| Methods | RCT | |
| Participants | Patients admitted to the acute stroke unit and receiving rehabilitation, with persistent impairment and functional limitations. Patients were excluded if they had mild deficits or premorbid physical or cognitive disability Number recruited: integrated care pathway (ICP) = 76, multidisciplinary team (MDT) = 76 Mean age (SD): ICP = 75 (11) years, MDT = 74 (10) years | |
| Interventions | Setting: stroke rehabilitation unit at a teaching hospital in London, UK Pre‐admission assessment: no Case finding on admission: no Inpatient assessment and preparation of a discharge plan based on individual patient needs: rehabilitation and discharge planning, with regular review of discharge plan Implementation of the discharge plan: senior nurse implemented the ICP. Multidisciplinary training preceded implementation of the ICP. ICP was piloted for 3 months prior to recruitment to the trial. Monitoring: not reported Control: multidisciplinary model of care in which patients' progress determined goal setting, rather than short term goals being determined in advance. The care received by the control group was reviewed and a 3‐month period of implementation was undertaken to exclude bias caused by a placebo effect of undertaking the trial. Groups received comparable amounts of physiotherapy and occupational therapy. | |
| Outcomes | Hospital length of stay, discharge destination, mortality at 26 weeks, mortality or institutionalisation, activities of daily living index, anxiety and depression, quality of life | |
| Notes | — | |
| Risk of bias | ||
| Bias | Authors' judgement | Support for judgement |
| Random sequence generation (selection bias) | Low risk | Computer‐generated list of randomised numbers |
| Allocation concealment (selection bias) | Low risk | Randomisation office allocated patients to intervention or control |
| Blinding (performance bias and detection bias) | Low risk | Participants and health professionals aware of allocation group; low risk for objective outcomes (readmission, mortality and length of stay) |
| Incomplete outcome data (attrition bias) | Low risk | All patients randomised accounted for at follow‐up |
| Selective reporting (reporting bias) | Unclear risk | Not able to judge from available information |
| Baseline data | Low risk | Baseline data reported |
| Methods | RCT | |
| Participants | Patients with diabetes mellitus, HF, COPD; patients were excluded if already receiving care at a primary care clinic, residing or being discharged to nursing home, admitted for surgical procedure or cancer diagnosis, if cognitively impaired and had no care giver, and if had no access to a telephone. Number of patients recruited: T = 695, C = 701 Mean age (SD): T = 63.0 years (11.1), C = 62.6 years (10.9) Sex (female): T = 7/695 (1%), 14/701 (2%) | |
| Interventions | Setting: 9 Veterans Affairs hospitals, USA Pre‐admission assessment: no Case finding on admission: no Inpatient assessment and preparation of a discharge plan based on individual patient needs: 3 d before discharge a primary nurse assessed the patient's postdischarge needs. 2 d before discharge the primary care physician visited the patient and discussed patient's discharge plan with the hospital physician and reviewed the patient. Primary nurse made an appointment for the patient to visit the primary care clinic within 1 week of discharge. Implementation of the discharge plan: patient provided with education materials and given a card with the names and beeper numbers of the primary care nurse and physician. Primary care nurse telephoned the patient within 2 working days after discharge. Primary care physician and primary nurse reviewed and updated the treatment plan at the 1st postdischarge appointment. Monitoring: not reported Control: did not have access to the primary care nurse and received no supplementary education or assessment of needs beyond usual care | |
| Outcomes | Readmission to hospital, health status, patient satisfaction, intensity of primary care | |
| Notes | Discharge planning within 3 d of discharge | |
| Risk of bias | ||
| Bias | Authors' judgement | Support for judgement |
| Random sequence generation (selection bias) | Low risk | Produced by statistical coordinating centre |
| Allocation concealment (selection bias) | Low risk | Allocation made by telephoning the statistical coordinating centre |
| Blinding (performance bias and detection bias) | Low risk | Objective measures of outcome and telephone interviews |
| Incomplete outcome data (attrition bias) | Low risk | All patients randomised accounted for at follow‐up |
| Selective reporting (reporting bias) | Unclear risk | Not able to judge from available information |
| Baseline data | Low risk | Baseline data reported |
ADE: adverse drug event; ADL: activities of daily living; AGU: acute geriatric unit; AHCP: after‐hospital care plan; AHCPR: Agency for Health Care Policy and Research; C: control; CHF: congestive heart failure; CM: case manager; COPD: chronic obstructive pulmonary disease; DA: discharge advocate; DC: discharge coordinator; DSM: Diagnostic and Statistical Manual of Mental Disorders; ED: emergency department; GEM: geriatric evaluation and management team; GP: general practitioner; HF: heart failure; IADL: instrumental activities of daily living; ICP: integrated care pathway; MDT: Multidisciplinary team; MI: myocardial infarction; MM: mini‐mental assessment; NCM: nurse care manager; NP: Nurse practitioner; OT: occupational therapist; PCP: primary care provider; PO: Primary outcome; PT: physiotherapist; RA: research assistant; RCT: randomised controlled trial; RED: re‐engineered discharge; RN: registered nurse; SD: standard deviation; T: treatment; TIA: transient Ischaemic attack.
Characteristics of excluded studies [ordered by study ID]
| Study | Reason for exclusion |
| RCT: discharge planning plus geriatric assessment unit | |
| Discharge planning plus home care package | |
| Discharge planning plus home care package plus counselling | |
| Early postpartum hospital discharge | |
| Intervention: discharge planning plus home care package | |
| Intervention: clinical pathway for patients with a fractured neck of femur, discharge planning is not described | |
| Intervention is focused on decreasing the number of emergency room visits, not discharge planning | |
| Intervention discharge planning plus postdischarge care package | |
| Intervention is focused on telephone follow‐up, not discharge planning. Randomised to groups after discharge from hospital. | |
| Transitional care intervention; the only element of discharge planning was primary care‐medical home linkage | |
| RCT: consultative geriatric assessment and limited follow‐up | |
| RCT: consultative inpatient multidisciplinary team care | |
| Controlled trial: inpatient geriatric consultation team | |
| Geriatric assessment and intervention team | |
| Hospital‐based case management team for neonatal intensive care | |
| Control group given the same manual as intervention group at discharge | |
| Study design not clear | |
| RCT: follow‐up home visits | |
| Patients in the intervention group received discharge planning from a nurse case manager, patients in the control group received discharge planning on request | |
| Controlled trial of geriatric consultation team and follow‐up after discharge | |
| RCT: discharge teaching book | |
| Discharge planning plus geriatric assessment unit | |
| Intervention and control groups received discharge planning, the intervention group also received a discharge planning questionnaire | |
| Nested cohort study of postdischarge follow‐up | |
| Special unit plus rehabilitation | |
| 1. Multidimensional intervention, based on the transitional care model 2. Control group also received discharge planning | |
| Medication review only, not discharge planning | |
| RCT of discharge planning plus hospital at home | |
| Intervention was standardised to all patients; no individual assessment done | |
| Assessed primary nursing and discharge teaching | |
| Both groups received discharge planning, intervention group also received GP input to discharge planning process | |
| Postdischarge care | |
| RCT (secondary analysis); in‐home primary care | |
| Postdischarge care | |
| Controlled trial; communication between hospital and home | |
| RCT. Discharge planning and home follow‐up. | |
| Complex package of care; main emphasis was not on discharge planning | |
| No results reported for the control group | |
| Pilot study for comprehensive geriatric assessment | |
| RCT of comprehensive geriatric assessment in HMO setting | |
| Pilot study of discharge planning plus home care package | |
| Discharge planning plus home care package | |
| Discharge planning plus geriatric assessment unit | |
| Postdischarge care | |
| RCT: effect of geriatric consultation team on discharge placement | |
| Intervention was standardised to all patients; no individual assessment done | |
| Intervention solely focused on providing education and information | |
| Multifaceted intervention which included a home care component | |
| Geriatric assessment started at hospital and continued at home | |
| RCT: postdischarge intervention to reduce non‐elective readmission | |
| RCT: comprehensive geriatric consultation team | |
| Postdischarge care | |
| Intervention included a large component of rehabilitation that was not available to the control group | |
| Augmented home help scheme | |
| Intervention was standardised to all patients; no individual assessment done | |
| RCT: inpatient interdisciplinary geriatric assessment team | |
| Multidimensional intervention, based on the transitional care model |
HMO: health maintenance organisation; RCT: randomised controlled trial.
Characteristics of ongoing studies [ordered by study ID]
| Trial name or title | Patient‐centered Care Transitions in Heart Failure (PACT‐HF) |
| Methods | Single blind parallel randomised control trial |
| Participants | Setting: Canada Inclusion criteria: aged ≥ 16 years and hospitalised with HF Main exclusion criterion: transferred to another hospital |
| Interventions | Intervention: pre‐discharge needs assessment; self‐care education; comprehensive discharge summary; referral to HF clinic and nurse‐led home care Control: care as usual |
| Outcomes | Main outcomes: all‐cause readmission rate at 30d; 6m composite all‐cause death, readmission, or emergency room visit |
| Starting date | July 2014 |
| Contact information | — |
| Notes | Estimated completion date December 2017 ClinicalTrials.gov Identifier: NCT02112227 |
| Trial name or title | Comprehensive Transitional Care Program for Colorectal Cancer Patients |
| Methods | Parallel randomised control trial (pilot) |
| Participants | Setting: safety‐net hospital, USA Inclusion criteria: aged ≥ 18 years, diagnosis of colorectal cancer and undergoing surgery for either palliative cure or palliation Main exclusion criteria: patients not expected to survive |
| Interventions | Intervention: pre‐discharge needs assessment; medication reconciliation; visit before discharge; comprehensive discharge summary; direct communication with primary care team; co‐ordination of follow‐up visits; phone call within 24h of discharge Control: care as usual |
| Outcomes | Main outcome: readmission and emergency room visits rate at 30 d |
| Starting date | February 2015 |
| Contact information | — |
| Notes | Estimated completion date February 2016 ClinicalTrials.gov Identifier: NCT02202096 |
| Trial name or title | The Impact of Individual‐based Discharges From Acute Admission Units to Home |
| Methods | Open label parallel randomised control trial |
| Participants | Setting: acute admission unit, Denmark Inclusion criteria: aged ≥ 18 years, medicine diagnosis, discharged home, ≥ admission last year, planned follow‐up after discharge (GP, home care, outpatient clinic) Main exclusion criterion: cognitively impaired, not local |
| Interventions | Intervention: provision of information and establishment of a discharge plan with the patient; phone interview within 48 h of discharge Control: care as usual |
| Outcomes | Main outcome: readmission rate at 30 d |
| Starting date | November 2014 |
| Contact information | — |
| Notes | Estimated completion date December 2015 ClinicalTrials.gov Identifier: NCT02295319 |
| Trial name or title | Randomised Control Trial of a Transitional Care Model |
| Methods | Single blind parallel randomised control trial |
| Participants | Setting: general hospital, Singapore Inclusion criteria: aged ≥ 21 years and > 1 admission last 90 d Main exclusion criteria: not local or discharged to long‐term care facility; not able to provide informed consent; requires acute treatment or waiting for surgery; primary team consultant not participating in research. |
| Interventions | Intervention: pre‐discharge needs assessment; comprehensive discharge summary; home/phone visit within 48 h of discharge; subsequent contact as needed; research team available for phone inquiries Control: care as usual |
| Outcomes | Main outcome: readmission rate at 30 d |
| Starting date | October 2012 |
| Contact information | — |
| Notes | Completed December 2014 ClinicalTrials.gov Identifier: NCT02351648 |
| Trial name or title | Comprehensive Transitional Care Program for Colorectal Cancer Patients |
| Methods | Single blinded parallel randomised control trial |
| Participants | Setting: US Inclusion criteria: aged ≥ 65 years, diagnosis of dementia, informal care giver available for regular contact, English‐speaking, access to telephone Main exclusion criteria: discharged to institutional setting, moderate‐high alcohol intake, other complex health issues |
| Interventions | Intervention: nurse case manager; inpatient meeting before discharge; 1‐4 postdischarge phone calls Control: care as usual |
| Outcomes | Change from baseline in rehospitalisation at 14, 30 and 90 d |
| Starting date | March 2015 |
| Contact information | — |
| Notes | Estimated completion date March 2019 ClinicalTrials.gov Identifier: NCT02388711 |
| Trial name or title | Transitional Care Program on 30‐Day Hospital Readmissions for Elderly Patients Discharged From a Short Stay Geriatric Ward (PROUST) |
| Methods | Open label parallel stepped wedge randomised control trial |
| Participants | Setting: acute geriatric service, France Inclusion criteria: aged ≥ 75 years, admitted for > 48 h, discharged home, at risk of readmission/ER visit Main exclusion criteria: hospital at home, not local |
| Interventions | Intervention: pre‐discharge needs assessment; medication reconciliation; comprehensive discharge summary with medication review; direct communication with primary care team and scheduling of follow‐up appointment within 30 d of discharge; phone call and home visits for 4 weeks postdischarge Control: care as usual |
| Outcomes | Main outcome: unscheduled readmission and emergency room visits rate at 30 d |
| Starting date | May 2015 |
| Contact information | — |
| Notes | Estimated completion date August 2018 ClinicalTrials.gov Identifier: NCT02421133 |
ER: emergency room; HF: heart failure.
Data and analyses
| Outcome or subgroup title | No. of studies | No. of participants | Statistical method | Effect size |
| 1 Hospital length of stay ‐ older patients with a medical condition Show forest plot | 12 | 2193 | Mean Difference (IV, Fixed, 95% CI) | ‐0.73 [‐1.33, ‐0.12] |
| Analysis 1.1  Comparison 1 Effect of discharge planning on hospital length of stay, Outcome 1 Hospital length of stay ‐ older patients with a medical condition. | ||||
| 2 Sensitivity analysis imputing missing SD for Kennedy trial Show forest plot | 11 | 1825 | Mean Difference (IV, Fixed, 95% CI) | ‐0.98 [‐1.57, ‐0.38] |
| Analysis 1.2 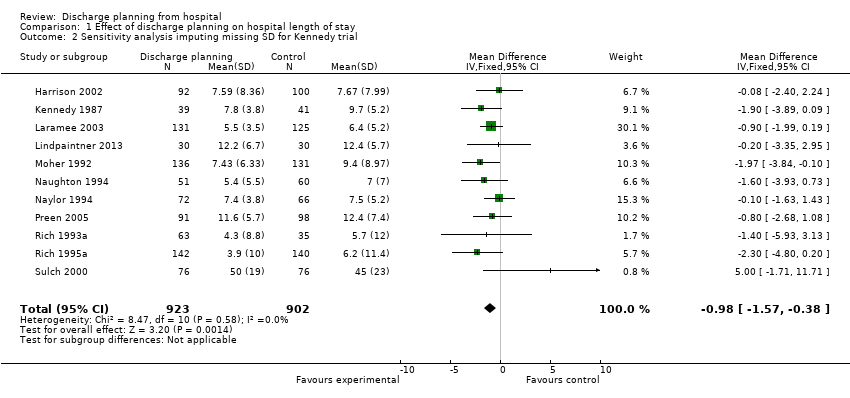 Comparison 1 Effect of discharge planning on hospital length of stay, Outcome 2 Sensitivity analysis imputing missing SD for Kennedy trial. | ||||
| 3 Hospital length of stay ‐ older surgical patients Show forest plot | 2 | 184 | Mean Difference (IV, Fixed, 95% CI) | ‐0.06 [‐1.23, 1.11] |
| Analysis 1.3  Comparison 1 Effect of discharge planning on hospital length of stay, Outcome 3 Hospital length of stay ‐ older surgical patients. | ||||
| 4 Hospital length of stay ‐ older medical and surgical patients Show forest plot | 2 | 1108 | Mean Difference (IV, Fixed, 95% CI) | ‐0.60 [‐2.38, 1.18] |
| Analysis 1.4  Comparison 1 Effect of discharge planning on hospital length of stay, Outcome 4 Hospital length of stay ‐ older medical and surgical patients. | ||||
| Outcome or subgroup title | No. of studies | No. of participants | Statistical method | Effect size | |||||||||||||||||||||||||||||||||||||||
| 1 Within 3 months of discharge from hospital Show forest plot | 17 | 4853 | Risk Ratio (M‐H, Fixed, 95% CI) | 0.88 [0.79, 0.97] | |||||||||||||||||||||||||||||||||||||||
| Analysis 2.1  Comparison 2 Effect of discharge planning on unscheduled readmission rates, Outcome 1 Within 3 months of discharge from hospital. | |||||||||||||||||||||||||||||||||||||||||||
| 1.1 Unscheduled readmission for those with a medical condition | 15 | 4743 | Risk Ratio (M‐H, Fixed, 95% CI) | 0.87 [0.79, 0.97] | |||||||||||||||||||||||||||||||||||||||
| 1.2 Older people admitted to hospital following a fall | 2 | 110 | Risk Ratio (M‐H, Fixed, 95% CI) | 1.36 [0.46, 4.01] | |||||||||||||||||||||||||||||||||||||||
| 2 Patients with medical or surgical condition Show forest plot | Other data | No numeric data | |||||||||||||||||||||||||||||||||||||||||
| Analysis 2.2
Comparison 2 Effect of discharge planning on unscheduled readmission rates, Outcome 2 Patients with medical or surgical condition. | |||||||||||||||||||||||||||||||||||||||||||
| 3 Patients with a medical condition Show forest plot | Other data | No numeric data | |||||||||||||||||||||||||||||||||||||||||
| Analysis 2.3
Comparison 2 Effect of discharge planning on unscheduled readmission rates, Outcome 3 Patients with a medical condition. | |||||||||||||||||||||||||||||||||||||||||||
| 4 Patients who have had surgery Show forest plot | Other data | No numeric data | |||||||||||||||||||||||||||||||||||||||||
| Analysis 2.4
Comparison 2 Effect of discharge planning on unscheduled readmission rates, Outcome 4 Patients who have had surgery. | |||||||||||||||||||||||||||||||||||||||||||
| 5 Patients with a mental health diagnosis Show forest plot | Other data | No numeric data | |||||||||||||||||||||||||||||||||||||||||
| Analysis 2.5
Comparison 2 Effect of discharge planning on unscheduled readmission rates, Outcome 5 Patients with a mental health diagnosis. | |||||||||||||||||||||||||||||||||||||||||||
| Outcome or subgroup title | No. of studies | No. of participants | Statistical method | Effect size | |||||||||||||||
| 1 Patients with a medical condition Show forest plot | Other data | No numeric data | |||||||||||||||||
| Analysis 3.1
Comparison 3 Effect of discharge planning on days in hospital due to unscheduled readmission, Outcome 1 Patients with a medical condition. | |||||||||||||||||||
| 2 Patients with a medical or surgical condition Show forest plot | Other data | No numeric data | |||||||||||||||||
| Analysis 3.2
Comparison 3 Effect of discharge planning on days in hospital due to unscheduled readmission, Outcome 2 Patients with a medical or surgical condition. | |||||||||||||||||||
| 3 Patients with a surgical condition Show forest plot | Other data | No numeric data | |||||||||||||||||
| Analysis 3.3
Comparison 3 Effect of discharge planning on days in hospital due to unscheduled readmission, Outcome 3 Patients with a surgical condition. | |||||||||||||||||||
| Outcome or subgroup title | No. of studies | No. of participants | Statistical method | Effect size | |||||||||||||||||||||||||||
| 1 Patients discharged from hospital to home Show forest plot | 2 | 419 | Risk Ratio (M‐H, Fixed, 95% CI) | 1.03 [0.93, 1.14] | |||||||||||||||||||||||||||
| Analysis 4.1  Comparison 4 Effect of discharge planning on patients' place of discharge, Outcome 1 Patients discharged from hospital to home. | |||||||||||||||||||||||||||||||
| 2 Patients with a medical condition Show forest plot | Other data | No numeric data | |||||||||||||||||||||||||||||
| Analysis 4.2
Comparison 4 Effect of discharge planning on patients' place of discharge, Outcome 2 Patients with a medical condition. | |||||||||||||||||||||||||||||||
| 3 Patients with a medical or surgical condition Show forest plot | Other data | No numeric data | |||||||||||||||||||||||||||||
| Analysis 4.3
Comparison 4 Effect of discharge planning on patients' place of discharge, Outcome 3 Patients with a medical or surgical condition. | |||||||||||||||||||||||||||||||
| 4 Older patients admitted to hospital following a fall in residential care at 1 year Show forest plot | 1 | 60 | Odds Ratio (M‐H, Fixed, 95% CI) | 0.46 [0.15, 1.40] | |||||||||||||||||||||||||||
| Analysis 4.4 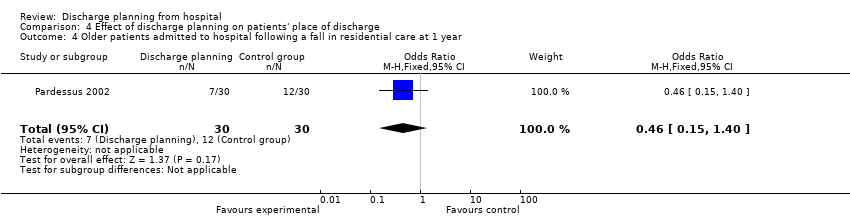 Comparison 4 Effect of discharge planning on patients' place of discharge, Outcome 4 Older patients admitted to hospital following a fall in residential care at 1 year. | |||||||||||||||||||||||||||||||
| Outcome or subgroup title | No. of studies | No. of participants | Statistical method | Effect size | |||||||||
| 1 Mortality at 6 to 9 months Show forest plot | 8 | 2654 | Risk Ratio (M‐H, Fixed, 95% CI) | 1.02 [0.83, 1.27] | |||||||||
| Analysis 5.1  Comparison 5 Effect of discharge planning on mortality, Outcome 1 Mortality at 6 to 9 months. | |||||||||||||
| 1.1 Older people with a medical condition | 7 | 2594 | Risk Ratio (M‐H, Fixed, 95% CI) | 1.02 [0.82, 1.27] | |||||||||
| 1.2 Older people admitted to hospital following a fall | 1 | 60 | Risk Ratio (M‐H, Fixed, 95% CI) | 1.33 [0.33, 5.45] | |||||||||
| 2 Mortality for trials recruiting both patients with a medical condition and those recovering from surgery Show forest plot | Other data | No numeric data | |||||||||||
| Analysis 5.2
Comparison 5 Effect of discharge planning on mortality, Outcome 2 Mortality for trials recruiting both patients with a medical condition and those recovering from surgery. | |||||||||||||
| 3 Mortality at 12 months Show forest plot | Other data | No numeric data | |||||||||||
| Analysis 5.3
Comparison 5 Effect of discharge planning on mortality, Outcome 3 Mortality at 12 months. | |||||||||||||
| Outcome or subgroup title | No. of studies | No. of participants | Statistical method | Effect size | |||||||||||||||||||||||||||||||||
| 1 Patient‐reported outcomes: Patients with a medical condition Show forest plot | Other data | No numeric data | |||||||||||||||||||||||||||||||||||
| Analysis 6.1
Comparison 6 Effect of discharge planning on patient health outcomes, Outcome 1 Patient‐reported outcomes: Patients with a medical condition. | |||||||||||||||||||||||||||||||||||||
| 2 Patient‐reported outcomes: Patients with a surgical condition Show forest plot | Other data | No numeric data | |||||||||||||||||||||||||||||||||||
| Analysis 6.2
Comparison 6 Effect of discharge planning on patient health outcomes, Outcome 2 Patient‐reported outcomes: Patients with a surgical condition. | |||||||||||||||||||||||||||||||||||||
| 3 Patient‐reported outcomes: Patients with a medical or surgical condition Show forest plot | Other data | No numeric data | |||||||||||||||||||||||||||||||||||
| Analysis 6.3
Comparison 6 Effect of discharge planning on patient health outcomes, Outcome 3 Patient‐reported outcomes: Patients with a medical or surgical condition. | |||||||||||||||||||||||||||||||||||||
| 4 Falls at follow‐up: patients admitted to hospital following a fall Show forest plot | 1 | 60 | Risk Ratio (M‐H, Fixed, 95% CI) | 0.87 [0.50, 1.49] | |||||||||||||||||||||||||||||||||
| Analysis 6.4 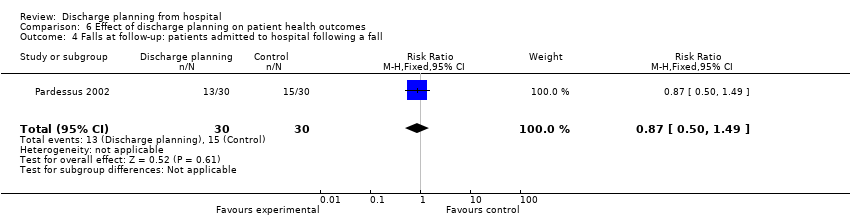 Comparison 6 Effect of discharge planning on patient health outcomes, Outcome 4 Falls at follow‐up: patients admitted to hospital following a fall. | |||||||||||||||||||||||||||||||||||||
| 5 Patient‐reported outcomes: Patients with a mental health diagnosis Show forest plot | Other data | No numeric data | |||||||||||||||||||||||||||||||||||
| Analysis 6.5
Comparison 6 Effect of discharge planning on patient health outcomes, Outcome 5 Patient‐reported outcomes: Patients with a mental health diagnosis. | |||||||||||||||||||||||||||||||||||||
| Outcome or subgroup title | No. of studies | No. of participants | Statistical method | Effect size | |||||||||||||||||||||||||||||||||
| 1 Satisfaction Show forest plot | Other data | No numeric data | |||||||||||||||||||||||||||||||||||
| Analysis 7.1
Comparison 7 Effect of discharge planning on satisfaction with care process, Outcome 1 Satisfaction. | |||||||||||||||||||||||||||||||||||||
| 1.1 Patient and care givers' satisfaction | Other data | No numeric data | |||||||||||||||||||||||||||||||||||
| 1.2 Professional's satisfaction | Other data | No numeric data | |||||||||||||||||||||||||||||||||||
| Outcome or subgroup title | No. of studies | No. of participants | Statistical method | Effect size | |||||||||||||||||||||
| 1 Patients with a medical condition Show forest plot | Other data | No numeric data | |||||||||||||||||||||||
| Analysis 8.1
Comparison 8 Effect of discharge planning on hospital care costs, Outcome 1 Patients with a medical condition. | |||||||||||||||||||||||||
| 2 Patients with a surgical condition Show forest plot | Other data | No numeric data | |||||||||||||||||||||||
| Analysis 8.2
Comparison 8 Effect of discharge planning on hospital care costs, Outcome 2 Patients with a surgical condition. | |||||||||||||||||||||||||
| 3 Patients with a mental health diagnosis Show forest plot | Other data | No numeric data | |||||||||||||||||||||||
| Analysis 8.3
Comparison 8 Effect of discharge planning on hospital care costs, Outcome 3 Patients with a mental health diagnosis. | |||||||||||||||||||||||||
| 4 Patients admitted to a general medical service Show forest plot | Other data | No numeric data | |||||||||||||||||||||||
| Analysis 8.4
Comparison 8 Effect of discharge planning on hospital care costs, Outcome 4 Patients admitted to a general medical service. | |||||||||||||||||||||||||
| 5 Hospital outpatient department attendance Show forest plot | 1 | 288 | Risk Ratio (M‐H, Fixed, 95% CI) | 1.07 [0.74, 1.56] | |||||||||||||||||||||
| Analysis 8.5 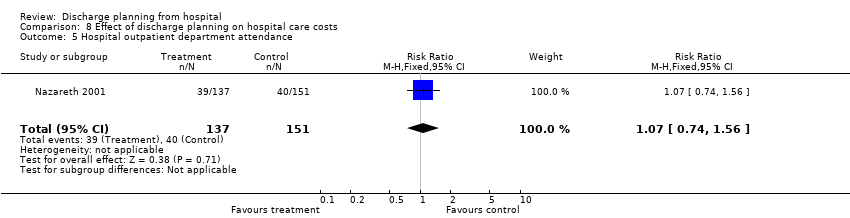 Comparison 8 Effect of discharge planning on hospital care costs, Outcome 5 Hospital outpatient department attendance. | |||||||||||||||||||||||||
| 6 First visits to the emergency room Show forest plot | 2 | 740 | Risk Ratio (M‐H, Fixed, 95% CI) | 0.80 [0.61, 1.07] | |||||||||||||||||||||
| Analysis 8.6  Comparison 8 Effect of discharge planning on hospital care costs, Outcome 6 First visits to the emergency room. | |||||||||||||||||||||||||
| Outcome or subgroup title | No. of studies | No. of participants | Statistical method | Effect size | |||||||||||||||||||||
| 1 Patients with a medical condition Show forest plot | Other data | No numeric data | |||||||||||||||||||||||
| Analysis 9.1
Comparison 9 Effect of discharge planning on primary and community care costs, Outcome 1 Patients with a medical condition. | |||||||||||||||||||||||||
| Outcome or subgroup title | No. of studies | No. of participants | Statistical method | Effect size | |||||||||||||||
| 1 Medication problems after being discharged from hospital Show forest plot | Other data | No numeric data | |||||||||||||||||
| Analysis 10.1
Comparison 10 Effect of discharge planning on medication use, Outcome 1 Medication problems after being discharged from hospital. | |||||||||||||||||||
| 2 Adherence to medicines Show forest plot | Other data | No numeric data | |||||||||||||||||
| Analysis 10.2
Comparison 10 Effect of discharge planning on medication use, Outcome 2 Adherence to medicines. | |||||||||||||||||||
| 3 Knowledge about medicines Show forest plot | Other data | No numeric data | |||||||||||||||||
| Analysis 10.3
Comparison 10 Effect of discharge planning on medication use, Outcome 3 Knowledge about medicines. | |||||||||||||||||||
| 4 Hoarding of medicines Show forest plot | Other data | No numeric data | |||||||||||||||||
| Analysis 10.4
Comparison 10 Effect of discharge planning on medication use, Outcome 4 Hoarding of medicines. | |||||||||||||||||||
| 5 Prescription errors Show forest plot | Other data | No numeric data | |||||||||||||||||
| Analysis 10.5
Comparison 10 Effect of discharge planning on medication use, Outcome 5 Prescription errors. | |||||||||||||||||||
| 6 Medication appropriateness Show forest plot | Other data | No numeric data | |||||||||||||||||
| Analysis 10.6
Comparison 10 Effect of discharge planning on medication use, Outcome 6 Medication appropriateness. | |||||||||||||||||||
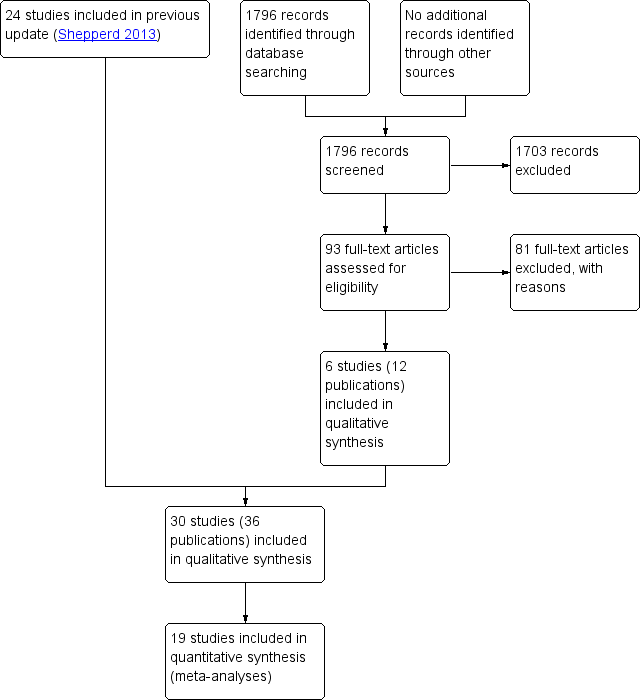
PRISMA flow diagram

Methodological quality summary: review authors' judgements about each methodological quality item for each included study.

Comparison 1 Effect of discharge planning on hospital length of stay, Outcome 1 Hospital length of stay ‐ older patients with a medical condition.

Comparison 1 Effect of discharge planning on hospital length of stay, Outcome 2 Sensitivity analysis imputing missing SD for Kennedy trial.

Comparison 1 Effect of discharge planning on hospital length of stay, Outcome 3 Hospital length of stay ‐ older surgical patients.

Comparison 1 Effect of discharge planning on hospital length of stay, Outcome 4 Hospital length of stay ‐ older medical and surgical patients.

Comparison 2 Effect of discharge planning on unscheduled readmission rates, Outcome 1 Within 3 months of discharge from hospital.
| Study | Readmission rates | Notes |
| Evans 1993 | At 4 weeks: At 9 months: | — |
Comparison 2 Effect of discharge planning on unscheduled readmission rates, Outcome 2 Patients with medical or surgical condition.
| Study | Readmission rates | Notes |
| Farris 2014 | At 30 d: I = 47/281 (17%), C = 43/294 (15%) Difference 2%; 95% CI − 0.04% to 0.08% At 90 d: ET = 49/281 (17%), C = 47/294 (16%) Difference 1%; 95% CI − 5% to 8% | — |
| Gillespie 2009 | At 12 months: I = 106/182 (58.2%), C = 110/186 (59.1%) Difference − 0.9%, 95% CI − 10.9% to 9.1% | — |
| Goldman 2014 | At 30 d: I = 50/347 (14%), C = 47/351 (13%) Difference 1%; 95% CI − 4% to 6% At 90 d: I = 89/347 (26%), C = 77/351 (22%) Difference 3.7%; 95% CI − 2.6% to 10% | Data provided by the trialists |
| Kennedy 1987 | At 1 week: At 8 weeks: | — |
| Lainscak 2013 | At 90 d: COPD− related I = 14/118 (12%), C = 33/135 (24%) Difference 12%; 95% CI 3% to 22% All‐cause readmission T = 25/118 (21%), C = 43/135 (32%) Difference 11%; 95% CI − 0.3% to 21% | Data provided by the trialists; data also available for 30− and 180− d |
| Laramee 2003 | At 90 d: Readmission days: | — |
| Moher 1992 | At 2 weeks: | — |
| Naylor 1994 | Within 45‐90 d: | Authors also report readmission data for 2‐6 weeks follow up |
| Nazareth 2001 | At 90 d: At 180 d: | — |
| Shaw 2000 | At 90 d: | Authors also report data for readmission due to non‐compliance with medication At 3 months: |
| Weinberger 1996 | Number of readmissions per month At 6 months: | Non‐parametric test used to calculate P values for monthly readmissions |
Comparison 2 Effect of discharge planning on unscheduled readmission rates, Outcome 3 Patients with a medical condition.
| Study | Readmission rates | Notes |
| Naylor 1994 | Within 6 to 12 weeks: | — |
Comparison 2 Effect of discharge planning on unscheduled readmission rates, Outcome 4 Patients who have had surgery.
| Study | Readmissions | Mean time to readmission |
| Naji 1999 | At 6 months: | Mean time to readmission T = 161 d, C = 153 d |
Comparison 2 Effect of discharge planning on unscheduled readmission rates, Outcome 5 Patients with a mental health diagnosis.
| Study | Days in hospital | Notes |
| Naylor 1994 | Medical readmission days 2 weeks: T = 21 d (n = 72), C = 73 d (n = 70) 2 to 6 weeks: T = 16 d (n = 72), C = 49 d (n = 70) 6 to 12 weeks: T = 94 d (n = 72), C = 100 d (n = 70) | |
| Weinberger 1996 | Medical readmission days at 6 months follow up: T = 10.2 (19.8), C = 8.8 (19.7) difference 1.4 d, P = 0.04 | — |
Comparison 3 Effect of discharge planning on days in hospital due to unscheduled readmission, Outcome 1 Patients with a medical condition.
| Study | Days in hospital | Notes |
| Evans 1993 | Readmission days at 9 months: | — |
| Hendriksen 1990 | T = 15.5 d per readmission | Not possible to calculate exact P |
| Rich 1993a | Days to first readmission Overall: T = 31.8 (5.1) (n = 63), C = 42.1 (7.3) (n = 35) | — |
Comparison 3 Effect of discharge planning on days in hospital due to unscheduled readmission, Outcome 2 Patients with a medical or surgical condition.
| Study | Days in hospital | Notes |
| Naylor 1994 | Surgical readmission days 2 weeks: T = 34 d (n = 68), C = 32 d (n = 66) 2 to 6 weeks: T = 63 (n = 68), C = 52 (n = 66) 6 to 12 weeks: T = 52 (n = 68), C = 26 (n = 66) | — |
Comparison 3 Effect of discharge planning on days in hospital due to unscheduled readmission, Outcome 3 Patients with a surgical condition.
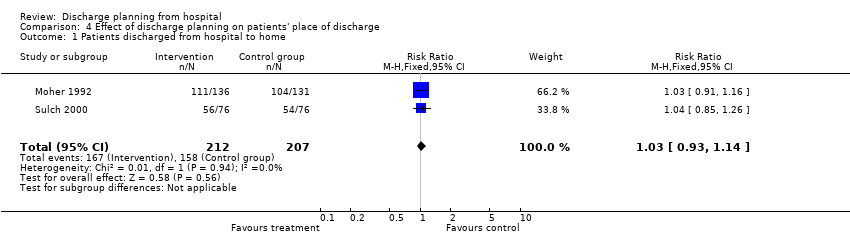
Comparison 4 Effect of discharge planning on patients' place of discharge, Outcome 1 Patients discharged from hospital to home.
| Study | Place of discharge | Notes |
| Goldman 2014 | Discharged to an institutional setting: T = 19/347 (5.5%), C = 9/352 (2.6%) Difference 2.9%; 95% CI − 0.04% to 6% | — |
| Kennedy 1987 | At 2 weeks: | No data shown |
| Legrain 2011 | Discharged home or to a nursing home: T = 183/317 C = 191/348 | — |
| Lindpaintner 2013 | Discharged home T = 25/30 (83%), C = 30/30 (100%) Difference 17%, 95% CI 2 to 34% | — |
| Moher 1992 | Discharged home: | — |
| Naughton 1994 | Discharged to nursing home: | — |
| Sulch 2000 | Discharged home: Discharged to an institution: | — |
Comparison 4 Effect of discharge planning on patients' place of discharge, Outcome 2 Patients with a medical condition.
| Study | Place of discharge | Notes |
| Evans 1993 | Discharged to home: Home at 9 months: | — |
| Hendriksen 1990 | Discharged to nursing home: At 6 months: admitted to another institution | — |
Comparison 4 Effect of discharge planning on patients' place of discharge, Outcome 3 Patients with a medical or surgical condition.

Comparison 4 Effect of discharge planning on patients' place of discharge, Outcome 4 Older patients admitted to hospital following a fall in residential care at 1 year.

Comparison 5 Effect of discharge planning on mortality, Outcome 1 Mortality at 6 to 9 months.
| Study | Mortality at 9 months | Notes |
| Evans 1993 | T = 66/417 (16%) | — |
Comparison 5 Effect of discharge planning on mortality, Outcome 2 Mortality for trials recruiting both patients with a medical condition and those recovering from surgery.
| Study | Mortality at 12 months | Notes |
| Gillespie 2009 | T: 57/182 (31%); C: 61/186 (33%) Difference − 2%, 95% CI − 11% to 8% | |
Comparison 5 Effect of discharge planning on mortality, Outcome 3 Mortality at 12 months.
| Study | Patient health outcomes | Notes |
| Harrison 2002 | SF‐36 Baseline Physical component T = 28.63 (SD 9.46) N = 78 Mental component T = 50.49 (SD 12.45) N = 78 At 12 weeks Physical component T = 32.05 (SD 11.81) N = 77 Mental component T = 53.94 (SD 12.32) N = 78 Minnesota Living with Heart Failure Questionnaire (MLHFQ) At 12 week follow‐up (See table 4) n, % Worse: T = 6/79 (8), C = 22/76 (29) | SF‐36 a higher score indicates better health status MLHFQ a lower score indicates less disability from symptoms |
| Kennedy 1987 | Long Term Care Information System (LTCIS) | No data reported |
| Lainscak 2013 | St. George’s Respiratory Change from 7 to 180 d after discharge T = 1.06 (95% CI 9.50 to 8.43), C = − 0.11 (95% CI − 11.34 to 8.12) | Complete data available for only approximately half of the patients. For the SGRQ, higher scores indicate more limitations; minimal clinically important difference estimated as 4 points. |
| Naylor 1994 | Data aggregated for both groups. Mean Enforced Social Dependency Scale increased from 19.6 to 26.3 P < 0.01 | No data reported for each group. Decline in functional status reported for all patients. Functional status. Scale measured:
Not possible to calculate exact P value |
| Nazareth 2001 | General well‐being questionnaire: 1 = ill health, 5 = good health At 6 months: Mean difference 0.10; 95% CI − 0.14 to 0.34 | — |
| Preen 2005 | SF‐12 (N not reported for follow‐up) Mental component score Predischarge score: T = 37.4 SD 5.4 7 d postdischarge: T = 42.4 SD 5.6 Physical component score Predischarge score: T = 27.8 SD 4.8 7 d postdischarge: T = 27.2 SD 4.5 | — |
| Rich 1995a | Chronic Heart Failure Questionnaire Treatment N = 67, Control N = 59 Total score At baseline: T = 72.1 (15.6), C = 74.4 (16.3) At 90 d: T = 94.3 (21.3), C = 85.7 (19.0) Change score = 22.1 (20.8), P = 0.001 Dyspnoea At baseline: T = 9.0 (7.9), C = 8.1 (7.7) At 90 d: T = 15.8 (12.8), C = 11.9 (10.0) Change score 6.8 (7.9) Fatigue At baseline: T = 12.9 (5.3), C = 14.1 (5.6) At 90 d: T = 18.3 (6.3), C = 16.8 (5.5) Change score 5.4 (5.5) Emotional function At baseline: T = 31.9 (8.5), C = 33.3 (8.1) At 90 d: T = 37.4 (7.8), C = 35.2 (8.4) Change score 5.6 (7.1) Environmental mastery At baseline: T = 18.3 (5.8), C = 18.9 (4.8) At 90 d: T = 22.7 (4.9), C = 21.7 (4.6) Change score 4.4 (5.3) | Chronic Heart Failure Questionnaire contains 20 questions that the patient is asked to rate on a scale 1 to 7 with a low score indicating poor quality of life |
| Sulch 2000 | Barthel activities of daily living At 4 weeks: At 12 weeks: At 26 weeks: Median change from 4 to 12 weeks: P < 0.01 Rankin score At 4 weeks: At 12 weeks: At 26 weeks: Hospital anxiety and depression scale At 4 weeks: At 12 weeks: At 26 weeks Depression At 4 weeks: At 12 weeks: At 26 weeks: EuroQol Median scores At 12 weeks: At 26 weeks: | The Barthel ADL Index covers activities of daily living; scores range from 0 to 20, with higher scores indicating better functioning. The Rankin scale assesses activities of daily living in people who have had a stroke; it contains 7 items with scores ranging from 0 to 6. Higher scores indicating more disability. The Hospital Anxiety and Depression Scale is a 14‐item Likert scale (0‐3); scores range from 0 to 21 for each subscale (anxiety and depression), with higher scores indicating more burden from symptoms. The EuroQol contains 5 items; higher scores indicate better self‐perceived health status. Not possible to calculate exact P value |
| Weinberger 1996 | At 1 month: no significant differences At 3 months: no significant differences | SF‐36 |
Comparison 6 Effect of discharge planning on patient health outcomes, Outcome 1 Patient‐reported outcomes: Patients with a medical condition.
| Study | Patient health outcomes | Notes |
| Lin 2009 | OARS Multidimensional Functional Assessment Questionnaire (Chinese version) at 3 months follow‐up Mean (SD) T = 16.92 (1.41) C = 16.83 (1.71) | 9 components, each component scored 0 to 2 with a total score range 0‐18.
|
| Lin 2009 | SF 36 Mean (SD) Physical aspects Pre‐test T: 74.09 (21.05), C: 68.15 (21.62) Post‐test T: 49.05 (16.27), C: 39.56 (16.76) Between group difference P = 0.09 Physical functioning Pre‐test T: 74.80 (25.15), C: 73.33 (18.04) Post‐test T: 55.77 (22.56), C: 51.46 (24.82) Between group difference P = 0.60 Role physical Pre‐test T: 66.34 (47.40), C: 65.63 (44.12) Post‐test T:16.34 (34.60), C: 12.50 (33.78) Between group difference P = 0.78 Bodily pain Pre‐test T: 88.15 (18.48), C: 77.08 (22.44) Post‐test T: 55.16 (23.20), C: 38.58 (27.68) Between group difference p=0.009 General health perceptions Pre‐test T: 67.03 (15.31), C: 56.54 (19.96) Post‐test T: 68.46 (16.55), C: 55.70 (22.23) Between group differences p=0.03 Mental aspects Pre‐test T: 74.49 (16.66), C: 68.24 (15.09) Post‐test T: 50.57 (18.72), C: 43.43 (17.28) Between group difference P = 0.09 Mental health Pre‐test T: 71.23 (12.18), C: 67.83 (12.28) Post‐test T: 22.30 (10.31), C: 20.00 (11.62) Between group difference P = 0.27 Role emotion Pre‐test T: 76.92 (40.84), C: 68.05 (41.10) Post‐test T: 52.56 (44.39), C: 54.16 (41.49) Between group difference P = 0.71 Social functioning Pre‐test T: 80.76 (15.09), C: 77.08 (15.93) Post test T: 61.01 (24.32), C: 45.83 (20.41) Between group difference P = 0.03 Vitality Pre‐test T: 69.03 (12.88), C: 60.00 (11.70) Post‐test T: 66.34 (16.94), C: 53.75 (21.93) Between group difference P = 0.004 | — |
| Naylor 1994 | No differences between groups reported | No data reported |
| Naylor 1994 | — | — |
Comparison 6 Effect of discharge planning on patient health outcomes, Outcome 2 Patient‐reported outcomes: Patients with a surgical condition.
| Study | Patient health outcomes | Notes |
| Evans 1993 | At 1 month: mean (SD) | Barthel score |
| Pardessus 2002 | Functional Autonomy Measurement System (SMAF) At 6 months: At 12 months: Katz ADL At 6 months: At 12 months: IADL At 6 months: At 12 months: | The SMAF scale assesses seven fields of activities of daily living. It has 22 items with scores ranging from 0 (total independence) to 87 (total dependence) The Katz ADL scale covers six ADLs, with scores ranging from 0 (totally dependent) to 6 (totally independent). |
Comparison 6 Effect of discharge planning on patient health outcomes, Outcome 3 Patient‐reported outcomes: Patients with a medical or surgical condition.

Comparison 6 Effect of discharge planning on patient health outcomes, Outcome 4 Falls at follow‐up: patients admitted to hospital following a fall.
| Study | Patient health outcomes | Notes |
| Naji 1999 | Hospital Anxiety Depression Scale Anxiety Depression Behavioural and Symptom Identification Scale Relation to self/other Depression/anxiety Daily living/role functioning Impulsive/addictive behaviour Psychosis Total symptom score | — |
Comparison 6 Effect of discharge planning on patient health outcomes, Outcome 5 Patient‐reported outcomes: Patients with a mental health diagnosis.
| Study | Satisfaction | Notes |
| Patient and care givers' satisfaction | ||
| Laramee 2003 | Mean hospital care: T = 4.2 (N = 120), C = 4.0 (N = 100), P = 0.003 Mean hospital discharge: T = 4.3 (N = 120), C = 4.0 (N = 100), P < 0.001 Mean care instructions: T = 4.0 (N = 120), C = 3.4 (N = 100), P < 0.001 Mean recovering at home: T = 4.4 (N = 120), C = 3.9 (N = 100), P < 0.001 Mean total score: T = 4.2 (N = 120), C = 3.8 (N = 100), P < 0.001 | — |
| Lindpaintner 2013 | Satisfaction with discharge process At 5 d (median and IQR) Patients: T = 1 (0), C = 1 (1‐2) Carers: T = 1 (0), C = 1 (1‐2) At 30 d Patients: T = 1 (1‐2), C = 1 (1‐2) Carers: T = 1 (1‐2), C = 2 (1‐3) | 4‐point Likert‐scale, lower scores indicate higher satisfaction |
| Moher 1992 | Satisfied with medical care: | "Please rate how satisfied you were with the care you received…" Subgroup of 40 patients, responses from 18 in the treatment group and 21 in the control group |
| Nazareth 2001 | Client satisfaction questionnaire score (1 = dissatisfied, 4 = satisfied) At 3 months: At 6 months: | |
| Weinberger 1996 | At 1 month: At 6 months: Authors report differences were greatest for patients' perceptions of continuity of care and non‐financial access to medical care | Patient Satisfaction Questionnaire, 11 domains with a 5‐point scale |
| Professional's satisfaction | ||
| Bolas 2004 | Standard of information at discharge improved GPs: 57% agreed Community pharmacists: 95% agreed | Response rate of 55% (GPs) and 56% (community pharmacists) No information provided about the survey |
| Lindpaintner 2013 | Satisfaction with discharge process At 5 d (median and IQR) Primary care physician: T = 1 (1‐2), C = 2 (1‐3) Visiting nurse: T = 1 (1‐2), C = 2 (1‐4) At 30 d (median and IQR) Primary care physician: T = 2 (1‐3), C = 1 (1‐2) | Number of respondents ranged between 15 (visiting nurse) and 30 (PCP) 4‐point Likert scale, lower scores indicate higher satisfaction |
Comparison 7 Effect of discharge planning on satisfaction with care process, Outcome 1 Satisfaction.
| Study | Costs | Notes |
| Gillespie 2009 | Total T: USD 12000; C: USD 12500 Mean difference: − USD 400 (− USD 4000 to USD 3200) Visits to ED T: USD 160; C: USD 260 Mean difference: − USD 100 (− USD 220 to − USD 10) Readmissions T: USD 12000; C: USD 12300 Mean difference: − USD 300 (− USD 3900 to USD 3300) | Costs calculated for 2008 |
| Laramee 2003 | Total inpatient and outpatient median costs P = 0.14 | The case manager (CM) kept a log during the first, middle and last 4 weeks of the recruitment period of how much time was spent with each patient during the 12‐week study period. Thus, |
| Naughton 1994 | — | Number: |
| Naylor 1994 | Initial stay mean charges (USD): Medical readmission total charges in USD (CIs are in thousands): At 2 weeks: 2‐6 weeks: 6‐12 weeks: | Charge data were used to calculate the cost of the initial hospitalisation Readmission costs were calculated using the mean charge per day of the index hospitalisations times the actual number of days of subsequent hospitalisations, as patients were readmitted to a variety of hospitals with a wide range of charges Total charges including readmission charges (first readmission only if multiple readmissions) |
| Rich 1995a | Intervention cost USD 216 per patient Caregiver cost T = USD 1164, C = USD 828 Other medical care T = USD 1257, C = USD 1211 Readmission costs T = USD 2178, C = USD 3236 All costs T = USD 4815, C = USD 5275 | — |
Comparison 8 Effect of discharge planning on hospital care costs, Outcome 1 Patients with a medical condition.
| Study | Costs | Notes |
| Naylor 1994 | Surgical initial stay mean charges (USD): At 2 weeks: 2‐6 weeks: 6‐12 weeks: | Charge data were used to calculate the cost of the initial hospitalisation |
Comparison 8 Effect of discharge planning on hospital care costs, Outcome 2 Patients with a surgical condition.
| Study | Costs | Notes |
| Naji 1999 | T = an additional GBP 1.14 per patient Intervention can avert 3 outpatient appointments for every 10 patients | Telephone calls: T = 124/168 (86%), C = 19/175 (12%) |
Comparison 8 Effect of discharge planning on hospital care costs, Outcome 3 Patients with a mental health diagnosis.
| Study | Costs | Notes |
| Jack 2009 | — | Follow‐up PCP appointments were given an estimated cost of USD 55, on the basis of costs from an average hospital follow‐up visit at Boston Medical Center |
| Legrain 2011 | The cost savings balanced against the cost of the intervention reported to be EUR 519/patient | — |
| Legrain 2011 | Total cost of adverse drug reactions‐related admissions (180 days follow‐up) T = USD 487/participant C = USD 1184/participant P = 0.13 | — |
Comparison 8 Effect of discharge planning on hospital care costs, Outcome 4 Patients admitted to a general medical service.

Comparison 8 Effect of discharge planning on hospital care costs, Outcome 5 Hospital outpatient department attendance.

Comparison 8 Effect of discharge planning on hospital care costs, Outcome 6 First visits to the emergency room.
| Study | Use of services | Notes |
| Farris 2014 | Unscheduled office visits At 30 d T = 31/281 (11%), C = 32/294 (11%) Difference 0%; 95% CI − 5% to 5% At 90 d T = 42/281 (15%), C = 33/294 (11%) Difference 4%; 95% CI − 2 to 9% | Results for Enhanced vs Control intervention (results for minimal intervention not reported) |
| Goldman 2014 | Primary care visits at 30 d T = 189/301 (62.8%), C = 186/316 (58.9%) Difference 4%; 95% CI − 3.7% to 11.5% | — |
| Laramee 2003 | Visiting Nurse postdischarge: | — |
| Nazareth 2001 | General practice attendance: At 3 months: At 6 months: | — |
| Weinberger 1996 | Median time from hospital discharge to the first visit: Visit at least one general medicine clinic in 6‐month follow up: Mean number of visits to general medical clinic: | — |
Comparison 9 Effect of discharge planning on primary and community care costs, Outcome 1 Patients with a medical condition.
| Study | Number of problems | Notes |
| Bolas 2004 | Intervention group demonstrated a higher rate of reconciliation of patient's own drugs with the discharge prescription; 90% compared to the 44% in the control group | — |
| Shaw 2000 | Mean number of problems (SD) At 1 week: At 4 weeks: At 12 weeks: | Problems included difficulty obtaining a prescription from the GP; insufficient knowledge about medication; non‐compliance |
Comparison 10 Effect of discharge planning on medication use, Outcome 1 Medication problems after being discharged from hospital.
| Study | Adherence to medicines | Notes |
| Nazareth 2001 | At 3 months: At 6 months: | 0 = none |
| Rich 1995a | Taking 80% or more of prescribed pills at 30 d after discharge T = 117/142 (82.5%), C = 91/140 (64.9%) | — |
Comparison 10 Effect of discharge planning on medication use, Outcome 2 Adherence to medicines.
| Study | Knowledge | Notes |
| Bolas 2004 | Mean error rate in knowledge of drug therapy at 10‐14 d follow up Drug name T = 15%, C = 43%, P < 0.001 Drug dose T = 14%, C = 39%, P < 0.001 Frequency T = 15%, C = 39%, P < 0.001 (n for each group not reported) | — |
| Nazareth 2001 | At 3 months: At 6 months: | 0 = none |
| Shaw 2000 | At 1 and 12 weeks post‐discharge: Significant improvement in knowledge medication for both groups (no differences between groups) | — |
Comparison 10 Effect of discharge planning on medication use, Outcome 3 Knowledge about medicines.
| Study | Hoarding | Notes |
| Bolas 2004 | 90% of people who brought drugs to the hospital were returned in the intervention group compared to 50% in the controls | — |
| Nazareth 2001 | At 3 months: At 6 months | 0 = none |
Comparison 10 Effect of discharge planning on medication use, Outcome 4 Hoarding of medicines.
| Study | |
| Eggink 2010 | Following a review of medication by a pharmacist, 68% in the control group had at least one discrepancy or medication error compared to 39% in the intervention group (RR 0.57; 95% CI 0.37 to 0.88). The percent of medications with a discrepancy or error in the intervention group was 6.1% in intervention group and 14.6% in the control group (RR = 0.42; 0.27 to 0.66). |
| Kripalani 2012 | Clinically important medication errors (total number of events; could be more than one per patient) At 30 d T = 370/423, M = 0.87 (SD 1.18) C = 407/428, M = 0.95 (SD 1.36) |
Comparison 10 Effect of discharge planning on medication use, Outcome 5 Prescription errors.
| Study | Medication appropriateness | Notes |
| Farris 2014 | Discharge T = 7.1 (SD 7.0), C = 6.1 (SD 6.6) 30 d post‐discharge T = 10.1 (SD 8.9), C = 9.6 (SD 9.5) P = 0.78 90 d post‐discharge T = 11.6 (SD 10.5), C = 11.1 (11.3) P = 0.94 | As measured by the medication appropriateness index (MAI); summed MAI per participant Results for Enhanced v Control intervention (results for minimal intervention not reported) |
Comparison 10 Effect of discharge planning on medication use, Outcome 6 Medication appropriateness.
| Effect of discharge planning on patients admitted to hospital with a medical condition | ||||||
| Patient or population: patients admitted to hospital | ||||||
| Outcomes | Illustrative comparative risks* (95% CI) | Relative effect | No. of participants | Certainty of the evidence | Comments | |
| Assumed risk | Corresponding risk | |||||
| Without discharge planning | With discharge planning | |||||
| Unscheduled readmission within 3 months of discharge from hospital | Study population admitted with a medical condition | RR 0.87 | 4743 | ⊕⊕⊕⊝ | — | |
| 254 per 1000 | 221 per 1000 | |||||
| Moderate risk population | ||||||
| 285 per 1000 | 248 per 1000 | |||||
| Study population admitted following a fall | RR 1.36 (0.46 to 4.01) | 110 (2) | ⊕⊝⊝⊝ very lowb | — | ||
| 93 per 1000 | 126 per 1000 (43 to 371) | |||||
| Moderate risk population | ||||||
| 92 per 1000 | 125 per 1000 (42 to 369) | |||||
| Hospital length of stay | Study population admitted with a medical condition | — | 2193 | ⊕⊕⊕⊝ | — | |
| The mean hospital length of stay ranged across control groups from | The mean hospital length of stay in the intervention groups was | |||||
| Satisfaction | Discharge planning may lead to increased satisfaction for patients and healthcare professionals. | 6 studies | ⊕⊕⊝⊝ low | Patient satisfaction was measured in different ways, and findings were not consistent across studies. Only 6/30 studies reported data for this outcome. | ||
| Costs | A lower readmission rate for those receiving discharge planning may be associated with lower health service costs in the short term. Differences in use of primary care varied. | 5 studies | ⊕⊝⊝⊝ very low | Findings were inconsistent. Healthcare resources that were assessed varied among studies, e.g., primary care visits, readmission, length of stay, laboratory services, medication, diagnostic imaging. The charges used to cost the healthcare resources also varied. | ||
| *The basis for the assumed risk (e.g. the median control group risk across studies) is provided in footnotes. The corresponding risk (and its 95% confidence interval) is based on the assumed risk in the comparison group and the relative effect of the intervention (and its 95% CI). | ||||||
| GRADE Working Group grades of evidence | ||||||
| aThe evidence was downgraded to moderate as allocation concealment was unclear for 5 of the 15 trials. | ||||||
| Outcome or subgroup title | No. of studies | No. of participants | Statistical method | Effect size |
| 1 Hospital length of stay ‐ older patients with a medical condition Show forest plot | 12 | 2193 | Mean Difference (IV, Fixed, 95% CI) | ‐0.73 [‐1.33, ‐0.12] |
| 2 Sensitivity analysis imputing missing SD for Kennedy trial Show forest plot | 11 | 1825 | Mean Difference (IV, Fixed, 95% CI) | ‐0.98 [‐1.57, ‐0.38] |
| 3 Hospital length of stay ‐ older surgical patients Show forest plot | 2 | 184 | Mean Difference (IV, Fixed, 95% CI) | ‐0.06 [‐1.23, 1.11] |
| 4 Hospital length of stay ‐ older medical and surgical patients Show forest plot | 2 | 1108 | Mean Difference (IV, Fixed, 95% CI) | ‐0.60 [‐2.38, 1.18] |
| Outcome or subgroup title | No. of studies | No. of participants | Statistical method | Effect size |
| 1 Within 3 months of discharge from hospital Show forest plot | 17 | 4853 | Risk Ratio (M‐H, Fixed, 95% CI) | 0.88 [0.79, 0.97] |
| 1.1 Unscheduled readmission for those with a medical condition | 15 | 4743 | Risk Ratio (M‐H, Fixed, 95% CI) | 0.87 [0.79, 0.97] |
| 1.2 Older people admitted to hospital following a fall | 2 | 110 | Risk Ratio (M‐H, Fixed, 95% CI) | 1.36 [0.46, 4.01] |
| 2 Patients with medical or surgical condition Show forest plot | Other data | No numeric data | ||
| 3 Patients with a medical condition Show forest plot | Other data | No numeric data | ||
| 4 Patients who have had surgery Show forest plot | Other data | No numeric data | ||
| 5 Patients with a mental health diagnosis Show forest plot | Other data | No numeric data | ||
| Outcome or subgroup title | No. of studies | No. of participants | Statistical method | Effect size |
| 1 Patients with a medical condition Show forest plot | Other data | No numeric data | ||
| 2 Patients with a medical or surgical condition Show forest plot | Other data | No numeric data | ||
| 3 Patients with a surgical condition Show forest plot | Other data | No numeric data | ||
| Outcome or subgroup title | No. of studies | No. of participants | Statistical method | Effect size |
| 1 Patients discharged from hospital to home Show forest plot | 2 | 419 | Risk Ratio (M‐H, Fixed, 95% CI) | 1.03 [0.93, 1.14] |
| 2 Patients with a medical condition Show forest plot | Other data | No numeric data | ||
| 3 Patients with a medical or surgical condition Show forest plot | Other data | No numeric data | ||
| 4 Older patients admitted to hospital following a fall in residential care at 1 year Show forest plot | 1 | 60 | Odds Ratio (M‐H, Fixed, 95% CI) | 0.46 [0.15, 1.40] |
| Outcome or subgroup title | No. of studies | No. of participants | Statistical method | Effect size |
| 1 Mortality at 6 to 9 months Show forest plot | 8 | 2654 | Risk Ratio (M‐H, Fixed, 95% CI) | 1.02 [0.83, 1.27] |
| 1.1 Older people with a medical condition | 7 | 2594 | Risk Ratio (M‐H, Fixed, 95% CI) | 1.02 [0.82, 1.27] |
| 1.2 Older people admitted to hospital following a fall | 1 | 60 | Risk Ratio (M‐H, Fixed, 95% CI) | 1.33 [0.33, 5.45] |
| 2 Mortality for trials recruiting both patients with a medical condition and those recovering from surgery Show forest plot | Other data | No numeric data | ||
| 3 Mortality at 12 months Show forest plot | Other data | No numeric data | ||
| Outcome or subgroup title | No. of studies | No. of participants | Statistical method | Effect size |
| 1 Patient‐reported outcomes: Patients with a medical condition Show forest plot | Other data | No numeric data | ||
| 2 Patient‐reported outcomes: Patients with a surgical condition Show forest plot | Other data | No numeric data | ||
| 3 Patient‐reported outcomes: Patients with a medical or surgical condition Show forest plot | Other data | No numeric data | ||
| 4 Falls at follow‐up: patients admitted to hospital following a fall Show forest plot | 1 | 60 | Risk Ratio (M‐H, Fixed, 95% CI) | 0.87 [0.50, 1.49] |
| 5 Patient‐reported outcomes: Patients with a mental health diagnosis Show forest plot | Other data | No numeric data | ||
| Outcome or subgroup title | No. of studies | No. of participants | Statistical method | Effect size |
| 1 Satisfaction Show forest plot | Other data | No numeric data | ||
| 1.1 Patient and care givers' satisfaction | Other data | No numeric data | ||
| 1.2 Professional's satisfaction | Other data | No numeric data | ||
| Outcome or subgroup title | No. of studies | No. of participants | Statistical method | Effect size |
| 1 Patients with a medical condition Show forest plot | Other data | No numeric data | ||
| 2 Patients with a surgical condition Show forest plot | Other data | No numeric data | ||
| 3 Patients with a mental health diagnosis Show forest plot | Other data | No numeric data | ||
| 4 Patients admitted to a general medical service Show forest plot | Other data | No numeric data | ||
| 5 Hospital outpatient department attendance Show forest plot | 1 | 288 | Risk Ratio (M‐H, Fixed, 95% CI) | 1.07 [0.74, 1.56] |
| 6 First visits to the emergency room Show forest plot | 2 | 740 | Risk Ratio (M‐H, Fixed, 95% CI) | 0.80 [0.61, 1.07] |
| Outcome or subgroup title | No. of studies | No. of participants | Statistical method | Effect size |
| 1 Patients with a medical condition Show forest plot | Other data | No numeric data | ||
| Outcome or subgroup title | No. of studies | No. of participants | Statistical method | Effect size |
| 1 Medication problems after being discharged from hospital Show forest plot | Other data | No numeric data | ||
| 2 Adherence to medicines Show forest plot | Other data | No numeric data | ||
| 3 Knowledge about medicines Show forest plot | Other data | No numeric data | ||
| 4 Hoarding of medicines Show forest plot | Other data | No numeric data | ||
| 5 Prescription errors Show forest plot | Other data | No numeric data | ||
| 6 Medication appropriateness Show forest plot | Other data | No numeric data | ||