Planificación del alta del hospital
Información
- DOI:
- https://doi.org/10.1002/14651858.CD000313.pub5Copiar DOI

- Base de datos:
-
- Cochrane Database of Systematic Reviews
- Versión publicada:
-
- 27 enero 2016see what's new
- Tipo:
-
- Intervention
- Etapa:
-
- Review
- Grupo Editorial Cochrane:
-
Grupo Cochrane de Práctica y organización sanitaria efectivas
- Copyright:
-
- Copyright © 2016 The Cochrane Collaboration. Published by John Wiley & Sons, Ltd.
Cifras del artículo
Altmetric:
Citado por:
Autores
Contributions of authors
Daniela Gonҫalves‐Bradley (DCGB) scanned the abstracts and extracted data for this update and took the lead in analysing the data and updating the text of the review. Natasha Lannin (NL), Lindy Clemson (LC) and Ian Cameron (IC) scanned the abstracts and extracted data. Sasha Shepperd (SS) co‐authored the protocol for the review with Julie Parkes (no longer an author), extracted and analysed data for previous versions of this review, and led the writing of the review.
Sources of support
Internal sources
-
Anglia and Oxford Regional Research and Development Programme, UK.
External sources
-
NIHR Evidence Synthesis Award to SS and NHS Cochrane Collaboration Programme Grant Scheme, UK.
-
NIHR Evidence Synthesis Award; and an NIHR Cochrane Programme grant for the last two updates., UK.
Declarations of interest
DCGB: none known.
NL: none known.
LC: none known.
IC: none known.
SS: none known.
Acknowledgements
Diana Harwood for assisting in scanning abstracts retrieved from electronic searches for the original review; Andy Oxman for commenting on all versions of this review; Jeremy Grimshaw and Darryl Wieland for helpful comments on earlier drafts and Luciana Ballini, Tomas Pantoja, Craig Ramsey, Darryl Weiland and Kirsten Woodend for comments on the previous update; Nia Roberts for conducting the literature searches; and Julie Parkes, Christopher Phillips, Jacqueline McClaran, Sarah Barras, and Annie McCluskey for contributing to previous versions of this review (Parkes 2000; Shepperd 2010, Shepperd 2013).
Version history
| Published | Title | Stage | Authors | Version |
| 2022 Feb 24 | Discharge planning from hospital | Review | Daniela C Gonçalves-Bradley, Natasha A Lannin, Lindy Clemson, Ian D Cameron, Sasha Shepperd | |
| 2016 Jan 27 | Discharge planning from hospital | Review | Daniela C. Gonçalves‐Bradley, Natasha A Lannin, Lindy M Clemson, Ian D Cameron, Sasha Shepperd | |
| 2013 Jan 31 | Discharge planning from hospital to home | Review | Sasha Shepperd, Natasha A Lannin, Lindy M Clemson, Annie McCluskey, Ian D Cameron, Sarah L Barras | |
| 2010 Jan 20 | Discharge planning from hospital to home | Review | Sasha Shepperd, Jacqueline McClaran, Christopher O Phillips, Natasha A Lannin, Lindy M Clemson, Annie McCluskey, Ian D Cameron, Sarah L Barras | |
| 2004 Jan 26 | Discharge planning from hospital to home | Review | Sasha Shepperd, Julie Parkes, Jacqueline JM McClaran, Christopher Phillips | |
| 2000 Aug 17 | Discharge planning from hospital to home | Review | J Parkes, Sasha S Shepperd | |
Differences between protocol and review
We performed post hoc subgroup analyses for patients admitted to hospital following a fall and patients admitted to a mental health setting. We performed a post hoc sensitivity analysis by imputing a missing standard deviation for one trial. We made a post hoc decision to exclude studies that were considered to be methodologically weak. We added new analysis to the summary of findings table by including results for the patients admitted to hospital following a fall, patients and healthcare professionals satisfaction, and costs. We merged the outcome "Psychological health of patients" with the outcome "Patient health status".
Keywords
MeSH
Medical Subject Headings (MeSH) Keywords
- *Patient Discharge;
- Aftercare [organization & administration];
- Controlled Clinical Trials as Topic;
- Health Care Costs;
- Intention to Treat Analysis;
- Length of Stay [statistics & numerical data];
- Outcome Assessment, Health Care;
- Patient Readmission [statistics & numerical data];
- Randomized Controlled Trials as Topic;
Medical Subject Headings Check Words
Humans;
PICO
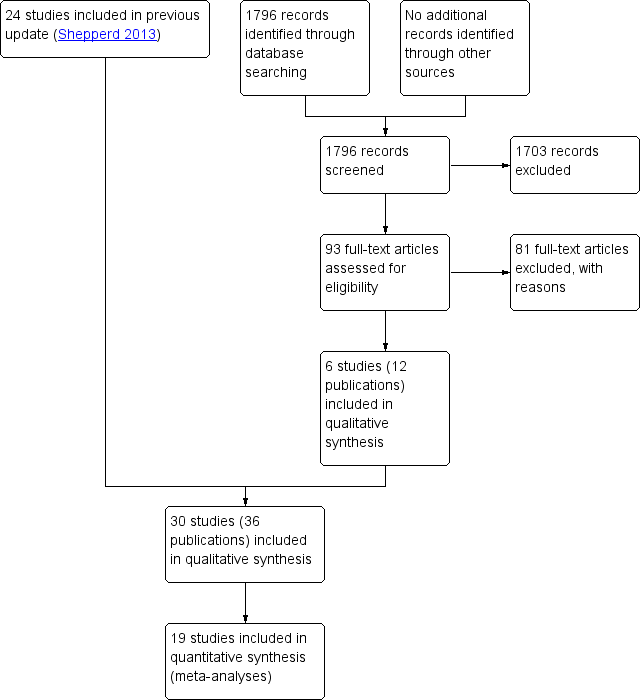
PRISMA flow diagram

Methodological quality summary: review authors' judgements about each methodological quality item for each included study.

Comparison 1 Effect of discharge planning on hospital length of stay, Outcome 1 Hospital length of stay ‐ older patients with a medical condition.

Comparison 1 Effect of discharge planning on hospital length of stay, Outcome 2 Sensitivity analysis imputing missing SD for Kennedy trial.

Comparison 1 Effect of discharge planning on hospital length of stay, Outcome 3 Hospital length of stay ‐ older surgical patients.

Comparison 1 Effect of discharge planning on hospital length of stay, Outcome 4 Hospital length of stay ‐ older medical and surgical patients.

Comparison 2 Effect of discharge planning on unscheduled readmission rates, Outcome 1 Within 3 months of discharge from hospital.
| Study | Readmission rates | Notes |
| Evans 1993 | At 4 weeks: At 9 months: | — |
Comparison 2 Effect of discharge planning on unscheduled readmission rates, Outcome 2 Patients with medical or surgical condition.
| Study | Readmission rates | Notes |
| Farris 2014 | At 30 d: I = 47/281 (17%), C = 43/294 (15%) Difference 2%; 95% CI − 0.04% to 0.08% At 90 d: ET = 49/281 (17%), C = 47/294 (16%) Difference 1%; 95% CI − 5% to 8% | — |
| Gillespie 2009 | At 12 months: I = 106/182 (58.2%), C = 110/186 (59.1%) Difference − 0.9%, 95% CI − 10.9% to 9.1% | — |
| Goldman 2014 | At 30 d: I = 50/347 (14%), C = 47/351 (13%) Difference 1%; 95% CI − 4% to 6% At 90 d: I = 89/347 (26%), C = 77/351 (22%) Difference 3.7%; 95% CI − 2.6% to 10% | Data provided by the trialists |
| Kennedy 1987 | At 1 week: At 8 weeks: | — |
| Lainscak 2013 | At 90 d: COPD− related I = 14/118 (12%), C = 33/135 (24%) Difference 12%; 95% CI 3% to 22% All‐cause readmission T = 25/118 (21%), C = 43/135 (32%) Difference 11%; 95% CI − 0.3% to 21% | Data provided by the trialists; data also available for 30− and 180− d |
| Laramee 2003 | At 90 d: Readmission days: | — |
| Moher 1992 | At 2 weeks: | — |
| Naylor 1994 | Within 45‐90 d: | Authors also report readmission data for 2‐6 weeks follow up |
| Nazareth 2001 | At 90 d: At 180 d: | — |
| Shaw 2000 | At 90 d: | Authors also report data for readmission due to non‐compliance with medication At 3 months: |
| Weinberger 1996 | Number of readmissions per month At 6 months: | Non‐parametric test used to calculate P values for monthly readmissions |
Comparison 2 Effect of discharge planning on unscheduled readmission rates, Outcome 3 Patients with a medical condition.
| Study | Readmission rates | Notes |
| Naylor 1994 | Within 6 to 12 weeks: | — |
Comparison 2 Effect of discharge planning on unscheduled readmission rates, Outcome 4 Patients who have had surgery.
| Study | Readmissions | Mean time to readmission |
| Naji 1999 | At 6 months: | Mean time to readmission T = 161 d, C = 153 d |
Comparison 2 Effect of discharge planning on unscheduled readmission rates, Outcome 5 Patients with a mental health diagnosis.
| Study | Days in hospital | Notes |
| Naylor 1994 | Medical readmission days 2 weeks: T = 21 d (n = 72), C = 73 d (n = 70) 2 to 6 weeks: T = 16 d (n = 72), C = 49 d (n = 70) 6 to 12 weeks: T = 94 d (n = 72), C = 100 d (n = 70) | |
| Weinberger 1996 | Medical readmission days at 6 months follow up: T = 10.2 (19.8), C = 8.8 (19.7) difference 1.4 d, P = 0.04 | — |
Comparison 3 Effect of discharge planning on days in hospital due to unscheduled readmission, Outcome 1 Patients with a medical condition.
| Study | Days in hospital | Notes |
| Evans 1993 | Readmission days at 9 months: | — |
| Hendriksen 1990 | T = 15.5 d per readmission | Not possible to calculate exact P |
| Rich 1993a | Days to first readmission Overall: T = 31.8 (5.1) (n = 63), C = 42.1 (7.3) (n = 35) | — |
Comparison 3 Effect of discharge planning on days in hospital due to unscheduled readmission, Outcome 2 Patients with a medical or surgical condition.
| Study | Days in hospital | Notes |
| Naylor 1994 | Surgical readmission days 2 weeks: T = 34 d (n = 68), C = 32 d (n = 66) 2 to 6 weeks: T = 63 (n = 68), C = 52 (n = 66) 6 to 12 weeks: T = 52 (n = 68), C = 26 (n = 66) | — |
Comparison 3 Effect of discharge planning on days in hospital due to unscheduled readmission, Outcome 3 Patients with a surgical condition.
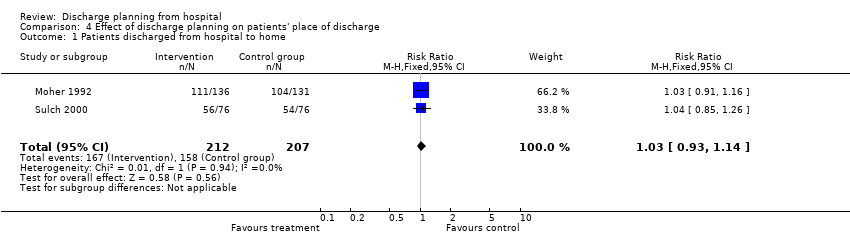
Comparison 4 Effect of discharge planning on patients' place of discharge, Outcome 1 Patients discharged from hospital to home.
| Study | Place of discharge | Notes |
| Goldman 2014 | Discharged to an institutional setting: T = 19/347 (5.5%), C = 9/352 (2.6%) Difference 2.9%; 95% CI − 0.04% to 6% | — |
| Kennedy 1987 | At 2 weeks: | No data shown |
| Legrain 2011 | Discharged home or to a nursing home: T = 183/317 C = 191/348 | — |
| Lindpaintner 2013 | Discharged home T = 25/30 (83%), C = 30/30 (100%) Difference 17%, 95% CI 2 to 34% | — |
| Moher 1992 | Discharged home: | — |
| Naughton 1994 | Discharged to nursing home: | — |
| Sulch 2000 | Discharged home: Discharged to an institution: | — |
Comparison 4 Effect of discharge planning on patients' place of discharge, Outcome 2 Patients with a medical condition.
| Study | Place of discharge | Notes |
| Evans 1993 | Discharged to home: Home at 9 months: | — |
| Hendriksen 1990 | Discharged to nursing home: At 6 months: admitted to another institution | — |
Comparison 4 Effect of discharge planning on patients' place of discharge, Outcome 3 Patients with a medical or surgical condition.

Comparison 4 Effect of discharge planning on patients' place of discharge, Outcome 4 Older patients admitted to hospital following a fall in residential care at 1 year.

Comparison 5 Effect of discharge planning on mortality, Outcome 1 Mortality at 6 to 9 months.
| Study | Mortality at 9 months | Notes |
| Evans 1993 | T = 66/417 (16%) | — |
Comparison 5 Effect of discharge planning on mortality, Outcome 2 Mortality for trials recruiting both patients with a medical condition and those recovering from surgery.
| Study | Mortality at 12 months | Notes |
| Gillespie 2009 | T: 57/182 (31%); C: 61/186 (33%) Difference − 2%, 95% CI − 11% to 8% | |
Comparison 5 Effect of discharge planning on mortality, Outcome 3 Mortality at 12 months.
| Study | Patient health outcomes | Notes |
| Harrison 2002 | SF‐36 Baseline Physical component T = 28.63 (SD 9.46) N = 78 Mental component T = 50.49 (SD 12.45) N = 78 At 12 weeks Physical component T = 32.05 (SD 11.81) N = 77 Mental component T = 53.94 (SD 12.32) N = 78 Minnesota Living with Heart Failure Questionnaire (MLHFQ) At 12 week follow‐up (See table 4) n, % Worse: T = 6/79 (8), C = 22/76 (29) | SF‐36 a higher score indicates better health status MLHFQ a lower score indicates less disability from symptoms |
| Kennedy 1987 | Long Term Care Information System (LTCIS) | No data reported |
| Lainscak 2013 | St. George’s Respiratory Change from 7 to 180 d after discharge T = 1.06 (95% CI 9.50 to 8.43), C = − 0.11 (95% CI − 11.34 to 8.12) | Complete data available for only approximately half of the patients. For the SGRQ, higher scores indicate more limitations; minimal clinically important difference estimated as 4 points. |
| Naylor 1994 | Data aggregated for both groups. Mean Enforced Social Dependency Scale increased from 19.6 to 26.3 P < 0.01 | No data reported for each group. Decline in functional status reported for all patients. Functional status. Scale measured:
Not possible to calculate exact P value |
| Nazareth 2001 | General well‐being questionnaire: 1 = ill health, 5 = good health At 6 months: Mean difference 0.10; 95% CI − 0.14 to 0.34 | — |
| Preen 2005 | SF‐12 (N not reported for follow‐up) Mental component score Predischarge score: T = 37.4 SD 5.4 7 d postdischarge: T = 42.4 SD 5.6 Physical component score Predischarge score: T = 27.8 SD 4.8 7 d postdischarge: T = 27.2 SD 4.5 | — |
| Rich 1995a | Chronic Heart Failure Questionnaire Treatment N = 67, Control N = 59 Total score At baseline: T = 72.1 (15.6), C = 74.4 (16.3) At 90 d: T = 94.3 (21.3), C = 85.7 (19.0) Change score = 22.1 (20.8), P = 0.001 Dyspnoea At baseline: T = 9.0 (7.9), C = 8.1 (7.7) At 90 d: T = 15.8 (12.8), C = 11.9 (10.0) Change score 6.8 (7.9) Fatigue At baseline: T = 12.9 (5.3), C = 14.1 (5.6) At 90 d: T = 18.3 (6.3), C = 16.8 (5.5) Change score 5.4 (5.5) Emotional function At baseline: T = 31.9 (8.5), C = 33.3 (8.1) At 90 d: T = 37.4 (7.8), C = 35.2 (8.4) Change score 5.6 (7.1) Environmental mastery At baseline: T = 18.3 (5.8), C = 18.9 (4.8) At 90 d: T = 22.7 (4.9), C = 21.7 (4.6) Change score 4.4 (5.3) | Chronic Heart Failure Questionnaire contains 20 questions that the patient is asked to rate on a scale 1 to 7 with a low score indicating poor quality of life |
| Sulch 2000 | Barthel activities of daily living At 4 weeks: At 12 weeks: At 26 weeks: Median change from 4 to 12 weeks: P < 0.01 Rankin score At 4 weeks: At 12 weeks: At 26 weeks: Hospital anxiety and depression scale At 4 weeks: At 12 weeks: At 26 weeks Depression At 4 weeks: At 12 weeks: At 26 weeks: EuroQol Median scores At 12 weeks: At 26 weeks: | The Barthel ADL Index covers activities of daily living; scores range from 0 to 20, with higher scores indicating better functioning. The Rankin scale assesses activities of daily living in people who have had a stroke; it contains 7 items with scores ranging from 0 to 6. Higher scores indicating more disability. The Hospital Anxiety and Depression Scale is a 14‐item Likert scale (0‐3); scores range from 0 to 21 for each subscale (anxiety and depression), with higher scores indicating more burden from symptoms. The EuroQol contains 5 items; higher scores indicate better self‐perceived health status. Not possible to calculate exact P value |
| Weinberger 1996 | At 1 month: no significant differences At 3 months: no significant differences | SF‐36 |
Comparison 6 Effect of discharge planning on patient health outcomes, Outcome 1 Patient‐reported outcomes: Patients with a medical condition.
| Study | Patient health outcomes | Notes |
| Lin 2009 | OARS Multidimensional Functional Assessment Questionnaire (Chinese version) at 3 months follow‐up Mean (SD) T = 16.92 (1.41) C = 16.83 (1.71) | 9 components, each component scored 0 to 2 with a total score range 0‐18.
|
| Lin 2009 | SF 36 Mean (SD) Physical aspects Pre‐test T: 74.09 (21.05), C: 68.15 (21.62) Post‐test T: 49.05 (16.27), C: 39.56 (16.76) Between group difference P = 0.09 Physical functioning Pre‐test T: 74.80 (25.15), C: 73.33 (18.04) Post‐test T: 55.77 (22.56), C: 51.46 (24.82) Between group difference P = 0.60 Role physical Pre‐test T: 66.34 (47.40), C: 65.63 (44.12) Post‐test T:16.34 (34.60), C: 12.50 (33.78) Between group difference P = 0.78 Bodily pain Pre‐test T: 88.15 (18.48), C: 77.08 (22.44) Post‐test T: 55.16 (23.20), C: 38.58 (27.68) Between group difference p=0.009 General health perceptions Pre‐test T: 67.03 (15.31), C: 56.54 (19.96) Post‐test T: 68.46 (16.55), C: 55.70 (22.23) Between group differences p=0.03 Mental aspects Pre‐test T: 74.49 (16.66), C: 68.24 (15.09) Post‐test T: 50.57 (18.72), C: 43.43 (17.28) Between group difference P = 0.09 Mental health Pre‐test T: 71.23 (12.18), C: 67.83 (12.28) Post‐test T: 22.30 (10.31), C: 20.00 (11.62) Between group difference P = 0.27 Role emotion Pre‐test T: 76.92 (40.84), C: 68.05 (41.10) Post‐test T: 52.56 (44.39), C: 54.16 (41.49) Between group difference P = 0.71 Social functioning Pre‐test T: 80.76 (15.09), C: 77.08 (15.93) Post test T: 61.01 (24.32), C: 45.83 (20.41) Between group difference P = 0.03 Vitality Pre‐test T: 69.03 (12.88), C: 60.00 (11.70) Post‐test T: 66.34 (16.94), C: 53.75 (21.93) Between group difference P = 0.004 | — |
| Naylor 1994 | No differences between groups reported | No data reported |
| Naylor 1994 | — | — |
Comparison 6 Effect of discharge planning on patient health outcomes, Outcome 2 Patient‐reported outcomes: Patients with a surgical condition.
| Study | Patient health outcomes | Notes |
| Evans 1993 | At 1 month: mean (SD) | Barthel score |
| Pardessus 2002 | Functional Autonomy Measurement System (SMAF) At 6 months: At 12 months: Katz ADL At 6 months: At 12 months: IADL At 6 months: At 12 months: | The SMAF scale assesses seven fields of activities of daily living. It has 22 items with scores ranging from 0 (total independence) to 87 (total dependence) The Katz ADL scale covers six ADLs, with scores ranging from 0 (totally dependent) to 6 (totally independent). |
Comparison 6 Effect of discharge planning on patient health outcomes, Outcome 3 Patient‐reported outcomes: Patients with a medical or surgical condition.

Comparison 6 Effect of discharge planning on patient health outcomes, Outcome 4 Falls at follow‐up: patients admitted to hospital following a fall.
| Study | Patient health outcomes | Notes |
| Naji 1999 | Hospital Anxiety Depression Scale Anxiety Depression Behavioural and Symptom Identification Scale Relation to self/other Depression/anxiety Daily living/role functioning Impulsive/addictive behaviour Psychosis Total symptom score | — |
Comparison 6 Effect of discharge planning on patient health outcomes, Outcome 5 Patient‐reported outcomes: Patients with a mental health diagnosis.
| Study | Satisfaction | Notes |
| Patient and care givers' satisfaction | ||
| Laramee 2003 | Mean hospital care: T = 4.2 (N = 120), C = 4.0 (N = 100), P = 0.003 Mean hospital discharge: T = 4.3 (N = 120), C = 4.0 (N = 100), P < 0.001 Mean care instructions: T = 4.0 (N = 120), C = 3.4 (N = 100), P < 0.001 Mean recovering at home: T = 4.4 (N = 120), C = 3.9 (N = 100), P < 0.001 Mean total score: T = 4.2 (N = 120), C = 3.8 (N = 100), P < 0.001 | — |
| Lindpaintner 2013 | Satisfaction with discharge process At 5 d (median and IQR) Patients: T = 1 (0), C = 1 (1‐2) Carers: T = 1 (0), C = 1 (1‐2) At 30 d Patients: T = 1 (1‐2), C = 1 (1‐2) Carers: T = 1 (1‐2), C = 2 (1‐3) | 4‐point Likert‐scale, lower scores indicate higher satisfaction |
| Moher 1992 | Satisfied with medical care: | "Please rate how satisfied you were with the care you received…" Subgroup of 40 patients, responses from 18 in the treatment group and 21 in the control group |
| Nazareth 2001 | Client satisfaction questionnaire score (1 = dissatisfied, 4 = satisfied) At 3 months: At 6 months: | |
| Weinberger 1996 | At 1 month: At 6 months: Authors report differences were greatest for patients' perceptions of continuity of care and non‐financial access to medical care | Patient Satisfaction Questionnaire, 11 domains with a 5‐point scale |
| Professional's satisfaction | ||
| Bolas 2004 | Standard of information at discharge improved GPs: 57% agreed Community pharmacists: 95% agreed | Response rate of 55% (GPs) and 56% (community pharmacists) No information provided about the survey |
| Lindpaintner 2013 | Satisfaction with discharge process At 5 d (median and IQR) Primary care physician: T = 1 (1‐2), C = 2 (1‐3) Visiting nurse: T = 1 (1‐2), C = 2 (1‐4) At 30 d (median and IQR) Primary care physician: T = 2 (1‐3), C = 1 (1‐2) | Number of respondents ranged between 15 (visiting nurse) and 30 (PCP) 4‐point Likert scale, lower scores indicate higher satisfaction |
Comparison 7 Effect of discharge planning on satisfaction with care process, Outcome 1 Satisfaction.
| Study | Costs | Notes |
| Gillespie 2009 | Total T: USD 12000; C: USD 12500 Mean difference: − USD 400 (− USD 4000 to USD 3200) Visits to ED T: USD 160; C: USD 260 Mean difference: − USD 100 (− USD 220 to − USD 10) Readmissions T: USD 12000; C: USD 12300 Mean difference: − USD 300 (− USD 3900 to USD 3300) | Costs calculated for 2008 |
| Laramee 2003 | Total inpatient and outpatient median costs P = 0.14 | The case manager (CM) kept a log during the first, middle and last 4 weeks of the recruitment period of how much time was spent with each patient during the 12‐week study period. Thus, |
| Naughton 1994 | — | Number: |
| Naylor 1994 | Initial stay mean charges (USD): Medical readmission total charges in USD (CIs are in thousands): At 2 weeks: 2‐6 weeks: 6‐12 weeks: | Charge data were used to calculate the cost of the initial hospitalisation Readmission costs were calculated using the mean charge per day of the index hospitalisations times the actual number of days of subsequent hospitalisations, as patients were readmitted to a variety of hospitals with a wide range of charges Total charges including readmission charges (first readmission only if multiple readmissions) |
| Rich 1995a | Intervention cost USD 216 per patient Caregiver cost T = USD 1164, C = USD 828 Other medical care T = USD 1257, C = USD 1211 Readmission costs T = USD 2178, C = USD 3236 All costs T = USD 4815, C = USD 5275 | — |
Comparison 8 Effect of discharge planning on hospital care costs, Outcome 1 Patients with a medical condition.
| Study | Costs | Notes |
| Naylor 1994 | Surgical initial stay mean charges (USD): At 2 weeks: 2‐6 weeks: 6‐12 weeks: | Charge data were used to calculate the cost of the initial hospitalisation |
Comparison 8 Effect of discharge planning on hospital care costs, Outcome 2 Patients with a surgical condition.
| Study | Costs | Notes |
| Naji 1999 | T = an additional GBP 1.14 per patient Intervention can avert 3 outpatient appointments for every 10 patients | Telephone calls: T = 124/168 (86%), C = 19/175 (12%) |
Comparison 8 Effect of discharge planning on hospital care costs, Outcome 3 Patients with a mental health diagnosis.
| Study | Costs | Notes |
| Jack 2009 | — | Follow‐up PCP appointments were given an estimated cost of USD 55, on the basis of costs from an average hospital follow‐up visit at Boston Medical Center |
| Legrain 2011 | The cost savings balanced against the cost of the intervention reported to be EUR 519/patient | — |
| Legrain 2011 | Total cost of adverse drug reactions‐related admissions (180 days follow‐up) T = USD 487/participant C = USD 1184/participant P = 0.13 | — |
Comparison 8 Effect of discharge planning on hospital care costs, Outcome 4 Patients admitted to a general medical service.
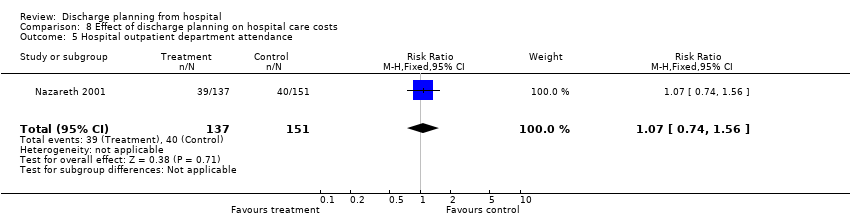
Comparison 8 Effect of discharge planning on hospital care costs, Outcome 5 Hospital outpatient department attendance.

Comparison 8 Effect of discharge planning on hospital care costs, Outcome 6 First visits to the emergency room.
| Study | Use of services | Notes |
| Farris 2014 | Unscheduled office visits At 30 d T = 31/281 (11%), C = 32/294 (11%) Difference 0%; 95% CI − 5% to 5% At 90 d T = 42/281 (15%), C = 33/294 (11%) Difference 4%; 95% CI − 2 to 9% | Results for Enhanced vs Control intervention (results for minimal intervention not reported) |
| Goldman 2014 | Primary care visits at 30 d T = 189/301 (62.8%), C = 186/316 (58.9%) Difference 4%; 95% CI − 3.7% to 11.5% | — |
| Laramee 2003 | Visiting Nurse postdischarge: | — |
| Nazareth 2001 | General practice attendance: At 3 months: At 6 months: | — |
| Weinberger 1996 | Median time from hospital discharge to the first visit: Visit at least one general medicine clinic in 6‐month follow up: Mean number of visits to general medical clinic: | — |
Comparison 9 Effect of discharge planning on primary and community care costs, Outcome 1 Patients with a medical condition.
| Study | Number of problems | Notes |
| Bolas 2004 | Intervention group demonstrated a higher rate of reconciliation of patient's own drugs with the discharge prescription; 90% compared to the 44% in the control group | — |
| Shaw 2000 | Mean number of problems (SD) At 1 week: At 4 weeks: At 12 weeks: | Problems included difficulty obtaining a prescription from the GP; insufficient knowledge about medication; non‐compliance |
Comparison 10 Effect of discharge planning on medication use, Outcome 1 Medication problems after being discharged from hospital.
| Study | Adherence to medicines | Notes |
| Nazareth 2001 | At 3 months: At 6 months: | 0 = none |
| Rich 1995a | Taking 80% or more of prescribed pills at 30 d after discharge T = 117/142 (82.5%), C = 91/140 (64.9%) | — |
Comparison 10 Effect of discharge planning on medication use, Outcome 2 Adherence to medicines.
| Study | Knowledge | Notes |
| Bolas 2004 | Mean error rate in knowledge of drug therapy at 10‐14 d follow up Drug name T = 15%, C = 43%, P < 0.001 Drug dose T = 14%, C = 39%, P < 0.001 Frequency T = 15%, C = 39%, P < 0.001 (n for each group not reported) | — |
| Nazareth 2001 | At 3 months: At 6 months: | 0 = none |
| Shaw 2000 | At 1 and 12 weeks post‐discharge: Significant improvement in knowledge medication for both groups (no differences between groups) | — |
Comparison 10 Effect of discharge planning on medication use, Outcome 3 Knowledge about medicines.
| Study | Hoarding | Notes |
| Bolas 2004 | 90% of people who brought drugs to the hospital were returned in the intervention group compared to 50% in the controls | — |
| Nazareth 2001 | At 3 months: At 6 months | 0 = none |
Comparison 10 Effect of discharge planning on medication use, Outcome 4 Hoarding of medicines.
| Study | |
| Eggink 2010 | Following a review of medication by a pharmacist, 68% in the control group had at least one discrepancy or medication error compared to 39% in the intervention group (RR 0.57; 95% CI 0.37 to 0.88). The percent of medications with a discrepancy or error in the intervention group was 6.1% in intervention group and 14.6% in the control group (RR = 0.42; 0.27 to 0.66). |
| Kripalani 2012 | Clinically important medication errors (total number of events; could be more than one per patient) At 30 d T = 370/423, M = 0.87 (SD 1.18) C = 407/428, M = 0.95 (SD 1.36) |
Comparison 10 Effect of discharge planning on medication use, Outcome 5 Prescription errors.
| Study | Medication appropriateness | Notes |
| Farris 2014 | Discharge T = 7.1 (SD 7.0), C = 6.1 (SD 6.6) 30 d post‐discharge T = 10.1 (SD 8.9), C = 9.6 (SD 9.5) P = 0.78 90 d post‐discharge T = 11.6 (SD 10.5), C = 11.1 (11.3) P = 0.94 | As measured by the medication appropriateness index (MAI); summed MAI per participant Results for Enhanced v Control intervention (results for minimal intervention not reported) |
Comparison 10 Effect of discharge planning on medication use, Outcome 6 Medication appropriateness.
| Effect of discharge planning on patients admitted to hospital with a medical condition | ||||||
| Patient or population: patients admitted to hospital | ||||||
| Outcomes | Illustrative comparative risks* (95% CI) | Relative effect | No. of participants | Certainty of the evidence | Comments | |
| Assumed risk | Corresponding risk | |||||
| Without discharge planning | With discharge planning | |||||
| Unscheduled readmission within 3 months of discharge from hospital | Study population admitted with a medical condition | RR 0.87 | 4743 | ⊕⊕⊕⊝ | — | |
| 254 per 1000 | 221 per 1000 | |||||
| Moderate risk population | ||||||
| 285 per 1000 | 248 per 1000 | |||||
| Study population admitted following a fall | RR 1.36 (0.46 to 4.01) | 110 (2) | ⊕⊝⊝⊝ very lowb | — | ||
| 93 per 1000 | 126 per 1000 (43 to 371) | |||||
| Moderate risk population | ||||||
| 92 per 1000 | 125 per 1000 (42 to 369) | |||||
| Hospital length of stay | Study population admitted with a medical condition | — | 2193 | ⊕⊕⊕⊝ | — | |
| The mean hospital length of stay ranged across control groups from | The mean hospital length of stay in the intervention groups was | |||||
| Satisfaction | Discharge planning may lead to increased satisfaction for patients and healthcare professionals. | 6 studies | ⊕⊕⊝⊝ low | Patient satisfaction was measured in different ways, and findings were not consistent across studies. Only 6/30 studies reported data for this outcome. | ||
| Costs | A lower readmission rate for those receiving discharge planning may be associated with lower health service costs in the short term. Differences in use of primary care varied. | 5 studies | ⊕⊝⊝⊝ very low | Findings were inconsistent. Healthcare resources that were assessed varied among studies, e.g., primary care visits, readmission, length of stay, laboratory services, medication, diagnostic imaging. The charges used to cost the healthcare resources also varied. | ||
| *The basis for the assumed risk (e.g. the median control group risk across studies) is provided in footnotes. The corresponding risk (and its 95% confidence interval) is based on the assumed risk in the comparison group and the relative effect of the intervention (and its 95% CI). | ||||||
| GRADE Working Group grades of evidence | ||||||
| aThe evidence was downgraded to moderate as allocation concealment was unclear for 5 of the 15 trials. | ||||||
| Outcome or subgroup title | No. of studies | No. of participants | Statistical method | Effect size |
| 1 Hospital length of stay ‐ older patients with a medical condition Show forest plot | 12 | 2193 | Mean Difference (IV, Fixed, 95% CI) | ‐0.73 [‐1.33, ‐0.12] |
| 2 Sensitivity analysis imputing missing SD for Kennedy trial Show forest plot | 11 | 1825 | Mean Difference (IV, Fixed, 95% CI) | ‐0.98 [‐1.57, ‐0.38] |
| 3 Hospital length of stay ‐ older surgical patients Show forest plot | 2 | 184 | Mean Difference (IV, Fixed, 95% CI) | ‐0.06 [‐1.23, 1.11] |
| 4 Hospital length of stay ‐ older medical and surgical patients Show forest plot | 2 | 1108 | Mean Difference (IV, Fixed, 95% CI) | ‐0.60 [‐2.38, 1.18] |
| Outcome or subgroup title | No. of studies | No. of participants | Statistical method | Effect size |
| 1 Within 3 months of discharge from hospital Show forest plot | 17 | 4853 | Risk Ratio (M‐H, Fixed, 95% CI) | 0.88 [0.79, 0.97] |
| 1.1 Unscheduled readmission for those with a medical condition | 15 | 4743 | Risk Ratio (M‐H, Fixed, 95% CI) | 0.87 [0.79, 0.97] |
| 1.2 Older people admitted to hospital following a fall | 2 | 110 | Risk Ratio (M‐H, Fixed, 95% CI) | 1.36 [0.46, 4.01] |
| 2 Patients with medical or surgical condition Show forest plot | Other data | No numeric data | ||
| 3 Patients with a medical condition Show forest plot | Other data | No numeric data | ||
| 4 Patients who have had surgery Show forest plot | Other data | No numeric data | ||
| 5 Patients with a mental health diagnosis Show forest plot | Other data | No numeric data | ||
| Outcome or subgroup title | No. of studies | No. of participants | Statistical method | Effect size |
| 1 Patients with a medical condition Show forest plot | Other data | No numeric data | ||
| 2 Patients with a medical or surgical condition Show forest plot | Other data | No numeric data | ||
| 3 Patients with a surgical condition Show forest plot | Other data | No numeric data | ||
| Outcome or subgroup title | No. of studies | No. of participants | Statistical method | Effect size |
| 1 Patients discharged from hospital to home Show forest plot | 2 | 419 | Risk Ratio (M‐H, Fixed, 95% CI) | 1.03 [0.93, 1.14] |
| 2 Patients with a medical condition Show forest plot | Other data | No numeric data | ||
| 3 Patients with a medical or surgical condition Show forest plot | Other data | No numeric data | ||
| 4 Older patients admitted to hospital following a fall in residential care at 1 year Show forest plot | 1 | 60 | Odds Ratio (M‐H, Fixed, 95% CI) | 0.46 [0.15, 1.40] |
| Outcome or subgroup title | No. of studies | No. of participants | Statistical method | Effect size |
| 1 Mortality at 6 to 9 months Show forest plot | 8 | 2654 | Risk Ratio (M‐H, Fixed, 95% CI) | 1.02 [0.83, 1.27] |
| 1.1 Older people with a medical condition | 7 | 2594 | Risk Ratio (M‐H, Fixed, 95% CI) | 1.02 [0.82, 1.27] |
| 1.2 Older people admitted to hospital following a fall | 1 | 60 | Risk Ratio (M‐H, Fixed, 95% CI) | 1.33 [0.33, 5.45] |
| 2 Mortality for trials recruiting both patients with a medical condition and those recovering from surgery Show forest plot | Other data | No numeric data | ||
| 3 Mortality at 12 months Show forest plot | Other data | No numeric data | ||
| Outcome or subgroup title | No. of studies | No. of participants | Statistical method | Effect size |
| 1 Patient‐reported outcomes: Patients with a medical condition Show forest plot | Other data | No numeric data | ||
| 2 Patient‐reported outcomes: Patients with a surgical condition Show forest plot | Other data | No numeric data | ||
| 3 Patient‐reported outcomes: Patients with a medical or surgical condition Show forest plot | Other data | No numeric data | ||
| 4 Falls at follow‐up: patients admitted to hospital following a fall Show forest plot | 1 | 60 | Risk Ratio (M‐H, Fixed, 95% CI) | 0.87 [0.50, 1.49] |
| 5 Patient‐reported outcomes: Patients with a mental health diagnosis Show forest plot | Other data | No numeric data | ||
| Outcome or subgroup title | No. of studies | No. of participants | Statistical method | Effect size |
| 1 Satisfaction Show forest plot | Other data | No numeric data | ||
| 1.1 Patient and care givers' satisfaction | Other data | No numeric data | ||
| 1.2 Professional's satisfaction | Other data | No numeric data | ||
| Outcome or subgroup title | No. of studies | No. of participants | Statistical method | Effect size |
| 1 Patients with a medical condition Show forest plot | Other data | No numeric data | ||
| 2 Patients with a surgical condition Show forest plot | Other data | No numeric data | ||
| 3 Patients with a mental health diagnosis Show forest plot | Other data | No numeric data | ||
| 4 Patients admitted to a general medical service Show forest plot | Other data | No numeric data | ||
| 5 Hospital outpatient department attendance Show forest plot | 1 | 288 | Risk Ratio (M‐H, Fixed, 95% CI) | 1.07 [0.74, 1.56] |
| 6 First visits to the emergency room Show forest plot | 2 | 740 | Risk Ratio (M‐H, Fixed, 95% CI) | 0.80 [0.61, 1.07] |
| Outcome or subgroup title | No. of studies | No. of participants | Statistical method | Effect size |
| 1 Patients with a medical condition Show forest plot | Other data | No numeric data | ||
| Outcome or subgroup title | No. of studies | No. of participants | Statistical method | Effect size |
| 1 Medication problems after being discharged from hospital Show forest plot | Other data | No numeric data | ||
| 2 Adherence to medicines Show forest plot | Other data | No numeric data | ||
| 3 Knowledge about medicines Show forest plot | Other data | No numeric data | ||
| 4 Hoarding of medicines Show forest plot | Other data | No numeric data | ||
| 5 Prescription errors Show forest plot | Other data | No numeric data | ||
| 6 Medication appropriateness Show forest plot | Other data | No numeric data | ||