La planification de la sortie de l'hôpital
Résumé scientifique
Contexte
La planification de la sortie est un élément courant des systèmes de santé dans de nombreux pays. L'objectif de la planification de la sortie est de réduire la durée du séjour à l'hôpital et les réadmissions imprévues et d'améliorer la coordination des services suite à la sortie de hospital. Cet article est la troisième mise à jour de la revue originale.
Objectifs
Évaluer l'efficacité de la sortie de l'hôpital réalisée avec un plan individualisé aux patients.
Stratégie de recherche documentaire
Nous avons mis à jour la revue en utilisant le registre Cochrane des essais contrôlés (CENTRAL) (2015, numéro 9), MEDLINE, EMBASE, CINAHL, le Social Science Citation Index (dernière recherche en octobre 2015), et le registre des essais du US National Institutes of Health (ClinicalTrials.gov).
Critères de sélection
Les essais contrôlés randomisés (ECR) comparant un plan de sortie individualisé à une sortie ordinaire de l'hôpital sans plan individualisé aux participants. Les participants étaient des patients hospitalisés.
Recueil et analyse des données
Deux auteurs ont, de manière indépendante, effectué une analyse des données et évalué la qualité à l'aide d'un formulaire d'extraction des données prédéfini. Nous avons regroupé les études selon les groupes de patients (les patients âgés ayant une affection médicale, les patients en cours de rétablissement suite à une chirurgie, et ceux ayant de multiples affections diverses) et selon les résultats. Nous avons effectué nos analyses statistiques selon le principe de l'intention de traiter, en calculant le risque relatif (RR) pour les résultats dichotomiques et les différences moyennes (DM) pour les données continues en utilisant une méta‐analyse à effets fixes. Lorsque la combinaison des données de résultat n'était pas possible en raison de différences dans les rapports des résultats, nous avons résumé les données rapportées de manière narrative.
Résultats principaux
Nous avons inclus 30 essais (11 964 participants), dont six identifiés dans cette mise à jour. Vingt‐et‐un essais ont recruté des participants âgés ayant un problème médical, cinq ont recruté des participants présentant des problèmes médicaux et chirurgicaux, un essai a recruté des participants provenant d'un hôpital psychiatrique, un essai a réalisé des recrutements à la fois dans un hôpital psychiatrique et dans un hôpital général, et deux essais ont recruté des participants hospitalisés suite à une chute. La durée du séjour à l'hôpital et les réadmissions à l'hôpital étaient réduites chez les participants admis à l'hôpital avec un diagnostic médical et ayant été assignés à la planification de la sortie (DM de la durée d'hospitalisation −0,73, IC à 95 % −1,33 à −0,12, 12 essais, preuves de certitude modérée ; taux de réadmissions, RR 0,87, IC à 95 % 0,79 à 0,97, 15 essais, preuves de certitude modérée). On ignore si la planification de la sortie réduit le taux de réadmissions pour les patients hospitalisés suite à une chute (RR 1,36, IC à 95 % 0,46 à 4,01, 2 essais, preuves de très faible certitude). Pour les patients âgés ayant une affection médicale, il n'y avait que peu ou pas de différences entre les groupes pour la mortalité (RR 0,99, IC à 95 % de 0,79 à 1,24, certitude modérée). Il y avait également peu de preuves concernant la mortalité pour les participants en rétablissement suite à une chirurgie ou ayant un ensemble de problèmes à la fois médicaux et chirurgicaux. La planification de la sortie peut conduire à une augmentation de la satisfaction des patients et des professionnels de la santé (preuves de faible certitude, six essais). On ignore s'il existe une différence concernant le coût des soins lorsque la planification de la sortie est mise en œuvre avec les patients ayant une affection médicale (preuves de très faible certitude, cinq essais).
Conclusions des auteurs
Un plan de sortie adapté à chaque patient mène probablement à une légère réduction de la durée de séjour à l'hôpital et réduit le risque de réadmission à l'hôpital après trois mois de suivi pour les personnes âgées ayant une affection médicale. La planification de la sortie peut conduire à une augmentation de la satisfaction vis‐à‐vis des soins pour les patients et les professionnels. Il existe peu de preuves indiquant que la planification de la sortie réduit les coûts pour les services de santé.
PICO
Résumé simplifié
La planification de la sortie de l'hôpital
Contexte
La planification de la sortie correspond au développement d'un plan individualisé pour chaque patient quittant l'hôpital, dans le but de limiter les coûts et d'améliorer les résultats pour les patients. La planification de la sortie devrait permettre de s'assurer que les patients quittent l'hôpital au bon moment dans leur prise en charge et que les futures prestations de soins soient organisées suffisamment à l'avance.
Objectifs
Nous avons systématiquement recherché des études afin de déterminer l'effet du développement de plans personnalisés pour les patients quittant l'hôpital. Cette revue est la troisième mise à jour de l'article original.
Principaux résultats
Nous avons trouvé 30 études comparant des plans de sortie personnalisés par rapport à une préparation standard pour la sortie de l'hôpital. Vingt de ces études incluaient des personnes âgées.
Conclusions des auteurs
Cette revue indique qu'un plan de sortie personnalisé mène probablement à une légère réduction de la durée de séjour à l'hôpital (différence moyenne de −0,73 jours) et des taux de réadmission pour les patients âgés ayant été admis à l'hôpital avec une affection médicale, et peuvent augmenter la satisfaction des patients. Le plan de sortie personnalisé peut également accroître la satisfaction des professionnels, bien qu'il n'existe que peu de preuves pour soutenir cette observation. Il n'est pas clairement établi si la planification de la sortie réduit les coûts pour les services de santé.
Authors' conclusions
Summary of findings
| Effect of discharge planning on patients admitted to hospital with a medical condition | ||||||
| Patient or population: patients admitted to hospital | ||||||
| Outcomes | Illustrative comparative risks* (95% CI) | Relative effect | No. of participants | Certainty of the evidence | Comments | |
| Assumed risk | Corresponding risk | |||||
| Without discharge planning | With discharge planning | |||||
| Unscheduled readmission within 3 months of discharge from hospital | Study population admitted with a medical condition | RR 0.87 | 4743 | ⊕⊕⊕⊝ | — | |
| 254 per 1000 | 221 per 1000 | |||||
| Moderate risk population | ||||||
| 285 per 1000 | 248 per 1000 | |||||
| Study population admitted following a fall | RR 1.36 (0.46 to 4.01) | 110 (2) | ⊕⊝⊝⊝ very lowb | — | ||
| 93 per 1000 | 126 per 1000 (43 to 371) | |||||
| Moderate risk population | ||||||
| 92 per 1000 | 125 per 1000 (42 to 369) | |||||
| Hospital length of stay | Study population admitted with a medical condition | — | 2193 | ⊕⊕⊕⊝ | — | |
| The mean hospital length of stay ranged across control groups from | The mean hospital length of stay in the intervention groups was | |||||
| Satisfaction | Discharge planning may lead to increased satisfaction for patients and healthcare professionals. | 6 studies | ⊕⊕⊝⊝ low | Patient satisfaction was measured in different ways, and findings were not consistent across studies. Only 6/30 studies reported data for this outcome. | ||
| Costs | A lower readmission rate for those receiving discharge planning may be associated with lower health service costs in the short term. Differences in use of primary care varied. | 5 studies | ⊕⊝⊝⊝ very low | Findings were inconsistent. Healthcare resources that were assessed varied among studies, e.g., primary care visits, readmission, length of stay, laboratory services, medication, diagnostic imaging. The charges used to cost the healthcare resources also varied. | ||
| *The basis for the assumed risk (e.g. the median control group risk across studies) is provided in footnotes. The corresponding risk (and its 95% confidence interval) is based on the assumed risk in the comparison group and the relative effect of the intervention (and its 95% CI). | ||||||
| GRADE Working Group grades of evidence | ||||||
| aThe evidence was downgraded to moderate as allocation concealment was unclear for 5 of the 15 trials. | ||||||
Background
Cost containment strategies that aim to limit healthcare‐related costs while still promoting quality are a feature of all healthcare systems, especially for acute hospital services (Bodenheimer 2005). Recent trends include specifically targeting those patients who incur greater healthcare expenditures, decreasing the length of stay for inpatient care, reducing the number of long‐stay beds, moving care into the community, increasing the use of day surgery, providing increased levels of acute care at home ('hospital at home') and implementing policies such as discharge planning.
There is evidence to suggest that discharge planning (i.e. an individualised plan for a patient prior to them leaving hospital for home) combined with additional postdischarge support can reduce unplanned readmission to hospital for patients with congestive heart failure (Phillips 2004). A reduction in readmissions will decrease inpatient costs; however, this reduction in costs may be offset by an increase in the provision of community services as a result of planning. In the United States, unplanned hospitalisations accounted for 17% of all Medicare hospital payments in 2004, and one quarter of all hospital admissions were 30‐day readmissions (Jencks 2009). Even a small reduction in readmission rates could have a substantial financial impact (Burgess 2014).
Description of the condition
It has been estimated that one‐fifth of all hospital discharges are delayed for non‐medical reasons (McDonagh 2000). Despite recent advances in electronic records, patient pathways and technology‐assisted decision support, the following three factors, identified over 30 years ago (Barker 1985), remain causes of delayed discharge from hospital (Dept of Health 2003): inadequate patient assessment by health professionals, resulting in problems such as poor knowledge of the patient's social circumstances and poor organisation of postdischarge health and social care; the late booking of transport services to take a patient home, which prevents timely discharge from hospital; and poor communication between the hospital, follow‐up care and community service providers. Organisational factors, including the number of times a patient is moved while in hospital and the discharge arrangements, are more strongly associated with delayed discharge than patient factors such as functional limitations or cognitive function (Challis 2014). The transition of patients from hospital to postdischarge healthcare, residential or the home setting has the potential to disrupt continuity of care and may increase the risk of an adverse event due to an inadequate planning of a patient's discharge (Kripalani 2007). Poor communication between the secondary care and the postdischarge setting can result in key clinical information not reaching primary care providers, with patients remaining unaware of information that might help them manage their condition and prepare for discharge from hospital.
Description of the intervention
Discharge planning is the development of an individualised discharge plan for a patient prior to them leaving hospital for home. The discharge plan can be a stand‐alone intervention or may be embedded within another intervention, for example, as a component of stroke unit care or as part of the comprehensive geriatric assessment process (Ellis 2011; Langhorne 2002; Rubenstein 1984). Discharge planning may also extend across healthcare settings and include postdischarge support (Parker 2002; Phillips 2004).
How the intervention might work
The aim of discharge planning is to improve the efficiency and quality of healthcare delivery by reducing delayed discharge from hospital, facilitating the transition of patients from a hospital to a postdischarge setting, providing patients with information about their condition and, if required, postdischarge healthcare. Discharge planning may contain costs and improve patient outcomes. For example, discharge planning may influence both the hospital length of stay and the pattern of care within the community, including the follow‐up rate and outpatient assessment, by bridging the gap between hospital and home (Balaban 2008).
Why it is important to do this review
The emphasis placed on discharge planning varies between countries. In the USA, discharge planning is mandatory for hospitals participating in the Medicare and Medicaid programmes. In the UK, the Department of Health has published guidance on discharge practice for health and social care (Dept of Health 2010). Clinical guidance issued by professional bodies in the UK (Future Hospital Comission 2013), the USA (Dept Health Human Services 2013), Australia (Aus NZ Soc Geriat Med 2008) and Canada (Health Qual Ontario 2013), all highlight the importance of planning discharge as soon as the patient is admitted, involving a multidisciplinary team to provide a thorough assessment, establishing continuous communication with the patient and the care givers, working towards shared decision‐making and self‐management, and liaising with health and social services in the community—particularly primary care. However, procedures may vary between specialities and healthcare professionals in the same hospital (Ubbink 2014). We have conducted a systematic review of discharge planning to categorise the different types of study populations and discharge plans being implemented, and to assess the effectiveness of organising services in this way. The focus of this review is the effectiveness of discharge planning implemented in an acute hospital setting. This is the third update of the original review.
Objectives
The main objective was to assess the effectiveness of planning the discharge of individual patients moving from hospital.
The specific objectives were as follow:
Does discharge planning improve the appropriate use of acute care
-
Effect of discharge planning on length of stay in hospital compared to usual care.
-
Effect of discharge planning on unscheduled readmission rates compared to usual care
-
Effect of discharge planning on other process variables: patients' place of discharge.
Does discharge planning improve or (at least) have no adverse effect on patient outcome?
-
Effect of discharge planning on mortality rate compared to usual care.
-
Effect of discharge planning on patient health outcomes compared to usual care.
-
Effect of discharge planning on the incidence of complications related to the initial admission compared to usual care.
-
Effect of discharge planning on the satisfaction of patient, care givers and healthcare professionals compared to usual care.
Does discharge planning reduce overall costs of healthcare?
-
Effect of discharge planning on hospital care costs compared to usual care.
-
Effect of discharge planning on community care costs compared to usual care.
-
Effect of discharge planning on overall costs of healthcare compared to usual care.
-
Effect of discharge planning on the use of medication.
Methods
Criteria for considering studies for this review
Types of studies
Randomised controlled trials.
Types of participants
All patients in hospital (acute, rehabilitation or community) irrespective of age, gender or condition.
Types of interventions
We defined discharge planning as the development of an individualised discharge plan for a patient prior to them leaving hospital for home or residential care. Where possible, we divided the process of discharge planning according to the steps identified by Marks 1994:
-
pre‐admission assessment (where possible);
-
case finding on admission;
-
inpatient assessment and preparation of a discharge plan based on individual patient needs, for example a multidisciplinary assessment involving the patient and their family, and communication between relevant professionals within the hospital;
-
implementation of the discharge plan, which should be consistent with the assessment and requires documentation of the discharge process;
-
monitoring in the form of an audit to assess if the discharge plan was implemented.
We excluded studies from the review if they did not include an assessment or implementation phase in discharge planning; if it was not possible to separate the effects of discharge planning from the other components of a multifaceted intervention or if discharge planning appeared to be a minor part of a multifaceted intervention; or if the focus was on the provision of care after discharge from hospital. We excluded interventions where the focus was on the provision of care after discharge from hospital, and those in which discharge planning was part of a larger package of care but the process and components were poorly described.
The control group had to receive standard care with no individualised discharge plan.
Types of outcome measures
We addressed the effect of discharge planning across several areas: the use of acute care, patient outcomes and healthcare costs.
Main outcomes
-
Length of stay in hospital
-
Readmission rate to hospital
Other outcomes
-
Complications related to the initial admission
-
Place of discharge
-
Mortality rate
-
Patient health status, including psychological health
-
Patient satisfaction
-
Care giver and healthcare professional satisfaction
-
Psychological health of care givers
-
Healthcare costs of discharge planning
-
Hospital care costs and use
-
Primary and community care cost
-
-
The use of medication for trials evaluating a pharmacy discharge plan
Search methods for identification of studies
Electronic searches
We searched the following databases: the Cochrane Central Register of Controlled Trials (CENTRAL) (2015, Issue 9), the Cochrane Effective Practice and Organisation of Care (EPOC) Group Register (March 2009), MEDLINE via OvidSP (1946 to October 2015), EMBASE via OvidSP (1974 to October 2015), CINAHL via EbscoHOST (1980 to October 2015), Social Science Citation Index via ISI Web of Knowledge (1975 to October 2015), EconLit (1969 to 1996), SIGLE (grey literature) (1980 to 1996), PsycLIT (1974 to 1996) and PsycINFO (2012 to October 2015). We detail the search strategies for this update in Appendix 1.
Searching other resources
We checked the reference lists of included studies and related systematic reviews using PDQ‐Evidence (PDQ‐Evidence 2015). We handsearched the US National Institutes of Health trial register (ClinicalTrials.gov 2015) and reviewed the reference lists of all included studies. When necessary, we contacted individual trialists to clarify issues and to identify unpublished data.
Data collection and analysis
For this update we followed the same methods defined in the protocol and used in previous versions of this systematic review. Risk of bias of each included study was assessed using the Cochrane Risk of Bias criteria. We created a summary of findings table using the following outcomes: unscheduled hospital readmission, hospital length of stay, satisfaction and costs. We used the five GRADE considerations (study limitations, consistency of effect, imprecision, indirectness, and risk of bias) to assess the certainty of the evidence as it relates to the main outcomes (Guyatt 2008). We used methods and recommendations described in Section 8.5 and Chapter 12 of the Cochrane Handbook (Higgins 2011). We justified all decisions to down‐ or up‐grade the certainty of evidence using footnotes to aid readers' understanding of the review where necessary.
Selection of studies
For this update, two authors (of DCGB, IC, NL and LC) read all the abstracts in the records retrieved by the electronic searches to identify publications that appeared to be eligible for this review. Two authors (of DCGB, IC, NL and LC) then independently assessed the full text of all potentially relevant papers in order to select studies for inclusion. We settled any disagreements by discussion, or by liaising with SS.
We excluded trials when discharge planning was part of a broader package of inpatient care. We made a post hoc decision to exclude any studies that did not describe the study design or did not report results for the control group. We report details of why we excluded studies in the 'Characteristics of excluded studies' table.
Data extraction and management
For this update, two authors working independently (of DCGB, IC, NL and LC) extracted data from each article. For the original review and two subsequent updates, we used a data extraction form developed by EPOC, modified and amended for the purposes of this review. For the current version of the review we used an adapted version of the Cochrane good practice extraction form (EPOC 2015). We extracted information on study characteristics (first author, year of publication, aim, setting, design, unit of allocation, duration, ethical approval, funding sources), participant characteristics (method of recruitment, inclusion/exclusion criteria, total number, withdrawals and drop‐outs, socio‐demographic indicators, subgroups), intervention (setting, pre‐admission assessment, case finding on admission, inpatient assessment and preparation of discharge plan, implementation of discharge plan, monitoring phase, and comparison), and outcomes.
Assessment of risk of bias in included studies
We assessed the quality of the selected trials using the criteria presented in the Cochrane Handbook for Systematic Reviews of Interventions (Higgins 2011): random sequence generation, allocation concealment, blinding, incomplete outcome data, selective reporting, and baseline data. For this update, two reviewers (of DCGB, IC, NL and LC) independently assessed the risk of bias. We resolved disagreements by discussing each case with a third reviewer (SS).
Unit of analysis issues
All the included studies were parallel RCTs, where participants were individually allocated to the treatment or control groups.
Dealing with missing data
We contacted investigators for missing data; for this update two provided unpublished data (Goldman 2014; Lainscak 2013).
Assessment of heterogeneity
We quantified heterogeneity among trials using the I2 statistic and Cochrane's Q test (Cochrane 1954). The I2 statistic quantifies the percentage of the total variation across studies that is due to heterogeneity rather than chance (Higgins 2003); smaller percentages suggest less observed heterogeneity.
Data synthesis
The primary analysis was a comparison of discharge planning versus routine discharge care for each outcome listed in Types of outcome measures. We calculated risk ratios (RR) for the dichotomous outcomes mortality, unscheduled readmission and discharge destination, with 95% confidence intervals (CI) for all point estimates; and combined data using the fixed effects model. Values under 1 indicated outcomes favouring discharge planning. We calculated mean differences (MD) for the hospital length of stay. We judged combining data from the included studies inappropriate for the other outcomes, including patient health outcomes, satisfaction, medication, healthcare costs, and use of other postdischarge healthcare services (primary care, outpatient, and emergency room), due to the different methods of measuring and reporting these outcomes. We created a 'Summary of findings' table for the main outcomes of hospital length of stay and unscheduled readmission, and for the secondary outcomes of satisfaction and cost. We used GRADE worksheets to assess the certainty of the evidence (GRADEpro GDT 2015).
Subgroup analysis and investigation of heterogeneity
In order to reduce differences between trials, we grouped trial results by participants' condition (patients with a medical condition, a surgical condition, or patients recruited to a trial with a mix of conditions), as the discharge planning needs for patients admitted to hospital for surgery might differ from those for patients admitted with an acute medical condition or with multiple medical conditions. We performed post hoc subgroup analyses for participants admitted to hospital following a fall and participants admitted to a mental health setting, as we found more than one study for each subgroup and considered that these participant groups, as well as their discharge needs, might differ from both surgical and medical patients.
Sensitivity analysis
We performed a post hoc sensitivity analysis by imputing a missing standard deviation for one trial (Kennedy 1987).
Results
Description of studies
Results of the search
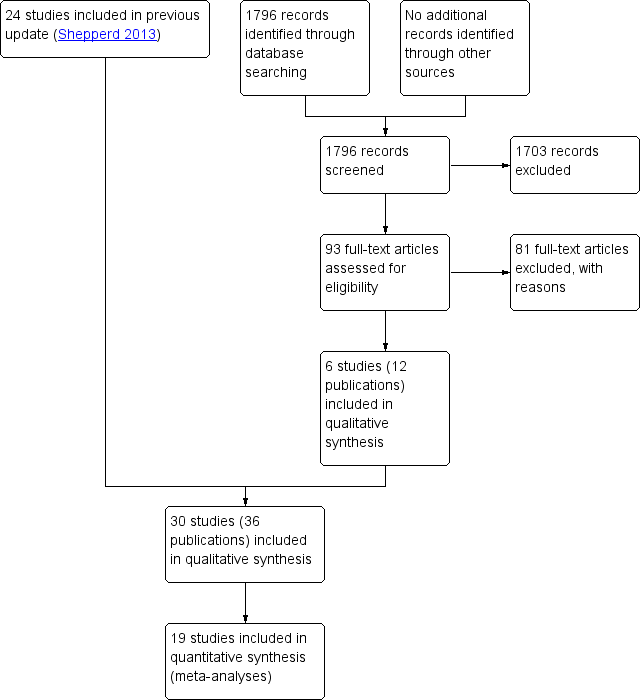
Previous versions of the review identified 4676 records, of which we excluded 4526 after screening the title and abstract. The main reasons for exclusion were ineligible study design, intervention or both. Of the 150 full‐text records assessed, we excluded 126 and included 24 (Balaban 2008; Bolas 2004; Eggink 2010; Evans 1993; Harrison 2002; Hendriksen 1990; Jack 2009; Kennedy 1987; Laramee 2003; Legrain 2011; Lin 2009; Moher 1992; Naji 1999; Naughton 1994; Naylor 1994; Nazareth 2001; Pardessus 2002; Parfrey 1994; Preen 2005; Rich 1993a; Rich 1995a; Shaw 2000; Sulch 2000; Weinberger 1996). For this review update, we identified 1796 records, of which we excluded 1703 after screening the title and abstract. After retrieving the full text of the remaining 93 studies, we identified six eligible trials (12 publications), which we included in this update (Farris 2014; Gillespie 2009; Goldman 2014; Kripalani 2012; Lainscak 2013; Lindpaintner 2013) (Figure 1). These 30 trials recruited a total of 11,964 participants. One of the trials included in the review was translated from Danish to English (Hendriksen 1990). Follow‐up times varied from five days to 12 months.

PRISMA flow diagram
Included studies
The trials included in the review evaluated broadly similar discharge planning interventions, which included assessment, planning, implementation and monitoring phases, although seven trials did not describe a monitoring phase (Eggink 2010; Evans 1993; Moher 1992; Naji 1999; Parfrey 1994; Shaw 2000; Sulch 2000); see Characteristics of included studies. The intervention was implemented at varying times during a participant's stay in hospital, from admission to three days prior to discharge. For one trial it was not clear when the intervention, which consisted of liaising with the community healthcare providers about the patient's specific needs, was implemented (Lainscak 2013). Another trial conducted a needs assessment and implementation of the discharge plan in two separate encounters, but if discharge occurred the same day as enrolment, then both phases occurred in one session (Kripalani 2012). Seven trials evaluated a pharmacy discharge plan implemented by a hospital pharmacy. For six of those trials the participants' medication was rationalised and prescriptions checked for errors by the hospital consultant, GP, community pharmacist or all of those. These professionals also received a pharmacy discharge plan, and participants received information about their medication (Bolas 2004; Eggink 2010; Farris 2014; Gillespie 2009; Nazareth 2001; Shaw 2000). For the seventh trial, the research team contacted the physicians treating the participant, both in the hospital and in the community, but only if they had identified medication‐related problems during the monitoring phase of the intervention (Kripalani 2012). In all but two trials a named healthcare professional coordinated the discharge plan. Of the 30 included trials, 12 provided a postdischarge phone call, four a visit, and two a phone call and a visit.
The study population differed between the trials. Twenty‐one trials recruited participants with a medical condition (Balaban 2008; Bolas 2004; Eggink 2010; Farris 2014; Gillespie 2009; Goldman 2014; Harrison 2002; Jack 2009; Kennedy 1987; Kripalani 2012; Lainscak 2013; Laramee 2003; Legrain 2011; Moher 1992; Naughton 1994; Nazareth 2001; Preen 2005; Rich 1993a; Rich 1995a; Sulch 2000; Weinberger 1996), with six of these recruiting participants with heart failure (Eggink 2010; Harrison 2002; Kripalani 2012; Laramee 2003; Rich 1993a; Rich 1995a). Two trials recruited older people (> 65 years) admitted to hospital following a fall (Lin 2009; Pardessus 2002), five recruited participants with a mix of medical and surgical conditions (Evans 1993; Farris 2014; Hendriksen 1990; Naylor 1994; Parfrey 1994), and two recruited participants from an acute psychiatric ward (Naji 1999; Shaw 2000), one of which also recruited participants from the elderly care ward (Shaw 2000). Two trials used a questionnaire designed to identify participants likely to require discharge planning (Evans 1993; Parfrey 1994). The majority of trials included a patient education component, and two trials included the participant's care giver in the formal assessment process (Lainscak 2013; Naylor 1994). The average age of participants recruited to 10 of the trials was > 75 years; in seven trials, between 70 and 75 years, and in the remaining trials, < 70 years. In two trials, both recruiting participants from a psychiatric hospital, the participants were under 50 years of age.
The description of the type of care the control group received varied. Two trials did not describe the care that the control group received (Kennedy 1987; Shaw 2000) and another reported it only as best usual care (Lindpaintner 2013). Twenty‐one trials described the control group as receiving usual care with some discharge planning but without a formal link through a coordinator to other departments and services, although other services were available on request from nursing or medical staff (Balaban 2008; Eggink 2010; Evans 1993; Gillespie 2009; Goldman 2014; Harrison 2002; Hendriksen 1990; Jack 2009; Laramee 2003; Legrain 2011; Lin 2009; Moher 1992; Naji 1999; Naylor 1994; Naughton 1994; Pardessus 2002; Parfrey 1994; Preen 2005; Rich 1993a; Rich 1995a; Weinberger 1996). The control groups in seven trials that evaluated the effectiveness of a pharmacy discharge plan did not have access to a review and discharge plan by a pharmacist (Bolas 2004; Eggink 2010; Farris 2014; Gillespie 2009; Kripalani 2012; Nazareth 2001; Shaw 2000). In one trial, the control group received multidisciplinary care that was not defined in advance but was determined by the participants' progress (Sulch 2000). Two trials considered the potential influence of language fluency (Balaban 2008; Goldman 2014), while two looked at health literacy (Jack 2009; Kripalani 2012).
Excluded studies
The main reason for excluding trials was due to multifaceted interventions, of which discharge planning was only a minor part. Some trials reported interventions of postdischarge care, whereas for others the control group also received some component of the discharge planning intervention. We excluded a small number of trials that did not include an assessment phase (Characteristics of excluded studies).
Risk of bias in included studies
Eighteen trials reported adequate allocation concealment (Farris 2014; Gillespie 2009; Goldman 2014; Harrison 2002; Jack 2009; Kennedy 1987; Kripalani 2012; Lainscak 2013; Legrain 2011; Naji 1999; Naughton 1994; Nazareth 2001; Preen 2005; Parfrey 1994; Rich 1995a; Shaw 2000; Sulch 2000; Weinberger 1996). All but two trials collected data at baseline (Balaban 2008; Pardessus 2002), and we assessed 21 trials as having a low risk of bias for measurement of the primary outcomes (readmission and length of stay), as investigators used routinely collected data to measure these outcomes (Balaban 2008; Eggink 2010; Evans 1993; Farris 2014; Gillespie 2009; Goldman 2014; Hendriksen 1990; Jack 2009; Kennedy 1987; Lainscak 2013; Laramee 2003; Legrain 2011; Moher 1992; Naji 1999; Naughton 1994; Nazareth 2001; Pardessus 2002; Parfrey 1994; Rich 1993a; Rich 1995a; Weinberger 1996). We assessed one pilot trial as having a high risk of bias for the outcome readmission, which was ascertained by interview rather than through routine data collection (Lindpaintner 2013) (Figure 2).

Methodological quality summary: review authors' judgements about each methodological quality item for each included study.
Effects of interventions
Does discharge planning improve the appropriate use of acute care?
Hospital length of stay
There was a small reduction in hospital length of stay for those allocated to discharge planning in trials recruiting older people following a medical admission (mean difference (MD) − 0.73, 95% confidence interval (CI) − 1.33 to − 0.12; 12 trials, moderate certainty evidence, Analysis 1.1; Harrison 2002; Gillespie 2009; Kennedy 1987; Laramee 2003; Lindpaintner 2013; Moher 1992; Naughton 1994; Naylor 1994; Preen 2005; Rich 1993a; Rich 1995a; Sulch 2000). This reduction increased slightly in a sensitivity analysis imputing a missing standard deviation for Kennedy 1987 (MD − 0.98, 95% CI − 1.57 to − 0.38; Analysis 1.2). There was no evidence of statistical heterogeneity. Two trials recruiting participants recovering from surgery reported a difference of − 0.06 day (95% CI − 1.23 to 1.11) (Analysis 1.3; Lin 2009; Naylor 1994); and two trials recruiting a combination of participants recovering from surgery and those with a medical condition a mean difference of − 0.60 (95% CI − 2.38 to 1.18) (Analysis 1.4; Evans 1993; Hendriksen 1990). We did not include these four trials in the pooled analysis as they recruited participants from different settings. Parfrey 1994 recruited participants from two hospitals and reported a reduction in length of stay for those receiving discharge planning in one hospital only (median difference − 0.80 days, P = 0.03).
Readmission rates
For elderly participants with a medical condition, there was a lower readmission rate in the discharge planning group at three months of discharge (RR 0.87, 95% CI 0.79 to 0.97; 15 trials, moderate certainty evidence, Analysis 2.1.1; Balaban 2008; Farris 2014; Goldman 2014; Harrison 2002; Jack 2009; Kennedy 1987; Lainscak 2013; Laramee 2003; Legrain 2011; Moher 1992; Naylor 1994; Nazareth 2001; Rich 1993a; Rich 1995a; Shaw 2000), with no evidence of statistical heterogeneity. It is uncertain whether discharge planning reduces readmission rates for participants admitted to hospital following a fall (RR 1.36, 95% CI 0.46 to 4.01, very low certainty evidence, two trials, Analysis 2.1.2).
Evans 1993 recruited a mix of participants, reporting a reduction in readmissions for those receiving discharge planning (difference − 11%, 95% CI − 17% to − 4%) at four weeks follow‐up, but not at nine months follow‐up (difference − 6%, 95% CI − 12.5% to 0.84%; P = 0.08). One small pilot trial reported similar readmission rates for both groups at 5 and 30 days but did not provide enough data to be included in the pooled analysis (Lindpaintner 2013;Analysis 2.3). One trial recruiting people recovering from surgery reported the difference in readmission rates + 3% (95% CI − 7% to 13%; Analysis 2.4; Naylor 1994), and a trial recruiting participants admitted to acute psychiatric wards reported a difference +7% (95% CI − 1% to 17%; Analysis 2.5; Naji 1999).
Days in hospital due to unscheduled readmission
We are uncertain whether discharge planning has an effect on days in hospital due to an unscheduled readmission, for patients with a medical condition (Analysis 3.1) or surgical patients (Analysis 3.3). For participants with a mix of medical and surgical conditions, Evans 1993 reported that patients receiving discharge planning spent fewer days in hospital at 9‐month follow‐up (MD − 2.00; 95% CI − 3.18 to − 0.82), but there was little to no difference for the participants recruited by Hendriksen 1990 and Rich 1993a (Analysis 3.2).
Place of discharge
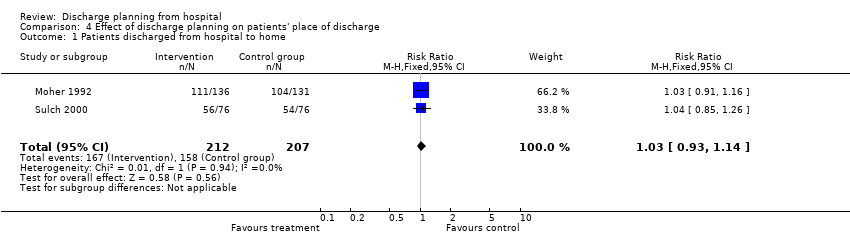
Seven trials reported the place of discharge. Discharge planning may not affect the proportion of patients discharged to home rather than to residential care (RR 1.03, 95% CI 0.93 to 1.14; Analysis 4.1; Moher 1992; Sulch 2000, low certainty evidence) or to a nursing home (Hendriksen 1990; Naughton 1994). One other trial reported that there were no differences between treatment and control groups regarding the likelihood of being discharged into an institutional setting (Analysis 4.2; Goldman 2014). One trial reported that all participants allocated to the control group were discharged home and 83% of participants in the treatment group were discharged home (difference 17%; 95% CI 2% to 34%; Analysis 4.2; Lindpaintner 2013). These trials were not included in the pooled analysis as they excluded patients with a high likelihood of being discharged to an institutional setting. Evans 1993 recruited both medical and surgical patients, reporting that a greater proportion of participants allocated to discharge planning went home compared with those receiving no formal discharge planning (difference 6%, 95% CI 0.4% to 12%; Analysis 4.3). For patients admitted to hospital after a fall, it is uncertain if discharge planning had an effect on place of discharge (OR 0.46, 95% CI 0.15 to 1.40; Analysis 4.4).
Does discharge planning improve or (at least) have no adverse effect on patient outcome?
Mortality rate
For elderly participants with a medical condition (usually heart failure), and those admitted to hospital following a fall, it is uncertain if discharge planning has an effect on mortality at 4‐ to 6‐month follow‐up (RR 1.02, 95% CI 0.83 to 1.27; Analysis 5.1.1; Goldman 2014; Lainscak 2013; Laramee 2003; Legrain 2011; Nazareth 2001; Rich 1995a; Sulch 2000) (RR 1.33, 95% CI 0.33 to 5.45; Analysis 5.1.2; Pardessus 2002).
Evans 1993 recruited a mix of surgical and medical patients, reporting data for mortality at 9‐month follow‐up (treatment: 66/417 (15.8%), control: 67/418 (16%); difference − 0.2%, 95% CI − 0.04% to 0.5%; Analysis 5.2). Gillespie 2009 recruited participants with a medical condition, reporting the number of participants in the treatment and control groups that died during the 12‐month follow‐up (treatment: 57/182 (31%), control: 61/186 (33%); difference − 2%, 95% CI − 11% to 8%; Analysis 5.3).
Complication rate
No trials reported on the effect of discharge planning on the incidence of complications related to the initial admission.
Patient health status
Thirteen trials measured patient‐assessed outcomes, including functional status, mental well‐being, perception of health, self‐esteem, and affect. Information about the scoring systems for patient‐assessed health outcomes are provided in the notes of Analysis 6.1, Analysis 6.2 and Analysis 6.3. We are uncertain whether discharge planning improves patient‐assessed health outcomes. Three trials did not publish follow‐up data (Kennedy 1987; Naylor 1994; Weinberger 1996), and for five trials there was little to no difference in mean scores between groups (Evans 1993; Harrison 2002; Lainscak 2013; Nazareth 2001; Preen 2005; Analysis 6.1). Rich 1995a recruited participants with heart failure, reporting an improvement on the total score for the Chronic Heart Failure Questionnaire (MD 22.1 (SD 20.8); P = 0.001; a lower score indicates poor quality of life). Sulch 2000 recruited participants recovering from a stroke, reporting an improvement in function between weeks 4 and 12 for those allocated to the control group, and similar scores for the remaining mean point estimates on the Barthel index. Quality of life, as measured by the EuroQol, showed between‐group differences at 26 weeks, favouring the control group (72 points for the control group versus 63 points for the treatment group; P < 0.005), but the same point estimates were reported for the Rankin score and the Hospital Anxiety and Depression scale (HADS) (Sulch 2000). Lindpaintner 2013, recruiting participants with a mixed medical background, reported that there were no differences for patient health‐related quality of life or care giver burden at 5 or 30 days (no data reported, other than describing no difference).
Lin 2009, recruiting participants recovering from a hip fracture, measured patient‐reported health status with the 36‐item Short Form Health Survey (SF‐36); investigators reported improvements at 3‐month follow‐up for the treatment group for the mental health aspects of social functioning (MD 15.18 (SD 43.67); P = 0.03), vitality (MD 12.59 (SD 36.66); P = 0.004), the physical aspects of bodily pain (MD 16.58 (SD 48.7); P = 0.009), and general health perceptions (MD 12.76 (SD 36.31); P = 0.03); see Analysis 6.2. Pardessus 2002 recruited participants admitted for a fall and reported a reduction of autonomy in daily living activities in the control group measured by the Functional Autonomy Measurement System, whereas the treatment group maintained their baseline function at 6 months and had a small reduction at 12 months (6‐month MD − 8.18 (SD 4.94), P < 0.001; 12‐month MD − 9.73 (SD 5.43), P < 0.001; see Analysis 6.3). Pardessus 2002 reported the number of falls at 12‐month follow‐up (RR 0.87, 95% CI 0.50 to 1.49; Pardessus 2002; Analysis 6.4). Naji 1999 recruited participants admitted to a psychiatric unit and reported that at 1‐month postdischarge those who received discharge planning had a higher median score on the HADS depression scale (treatment: median: 9.5, IQR: 5.0, 13.3; control: median: 7.0, IQR: 3.0, 11.0, P = 0.016; Analysis 6.5). There was little to no difference between groups for anxiety and behavioural symptoms (Analysis 6.5).
Satisfaction of patients, care givers and healthcare professionals
Discharge planning may lead to increased satisfaction for patients and healthcare professionals (six trials, low certainty evidence due to inconsistent findings and few studies reporting data for this outcome). Two trials, recruiting participants with a medical condition, reported increased patient satisfaction for those allocated to discharge planning. In one trial follow‐up was at 1 and 6 months, with the greatest improvement reported for participants' perceptions of continuity of care and non‐financial access to medical care (no data reported) (Weinberger 1996). In the second trial, participants reported increased satisfaction with hospital care, hospital discharge and home recovery (no data reported; Laramee 2003; Analysis 7.1.1). In two trials evaluating a pharmacy discharge plan, Nazareth 2001 reported patient satisfaction to be the same in both groups (6‐month MD 0.20 (SD 1.19), 95% CI − 0.01 to 0.4), and Bolas 2004 reported that the pharmacy discharge letter improved the standard of information exchange at discharge, as assessed by primary care practitioners (PCP) and community pharmacists (57% and 95% agreed, respectively; Analysis 7.1.2). In Lindpaintner 2013, PCPs and visiting nurses providing care to participants in the treatment group reported similar 5‐day satisfaction with the discharge process as PCPs and visiting nurses whose patients were in the control group (PCP: treatment: median = 1, interquartile range (IQR) = 1 to 2; control: median = 2, IQR = 1 to 3; nurses: treatment: median = 1, IQR = 1‐2; control: 2, IQR = 1 to 4). The same study reported that at 30‐day follow‐up, care givers for participants in the treatment group were more satisfied (treatment: median = 1, IQR = 1 to 2; control: median = 2, IQR = 1 to 3). In Moher 1992, a subgroup of 40 participants admitted to general medical units, mainly for circulatory, respiratory or digestive problems, completed a satisfaction questionnaire, reporting increased satisfaction with discharge planning (difference 27%, P < 0.001, 95% CI 2% to 52%).
Does discharge planning reduce overall costs of healthcare?
Healthcare costs
Hospital care costs and use
It is uncertain whether there is any difference in hospital care cost when discharge planning is implemented with patients with a medical condition (very low certainty evidence, five trials). A lower readmission rate for those receiving discharge planning may be associated with lower health service costs in the short term, but findings were inconsistent. In Naylor 1994, recruiting participants with a medical condition, both groups incurred similar costs for their initial hospital stay. A difference was reported for hospital charges, which included readmission costs, at two weeks follow‐up (difference − USD 170,247, 95% CI − USD 253,000 to − USD 87,000, 276 participants, savings per participant not reported) and at two to six weeks follow‐up (difference − USD 137,508, 95% CI − USD 210,000 to − USD 67,000), with participants receiving discharge planning incurring lower costs (Analysis 8.1). Naughton 1994 reported lower costs for laboratory services for participants receiving discharge planning (MD per participant − GBP 295, 95% CI − GBP 564 to − GBP 26), but not for diagnostic imaging, pharmacy, rehabilitation or total costs (Analysis 8.1). In Jack 2009, the difference between study groups in total cost for the health service (combining actual hospital utilisation cost and estimated outpatient cost) for 738 participants was USD 149,995, an average of USD 412 per person who received the intervention. In Gillespie 2009, hospital costs were reported (difference: − USD 400, 95% CI − USD 4000 to USD 3200; Analysis 8.1). Difference in costs were not reported in studies recruiting participants with surgical conditions (Analysis 8.2), admitted to a psychiatric unit (Analysis 8.3) or to a general medical service (Analysis 8.4).
Naughton 1994 reported that the overall health service costs were lower for the treatment group, but with a high level of uncertainty (MD − USD 1949, 95% CI − USD 4204 to USD 306). Jack 2009 reported a difference between study groups in total cost (combining actual hospital utilisation cost and estimated outpatient cost) of USD 149,995 for 738 participants, which translated to an average of USD 412 per person who received the intervention; this represents a 33.9% lower observed cost for the treatment group. The cost savings balanced against the cost of the intervention were reported to be EUR 519 per participant in one trial based in Paris (Legrain 2011), and − USD 460 in a trial based in the US (Rich 1995a) (RR 0.80, 95% CI 0.61 to 1.07).
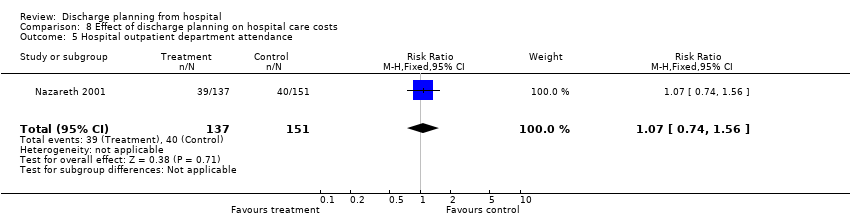
One trial reported the number of hospital outpatient visits (RR 1.07, 95% CI 0.74 to 1.56; Nazareth 2001; Analysis 8.5). Two trials (Farris 2014; Harrison 2002) assessed the effect of discharge planning on the number of days from discharge until the first visit to the emergency department, reporting little to no difference for those receiving discharge planning or usual care (RR 0.80, 95% CI 0.61 to 1.07; Analysis 8.6).
Primary and community care costs
It is uncertain if discharge planning impacts on primary and community care costs. Weinberger 1996 measured the use of primary care and reported an increase in the use of primary care by those allocated to discharge planning (median time from hospital discharge to first primary care consultation, treatment = seven days, control = 13 days; P < 0.001; mean number of visits to general medical clinic for treatment group was 3.7 days, control group 2.2 days; P < 0.001). Nazareth 2001 reported that the same proportion of participants in both groups consulted with their general practitioner at three months (MD 2.7%, 95% CI − 7.4% to 12.7%) and six months (MD 0.3%, 95% CI − 11.6% to 12.3%). Farris 2014 assessed unscheduled office visits, reporting a difference of 0% (95% CI − 5% to 5%) at 30‐days and 4% (95% CI − 2% to 9%) at 90‐days. Goldman 2014 reported an MD of 4%, 95% CI − 3.7% to 11.5%, at 30 days. See Analysis 9.1.
Medication use
Trials evaluating the effectiveness of a pharmacy discharge plan measured different outcomes related to medication, including the mean number of problems (e.g., difficulty obtaining a prescription from the general practitioner) (Analysis 10.1), adherence to medicines (Analysis 10.2), and knowledge about the prescribed medication (Analysis 10.3). Nazareth 2001 reported data related to adherence to medication regimen, knowledge about medicines and hoarding of medicines (Analysis 10.2, Analysis 10.3, Analysis 10.4). In Eggink 2010, data on medication errors were reported following a review of medication by a pharmacist; 68% in the control group had at least one discrepancy or medication error compared to 39% in the treatment group (RR 0.57, 95% CI 0.37 to 0.88; Analysis 10.5). Kripalani 2012 assessed clinically important medication errors, reporting similar results for both groups at 30 days (RR = 0.92, 95% CI 0.77 to 1.10; Analysis 10.5). Farris 2014 compared medication appropriateness at 30 and 90 days (Analysis 10.6).
Discussion
Summary of main results
This review assessed the effectiveness of discharge planning in hospital. Thirty randomised controlled trials met the pre‐specified criteria for inclusion. We were able to pool the data from trials recruiting older participants with a medical condition and found that discharge planning probably results in a small reduction in hospital length of stay (just under a day; moderate certainty evidence,12 trials) and unscheduled readmission (approximately three fewer readmissions per 100 participants; moderate certainty evidence, 15 trials). It is uncertain whether discharge planning reduces readmission rates for patients admitted to hospital following a fall (very low certainty evidence, two trials). Discharge planning may lead to increased satisfaction for patients and healthcare professionals (low certainty evidence, six trials). It is uncertain whether there is any difference in the cost of care when discharge planning is implemented with patients who have a medical condition (very low certainty evidence, five trials). A lower readmission rate for those receiving discharge planning may be associated with lower health service costs in the short term, but findings were inconsistent.
Overall completeness and applicability of evidence
A key issue in interpreting the evidence is the definition of the intervention and the subsequent understanding of the relative contribution of each element. While authors of all of the trials provided some description of the intervention, it was not possible to assess how some components of the process compared between trials. For example, Naylor 1994 and Lainscak 2013 formalised the inclusion of the participants' care givers into the assessment process and the discharge plan. Although some of the other trials mentioned this aspect, the degree to which this was done was not always apparent (Evans 1993; Hendriksen 1990; Kennedy 1987; Laramee 2003; Naughton 1994). The majority of the trials also included a patient education component within the discharge planning process. In one trial, which recruited participants admitted to hospital following a fall, the discharge plan included a pre‐discharge home visit that was specific to this group of patients, by an occupational therapist and rehabilitation doctor (Pardessus 2002). In another trial, hospital and community nurses worked together on the discharge plan (Harrison 2002). Two of the trials used an assessment tool to find cases eligible for discharge planning (Evans 1993; Parfrey 1994). The monitoring of discharge planning also differed. For example, in one trial this was done primarily by telephone, while in Weinberger 1996 participants were given appointments to attend a primary care clinic. Seven trials evaluated the effectiveness of a pharmacy discharge plan (Bolas 2004; Eggink 2010; Farris 2014; Gillespie 2009; Kripalani 2012; Nazareth 2001; Shaw 2000). Of those seven trials, four reported data for readmission, with no differences between treatment and control groups (Farris 2014;Gillespie 2009; Nazareth 2001;Shaw 2000). The evidence was mixed for the use of medication: three trials reported improvements with medication use between groups (Bolas 2004;Eggink 2010; Shaw 2000), and three trials did not (Farris 2014;Kripalani 2012; Nazareth 2001). However, the interpretation of these data is limited by the heterogeneity of the outcomes measured. An additional problem, common to other trials, was the difficulty in assessing if contamination between the treatment and control groups occurred. Four trials considered equity, assessing the potentially disadvantageous effect of language and health literacy by performing subgroup analyses of participants whose first language was not English (Balaban 2008; Goldman 2014) and who had low health literacy, respectively (Jack 2009; Kripalani 2012). There was mixed evidence for non‐English speakers, and the evidence does not seem to support an increased or decreased effect of discharge planning for patients with low health literacy.
The context in which an intervention such as discharge planning is delivered may also play a role, not only in the way the intervention is delivered but in the way services are configured for the control group. Thirteen of the trials included in this review were based in the USA, five in the UK, three in Canada, two in France, one in Australia, one in Sweden, one in Denmark, one in the Netherlands, one in Taipei, one in Slovenia, and one in Switzerland. In each country the orientation of primary care services differs, which may affect communication between services. Different perceptions of care by professionals of alternative care settings and country‐specific funding arrangements may also influence timely discharge. The point in a patient's hospital admission when discharge planning was implemented also varied across studies. Two trials reported discharge planning commencing from the time a patient was admitted to hospital (Parfrey 1994; Sulch 2000), and another stated that discharge planning was implemented three days prior to discharge (Weinberger 1996). The timing of delivery of an intervention such as discharge planning, which depends on organising other services, will have some bearing on how quickly these services can begin providing care. The patient population may also impact on outcome. For example, 99 patients recruited to the trial by Weinberger were experiencing major complications from their chronic disease and this, combined with an intervention also designed to increase the intensity of primary care services, may explain the observed increase in readmission days for those receiving the intervention. Similarly, Goldman postulates that educating patients in the treatment group about medication and side effects might have made them more likely to visit the emergency department (Goldman 2014).
Quality of the evidence
All studies included in this review were randomised controlled trials, and we considered most of them to have a low risk of bias. There was consistency among trials recruiting patients with a medical condition for the main outcomes of readmission and length of stay, and a moderate level of certainty for these outcomes. A small number of studies reported data on cost to the health service and potential cost savings; the findings from these studies are less certain due to different mechanisms for costing and charging (very low certainty evidence, five trials). Similarly few studies assessed patient satisfaction, and of those that did there is some evidence of increased satisfaction in patients experiencing discharge planning. However, this evidence base is small and the effects of discharge planning on patient satisfaction are uncertain (low certainty evidence, six trials).
Agreements and disagreements with other studies or reviews
Systematic reviews have been published in related areas, for example, Stuck 1993 and Ellis 2011 evaluated geriatric assessment that included discharge planning as part of a broader package of care, and Kwan 2004 looked at integrated care pathways for stroke. This latter review concluded that this type of care may be associated with both positive and negative effects on the organisation of care and clinical outcomes. Parker 2002 included discharge planning interventions that were implemented in a hospital setting, comprehensive geriatric assessment, discharge support arrangements and educational interventions, concluding that interventions providing an educational component had an effect on reducing readmission rates. The interventions evaluated by the majority of trials included in this review had an element of patient education. Leppin 2014 reviewed interventions aimed at reducing early hospital readmissions (< 30 days) for adults discharged home versus any other comparator. Their results indicated that those interventions that were more complex, promoted patient self‐care and were conducted less recently were more likely to be effective. The authors speculate that an increased standard of care, along with a shift on the interventions being tested, might explain their finding of more recent interventions being less effective.
PRISMA flow diagram

Methodological quality summary: review authors' judgements about each methodological quality item for each included study.

Comparison 1 Effect of discharge planning on hospital length of stay, Outcome 1 Hospital length of stay ‐ older patients with a medical condition.

Comparison 1 Effect of discharge planning on hospital length of stay, Outcome 2 Sensitivity analysis imputing missing SD for Kennedy trial.

Comparison 1 Effect of discharge planning on hospital length of stay, Outcome 3 Hospital length of stay ‐ older surgical patients.

Comparison 1 Effect of discharge planning on hospital length of stay, Outcome 4 Hospital length of stay ‐ older medical and surgical patients.

Comparison 2 Effect of discharge planning on unscheduled readmission rates, Outcome 1 Within 3 months of discharge from hospital.
| Study | Readmission rates | Notes |
| Evans 1993 | At 4 weeks: At 9 months: | — |
Comparison 2 Effect of discharge planning on unscheduled readmission rates, Outcome 2 Patients with medical or surgical condition.
| Study | Readmission rates | Notes |
| Farris 2014 | At 30 d: I = 47/281 (17%), C = 43/294 (15%) Difference 2%; 95% CI − 0.04% to 0.08% At 90 d: ET = 49/281 (17%), C = 47/294 (16%) Difference 1%; 95% CI − 5% to 8% | — |
| Gillespie 2009 | At 12 months: I = 106/182 (58.2%), C = 110/186 (59.1%) Difference − 0.9%, 95% CI − 10.9% to 9.1% | — |
| Goldman 2014 | At 30 d: I = 50/347 (14%), C = 47/351 (13%) Difference 1%; 95% CI − 4% to 6% At 90 d: I = 89/347 (26%), C = 77/351 (22%) Difference 3.7%; 95% CI − 2.6% to 10% | Data provided by the trialists |
| Kennedy 1987 | At 1 week: At 8 weeks: | — |
| Lainscak 2013 | At 90 d: COPD− related I = 14/118 (12%), C = 33/135 (24%) Difference 12%; 95% CI 3% to 22% All‐cause readmission T = 25/118 (21%), C = 43/135 (32%) Difference 11%; 95% CI − 0.3% to 21% | Data provided by the trialists; data also available for 30− and 180− d |
| Laramee 2003 | At 90 d: Readmission days: | — |
| Moher 1992 | At 2 weeks: | — |
| Naylor 1994 | Within 45‐90 d: | Authors also report readmission data for 2‐6 weeks follow up |
| Nazareth 2001 | At 90 d: At 180 d: | — |
| Shaw 2000 | At 90 d: | Authors also report data for readmission due to non‐compliance with medication At 3 months: |
| Weinberger 1996 | Number of readmissions per month At 6 months: | Non‐parametric test used to calculate P values for monthly readmissions |
Comparison 2 Effect of discharge planning on unscheduled readmission rates, Outcome 3 Patients with a medical condition.
| Study | Readmission rates | Notes |
| Naylor 1994 | Within 6 to 12 weeks: | — |
Comparison 2 Effect of discharge planning on unscheduled readmission rates, Outcome 4 Patients who have had surgery.
| Study | Readmissions | Mean time to readmission |
| Naji 1999 | At 6 months: | Mean time to readmission T = 161 d, C = 153 d |
Comparison 2 Effect of discharge planning on unscheduled readmission rates, Outcome 5 Patients with a mental health diagnosis.
| Study | Days in hospital | Notes |
| Naylor 1994 | Medical readmission days 2 weeks: T = 21 d (n = 72), C = 73 d (n = 70) 2 to 6 weeks: T = 16 d (n = 72), C = 49 d (n = 70) 6 to 12 weeks: T = 94 d (n = 72), C = 100 d (n = 70) | |
| Weinberger 1996 | Medical readmission days at 6 months follow up: T = 10.2 (19.8), C = 8.8 (19.7) difference 1.4 d, P = 0.04 | — |
Comparison 3 Effect of discharge planning on days in hospital due to unscheduled readmission, Outcome 1 Patients with a medical condition.
| Study | Days in hospital | Notes |
| Evans 1993 | Readmission days at 9 months: | — |
| Hendriksen 1990 | T = 15.5 d per readmission | Not possible to calculate exact P |
| Rich 1993a | Days to first readmission Overall: T = 31.8 (5.1) (n = 63), C = 42.1 (7.3) (n = 35) | — |
Comparison 3 Effect of discharge planning on days in hospital due to unscheduled readmission, Outcome 2 Patients with a medical or surgical condition.
| Study | Days in hospital | Notes |
| Naylor 1994 | Surgical readmission days 2 weeks: T = 34 d (n = 68), C = 32 d (n = 66) 2 to 6 weeks: T = 63 (n = 68), C = 52 (n = 66) 6 to 12 weeks: T = 52 (n = 68), C = 26 (n = 66) | — |
Comparison 3 Effect of discharge planning on days in hospital due to unscheduled readmission, Outcome 3 Patients with a surgical condition.
Comparison 4 Effect of discharge planning on patients' place of discharge, Outcome 1 Patients discharged from hospital to home.
| Study | Place of discharge | Notes |
| Goldman 2014 | Discharged to an institutional setting: T = 19/347 (5.5%), C = 9/352 (2.6%) Difference 2.9%; 95% CI − 0.04% to 6% | — |
| Kennedy 1987 | At 2 weeks: | No data shown |
| Legrain 2011 | Discharged home or to a nursing home: T = 183/317 C = 191/348 | — |
| Lindpaintner 2013 | Discharged home T = 25/30 (83%), C = 30/30 (100%) Difference 17%, 95% CI 2 to 34% | — |
| Moher 1992 | Discharged home: | — |
| Naughton 1994 | Discharged to nursing home: | — |
| Sulch 2000 | Discharged home: Discharged to an institution: | — |
Comparison 4 Effect of discharge planning on patients' place of discharge, Outcome 2 Patients with a medical condition.
| Study | Place of discharge | Notes |
| Evans 1993 | Discharged to home: Home at 9 months: | — |
| Hendriksen 1990 | Discharged to nursing home: At 6 months: admitted to another institution | — |
Comparison 4 Effect of discharge planning on patients' place of discharge, Outcome 3 Patients with a medical or surgical condition.

Comparison 4 Effect of discharge planning on patients' place of discharge, Outcome 4 Older patients admitted to hospital following a fall in residential care at 1 year.

Comparison 5 Effect of discharge planning on mortality, Outcome 1 Mortality at 6 to 9 months.
| Study | Mortality at 9 months | Notes |
| Evans 1993 | T = 66/417 (16%) | — |
Comparison 5 Effect of discharge planning on mortality, Outcome 2 Mortality for trials recruiting both patients with a medical condition and those recovering from surgery.
| Study | Mortality at 12 months | Notes |
| Gillespie 2009 | T: 57/182 (31%); C: 61/186 (33%) Difference − 2%, 95% CI − 11% to 8% | |
Comparison 5 Effect of discharge planning on mortality, Outcome 3 Mortality at 12 months.
| Study | Patient health outcomes | Notes |
| Harrison 2002 | SF‐36 Baseline Physical component T = 28.63 (SD 9.46) N = 78 Mental component T = 50.49 (SD 12.45) N = 78 At 12 weeks Physical component T = 32.05 (SD 11.81) N = 77 Mental component T = 53.94 (SD 12.32) N = 78 Minnesota Living with Heart Failure Questionnaire (MLHFQ) At 12 week follow‐up (See table 4) n, % Worse: T = 6/79 (8), C = 22/76 (29) | SF‐36 a higher score indicates better health status MLHFQ a lower score indicates less disability from symptoms |
| Kennedy 1987 | Long Term Care Information System (LTCIS) | No data reported |
| Lainscak 2013 | St. George’s Respiratory Change from 7 to 180 d after discharge T = 1.06 (95% CI 9.50 to 8.43), C = − 0.11 (95% CI − 11.34 to 8.12) | Complete data available for only approximately half of the patients. For the SGRQ, higher scores indicate more limitations; minimal clinically important difference estimated as 4 points. |
| Naylor 1994 | Data aggregated for both groups. Mean Enforced Social Dependency Scale increased from 19.6 to 26.3 P < 0.01 | No data reported for each group. Decline in functional status reported for all patients. Functional status. Scale measured:
Not possible to calculate exact P value |
| Nazareth 2001 | General well‐being questionnaire: 1 = ill health, 5 = good health At 6 months: Mean difference 0.10; 95% CI − 0.14 to 0.34 | — |
| Preen 2005 | SF‐12 (N not reported for follow‐up) Mental component score Predischarge score: T = 37.4 SD 5.4 7 d postdischarge: T = 42.4 SD 5.6 Physical component score Predischarge score: T = 27.8 SD 4.8 7 d postdischarge: T = 27.2 SD 4.5 | — |
| Rich 1995a | Chronic Heart Failure Questionnaire Treatment N = 67, Control N = 59 Total score At baseline: T = 72.1 (15.6), C = 74.4 (16.3) At 90 d: T = 94.3 (21.3), C = 85.7 (19.0) Change score = 22.1 (20.8), P = 0.001 Dyspnoea At baseline: T = 9.0 (7.9), C = 8.1 (7.7) At 90 d: T = 15.8 (12.8), C = 11.9 (10.0) Change score 6.8 (7.9) Fatigue At baseline: T = 12.9 (5.3), C = 14.1 (5.6) At 90 d: T = 18.3 (6.3), C = 16.8 (5.5) Change score 5.4 (5.5) Emotional function At baseline: T = 31.9 (8.5), C = 33.3 (8.1) At 90 d: T = 37.4 (7.8), C = 35.2 (8.4) Change score 5.6 (7.1) Environmental mastery At baseline: T = 18.3 (5.8), C = 18.9 (4.8) At 90 d: T = 22.7 (4.9), C = 21.7 (4.6) Change score 4.4 (5.3) | Chronic Heart Failure Questionnaire contains 20 questions that the patient is asked to rate on a scale 1 to 7 with a low score indicating poor quality of life |
| Sulch 2000 | Barthel activities of daily living At 4 weeks: At 12 weeks: At 26 weeks: Median change from 4 to 12 weeks: P < 0.01 Rankin score At 4 weeks: At 12 weeks: At 26 weeks: Hospital anxiety and depression scale At 4 weeks: At 12 weeks: At 26 weeks Depression At 4 weeks: At 12 weeks: At 26 weeks: EuroQol Median scores At 12 weeks: At 26 weeks: | The Barthel ADL Index covers activities of daily living; scores range from 0 to 20, with higher scores indicating better functioning. The Rankin scale assesses activities of daily living in people who have had a stroke; it contains 7 items with scores ranging from 0 to 6. Higher scores indicating more disability. The Hospital Anxiety and Depression Scale is a 14‐item Likert scale (0‐3); scores range from 0 to 21 for each subscale (anxiety and depression), with higher scores indicating more burden from symptoms. The EuroQol contains 5 items; higher scores indicate better self‐perceived health status. Not possible to calculate exact P value |
| Weinberger 1996 | At 1 month: no significant differences At 3 months: no significant differences | SF‐36 |
Comparison 6 Effect of discharge planning on patient health outcomes, Outcome 1 Patient‐reported outcomes: Patients with a medical condition.
| Study | Patient health outcomes | Notes |
| Lin 2009 | OARS Multidimensional Functional Assessment Questionnaire (Chinese version) at 3 months follow‐up Mean (SD) T = 16.92 (1.41) C = 16.83 (1.71) | 9 components, each component scored 0 to 2 with a total score range 0‐18.
|
| Lin 2009 | SF 36 Mean (SD) Physical aspects Pre‐test T: 74.09 (21.05), C: 68.15 (21.62) Post‐test T: 49.05 (16.27), C: 39.56 (16.76) Between group difference P = 0.09 Physical functioning Pre‐test T: 74.80 (25.15), C: 73.33 (18.04) Post‐test T: 55.77 (22.56), C: 51.46 (24.82) Between group difference P = 0.60 Role physical Pre‐test T: 66.34 (47.40), C: 65.63 (44.12) Post‐test T:16.34 (34.60), C: 12.50 (33.78) Between group difference P = 0.78 Bodily pain Pre‐test T: 88.15 (18.48), C: 77.08 (22.44) Post‐test T: 55.16 (23.20), C: 38.58 (27.68) Between group difference p=0.009 General health perceptions Pre‐test T: 67.03 (15.31), C: 56.54 (19.96) Post‐test T: 68.46 (16.55), C: 55.70 (22.23) Between group differences p=0.03 Mental aspects Pre‐test T: 74.49 (16.66), C: 68.24 (15.09) Post‐test T: 50.57 (18.72), C: 43.43 (17.28) Between group difference P = 0.09 Mental health Pre‐test T: 71.23 (12.18), C: 67.83 (12.28) Post‐test T: 22.30 (10.31), C: 20.00 (11.62) Between group difference P = 0.27 Role emotion Pre‐test T: 76.92 (40.84), C: 68.05 (41.10) Post‐test T: 52.56 (44.39), C: 54.16 (41.49) Between group difference P = 0.71 Social functioning Pre‐test T: 80.76 (15.09), C: 77.08 (15.93) Post test T: 61.01 (24.32), C: 45.83 (20.41) Between group difference P = 0.03 Vitality Pre‐test T: 69.03 (12.88), C: 60.00 (11.70) Post‐test T: 66.34 (16.94), C: 53.75 (21.93) Between group difference P = 0.004 | — |
| Naylor 1994 | No differences between groups reported | No data reported |
| Naylor 1994 | — | — |
Comparison 6 Effect of discharge planning on patient health outcomes, Outcome 2 Patient‐reported outcomes: Patients with a surgical condition.
| Study | Patient health outcomes | Notes |
| Evans 1993 | At 1 month: mean (SD) | Barthel score |
| Pardessus 2002 | Functional Autonomy Measurement System (SMAF) At 6 months: At 12 months: Katz ADL At 6 months: At 12 months: IADL At 6 months: At 12 months: | The SMAF scale assesses seven fields of activities of daily living. It has 22 items with scores ranging from 0 (total independence) to 87 (total dependence) The Katz ADL scale covers six ADLs, with scores ranging from 0 (totally dependent) to 6 (totally independent). |
Comparison 6 Effect of discharge planning on patient health outcomes, Outcome 3 Patient‐reported outcomes: Patients with a medical or surgical condition.

Comparison 6 Effect of discharge planning on patient health outcomes, Outcome 4 Falls at follow‐up: patients admitted to hospital following a fall.
| Study | Patient health outcomes | Notes |
| Naji 1999 | Hospital Anxiety Depression Scale Anxiety Depression Behavioural and Symptom Identification Scale Relation to self/other Depression/anxiety Daily living/role functioning Impulsive/addictive behaviour Psychosis Total symptom score | — |
Comparison 6 Effect of discharge planning on patient health outcomes, Outcome 5 Patient‐reported outcomes: Patients with a mental health diagnosis.
| Study | Satisfaction | Notes |
| Patient and care givers' satisfaction | ||
| Laramee 2003 | Mean hospital care: T = 4.2 (N = 120), C = 4.0 (N = 100), P = 0.003 Mean hospital discharge: T = 4.3 (N = 120), C = 4.0 (N = 100), P < 0.001 Mean care instructions: T = 4.0 (N = 120), C = 3.4 (N = 100), P < 0.001 Mean recovering at home: T = 4.4 (N = 120), C = 3.9 (N = 100), P < 0.001 Mean total score: T = 4.2 (N = 120), C = 3.8 (N = 100), P < 0.001 | — |
| Lindpaintner 2013 | Satisfaction with discharge process At 5 d (median and IQR) Patients: T = 1 (0), C = 1 (1‐2) Carers: T = 1 (0), C = 1 (1‐2) At 30 d Patients: T = 1 (1‐2), C = 1 (1‐2) Carers: T = 1 (1‐2), C = 2 (1‐3) | 4‐point Likert‐scale, lower scores indicate higher satisfaction |
| Moher 1992 | Satisfied with medical care: | "Please rate how satisfied you were with the care you received…" Subgroup of 40 patients, responses from 18 in the treatment group and 21 in the control group |
| Nazareth 2001 | Client satisfaction questionnaire score (1 = dissatisfied, 4 = satisfied) At 3 months: At 6 months: | |
| Weinberger 1996 | At 1 month: At 6 months: Authors report differences were greatest for patients' perceptions of continuity of care and non‐financial access to medical care | Patient Satisfaction Questionnaire, 11 domains with a 5‐point scale |
| Professional's satisfaction | ||
| Bolas 2004 | Standard of information at discharge improved GPs: 57% agreed Community pharmacists: 95% agreed | Response rate of 55% (GPs) and 56% (community pharmacists) No information provided about the survey |
| Lindpaintner 2013 | Satisfaction with discharge process At 5 d (median and IQR) Primary care physician: T = 1 (1‐2), C = 2 (1‐3) Visiting nurse: T = 1 (1‐2), C = 2 (1‐4) At 30 d (median and IQR) Primary care physician: T = 2 (1‐3), C = 1 (1‐2) | Number of respondents ranged between 15 (visiting nurse) and 30 (PCP) 4‐point Likert scale, lower scores indicate higher satisfaction |
Comparison 7 Effect of discharge planning on satisfaction with care process, Outcome 1 Satisfaction.
| Study | Costs | Notes |
| Gillespie 2009 | Total T: USD 12000; C: USD 12500 Mean difference: − USD 400 (− USD 4000 to USD 3200) Visits to ED T: USD 160; C: USD 260 Mean difference: − USD 100 (− USD 220 to − USD 10) Readmissions T: USD 12000; C: USD 12300 Mean difference: − USD 300 (− USD 3900 to USD 3300) | Costs calculated for 2008 |
| Laramee 2003 | Total inpatient and outpatient median costs P = 0.14 | The case manager (CM) kept a log during the first, middle and last 4 weeks of the recruitment period of how much time was spent with each patient during the 12‐week study period. Thus, |
| Naughton 1994 | — | Number: |
| Naylor 1994 | Initial stay mean charges (USD): Medical readmission total charges in USD (CIs are in thousands): At 2 weeks: 2‐6 weeks: 6‐12 weeks: | Charge data were used to calculate the cost of the initial hospitalisation Readmission costs were calculated using the mean charge per day of the index hospitalisations times the actual number of days of subsequent hospitalisations, as patients were readmitted to a variety of hospitals with a wide range of charges Total charges including readmission charges (first readmission only if multiple readmissions) |
| Rich 1995a | Intervention cost USD 216 per patient Caregiver cost T = USD 1164, C = USD 828 Other medical care T = USD 1257, C = USD 1211 Readmission costs T = USD 2178, C = USD 3236 All costs T = USD 4815, C = USD 5275 | — |
Comparison 8 Effect of discharge planning on hospital care costs, Outcome 1 Patients with a medical condition.
| Study | Costs | Notes |
| Naylor 1994 | Surgical initial stay mean charges (USD): At 2 weeks: 2‐6 weeks: 6‐12 weeks: | Charge data were used to calculate the cost of the initial hospitalisation |
Comparison 8 Effect of discharge planning on hospital care costs, Outcome 2 Patients with a surgical condition.
| Study | Costs | Notes |
| Naji 1999 | T = an additional GBP 1.14 per patient Intervention can avert 3 outpatient appointments for every 10 patients | Telephone calls: T = 124/168 (86%), C = 19/175 (12%) |
Comparison 8 Effect of discharge planning on hospital care costs, Outcome 3 Patients with a mental health diagnosis.
| Study | Costs | Notes |
| Jack 2009 | — | Follow‐up PCP appointments were given an estimated cost of USD 55, on the basis of costs from an average hospital follow‐up visit at Boston Medical Center |
| Legrain 2011 | The cost savings balanced against the cost of the intervention reported to be EUR 519/patient | — |
| Legrain 2011 | Total cost of adverse drug reactions‐related admissions (180 days follow‐up) T = USD 487/participant C = USD 1184/participant P = 0.13 | — |
Comparison 8 Effect of discharge planning on hospital care costs, Outcome 4 Patients admitted to a general medical service.
Comparison 8 Effect of discharge planning on hospital care costs, Outcome 5 Hospital outpatient department attendance.

Comparison 8 Effect of discharge planning on hospital care costs, Outcome 6 First visits to the emergency room.
| Study | Use of services | Notes |
| Farris 2014 | Unscheduled office visits At 30 d T = 31/281 (11%), C = 32/294 (11%) Difference 0%; 95% CI − 5% to 5% At 90 d T = 42/281 (15%), C = 33/294 (11%) Difference 4%; 95% CI − 2 to 9% | Results for Enhanced vs Control intervention (results for minimal intervention not reported) |
| Goldman 2014 | Primary care visits at 30 d T = 189/301 (62.8%), C = 186/316 (58.9%) Difference 4%; 95% CI − 3.7% to 11.5% | — |
| Laramee 2003 | Visiting Nurse postdischarge: | — |
| Nazareth 2001 | General practice attendance: At 3 months: At 6 months: | — |
| Weinberger 1996 | Median time from hospital discharge to the first visit: Visit at least one general medicine clinic in 6‐month follow up: Mean number of visits to general medical clinic: | — |
Comparison 9 Effect of discharge planning on primary and community care costs, Outcome 1 Patients with a medical condition.
| Study | Number of problems | Notes |
| Bolas 2004 | Intervention group demonstrated a higher rate of reconciliation of patient's own drugs with the discharge prescription; 90% compared to the 44% in the control group | — |
| Shaw 2000 | Mean number of problems (SD) At 1 week: At 4 weeks: At 12 weeks: | Problems included difficulty obtaining a prescription from the GP; insufficient knowledge about medication; non‐compliance |
Comparison 10 Effect of discharge planning on medication use, Outcome 1 Medication problems after being discharged from hospital.
| Study | Adherence to medicines | Notes |
| Nazareth 2001 | At 3 months: At 6 months: | 0 = none |
| Rich 1995a | Taking 80% or more of prescribed pills at 30 d after discharge T = 117/142 (82.5%), C = 91/140 (64.9%) | — |
Comparison 10 Effect of discharge planning on medication use, Outcome 2 Adherence to medicines.
| Study | Knowledge | Notes |
| Bolas 2004 | Mean error rate in knowledge of drug therapy at 10‐14 d follow up Drug name T = 15%, C = 43%, P < 0.001 Drug dose T = 14%, C = 39%, P < 0.001 Frequency T = 15%, C = 39%, P < 0.001 (n for each group not reported) | — |
| Nazareth 2001 | At 3 months: At 6 months: | 0 = none |
| Shaw 2000 | At 1 and 12 weeks post‐discharge: Significant improvement in knowledge medication for both groups (no differences between groups) | — |
Comparison 10 Effect of discharge planning on medication use, Outcome 3 Knowledge about medicines.
| Study | Hoarding | Notes |
| Bolas 2004 | 90% of people who brought drugs to the hospital were returned in the intervention group compared to 50% in the controls | — |
| Nazareth 2001 | At 3 months: At 6 months | 0 = none |
Comparison 10 Effect of discharge planning on medication use, Outcome 4 Hoarding of medicines.
| Study | |
| Eggink 2010 | Following a review of medication by a pharmacist, 68% in the control group had at least one discrepancy or medication error compared to 39% in the intervention group (RR 0.57; 95% CI 0.37 to 0.88). The percent of medications with a discrepancy or error in the intervention group was 6.1% in intervention group and 14.6% in the control group (RR = 0.42; 0.27 to 0.66). |
| Kripalani 2012 | Clinically important medication errors (total number of events; could be more than one per patient) At 30 d T = 370/423, M = 0.87 (SD 1.18) C = 407/428, M = 0.95 (SD 1.36) |
Comparison 10 Effect of discharge planning on medication use, Outcome 5 Prescription errors.
| Study | Medication appropriateness | Notes |
| Farris 2014 | Discharge T = 7.1 (SD 7.0), C = 6.1 (SD 6.6) 30 d post‐discharge T = 10.1 (SD 8.9), C = 9.6 (SD 9.5) P = 0.78 90 d post‐discharge T = 11.6 (SD 10.5), C = 11.1 (11.3) P = 0.94 | As measured by the medication appropriateness index (MAI); summed MAI per participant Results for Enhanced v Control intervention (results for minimal intervention not reported) |
Comparison 10 Effect of discharge planning on medication use, Outcome 6 Medication appropriateness.
| Effect of discharge planning on patients admitted to hospital with a medical condition | ||||||
| Patient or population: patients admitted to hospital | ||||||
| Outcomes | Illustrative comparative risks* (95% CI) | Relative effect | No. of participants | Certainty of the evidence | Comments | |
| Assumed risk | Corresponding risk | |||||
| Without discharge planning | With discharge planning | |||||
| Unscheduled readmission within 3 months of discharge from hospital | Study population admitted with a medical condition | RR 0.87 | 4743 | ⊕⊕⊕⊝ | — | |
| 254 per 1000 | 221 per 1000 | |||||
| Moderate risk population | ||||||
| 285 per 1000 | 248 per 1000 | |||||
| Study population admitted following a fall | RR 1.36 (0.46 to 4.01) | 110 (2) | ⊕⊝⊝⊝ very lowb | — | ||
| 93 per 1000 | 126 per 1000 (43 to 371) | |||||
| Moderate risk population | ||||||
| 92 per 1000 | 125 per 1000 (42 to 369) | |||||
| Hospital length of stay | Study population admitted with a medical condition | — | 2193 | ⊕⊕⊕⊝ | — | |
| The mean hospital length of stay ranged across control groups from | The mean hospital length of stay in the intervention groups was | |||||
| Satisfaction | Discharge planning may lead to increased satisfaction for patients and healthcare professionals. | 6 studies | ⊕⊕⊝⊝ low | Patient satisfaction was measured in different ways, and findings were not consistent across studies. Only 6/30 studies reported data for this outcome. | ||
| Costs | A lower readmission rate for those receiving discharge planning may be associated with lower health service costs in the short term. Differences in use of primary care varied. | 5 studies | ⊕⊝⊝⊝ very low | Findings were inconsistent. Healthcare resources that were assessed varied among studies, e.g., primary care visits, readmission, length of stay, laboratory services, medication, diagnostic imaging. The charges used to cost the healthcare resources also varied. | ||
| *The basis for the assumed risk (e.g. the median control group risk across studies) is provided in footnotes. The corresponding risk (and its 95% confidence interval) is based on the assumed risk in the comparison group and the relative effect of the intervention (and its 95% CI). | ||||||
| GRADE Working Group grades of evidence | ||||||
| aThe evidence was downgraded to moderate as allocation concealment was unclear for 5 of the 15 trials. | ||||||
| Outcome or subgroup title | No. of studies | No. of participants | Statistical method | Effect size |
| 1 Hospital length of stay ‐ older patients with a medical condition Show forest plot | 12 | 2193 | Mean Difference (IV, Fixed, 95% CI) | ‐0.73 [‐1.33, ‐0.12] |
| 2 Sensitivity analysis imputing missing SD for Kennedy trial Show forest plot | 11 | 1825 | Mean Difference (IV, Fixed, 95% CI) | ‐0.98 [‐1.57, ‐0.38] |
| 3 Hospital length of stay ‐ older surgical patients Show forest plot | 2 | 184 | Mean Difference (IV, Fixed, 95% CI) | ‐0.06 [‐1.23, 1.11] |
| 4 Hospital length of stay ‐ older medical and surgical patients Show forest plot | 2 | 1108 | Mean Difference (IV, Fixed, 95% CI) | ‐0.60 [‐2.38, 1.18] |
| Outcome or subgroup title | No. of studies | No. of participants | Statistical method | Effect size |
| 1 Within 3 months of discharge from hospital Show forest plot | 17 | 4853 | Risk Ratio (M‐H, Fixed, 95% CI) | 0.88 [0.79, 0.97] |
| 1.1 Unscheduled readmission for those with a medical condition | 15 | 4743 | Risk Ratio (M‐H, Fixed, 95% CI) | 0.87 [0.79, 0.97] |
| 1.2 Older people admitted to hospital following a fall | 2 | 110 | Risk Ratio (M‐H, Fixed, 95% CI) | 1.36 [0.46, 4.01] |
| 2 Patients with medical or surgical condition Show forest plot | Other data | No numeric data | ||
| 3 Patients with a medical condition Show forest plot | Other data | No numeric data | ||
| 4 Patients who have had surgery Show forest plot | Other data | No numeric data | ||
| 5 Patients with a mental health diagnosis Show forest plot | Other data | No numeric data | ||
| Outcome or subgroup title | No. of studies | No. of participants | Statistical method | Effect size |
| 1 Patients with a medical condition Show forest plot | Other data | No numeric data | ||
| 2 Patients with a medical or surgical condition Show forest plot | Other data | No numeric data | ||
| 3 Patients with a surgical condition Show forest plot | Other data | No numeric data | ||
| Outcome or subgroup title | No. of studies | No. of participants | Statistical method | Effect size |
| 1 Patients discharged from hospital to home Show forest plot | 2 | 419 | Risk Ratio (M‐H, Fixed, 95% CI) | 1.03 [0.93, 1.14] |
| 2 Patients with a medical condition Show forest plot | Other data | No numeric data | ||
| 3 Patients with a medical or surgical condition Show forest plot | Other data | No numeric data | ||
| 4 Older patients admitted to hospital following a fall in residential care at 1 year Show forest plot | 1 | 60 | Odds Ratio (M‐H, Fixed, 95% CI) | 0.46 [0.15, 1.40] |
| Outcome or subgroup title | No. of studies | No. of participants | Statistical method | Effect size |
| 1 Mortality at 6 to 9 months Show forest plot | 8 | 2654 | Risk Ratio (M‐H, Fixed, 95% CI) | 1.02 [0.83, 1.27] |
| 1.1 Older people with a medical condition | 7 | 2594 | Risk Ratio (M‐H, Fixed, 95% CI) | 1.02 [0.82, 1.27] |
| 1.2 Older people admitted to hospital following a fall | 1 | 60 | Risk Ratio (M‐H, Fixed, 95% CI) | 1.33 [0.33, 5.45] |
| 2 Mortality for trials recruiting both patients with a medical condition and those recovering from surgery Show forest plot | Other data | No numeric data | ||
| 3 Mortality at 12 months Show forest plot | Other data | No numeric data | ||
| Outcome or subgroup title | No. of studies | No. of participants | Statistical method | Effect size |
| 1 Patient‐reported outcomes: Patients with a medical condition Show forest plot | Other data | No numeric data | ||
| 2 Patient‐reported outcomes: Patients with a surgical condition Show forest plot | Other data | No numeric data | ||
| 3 Patient‐reported outcomes: Patients with a medical or surgical condition Show forest plot | Other data | No numeric data | ||
| 4 Falls at follow‐up: patients admitted to hospital following a fall Show forest plot | 1 | 60 | Risk Ratio (M‐H, Fixed, 95% CI) | 0.87 [0.50, 1.49] |
| 5 Patient‐reported outcomes: Patients with a mental health diagnosis Show forest plot | Other data | No numeric data | ||
| Outcome or subgroup title | No. of studies | No. of participants | Statistical method | Effect size |
| 1 Satisfaction Show forest plot | Other data | No numeric data | ||
| 1.1 Patient and care givers' satisfaction | Other data | No numeric data | ||
| 1.2 Professional's satisfaction | Other data | No numeric data | ||
| Outcome or subgroup title | No. of studies | No. of participants | Statistical method | Effect size |
| 1 Patients with a medical condition Show forest plot | Other data | No numeric data | ||
| 2 Patients with a surgical condition Show forest plot | Other data | No numeric data | ||
| 3 Patients with a mental health diagnosis Show forest plot | Other data | No numeric data | ||
| 4 Patients admitted to a general medical service Show forest plot | Other data | No numeric data | ||
| 5 Hospital outpatient department attendance Show forest plot | 1 | 288 | Risk Ratio (M‐H, Fixed, 95% CI) | 1.07 [0.74, 1.56] |
| 6 First visits to the emergency room Show forest plot | 2 | 740 | Risk Ratio (M‐H, Fixed, 95% CI) | 0.80 [0.61, 1.07] |
| Outcome or subgroup title | No. of studies | No. of participants | Statistical method | Effect size |
| 1 Patients with a medical condition Show forest plot | Other data | No numeric data | ||
| Outcome or subgroup title | No. of studies | No. of participants | Statistical method | Effect size |
| 1 Medication problems after being discharged from hospital Show forest plot | Other data | No numeric data | ||
| 2 Adherence to medicines Show forest plot | Other data | No numeric data | ||
| 3 Knowledge about medicines Show forest plot | Other data | No numeric data | ||
| 4 Hoarding of medicines Show forest plot | Other data | No numeric data | ||
| 5 Prescription errors Show forest plot | Other data | No numeric data | ||
| 6 Medication appropriateness Show forest plot | Other data | No numeric data | ||