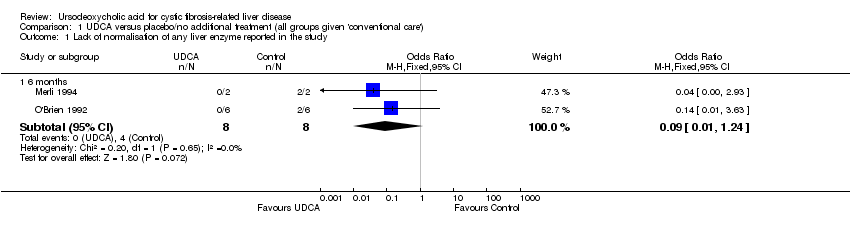
| 1 Lack of normalisation of any liver enzyme reported in the study Show forest plot | 2 | | Odds Ratio (M‐H, Fixed, 95% CI) | Subtotals only |
|
| 1.1 6 months | 2 | 16 | Odds Ratio (M‐H, Fixed, 95% CI) | 0.09 [0.01, 1.24] |
| 2 Lack of normalisation of all liver enzymes reported in the study Show forest plot | 2 | | Odds Ratio (M‐H, Fixed, 95% CI) | Subtotals only |
|
| 2.1 6 months | 2 | 16 | Odds Ratio (M‐H, Fixed, 95% CI) | 0.0 [0.0, 0.0] |
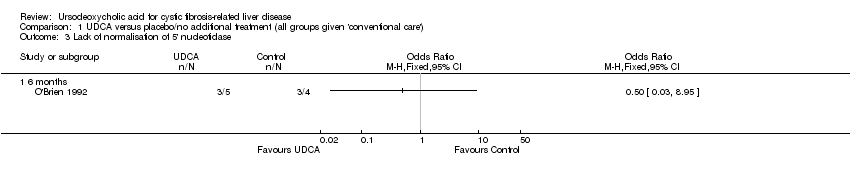
| 3 Lack of normalisation of 5' nucleotidase Show forest plot | 1 | | Odds Ratio (M‐H, Fixed, 95% CI) | Totals not selected |
|
| 3.1 6 months | 1 | | Odds Ratio (M‐H, Fixed, 95% CI) | 0.0 [0.0, 0.0] |
| 4 Lack of normalisation of aspartate transaminase Show forest plot | 2 | | Odds Ratio (M‐H, Fixed, 95% CI) | Subtotals only |
|
| 4.1 6 months | 2 | 14 | Odds Ratio (M‐H, Fixed, 95% CI) | 11.0 [0.43, 284.30] |
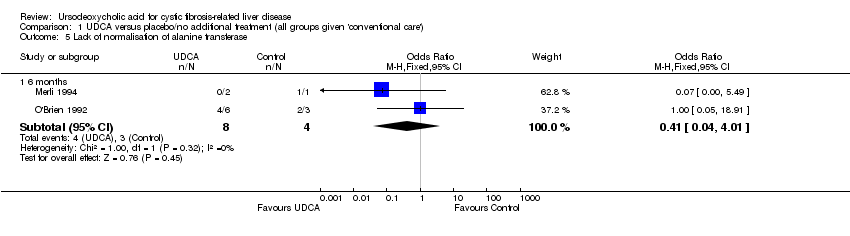
| 5 Lack of normalisation of alanine transferase Show forest plot | 2 | | Odds Ratio (M‐H, Fixed, 95% CI) | Subtotals only |
|
| 5.1 6 months | 2 | 12 | Odds Ratio (M‐H, Fixed, 95% CI) | 0.41 [0.04, 4.01] |
| 6 Lack of normalisation of gammaglutamate transferase Show forest plot | 2 | | Odds Ratio (M‐H, Fixed, 95% CI) | Subtotals only |
|
| 6.1 6 months | 2 | 10 | Odds Ratio (M‐H, Fixed, 95% CI) | 0.33 [0.02, 6.65] |
| 7 Need for liver transplantation Show forest plot | 3 | | Odds Ratio (M‐H, Fixed, 95% CI) | Subtotals only |
|
| 7.1 0 to 6 months | 2 | 30 | Odds Ratio (M‐H, Fixed, 95% CI) | 0.0 [0.0, 0.0] |
| 7.2 7 to 12 months | 1 | 28 | Odds Ratio (M‐H, Fixed, 95% CI) | 2.79 [0.10, 74.63] |
| 8 Death related to liver disease Show forest plot | 2 | | Odds Ratio (M‐H, Fixed, 95% CI) | Subtotals only |
|
| 8.1 0 to 6 months | 2 | 30 | Odds Ratio (M‐H, Fixed, 95% CI) | 0.0 [0.0, 0.0] |
| 8.2 7 to 12 months | 0 | 0 | Odds Ratio (M‐H, Fixed, 95% CI) | 0.0 [0.0, 0.0] |
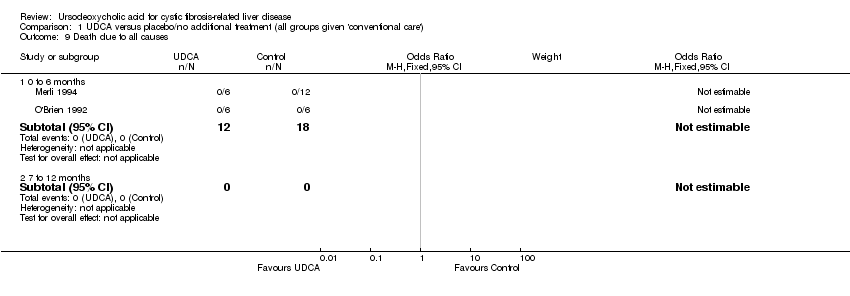
| 9 Death due to all causes Show forest plot | 2 | | Odds Ratio (M‐H, Fixed, 95% CI) | Subtotals only |
|
| 9.1 0 to 6 months | 2 | 30 | Odds Ratio (M‐H, Fixed, 95% CI) | 0.0 [0.0, 0.0] |
| 9.2 7 to 12 months | 0 | 0 | Odds Ratio (M‐H, Fixed, 95% CI) | 0.0 [0.0, 0.0] |
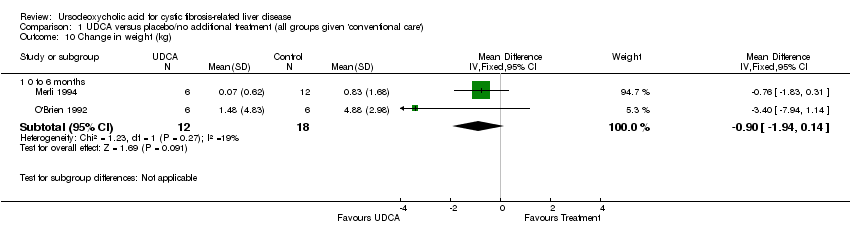
| 10 Change in weight (kg) Show forest plot | 2 | | Mean Difference (IV, Fixed, 95% CI) | Subtotals only |
|
| 10.1 0 to 6 months | 2 | 30 | Mean Difference (IV, Fixed, 95% CI) | ‐0.90 [‐1.94, 0.14] |
| 11 Development of portal hypertension Show forest plot | 2 | | Odds Ratio (M‐H, Fixed, 95% CI) | Subtotals only |
|
| 11.1 0 to 6 months | 2 | 30 | Odds Ratio (M‐H, Fixed, 95% CI) | 0.0 [0.0, 0.0] |
| 11.2 7 to 12 months | 0 | 0 | Odds Ratio (M‐H, Fixed, 95% CI) | 0.0 [0.0, 0.0] |
| 12 Development of complications of portal hypertension Show forest plot | 2 | | Odds Ratio (M‐H, Fixed, 95% CI) | Subtotals only |
|
| 12.1 0 to 6 months | 2 | 30 | Odds Ratio (M‐H, Fixed, 95% CI) | 0.0 [0.0, 0.0] |
| 12.2 7 to 12 months | 0 | 0 | Odds Ratio (M‐H, Fixed, 95% CI) | 0.0 [0.0, 0.0] |