Trombolisis para el accidente cerebrovascular isquémico agudo
Información
- DOI:
- https://doi.org/10.1002/14651858.CD000213.pub3Copiar DOI

- Base de datos:
-
- Cochrane Database of Systematic Reviews
- Versión publicada:
-
- 29 julio 2014see what's new
- Tipo:
-
- Intervention
- Etapa:
-
- Review
- Grupo Editorial Cochrane:
-
Grupo Cochrane de Accidentes cerebrovasculares
- Copyright:
-
- Copyright © 2016 The Cochrane Collaboration. Published by John Wiley & Sons, Ltd.
Cifras del artículo
Altmetric:
Citado por:
Autores
Contributions of authors
Four review authors contributed to the collection of data in previous versions, including non‐English language publication literature searching. Dr Eivind Berge undertook further detailed literature searching for the 2003 update. Both Dr Veronica Murray and Prof Joanna Wardlaw reviewed all new trials since 2003 and extracted, verified and entered new data for the 2009 update. Dr Veronica Murray also cross‐checked all previously extracted data. Both Prof Joanna Wardlaw and Dr Veronica Murray checked additional publications since 2003 of trials already included in the 2003 version for additional new information. All review authors also contributed to interpretation of the data. Prof Joanna Wardlaw drafted the review and the other review authors contributed to the critical revision of that review and final approval of the version to be published.
Sources of support
Internal sources
-
Department of Clinical Neurosciences, University of Edinburgh, Scotland, UK.
External sources
-
Scottish Office Chief Scientist's Office for the Cochrane Stroke Group, UK.
-
Previous versions of this review were supported by the Stroke Association and the UK Medical Research Council, UK.
-
Previous updates were supported in part by a grant from the NHS Health Technology Assessment (HTA) Programme (Grant 98/02/02), UK.
-
The Norwegian Research Council supported Dr Eivind Berge for a year in Edinburgh, Norway.
-
The Swedish Heart‐Lungfund, AFA and The Marianne and Marcus Wallenberg Foundation supported Dr Veronica Murray, Sweden.
-
The present update of the review was supported by a grant from the UK National Institutes of Health Research Cochrane Review Incentive Scheme 2013, UK.
Grant to help update the review
Declarations of interest
The Division of Clinical Neurosciences at the University of Edinburgh had a collaborative project with Boehringer Ingelheim (UK) to establish a research magnetic resonance scanner, through the UK Research Councils Joint Research Equipment Initiative in 1997. For this, the Division received a grant from Boehringer Ingelheim, manufacturers of rt‐PA in Europe, towards the purchase of the scanner. Further details of competing interests are listed on the Division's web site (www.dcn.ed.ac.uk).
The Division of Clinical Neurosciences at the University of Edinburgh are co‐ordinating the Third International Stroke Trial (IST3 2012) of intravenous tissue Plasminogen Activator within six hours of acute ischaemic stroke. Prof Joanna Wardlaw is the Imaging Principal Investigator of this trial, Dr Veronica Murray is the Swedish National Co‐ordinator and Dr Eivind Berge is the Norwegian National Co‐ordinator for IST‐3. The start‐up phase was funded by the UK Stroke Association and PPP Foundation, with a limited supply of drug and placebo for the first part of the start‐up phase from Boehringer Ingelheim; the main trial is funded by the UK Medical Research Council.
Prof Joanna Wardlaw received payment from Boehringer Ingelheim for reading scans for ECASS 3 on a cost‐per‐scan basis up to 2008. She was/is on the Steering Committees of MAST‐I 1995, IST3 2012, and contributed to the design of ECASS 3 2008 (first Steering Committee meeting and design of scan reading). Boehringer Ingelheim applied for an extension to the licence for rt‐PA from three to 4.5 hours on the basis of the ECASS 3 2008 result and supporting data, such as individual patient data analyses and the Cochrane review.
The review was assembled, analysed and reported independent of any sponsor or pharmaceutical company.
Acknowledgements
Although supported in part by a grant from the NHS Executive, the opinions and views expressed in this update do not necessarily reflect those of the NHS Executive.
We thank Prof Take Yamaguchi, now Emeritus Professor of Neurology, Cardiovascular Division, National Cardiovascular Centre, Osaka, Japan (author from the first version in 1995 to the third version in 2003) and Prof Werner Hacke, Professor of Neurology, University of Heidelberg, Germany (author on the first version in 1995) for their support on previous versions of this review.
We are very grateful to the principal investigators of all the trials who provided additional unpublished information, particularly Prof E Mori, Prof T Abe, Prof E Ohtomo, Prof L Candelise, Prof W Hacke, Prof M Kaste, Dr D Meier, Dr J Marler, Prof G Donnan, Dr M Hommel, Prof T Furlan, Dr G Albers, Dr W Clarke, and Prof Q Chen.
We would like to thank Dr Yasir Al‐Rawi for providing additional unpublished details of the DEDAS 2006, DIAS 2005, and DIAS 2 2008 trials on behalf of Paion GMBH. We would also like to thank Dr Mei‐Chiun Tseng for translating Chinese papers, Dr Kyoshi Miyagawa for translating the Japanese language papers, and Dr Kazuo Minematsu and Dr Masahiro Yasaka of the National Cardiovascular Centre, Osaka, Japan for assistance in journal searching and translation, Dr David Moher of the Ottawa Stroke Trials Registry, Dr Ming Liu and Dr Mei‐Chiun Tseng for the information on the Chinese trials, Dr Hans‐Goran Hardemark for pointing out discrepancies in the Rankin dichotomisation point for some trials, and Hazel Fraser and Brenda Thomas of the Cochrane Stroke Group for trial lists. We would also like to thank Brenda Thomas for assistance with literature searching. We would like to thank Ms Kirsten Shuler for entering references and data. We also thank the Stroke Association of the United Kingdom, and the UK Medical Research Council for previous financial support for this review. The Norwegian Research Council supported Dr Eivind Berge. The Swedish Heart‐Lungfund, AFA Insurances and Karolinska Institutet supported Dr Veronica Murray. Anyone aware of any thrombolysis trials not mentioned herein, or inaccuracies, should please contact us with the relevant information.
Version history
| Published | Title | Stage | Authors | Version |
| 2014 Jul 29 | Thrombolysis for acute ischaemic stroke | Review | Joanna M Wardlaw, Veronica Murray, Eivind Berge, Gregory J del Zoppo | |
| 2009 Oct 07 | Thrombolysis for acute ischaemic stroke | Review | Joanna M Wardlaw, Veronica Murray, Eivind Berge, Gregory J del Zoppo | |
| 2009 Jul 08 | Thrombolysis for acute ischaemic stroke | Review | Joanna M Wardlaw, Gregory J del Zoppo, Takenori Yamaguchi, Eivind Berge | |
Differences between protocol and review
None in principle. The original protocol was written in 1992, since when Cochrane Reviews have become more complex, data analyses have been refined and substantially more data have become available for this review. Notwithstanding, the basic principles of this review are unchanged from the original protocol.
Keywords
MeSH
Medical Subject Headings (MeSH) Keywords
- *Thrombolytic Therapy [adverse effects];
- Brain Ischemia [drug therapy];
- Drug Administration Schedule;
- Fibrinolytic Agents [adverse effects, *therapeutic use];
- Intracranial Hemorrhages [chemically induced];
- Randomized Controlled Trials as Topic;
- Stroke [*drug therapy, etiology, mortality];
- Time‐to‐Treatment;
- Tissue Plasminogen Activator [adverse effects, therapeutic use];
Medical Subject Headings Check Words
Humans;
PICO

Comparison 1 Any thrombolytic agent versus control, Outcome 1 Deaths from all causes within 7 to 10 days.

Comparison 1 Any thrombolytic agent versus control, Outcome 2 Fatal intracranial haemorrhage within 7 to 10 days.

Comparison 1 Any thrombolytic agent versus control, Outcome 3 Deaths within the first 7 to 10 days from causes other than fatal intracranial haemorrhage.

Comparison 1 Any thrombolytic agent versus control, Outcome 4 Symptomatic (including fatal) intracranial haemorrhage within 7 to 10 days.

Comparison 1 Any thrombolytic agent versus control, Outcome 5 Symptomatic (including fatal) cerebral oedema.

Comparison 1 Any thrombolytic agent versus control, Outcome 6 Death or dependency at the end of follow‐up.

Comparison 1 Any thrombolytic agent versus control, Outcome 7 Deaths occurring between 7 and 10 days and the end of follow‐up.
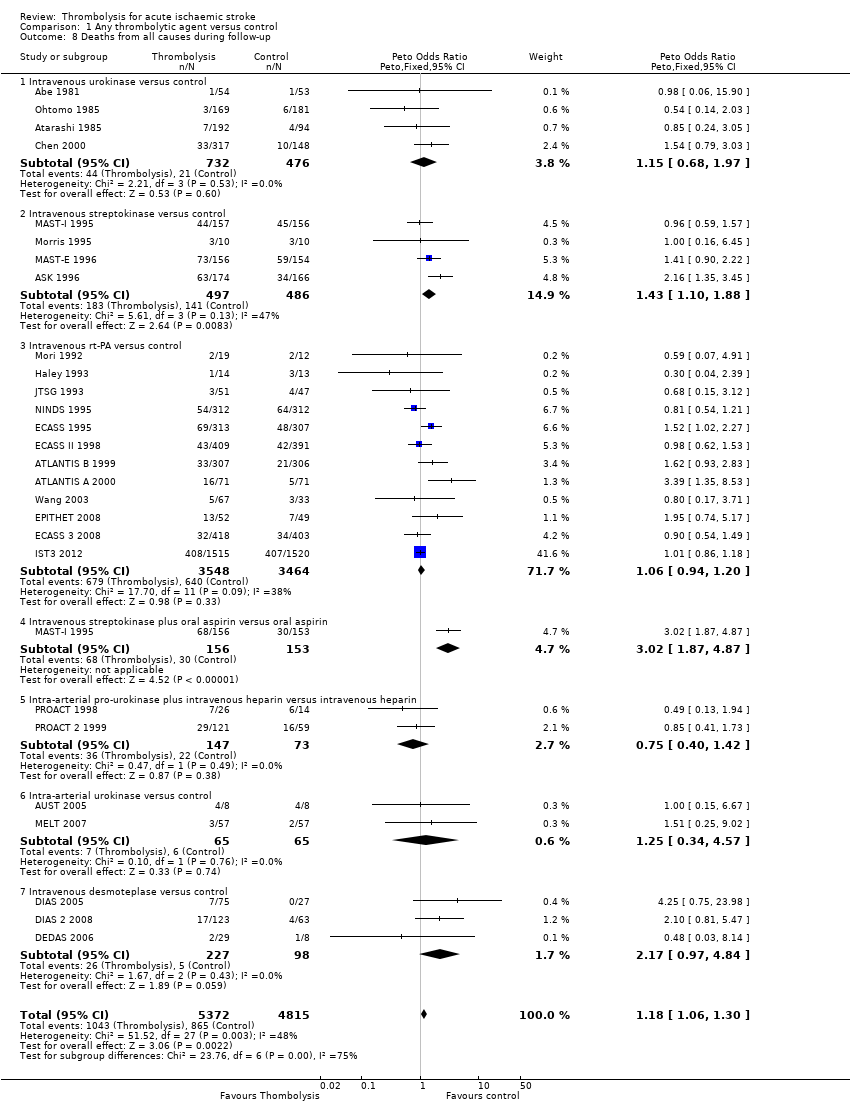
Comparison 1 Any thrombolytic agent versus control, Outcome 8 Deaths from all causes during follow‐up.

Comparison 1 Any thrombolytic agent versus control, Outcome 9 Death or dependency defined as mRS 2 to 6.

Comparison 1 Any thrombolytic agent versus control, Outcome 10 Death or dependency defined as mRS 3 to 6.
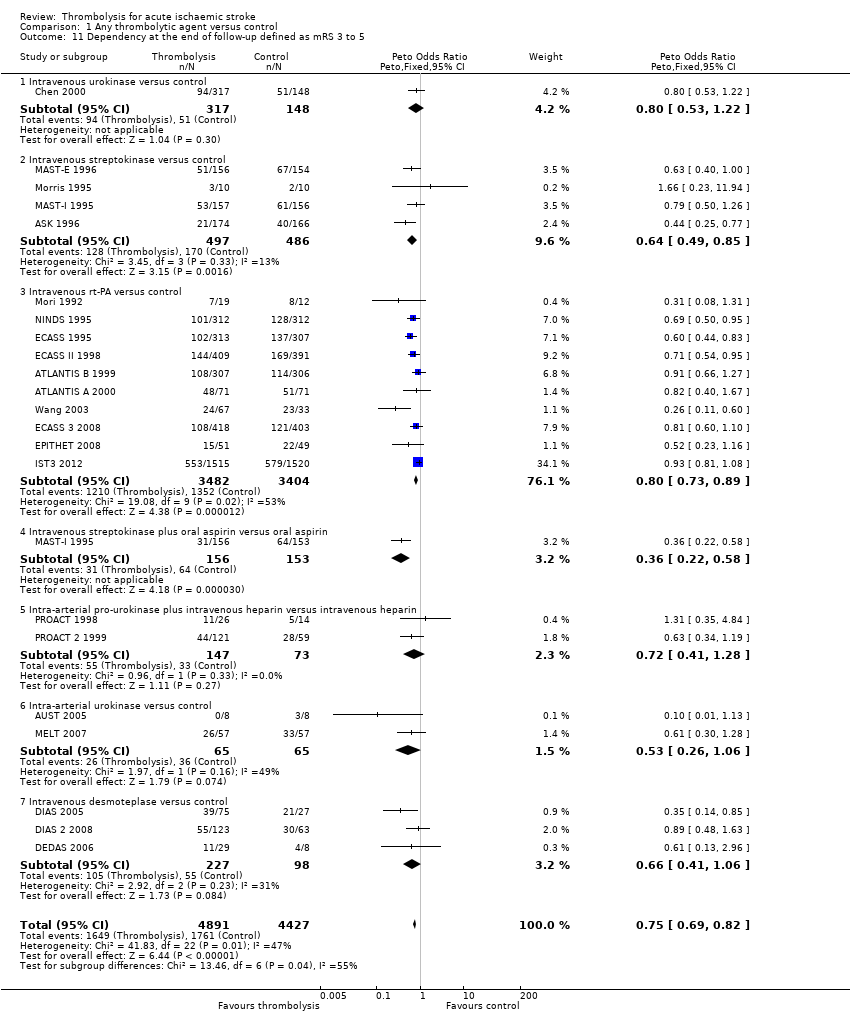
Comparison 1 Any thrombolytic agent versus control, Outcome 11 Dependency at the end of follow‐up defined as mRS 3 to 5.

Comparison 1 Any thrombolytic agent versus control, Outcome 12 Alive and independent (mRS 0 to 2) at end of follow‐up, participants treated up to six hours.

Comparison 1 Any thrombolytic agent versus control, Outcome 13 Alive and favourable outcome (mRS 0 to 1) at end of follow‐up, participants treated up to six hours.

Comparison 1 Any thrombolytic agent versus control, Outcome 14 Deaths from all causes ordered by antithrombotic drug use.

Comparison 1 Any thrombolytic agent versus control, Outcome 15 Deaths from all causes ordered by stroke severity.

Comparison 1 Any thrombolytic agent versus control, Outcome 16 Death or dependency at the end of follow‐up: participants randomised within 3 hours of stroke.
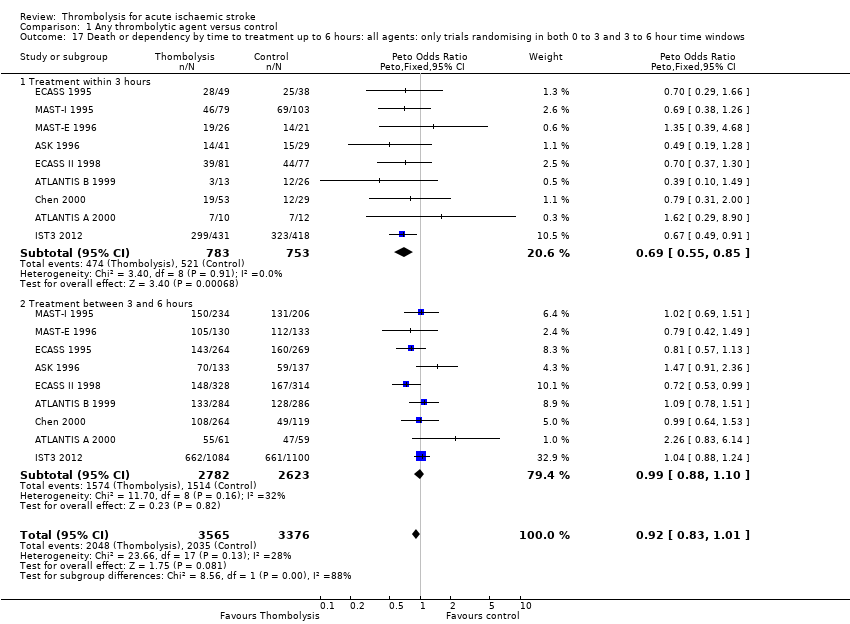
Comparison 1 Any thrombolytic agent versus control, Outcome 17 Death or dependency by time to treatment up to 6 hours: all agents: only trials randomising in both 0 to 3 and 3 to 6 hour time windows.
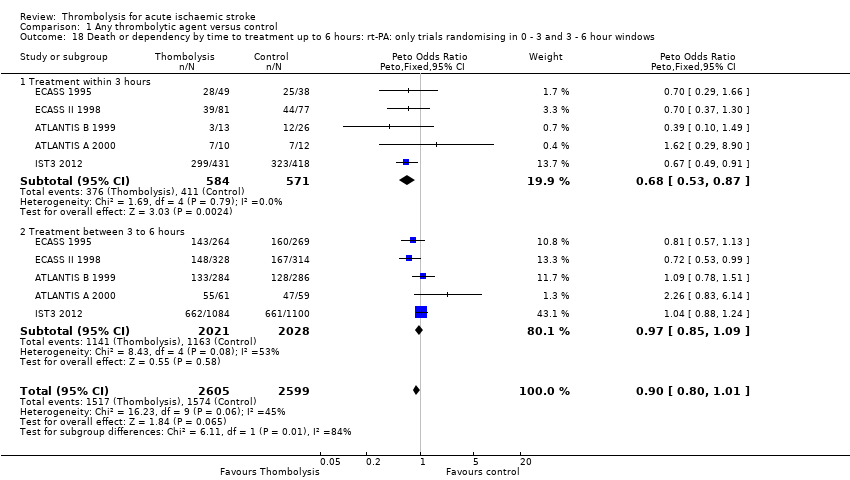
Comparison 1 Any thrombolytic agent versus control, Outcome 18 Death or dependency by time to treatment up to 6 hours: rt‐PA: only trials randomising in 0 ‐ 3 and 3 ‐ 6 hour windows.
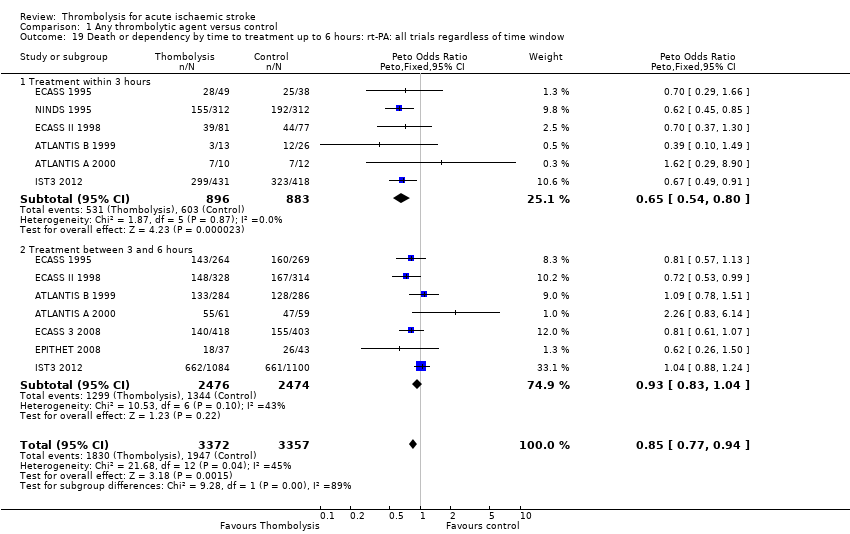
Comparison 1 Any thrombolytic agent versus control, Outcome 19 Death or dependency by time to treatment up to 6 hours: rt‐PA: all trials regardless of time window.

Comparison 1 Any thrombolytic agent versus control, Outcome 20 Death or dependency by latest time to randomisation.

Comparison 1 Any thrombolytic agent versus control, Outcome 21 Alive and independent (mRS 0 to 2) at end of follow‐up, participants treated < 3 versus 3 to 6 hours, all trials regardless of latest time window.

Comparison 1 Any thrombolytic agent versus control, Outcome 22 Alive and favourable outcome (mRS 0 to 1) at end of follow‐up, < 3 versus 3 ‐ 6 hours, only trials randomising in both time windows.
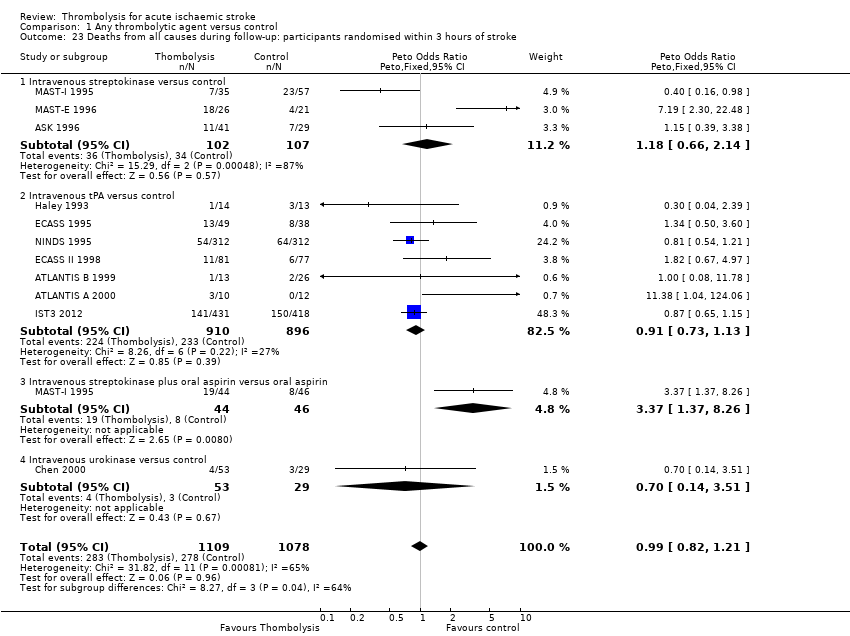
Comparison 1 Any thrombolytic agent versus control, Outcome 23 Deaths from all causes during follow‐up: participants randomised within 3 hours of stroke.

Comparison 1 Any thrombolytic agent versus control, Outcome 24 Deaths by time to treatment up to 6 hours: all agents: only trials randomising in both 0 ‐ 3 and 3 ‐ 6 hour time windows.

Comparison 1 Any thrombolytic agent versus control, Outcome 25 Deaths by time to treatment up to 6 hours: rt‐PA: only trials randomising in both 0 to 3 and 3 to 6 hour time windows.

Comparison 1 Any thrombolytic agent versus control, Outcome 26 Deaths by time to treatment up to 6 hours: rt‐PA: all trials regardless of time window.

Comparison 1 Any thrombolytic agent versus control, Outcome 27 Death by latest time to treatment.
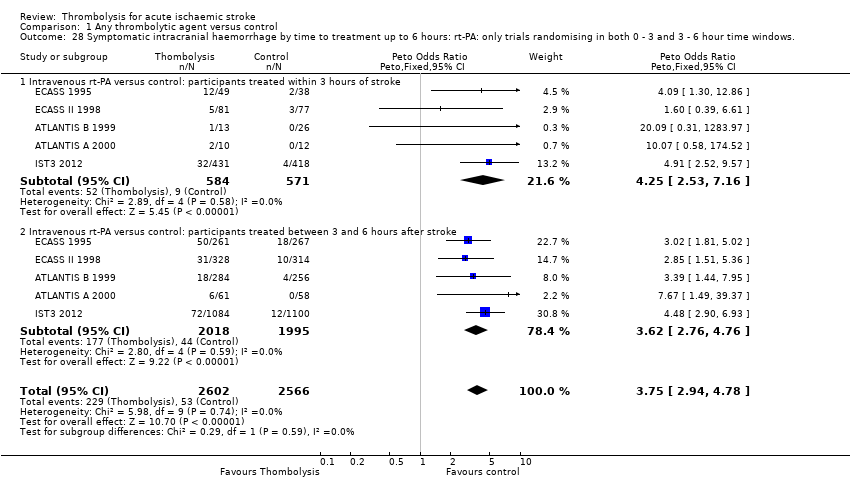
Comparison 1 Any thrombolytic agent versus control, Outcome 28 Symptomatic intracranial haemorrhage by time to treatment up to 6 hours: rt‐PA: only trials randomising in both 0 ‐ 3 and 3 ‐ 6 hour time windows..
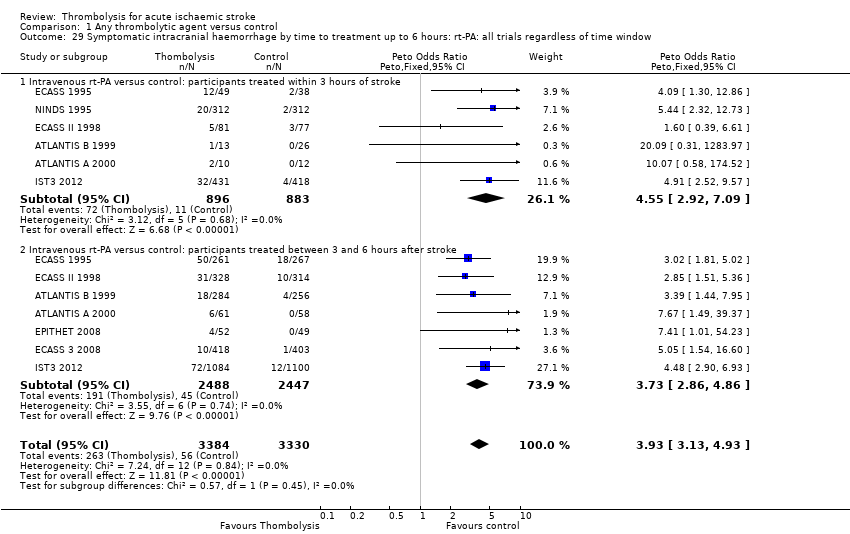
Comparison 1 Any thrombolytic agent versus control, Outcome 29 Symptomatic intracranial haemorrhage by time to treatment up to 6 hours: rt‐PA: all trials regardless of time window.

Comparison 1 Any thrombolytic agent versus control, Outcome 30 Symptomatic intracranial haemorrhage by latest time to treatment.
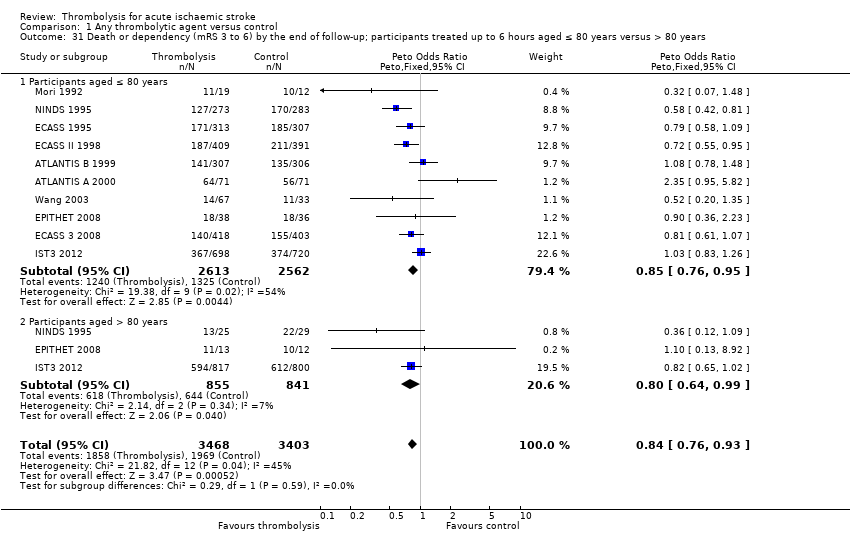
Comparison 1 Any thrombolytic agent versus control, Outcome 31 Death or dependency (mRS 3 to 6) by the end of follow‐up; participants treated up to 6 hours aged ≤ 80 years versus > 80 years.

Comparison 1 Any thrombolytic agent versus control, Outcome 32 Death or dependency (mRS 3 to 6) by the end of follow‐up, participants treated within 3 hours aged ≤ 80 years versus > 80 years.

Comparison 1 Any thrombolytic agent versus control, Outcome 33 Alive and independent (mRS 0 to 2) at end of follow‐up, participants treated up to 6 hours aged ≤ 80 years versus > 80 years.

Comparison 1 Any thrombolytic agent versus control, Outcome 34 Alive and independent (mRS 0 to 2) at end of folllow‐up, participants treated within 3 hours, aged ≤ 80 years versus > 80 years.

Comparison 1 Any thrombolytic agent versus control, Outcome 35 Alive and independent (mRS 0 to 2) at end of follow‐up, participants treated 3 ‐ 6 hours, aged ≤ 80 years versus > 80 years.

Comparison 1 Any thrombolytic agent versus control, Outcome 36 Death: selection by MR DWI/PWI or CT.
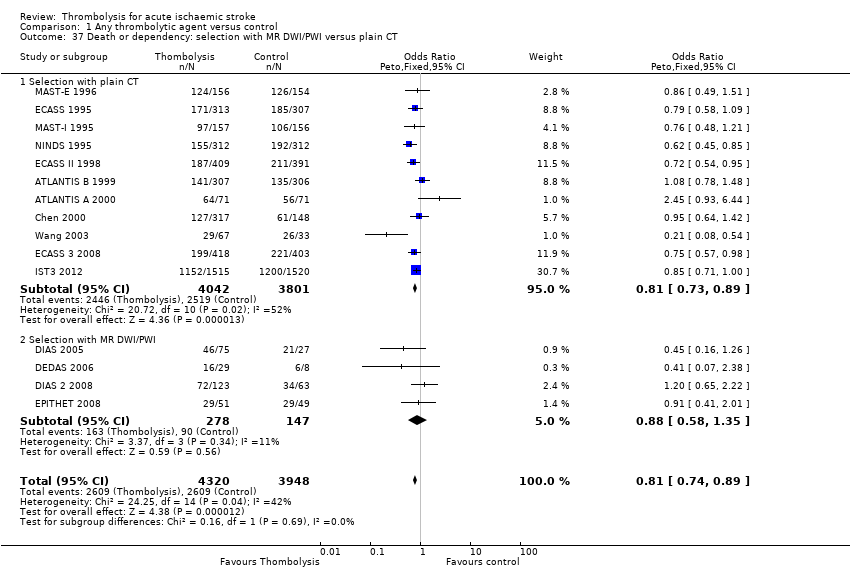
Comparison 1 Any thrombolytic agent versus control, Outcome 37 Death or dependency: selection with MR DWI/PWI versus plain CT.

Comparison 1 Any thrombolytic agent versus control, Outcome 38 Symptomatic intracranial haemorrhage: selection with MR DWI/PWI or CT.

Comparison 1 Any thrombolytic agent versus control, Outcome 39 Alive and independent (mRS 0 to 1) at end of follow‐up, by plain CT ASPECTS score.
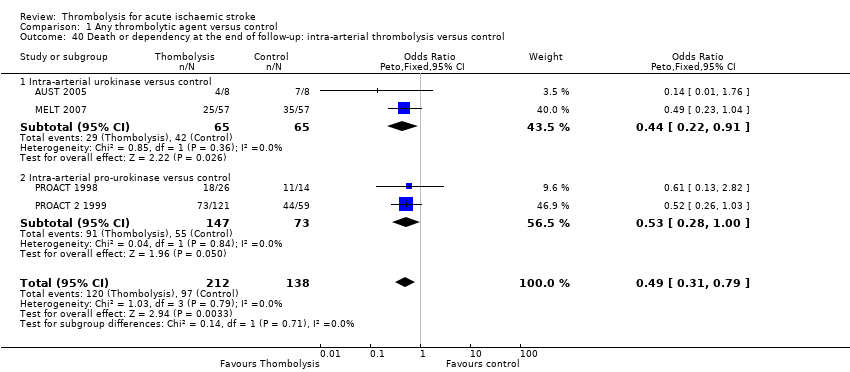
Comparison 1 Any thrombolytic agent versus control, Outcome 40 Death or dependency at the end of follow‐up: intra‐arterial thrombolysis versus control.
| Outcome or subgroup title | No. of studies | No. of participants | Statistical method | Effect size |
| 1 Deaths from all causes within 7 to 10 days Show forest plot | 13 | 7458 | Peto Odds Ratio (Peto, Fixed, 95% CI) | 1.69 [1.44, 1.98] |
| 1.1 Intravenous urokinase versus control | 1 | 465 | Peto Odds Ratio (Peto, Fixed, 95% CI) | 1.35 [0.62, 2.94] |
| 1.2 Intravenous streptokinase versus control | 3 | 963 | Peto Odds Ratio (Peto, Fixed, 95% CI) | 1.90 [1.37, 2.63] |
| 1.3 Intravenous rt‐PA versus control | 8 | 5535 | Peto Odds Ratio (Peto, Fixed, 95% CI) | 1.44 [1.18, 1.76] |
| 1.4 Intravenous streptokinase plus oral aspirin versus oral aspirin | 1 | 309 | Peto Odds Ratio (Peto, Fixed, 95% CI) | 3.86 [2.26, 6.59] |
| 1.5 Intravenous desmoteplase versus control | 1 | 186 | Peto Odds Ratio (Peto, Fixed, 95% CI) | 4.73 [0.85, 26.26] |
| 2 Fatal intracranial haemorrhage within 7 to 10 days Show forest plot | 17 | 9066 | Peto Odds Ratio (Peto, Fixed, 95% CI) | 4.53 [3.47, 5.91] |
| 2.1 Intravenous urokinase versus control | 2 | 751 | Peto Odds Ratio (Peto, Fixed, 95% CI) | 4.43 [1.08, 18.18] |
| 2.2 Intravenous streptokinase versus control | 4 | 983 | Peto Odds Ratio (Peto, Fixed, 95% CI) | 6.03 [3.47, 10.47] |
| 2.3 Intravenous rt‐PA versus control | 8 | 6683 | Peto Odds Ratio (Peto, Fixed, 95% CI) | 4.18 [2.99, 5.84] |
| 2.4 Intravenous streptokinase plus oral aspirin versus oral aspirin | 1 | 309 | Peto Odds Ratio (Peto, Fixed, 95% CI) | 4.56 [1.62, 12.84] |
| 2.5 Intra‐arterial pro‐urokinase plus intravenous heparin versus intravenous heparin | 1 | 40 | Peto Odds Ratio (Peto, Fixed, 95% CI) | 0.51 [0.03, 9.65] |
| 2.6 Intra‐arterial urokinase versus control | 1 | 114 | Peto Odds Ratio (Peto, Fixed, 95% CI) | 7.39 [0.15, 372.38] |
| 2.7 Intravenous desmoteplase versus control | 1 | 186 | Peto Odds Ratio (Peto, Fixed, 95% CI) | 4.65 [0.58, 37.52] |
| 3 Deaths within the first 7 to 10 days from causes other than fatal intracranial haemorrhage Show forest plot | 10 | 7226 | Peto Odds Ratio (Peto, Fixed, 95% CI) | 1.08 [0.90, 1.30] |
| 3.1 Intravenous urokinase versus control | 1 | 465 | Peto Odds Ratio (Peto, Fixed, 95% CI) | 0.87 [0.35, 2.13] |
| 3.2 Intravenous streptokinase versus control | 3 | 963 | Peto Odds Ratio (Peto, Fixed, 95% CI) | 1.05 [0.72, 1.53] |
| 3.3 Intravenous rt‐PA versus control | 5 | 5303 | Peto Odds Ratio (Peto, Fixed, 95% CI) | 0.93 [0.73, 1.18] |
| 3.4 Intravenous streptokinase plus oral aspirin versus oral aspirin | 1 | 309 | Peto Odds Ratio (Peto, Fixed, 95% CI) | 3.13 [1.74, 5.62] |
| 3.5 Intravenous desmoteplase versus control | 1 | 186 | Peto Odds Ratio (Peto, Fixed, 95% CI) | 4.57 [0.24, 86.20] |
| 4 Symptomatic (including fatal) intracranial haemorrhage within 7 to 10 days Show forest plot | 27 | 10186 | Peto Odds Ratio (Peto, Fixed, 95% CI) | 3.75 [3.11, 4.51] |
| 4.1 Intravenous urokinase versus control | 4 | 1208 | Peto Odds Ratio (Peto, Fixed, 95% CI) | 1.28 [0.47, 3.48] |
| 4.2 Intravenous streptokinase versus control | 4 | 983 | Peto Odds Ratio (Peto, Fixed, 95% CI) | 5.20 [3.25, 8.32] |
| 4.3 Intravenous rt‐PA versus control | 12 | 7011 | Peto Odds Ratio (Peto, Fixed, 95% CI) | 3.72 [2.98, 4.64] |
| 4.4 Intravenous streptokinase plus oral aspirin versus oral aspirin | 1 | 309 | Peto Odds Ratio (Peto, Fixed, 95% CI) | 4.02 [1.55, 10.40] |
| 4.5 Intra‐arterial pro‐urokinase plus intravenous heparin versus intravenous heparin | 2 | 220 | Peto Odds Ratio (Peto, Fixed, 95% CI) | 2.39 [0.88, 6.47] |
| 4.6 Intra‐arterial urokinase versus control | 2 | 130 | Peto Odds Ratio (Peto, Fixed, 95% CI) | 4.04 [0.79, 20.74] |
| 4.7 Intravenous desmoteplase versus control | 3 | 325 | Peto Odds Ratio (Peto, Fixed, 95% CI) | 4.50 [1.37, 14.81] |
| 5 Symptomatic (including fatal) cerebral oedema Show forest plot | 6 | 5961 | Peto Odds Ratio (Peto, Fixed, 95% CI) | 0.97 [0.79, 1.19] |
| 6 Death or dependency at the end of follow‐up Show forest plot | 22 | 9318 | Peto Odds Ratio (Peto, Fixed, 95% CI) | 0.85 [0.78, 0.93] |
| 6.1 Intravenous urokinase versus control | 1 | 465 | Peto Odds Ratio (Peto, Fixed, 95% CI) | 0.95 [0.64, 1.42] |
| 6.2 Intravenous streptokinase versus control | 4 | 983 | Peto Odds Ratio (Peto, Fixed, 95% CI) | 0.94 [0.72, 1.24] |
| 6.3 Intravenous rtA versus control | 10 | 6886 | Peto Odds Ratio (Peto, Fixed, 95% CI) | 0.84 [0.77, 0.93] |
| 6.4 Intravenous streptokinase plus oral aspirin versus oral aspirin | 1 | 309 | Peto Odds Ratio (Peto, Fixed, 95% CI) | 1.09 [0.69, 1.73] |
| 6.5 Intra‐arterial pro‐urokinase plus intravenous heparin versus intravenous heparin | 2 | 220 | Peto Odds Ratio (Peto, Fixed, 95% CI) | 0.55 [0.31, 1.00] |
| 6.6 Intra‐arterial urokinase versus control | 2 | 130 | Peto Odds Ratio (Peto, Fixed, 95% CI) | 0.57 [0.28, 1.14] |
| 6.7 Intravenous desmoteplase versus control | 3 | 325 | Peto Odds Ratio (Peto, Fixed, 95% CI) | 0.86 [0.53, 1.40] |
| 7 Deaths occurring between 7 and 10 days and the end of follow‐up Show forest plot | 13 | 7458 | Peto Odds Ratio (Peto, Fixed, 95% CI) | 0.88 [0.76, 1.02] |
| 7.1 Intravenous urokinase versus control | 1 | 465 | Peto Odds Ratio (Peto, Fixed, 95% CI) | 2.05 [0.60, 6.99] |
| 7.2 Intravenous streptokinase versus control | 3 | 963 | Peto Odds Ratio (Peto, Fixed, 95% CI) | 0.88 [0.61, 1.26] |
| 7.3 Intravenous rt‐PA versus control | 8 | 5535 | Peto Odds Ratio (Peto, Fixed, 95% CI) | 0.84 [0.71, 0.99] |
| 7.4 Intravenous streptokinase plus oral aspirin versus control | 1 | 309 | Peto Odds Ratio (Peto, Fixed, 95% CI) | 1.06 [0.49, 2.27] |
| 7.5 Intravenous desmoteplase versus control | 1 | 186 | Peto Odds Ratio (Peto, Fixed, 95% CI) | 4.95 [1.37, 17.86] |
| 8 Deaths from all causes during follow‐up Show forest plot | 27 | 10187 | Peto Odds Ratio (Peto, Fixed, 95% CI) | 1.18 [1.06, 1.30] |
| 8.1 Intravenous urokinase versus control | 4 | 1208 | Peto Odds Ratio (Peto, Fixed, 95% CI) | 1.15 [0.68, 1.97] |
| 8.2 Intravenous streptokinase versus control | 4 | 983 | Peto Odds Ratio (Peto, Fixed, 95% CI) | 1.43 [1.10, 1.88] |
| 8.3 Intravenous rt‐PA versus control | 12 | 7012 | Peto Odds Ratio (Peto, Fixed, 95% CI) | 1.06 [0.94, 1.20] |
| 8.4 Intravenous streptokinase plus oral aspirin versus oral aspirin | 1 | 309 | Peto Odds Ratio (Peto, Fixed, 95% CI) | 3.02 [1.87, 4.87] |
| 8.5 Intra‐arterial pro‐urokinase plus intravenous heparin versus intravenous heparin | 2 | 220 | Peto Odds Ratio (Peto, Fixed, 95% CI) | 0.75 [0.40, 1.42] |
| 8.6 Intra‐arterial urokinase versus control | 2 | 130 | Peto Odds Ratio (Peto, Fixed, 95% CI) | 1.25 [0.34, 4.57] |
| 8.7 Intravenous desmoteplase versus control | 3 | 325 | Peto Odds Ratio (Peto, Fixed, 95% CI) | 2.17 [0.97, 4.84] |
| 9 Death or dependency defined as mRS 2 to 6 Show forest plot | 21 | 8824 | Peto Odds Ratio (Peto, Fixed, 95% CI) | 0.76 [0.70, 0.84] |
| 9.1 Intravenous urokinase versus control | 1 | 465 | Peto Odds Ratio (Peto, Fixed, 95% CI) | 0.57 [0.38, 0.85] |
| 9.2 Intravenous streptokinase versus control | 4 | 983 | Peto Odds Ratio (Peto, Fixed, 95% CI) | 0.82 [0.61, 1.10] |
| 9.3 Intravenous rt‐PA versus control | 10 | 6887 | Peto Odds Ratio (Peto, Fixed, 95% CI) | 0.79 [0.71, 0.88] |
| 9.4 Intravenous desmoteplase versus control | 2 | 139 | Peto Odds Ratio (Peto, Fixed, 95% CI) | 0.64 [0.28, 1.43] |
| 9.5 Intra‐arterial pro‐urokinase versus control | 2 | 220 | Peto Odds Ratio (Peto, Fixed, 95% CI) | 0.62 [0.32, 1.19] |
| 9.6 Intra‐arterial urokinase versus control | 2 | 130 | Peto Odds Ratio (Peto, Fixed, 95% CI) | 0.37 [0.17, 0.77] |
| 10 Death or dependency defined as mRS 3 to 6 Show forest plot | 21 | 8824 | Peto Odds Ratio (Peto, Fixed, 95% CI) | 0.85 [0.78, 0.93] |
| 10.1 Intravenous urokinase versus control | 1 | 465 | Peto Odds Ratio (Peto, Fixed, 95% CI) | 0.99 [0.67, 1.47] |
| 10.2 Intravenous streptokinase versus control | 4 | 983 | Peto Odds Ratio (Peto, Fixed, 95% CI) | 0.94 [0.72, 1.24] |
| 10.3 Intravenous rt‐PA versus control | 10 | 6887 | Peto Odds Ratio (Peto, Fixed, 95% CI) | 0.85 [0.77, 0.94] |
| 10.4 Intravenous desmoteplase versus control | 2 | 139 | Peto Odds Ratio (Peto, Fixed, 95% CI) | 0.49 [0.22, 1.08] |
| 10.5 Intra‐arterial pro‐urokinase versus control | 2 | 220 | Peto Odds Ratio (Peto, Fixed, 95% CI) | 0.55 [0.31, 1.00] |
| 10.6 Intra‐arterial urokinase versus control | 2 | 130 | Peto Odds Ratio (Peto, Fixed, 95% CI) | 0.57 [0.28, 1.14] |
| 11 Dependency at the end of follow‐up defined as mRS 3 to 5 Show forest plot | 22 | 9318 | Peto Odds Ratio (Peto, Fixed, 95% CI) | 0.75 [0.69, 0.82] |
| 11.1 Intravenous urokinase versus control | 1 | 465 | Peto Odds Ratio (Peto, Fixed, 95% CI) | 0.80 [0.53, 1.22] |
| 11.2 Intravenous streptokinase versus control | 4 | 983 | Peto Odds Ratio (Peto, Fixed, 95% CI) | 0.64 [0.49, 0.85] |
| 11.3 Intravenous rt‐PA versus control | 10 | 6886 | Peto Odds Ratio (Peto, Fixed, 95% CI) | 0.80 [0.73, 0.89] |
| 11.4 Intravenous streptokinase plus oral aspirin versus oral aspirin | 1 | 309 | Peto Odds Ratio (Peto, Fixed, 95% CI) | 0.36 [0.22, 0.58] |
| 11.5 Intra‐arterial pro‐urokinase plus intravenous heparin versus intravenous heparin | 2 | 220 | Peto Odds Ratio (Peto, Fixed, 95% CI) | 0.72 [0.41, 1.28] |
| 11.6 Intra‐arterial urokinase versus control | 2 | 130 | Peto Odds Ratio (Peto, Fixed, 95% CI) | 0.53 [0.26, 1.06] |
| 11.7 Intravenous desmoteplase versus control | 3 | 325 | Peto Odds Ratio (Peto, Fixed, 95% CI) | 0.66 [0.41, 1.06] |
| 12 Alive and independent (mRS 0 to 2) at end of follow‐up, participants treated up to six hours Show forest plot | 10 | 6887 | Peto Odds Ratio (Peto, Fixed, 95% CI) | 1.17 [1.06, 1.29] |
| 13 Alive and favourable outcome (mRS 0 to 1) at end of follow‐up, participants treated up to six hours Show forest plot | 10 | 6887 | Peto Odds Ratio (Peto, Fixed, 95% CI) | 1.29 [1.16, 1.43] |
| 14 Deaths from all causes ordered by antithrombotic drug use Show forest plot | 24 | 9674 | Peto Odds Ratio (Peto, Fixed, 95% CI) | 1.20 [1.08, 1.33] |
| 14.1 All participants received antithrombotic drugs < 24 hours | 6 | 2191 | Peto Odds Ratio (Peto, Fixed, 95% CI) | 1.31 [1.09, 1.58] |
| 14.2 Some participants received antithrombotic drugs < 24 hours | 4 | 1757 | Peto Odds Ratio (Peto, Fixed, 95% CI) | 1.27 [0.99, 1.63] |
| 14.3 Some participants received antithrombotics but not < 24 hours | 12 | 4670 | Peto Odds Ratio (Peto, Fixed, 95% CI) | 1.13 [0.96, 1.34] |
| 14.4 No participants received antithrombotic drugs < 10 days | 4 | 1056 | Peto Odds Ratio (Peto, Fixed, 95% CI) | 0.89 [0.58, 1.37] |
| 15 Deaths from all causes ordered by stroke severity Show forest plot | 27 | 9878 | Peto Odds Ratio (Peto, Fixed, 95% CI) | 1.12 [1.01, 1.25] |
| 15.1 Case fatality 0% ‐ 19% in the control group | 17 | 4973 | Peto Odds Ratio (Peto, Fixed, 95% CI) | 1.31 [1.08, 1.58] |
| 15.2 Case fatality 20% or greater in the control group | 10 | 4905 | Peto Odds Ratio (Peto, Fixed, 95% CI) | 1.05 [0.92, 1.19] |
| 16 Death or dependency at the end of follow‐up: participants randomised within 3 hours of stroke Show forest plot | 10 | 2160 | Peto Odds Ratio (Peto, Fixed, 95% CI) | 0.66 [0.56, 0.79] |
| 16.1 Intravenous urokinase versus control | 1 | 82 | Peto Odds Ratio (Peto, Fixed, 95% CI) | 0.79 [0.31, 2.00] |
| 16.2 Intravenous streptokinase versus control | 3 | 209 | Peto Odds Ratio (Peto, Fixed, 95% CI) | 0.62 [0.35, 1.09] |
| 16.3 Intravenous rt‐PA versus control | 6 | 1779 | Peto Odds Ratio (Peto, Fixed, 95% CI) | 0.65 [0.54, 0.80] |
| 16.4 Intravenous streptokinase plus oral aspirin versus oral aspirin | 1 | 90 | Peto Odds Ratio (Peto, Fixed, 95% CI) | 0.93 [0.40, 2.18] |
| 17 Death or dependency by time to treatment up to 6 hours: all agents: only trials randomising in both 0 to 3 and 3 to 6 hour time windows Show forest plot | 9 | 6941 | Peto Odds Ratio (Peto, Fixed, 95% CI) | 0.92 [0.83, 1.01] |
| 17.1 Treatment within 3 hours | 9 | 1536 | Peto Odds Ratio (Peto, Fixed, 95% CI) | 0.69 [0.55, 0.85] |
| 17.2 Treatment between 3 and 6 hours | 9 | 5405 | Peto Odds Ratio (Peto, Fixed, 95% CI) | 0.99 [0.88, 1.10] |
| 18 Death or dependency by time to treatment up to 6 hours: rt‐PA: only trials randomising in 0 ‐ 3 and 3 ‐ 6 hour windows Show forest plot | 5 | 5204 | Peto Odds Ratio (Peto, Fixed, 95% CI) | 0.90 [0.80, 1.01] |
| 18.1 Treatment within 3 hours | 5 | 1155 | Peto Odds Ratio (Peto, Fixed, 95% CI) | 0.68 [0.53, 0.87] |
| 18.2 Treatment between 3 to 6 hours | 5 | 4049 | Peto Odds Ratio (Peto, Fixed, 95% CI) | 0.97 [0.85, 1.09] |
| 19 Death or dependency by time to treatment up to 6 hours: rt‐PA: all trials regardless of time window Show forest plot | 8 | 6729 | Peto Odds Ratio (Peto, Fixed, 95% CI) | 0.85 [0.77, 0.94] |
| 19.1 Treatment within 3 hours | 6 | 1779 | Peto Odds Ratio (Peto, Fixed, 95% CI) | 0.65 [0.54, 0.80] |
| 19.2 Treatment between 3 and 6 hours | 7 | 4950 | Peto Odds Ratio (Peto, Fixed, 95% CI) | 0.93 [0.83, 1.04] |
| 20 Death or dependency by latest time to randomisation Show forest plot | 22 | 9009 | Odds Ratio (M‐H, Random, 95% CI) | 0.81 [0.71, 0.92] |
| 20.1 3 hours | 1 | 624 | Odds Ratio (M‐H, Random, 95% CI) | 0.62 [0.45, 0.85] |
| 20.2 4.5 hours | 2 | 1161 | Odds Ratio (M‐H, Random, 95% CI) | 0.93 [0.66, 1.32] |
| 20.3 6 hours | 15 | 6883 | Odds Ratio (M‐H, Random, 95% CI) | 0.81 [0.69, 0.95] |
| 20.4 9 hours | 3 | 325 | Odds Ratio (M‐H, Random, 95% CI) | 0.74 [0.35, 1.59] |
| 20.5 24 hours | 1 | 16 | Odds Ratio (M‐H, Random, 95% CI) | 0.14 [0.01, 1.76] |
| 21 Alive and independent (mRS 0 to 2) at end of follow‐up, participants treated < 3 versus 3 to 6 hours, all trials regardless of latest time window Show forest plot | 8 | 6750 | Peto Odds Ratio (Peto, Fixed, 95% CI) | 1.17 [1.06, 1.29] |
| 21.1 Participants treated within three hours | 6 | 1779 | Peto Odds Ratio (Peto, Fixed, 95% CI) | 1.53 [1.26, 1.86] |
| 21.2 Participants treated 3 ‐ 6 hours | 7 | 4971 | Peto Odds Ratio (Peto, Fixed, 95% CI) | 1.07 [0.96, 1.20] |
| 22 Alive and favourable outcome (mRS 0 to 1) at end of follow‐up, < 3 versus 3 ‐ 6 hours, only trials randomising in both time windows Show forest plot | 6 | 1779 | Peto Odds Ratio (Peto, Fixed, 95% CI) | 1.61 [1.30, 1.99] |
| 22.1 Participants treated < 3 hours | 6 | 1779 | Peto Odds Ratio (Peto, Fixed, 95% CI) | 1.61 [1.30, 1.99] |
| 22.2 Participants treated 3 ‐ 6 hours | 0 | 0 | Peto Odds Ratio (Peto, Fixed, 95% CI) | 0.0 [0.0, 0.0] |
| 23 Deaths from all causes during follow‐up: participants randomised within 3 hours of stroke Show forest plot | 11 | 2187 | Peto Odds Ratio (Peto, Fixed, 95% CI) | 0.99 [0.82, 1.21] |
| 23.1 Intravenous streptokinase versus control | 3 | 209 | Peto Odds Ratio (Peto, Fixed, 95% CI) | 1.18 [0.66, 2.14] |
| 23.2 Intravenous tPA versus control | 7 | 1806 | Peto Odds Ratio (Peto, Fixed, 95% CI) | 0.91 [0.73, 1.13] |
| 23.3 Intravenous streptokinase plus oral aspirin versus oral aspirin | 1 | 90 | Peto Odds Ratio (Peto, Fixed, 95% CI) | 3.37 [1.37, 8.26] |
| 23.4 Intravenous urokinase versus control | 1 | 82 | Peto Odds Ratio (Peto, Fixed, 95% CI) | 0.70 [0.14, 3.51] |
| 24 Deaths by time to treatment up to 6 hours: all agents: only trials randomising in both 0 ‐ 3 and 3 ‐ 6 hour time windows Show forest plot | 9 | 6936 | Peto Odds Ratio (Peto, Fixed, 95% CI) | 1.23 [1.10, 1.38] |
| 24.1 Treatment within 3 hours | 9 | 1536 | Peto Odds Ratio (Peto, Fixed, 95% CI) | 1.08 [0.86, 1.35] |
| 24.2 Treatment between 3 and 6 hours | 9 | 5400 | Peto Odds Ratio (Peto, Fixed, 95% CI) | 1.29 [1.13, 1.48] |
| 25 Deaths by time to treatment up to 6 hours: rt‐PA: only trials randomising in both 0 to 3 and 3 to 6 hour time windows Show forest plot | 5 | 5199 | Peto Odds Ratio (Peto, Fixed, 95% CI) | 1.11 [0.97, 1.28] |
| 25.1 Treatment within 3 hours | 5 | 1155 | Peto Odds Ratio (Peto, Fixed, 95% CI) | 0.97 [0.75, 1.26] |
| 25.2 Treatment between 3 and 6 hours | 5 | 4044 | Peto Odds Ratio (Peto, Fixed, 95% CI) | 1.17 [1.00, 1.38] |
| 26 Deaths by time to treatment up to 6 hours: rt‐PA: all trials regardless of time window Show forest plot | 9 | 6772 | Peto Odds Ratio (Peto, Fixed, 95% CI) | 1.07 [0.95, 1.21] |
| 26.1 Treatment within 3 hours | 7 | 1806 | Peto Odds Ratio (Peto, Fixed, 95% CI) | 0.91 [0.73, 1.13] |
| 26.2 Treatment between 3 and 6 hours | 7 | 4966 | Peto Odds Ratio (Peto, Fixed, 95% CI) | 1.16 [1.00, 1.35] |
| 27 Death by latest time to treatment Show forest plot | 24 | 9039 | Odds Ratio (Peto, Fixed, 95% CI) | 1.12 [1.01, 1.25] |
| 27.1 3 hours | 2 | 651 | Odds Ratio (Peto, Fixed, 95% CI) | 0.79 [0.53, 1.17] |
| 27.2 4.5 hours | 2 | 1161 | Odds Ratio (Peto, Fixed, 95% CI) | 1.43 [1.01, 2.03] |
| 27.3 6 hours | 16 | 6886 | Odds Ratio (Peto, Fixed, 95% CI) | 1.12 [0.99, 1.26] |
| 27.4 9 hours | 3 | 325 | Odds Ratio (Peto, Fixed, 95% CI) | 2.10 [0.79, 5.58] |
| 27.5 24 hours | 1 | 16 | Odds Ratio (Peto, Fixed, 95% CI) | 1.0 [0.14, 7.10] |
| 28 Symptomatic intracranial haemorrhage by time to treatment up to 6 hours: rt‐PA: only trials randomising in both 0 ‐ 3 and 3 ‐ 6 hour time windows. Show forest plot | 5 | 5168 | Peto Odds Ratio (Peto, Fixed, 95% CI) | 3.75 [2.94, 4.78] |
| 28.1 Intravenous rt‐PA versus control: participants treated within 3 hours of stroke | 5 | 1155 | Peto Odds Ratio (Peto, Fixed, 95% CI) | 4.25 [2.53, 7.16] |
| 28.2 Intravenous rt‐PA versus control: participants treated between 3 and 6 hours after stroke | 5 | 4013 | Peto Odds Ratio (Peto, Fixed, 95% CI) | 3.62 [2.76, 4.76] |
| 29 Symptomatic intracranial haemorrhage by time to treatment up to 6 hours: rt‐PA: all trials regardless of time window Show forest plot | 8 | 6714 | Peto Odds Ratio (Peto, Fixed, 95% CI) | 3.93 [3.13, 4.93] |
| 29.1 Intravenous rt‐PA versus control: participants treated within 3 hours of stroke | 6 | 1779 | Peto Odds Ratio (Peto, Fixed, 95% CI) | 4.55 [2.92, 7.09] |
| 29.2 Intravenous rt‐PA versus control: participants treated between 3 and 6 hours after stroke | 7 | 4935 | Peto Odds Ratio (Peto, Fixed, 95% CI) | 3.73 [2.86, 4.86] |
| 30 Symptomatic intracranial haemorrhage by latest time to treatment Show forest plot | 23 | 9104 | Odds Ratio (Peto, Fixed, 95% CI) | 4.41 [3.43, 5.69] |
| 30.1 3 hours | 2 | 651 | Odds Ratio (Peto, Fixed, 95% CI) | 5.85 [1.54, 22.26] |
| 30.2 4.5 hours | 2 | 1161 | Odds Ratio (Peto, Fixed, 95% CI) | 6.56 [2.51, 17.18] |
| 30.3 6 hours | 15 | 6951 | Odds Ratio (Peto, Fixed, 95% CI) | 4.20 [3.21, 5.50] |
| 30.4 9 hours | 3 | 325 | Odds Ratio (Peto, Fixed, 95% CI) | 6.82 [0.88, 52.78] |
| 30.5 24 hours | 1 | 16 | Odds Ratio (Peto, Fixed, 95% CI) | 0.0 [0.0, 0.0] |
| 31 Death or dependency (mRS 3 to 6) by the end of follow‐up; participants treated up to 6 hours aged ≤ 80 years versus > 80 years Show forest plot | 10 | 6871 | Peto Odds Ratio (Peto, Fixed, 95% CI) | 0.84 [0.76, 0.93] |
| 31.1 Participants aged ≤ 80 years | 10 | 5175 | Peto Odds Ratio (Peto, Fixed, 95% CI) | 0.85 [0.76, 0.95] |
| 31.2 Participants aged > 80 years | 3 | 1696 | Peto Odds Ratio (Peto, Fixed, 95% CI) | 0.80 [0.64, 0.99] |
| 32 Death or dependency (mRS 3 to 6) by the end of follow‐up, participants treated within 3 hours aged ≤ 80 years versus > 80 years Show forest plot | 6 | 1765 | Peto Odds Ratio (Peto, Fixed, 95% CI) | 0.62 [0.51, 0.76] |
| 32.1 Participants aged ≤ 80 years | 6 | 1039 | Peto Odds Ratio (Peto, Fixed, 95% CI) | 0.66 [0.52, 0.85] |
| 32.2 Participants aged > 80 years | 2 | 726 | Peto Odds Ratio (Peto, Fixed, 95% CI) | 0.56 [0.40, 0.78] |
| 33 Alive and independent (mRS 0 to 2) at end of follow‐up, participants treated up to 6 hours aged ≤ 80 years versus > 80 years Show forest plot | 10 | 6885 | Peto Odds Ratio (Peto, Fixed, 95% CI) | 1.18 [1.07, 1.31] |
| 33.1 Participants aged ≤ 80 years | 10 | 5174 | Peto Odds Ratio (Peto, Fixed, 95% CI) | 1.17 [1.05, 1.31] |
| 33.2 Participants aged > 80 years or over | 3 | 1711 | Peto Odds Ratio (Peto, Fixed, 95% CI) | 1.22 [0.98, 1.52] |
| 34 Alive and independent (mRS 0 to 2) at end of folllow‐up, participants treated within 3 hours, aged ≤ 80 years versus > 80 years Show forest plot | 6 | 1779 | Peto Odds Ratio (Peto, Fixed, 95% CI) | 1.56 [1.28, 1.90] |
| 34.1 Participants aged ≤ 80 years versus | 6 | 1038 | Peto Odds Ratio (Peto, Fixed, 95% CI) | 1.50 [1.18, 1.92] |
| 34.2 Participants aged > 80 years and over | 2 | 741 | Peto Odds Ratio (Peto, Fixed, 95% CI) | 1.68 [1.20, 2.34] |
| 35 Alive and independent (mRS 0 to 2) at end of follow‐up, participants treated 3 ‐ 6 hours, aged ≤ 80 years versus > 80 years Show forest plot | 7 | 4971 | Peto Odds Ratio (Peto, Fixed, 95% CI) | 1.07 [0.96, 1.21] |
| 35.1 Participants aged ≤ 80 years | 7 | 4001 | Peto Odds Ratio (Peto, Fixed, 95% CI) | 1.09 [0.96, 1.24] |
| 35.2 Participants aged > 80 years | 2 | 970 | Peto Odds Ratio (Peto, Fixed, 95% CI) | 0.97 [0.73, 1.30] |
| 36 Death: selection by MR DWI/PWI or CT Show forest plot | 19 | 8760 | Odds Ratio (Peto, Fixed, 95% CI) | 1.14 [1.02, 1.27] |
| 36.1 Plain CT | 15 | 8334 | Odds Ratio (Peto, Fixed, 95% CI) | 1.12 [1.00, 1.25] |
| 36.2 MR DWI/PWI | 4 | 426 | Odds Ratio (Peto, Fixed, 95% CI) | 2.05 [1.02, 4.15] |
| 37 Death or dependency: selection with MR DWI/PWI versus plain CT Show forest plot | 15 | 8268 | Odds Ratio (Peto, Fixed, 95% CI) | 0.81 [0.74, 0.89] |
| 37.1 Selection with plain CT | 11 | 7843 | Odds Ratio (Peto, Fixed, 95% CI) | 0.81 [0.73, 0.89] |
| 37.2 Selection with MR DWI/PWI | 4 | 425 | Odds Ratio (Peto, Fixed, 95% CI) | 0.88 [0.58, 1.35] |
| 38 Symptomatic intracranial haemorrhage: selection with MR DWI/PWI or CT Show forest plot | 20 | 8784 | Odds Ratio (Peto, Fixed, 95% CI) | 4.44 [3.43, 5.75] |
| 38.1 Plain CT | 16 | 8358 | Odds Ratio (Peto, Fixed, 95% CI) | 4.38 [3.38, 5.69] |
| 38.2 MR DWI/PWI | 4 | 426 | Odds Ratio (Peto, Fixed, 95% CI) | 7.51 [1.40, 40.35] |
| 39 Alive and independent (mRS 0 to 1) at end of follow‐up, by plain CT ASPECTS score Show forest plot | 4 | 4567 | Peto Odds Ratio (Peto, Fixed, 95% CI) | 1.21 [1.07, 1.37] |
| 39.1 ASPECTS score 8 ‐ 10 | 4 | 3317 | Peto Odds Ratio (Peto, Fixed, 95% CI) | 1.21 [1.06, 1.39] |
| 39.2 ASPECTS score 0 ‐ 7 | 4 | 1250 | Peto Odds Ratio (Peto, Fixed, 95% CI) | 1.20 [0.91, 1.58] |
| 40 Death or dependency at the end of follow‐up: intra‐arterial thrombolysis versus control Show forest plot | 4 | 350 | Odds Ratio (Peto, Fixed, 95% CI) | 0.49 [0.31, 0.79] |
| 40.1 Intra‐arterial urokinase versus control | 2 | 130 | Odds Ratio (Peto, Fixed, 95% CI) | 0.44 [0.22, 0.91] |
| 40.2 Intra‐arterial pro‐urokinase versus control | 2 | 220 | Odds Ratio (Peto, Fixed, 95% CI) | 0.53 [0.28, 1.00] |