Trombolisis para el accidente cerebrovascular isquémico agudo
Resumen
Antecedentes
La mayoría de los accidentes cerebrovasculares se debe a la obstrucción de una arteria en el cerebro por un coágulo de sangre. El tratamiento temprano con fármacos trombolíticos puede restaurar el flujo sanguíneo antes de que ocurra un daño cerebral importante y mejorar la recuperación después del accidente cerebrovascular en algunos pacientes. Sin embargo, los fármacos trombolíticos también pueden causar hemorragias cerebrales graves que pueden ser mortales. Un fármaco, el activador de plasminógeno tisular recombinante (AP‐tr), está autorizado para el uso en pacientes seleccionados en el transcurso de cuatro horas y media del accidente cerebrovascular en Europa y en tres horas en los EE.UU. En algunos países, hay un límite superior de edad de 80 años y en otros, una limitación a principalmente el accidente cerebrovascular no grave. Hay un 40% más de datos disponibles desde la última actualización de la revisión en 2009.
Objetivos
Determinar si el tratamiento trombolítico puede ser un tratamiento efectivo y seguro para el accidente cerebrovascular isquémico agudo (y en qué circunstancias).
Métodos de búsqueda
Se hicieron búsquedas en el registro de ensayos del Grupo Cochrane de Accidentes Cerebrales Vasculares (Cochrane Stroke Group) (última búsqueda en noviembre de 2013), MEDLINE (1966 hasta noviembre de 2013) y en EMBASE (1980 hasta noviembre de 2013). También se hicieron búsquedas manuales en las actas de congresos y revistas, en listas de referencias y se estableció contacto con compañías farmacéuticas y autores de ensayos.
Criterios de selección
Ensayos aleatorizados de cualquier agente trombolítico comparado con control en pacientes con un accidente cerebrovascular isquémico manifiesto.
Obtención y análisis de los datos
Dos autores de la revisión aplicaron los criterios de inclusión, extrajeron los datos y evaluaron la calidad de los ensayos. Los datos extraídos se verificaron con los investigadores de los principales ensayos, y se obtuvieron datos adicionales no publicados si estaban disponibles.
Resultados principales
Se incluyeron 27 ensayos con 10 187 participantes que probaron la uroquinasa, la estreptoquinasa, el AP‐tr, la prouroquinasa recombinante o la desmoteplasa. Cuatro ensayos utilizaron la administración intraarterial, mientras que el resto utilizó la vía intravenosa. La mayoría de los datos proviene de ensayos que comenzaron el tratamiento hasta seis horas después del accidente cerebrovascular. Cerca del 44% de los ensayos (cerca del 70% de los participantes) probó el AP‐tr intravenoso. En estudios anteriores, muy pocos de los participantes (0,5%) tenían más de 80 años; en esta actualización, el 16% de los participantes tienen más de 80 años debido a la inclusión de la TSI‐3 (el 53% de los participantes en este ensayo tenían más de 80 años). Los ensayos publicados más recientemente utilizaron una asignación al azar computarizada, por lo que hay menos probabilidades de que existan diferencias iniciales que en las versiones anteriores de la revisión. Más del 50% de los ensayos cumplieron los criterios de ocultación de alto grado; hubo pocas pérdidas en el seguimiento de los principales resultados.
El tratamiento trombolítico, principalmente administrado hasta seis horas después del accidente cerebrovascular isquémico, redujo significativamente la proporción de participantes muertos o dependientes (Rankin modificado 3 a 6) a los tres a seis meses después del accidente cerebrovascular (odds ratio [OR] 0,85; intervalo de confianza [IC] del 95%: 0,78 a 0,93). El tratamiento trombolítico aumentó el riesgo de hemorragia intracraneal sintomática (OR 3,75; IC del 95%: 3,11 a 4,51), de muerte temprana (OR 1,69; IC del 95%: 1,44 a 1,98; 13 ensayos, 7458 participantes) y de muerte entre tres y seis meses después del accidente cerebrovascular (OR 1,18; IC del 95%: 1,06 a 1,30). La muerte prematura después de la trombolisis fue principalmente atribuible a la hemorragia intracraneal. El tratamiento en el transcurso de las tres horas del accidente cerebrovascular fue más efectivo para reducir la mortalidad o la dependencia (OR 0,66; IC del 95%: 0,56 a 0,79) sin aumentar la mortalidad (OR 0,99; IC del 95%: 0,82 a 1,21; 11 ensayos, 2187 participantes). Hubo heterogeneidad entre los ensayos. Los fármacos antitrombóticos contemporáneos aumentaron el riesgo de mortalidad. Los ensayos que probaron el rt‐PA mostraron una reducción significativa de la muerte o la dependencia con el tratamiento hasta seis horas (OR 0,84, IC del 95%: 0,77 a 0,93; p = 0,0006; ocho ensayos, 6729 participantes) con una heterogeneidad significativa; el tratamiento dentro de las tres horas fue más beneficioso (OR 0,65, IC del 95%: 0,54 a 0,80; p < 0,0001; seis ensayos, 1779 participantes) sin heterogeneidad. Los participantes con más de 80 años de edad se beneficiaron igual que los de menos de 80, en particular si fueron tratados en el transcurso de tres horas del accidente cerebrovascular.
Conclusiones de los autores
El tratamiento trombolítico administrado hasta seis horas después del accidente cerebrovascular reduce la proporción de pacientes muertos o dependientes. Los pacientes tratados en el transcurso de las tres primeras horas se benefician sustancialmente más que los que reciben el tratamiento tardío. Este efecto beneficioso general fue evidente a pesar de un aumento en la hemorragia intracraneal sintomática, la mortalidad a los siete a diez días y la mortalidad al final del seguimiento (excepto en los ensayos que probaron el AP‐tr, que no tuvo efectos sobre la mortalidad al final del seguimiento). Se necesitan ensayos adicionales para identificar la última ventana de tiempo, si los pacientes con accidente cerebrovascular leve se beneficiaran de la trombolisis, para encontrar formas de reducir la hemorragia intracraneal sintomática y la mortalidad y para identificar el ámbito en el que la trombolisis se puede proporcionar mejor en la práctica habitual.
PICO
Resumen en términos sencillos
Fármacos que disuelven coágulos para el tratamiento del accidente cerebrovascular isquémico en las primeras etapas
Pregunta
Se deseaba comparar la seguridad y la eficacia de fármacos que disuelven coágulos (trombolíticos) versus placebo o ningún tratamiento en las primeras etapas del accidente cerebrovascular isquémico para observar si los fármacos que disuelven coágulos mejoran el resultado después del accidente cerebrovascular.
Antecedentes
La mayoría de los accidentes cerebrovasculares se debe a la obstrucción de una arteria en el cerebro por un coágulo de sangre. El tratamiento inmediato con fármacos que disuelven coágulos (trombolíticos) puede restaurar el flujo sanguíneo antes de que haya ocurrido un daño cerebral importante y podría significar que los pacientes tengan mayores probabilidades de una buena recuperación del accidente cerebrovascular. Sin embargo, los fármacos trombolíticos también pueden causar hemorragias cerebrales graves que pueden ser mortales. El tratamiento trombolítico se ha evaluado en muchos ensayos aleatorizados de accidente cerebrovascular isquémico agudo. Se ha autorizado el uso del fármaco trombolítico alteplasa en el transcurso de tres horas del accidente cerebrovascular en EE.UU. y Canadá, y en cuatro horas y media en la mayoría de los países europeos. El número de pacientes que reciben este tratamiento sucesivamente va en aumento.
Características de los estudios
En las búsquedas realizadas hasta noviembre de 2013, se identificaron 27 ensayos con 10 187 participantes. La mayoría de los datos proviene de ensayos que probaron un fármaco (activador de plasminógeno tisular recombinante, AP‐tr) administrado en una vena hasta seis horas después del accidente cerebrovascular isquémico agudo, pero también se probaron varios otros fármacos en diferentes momentos de tratamiento después del accidente cerebrovascular y administrados en una arteria del cerebro en lugar de en una vena del brazo. Todos los ensayos compararon un fármaco que disuelve coágulos con un grupo placebo (control). La mayoría de los ensayos incluyó participantes con accidente cerebrovascular moderado a grave. Todos los ensayos se realizaron en hospitales que tratan pacientes con accidente cerebrovascular. Las diferencias entre los ensayos significan que no todos los ensayos contribuyen con información para todos los resultados, pero se han utilizado todos los datos disponibles. La mayoría de los ensayos incluyó a los participantes después de que un examen cerebral con tomografía computarizada (TC) excluyese la hemorragia cerebral como la causa de los síntomas (algunos ensayos, en cambio, utilizaron la resonancia magnética para el examen cerebral).
Resultados clave
Hay acuerdo general entre los ensayos anteriores y el único ensayo reciente agregado en esta actualización (IST‐3) para todos los resultados principales, y entre los 12 ensayos que probaron el AP‐tr y los 15 ensayos que probaron otros fármacos que disuelven coágulos. La diferencia principal entre el IST‐3 y los ensayos anteriores fue que el IST‐3 incluyó a muchos participantes con más de 80 años. El tratamiento con fármacos que disuelven coágulos puede reducir el riesgo de dependencia a largo plazo de otras personas para las actividades cotidianas, a pesar de que hay un aumento en el riesgo de hemorragia en el cerebro que también aumentó el riesgo de muerte prematura. Una vez que el riesgo de hemorragia temprana había pasado, a los tres a seis meses después del accidente cerebrovascular, los pacientes a los que se les administraron fármacos que disuelven coágulos tenían mayores probabilidades de haberse recuperado del accidente cerebrovascular y ser independientes, especialmente si habían sido tratados en las tres primeras horas después del accidente cerebrovascular. Los pacientes de edad avanzada se beneficiaron tanto como los más jóvenes. Administrar aspirina al mismo tiempo que los trombolíticos aumentó el riesgo de hemorragia y se debe evitar. Análisis adicionales de los datos de factores de pacientes individuales como los hallazgos en el examen cerebral antes del tratamiento y las diferentes formas de administrar el tratamiento, pueden proporcionar más información que los datos resumidos que se utilizaron en esta revisión. Mientras tanto, los pacientes que consideran que presentan un accidente cerebrovascular deben acudir al hospital rápidamente, ser evaluados por un médico especializado en accidente cerebrovascular, realizarles un examen cerebral y recibir tratamiento con fármacos que disuelven coágulos lo antes posible. No se debe vacilar al pensar que son "demasiado mayores" para el tratamiento. El tratamiento es muy eficaz si se administra en el transcurso de tres horas del accidente cerebrovascular y definitivamente mejora el resultado si se proporciona hasta cuatro horas y media después del accidente cerebrovascular, pero de hacerlo más tarde, los efectos son menos claros y se prueban todavía en ensayos. Se necesita más información de ensayos en pacientes con accidente cerebrovascular leve para analizar si el efecto beneficioso de los fármacos que disuelven coágulos supera el riesgo de hemorragia.
Calidad de la evidencia
La evidencia proviene principalmente de ensayos aleatorizados bien realizados e implementados por expertos en accidente cerebrovascular. Algunos ensayos (8/27) fueron realizados por empresas que fabrican fármacos que disuelven coágulos, pero la mayor parte de los ensayos (19/27, que incluyen la mayoría de los participantes) fueron patrocinados por el gobierno o fuentes de caridad independientemente de las compañías farmacéuticas. Estos resultados se aplican a un amplio rango de pacientes con una gama amplia de gravedades del accidente cerebrovascular y otros trastornos médicos.
Authors' conclusions
Background
Description of the condition
Acute ischaemic stroke is a major cause of death and disability worldwide. Most strokes are due to blockage of an artery in the brain by a blood clot (ischaemic stroke) e.g. from the heart or neck arteries.
Description of the intervention
Thrombolytic drugs derive from naturally‐occurring enzymes that dissolve thrombus as part of the natural clotting cascade. Some are extracted from biological samples (e.g. urokinase, desmoteplase) and others are manufactured (e.g. recombinant tissue plasminogen activator (rt‐PA), or recombinant pro‐urokinase).
How the intervention might work
Clot‐dissolving (thrombolytic) drugs may reduce brain damage from a stroke by restoring the blood flow if given rapidly enough after stroke, but may also cause serious bleeding in the brain.
Why it is important to do this review
An overview of the literature on thrombolysis in acute ischaemic stroke in 1992 (Wardlaw 1992) identified six randomised trials of various thrombolytic drugs including a total of just 700 participants. A Cochrane review published in 1995 (Wardlaw 1995) updated the original 1992 review. It was updated again in 1999 (3478 participants in total) (Wardlaw 1999), in 2003 (5727 participants) (Wardlaw 2003b), in 2009 (7152 participants) (Wardlaw 2009) but even so, many essential questions remained unanswered: How big is the overall benefit? What is the latest time window in which the treatment is still beneficial? Which grades of stroke severity and which types of stroke, as judged clinically and on brain imaging, are more likely to respond favourably to treatment? Should people aged over 80 years receive thrombolysis? Which types of patients are most likely to be harmed by treatment, and which to benefit from it (e.g. with or without other major medical conditions like cardiac arrhythmias, diabetes, hypertension, or other disorders and concomitant medication) (Wardlaw 2002)? To answer these questions reliably, and in particular to be able to tailor treatment to the individual, more data are needed from new randomised controlled trials (RCTs).
Meanwhile, the thrombolytic drug alteplase (rt‐PA) was licensed for use within three hours of stroke in the USA and Canada, and up to 4.5 hours in most European countries, and an increasing number of people now receive the treatment. Guidelines recommended that thrombolysis should be delivered by a clinical team with suitable training and experience and in a setting with appropriate facilities (ESO Stroke Guidelines 2008; NICE Stroke Guideline 2008). A general review of the use of thrombolytic therapy in clinical practice and the clinical service required to deliver it was provided in a book on the management of stroke (Warlow 2008).
This updated review includes all trials completed and made public since 2009, as well as additional data published since 2009 from trials included in earlier versions of the review. The total number of participants is now 10,187, more than a 10‐fold increase since the review was initiated in 1990 and an increase of more than 40% since 2009. Although many of the data now come from trials testing intravenous rt‐PA within the first six hours after stroke onset, the more recent trials are exploring alternative methods for selecting participants and extending time windows, e.g. through use of advanced brain imaging. The upper age limit of 80 years, stroke severity and new imaging data are also analysed. This systematic review includes these data and provides a convenient and up‐to‐date summary of the evidence.
Objectives
To determine whether, and in what circumstances, thrombolytic therapy might be an effective and safe treatment for acute ischaemic stroke. We wished to determine whether:
-
thrombolytic therapy increases the risk of death:
-
within the first two weeks of stroke; or
-
at long‐term follow‐up;
-
-
thrombolytic therapy increases the risk of symptomatic or fatal intracranial haemorrhage, or symptomatic infarct swelling;
-
thrombolysis reduces the proportion of people dead or dependent at long‐term follow‐up, in spite of any early hazard, so that there is an overall net benefit.
We wished to undertake exploratory analyses to examine whether:
-
thrombolytic therapy interacts with antithrombotic therapy to increase the hazard;
-
the balance of risk and benefit with thrombolytic therapy may vary with the severity of the stroke;
-
the latest therapeutic time window for effective treatment can yet be determined;
-
whether the effect of thrombolysis is different in people aged over 80 compared with under 80 years of age;
-
whether people selected for treatment using MR diffusion/perfusion imaging had better effect of thrombolytic treatment than those selected using computed tomography (CT) brain imaging;
-
whether individual findings on CT brain imaging identified people in whom the effect of thrombolysis was different;
-
whether the effect of intra‐arterial therapy differed from intravenous therapy and explained any of the heterogeneity.
Methods
Criteria for considering studies for this review
Types of studies
We sought to identify all truly randomised unconfounded trials of thrombolytic therapy compared with placebo or open control in people with acute ischaemic stroke. We excluded trials that were not truly randomised, such as dose‐range‐finding studies, and trials that included thrombolytic treatment in the control group. We included trials in which the exact method of randomisation was unknown, even after correspondence with the authors, if the available information suggested that the randomisation was not likely to be biased. We also included trials that were not originally analysed on an intention‐to‐treat basis if information on outcome could be obtained for all randomised participants, thus allowing us to perform an intention‐to‐treat analysis.
Types of participants
We included trials of participants with a definite acute ischaemic stroke (CT or magnetic resonance (MR) scanning having excluded intracranial haemorrhage prior to randomisation).
Types of interventions
We included all types of thrombolytic drug, given in any dose, by the intravenous or intra‐arterial route: urokinase (UK, also known as u‐PA), recombinant pro‐urokinase (rpro‐UK), streptokinase (SK), recombinant tissue plasminogen activator (rt‐PA) including duteplase, lumbrokinase (LK), and desmoteplase.
We excluded trials that were confounded by the treatment or control group receiving another active therapy which had not been factored in to the randomisation (for example, thrombolytic drug plus another agent versus placebo, or thrombolytic drug versus another agent).
Types of outcome measures
The primary outcome measures were death or dependency, as defined by modified Rankin score of 3 to 6, and death at the end of follow‐up. We considered all other outcomes as secondary.
We assessed the following.
-
Deaths from all causes within the first seven to 10 days after treatment.
-
Symptomatic intracranial haemorrhage (SICH): either symptomatic (that is, temporally associated with a deterioration in the person's neurological state), or fatal (that is, leading directly to death), and occurring within the first seven to 10 days. Note that symptomatic intracranial haemorrhage includes haemorrhagic transformation of the infarct, haemorrhage elsewhere in the brain remote from the infarct, and haemorrhage into the spaces surrounding the brain. Definitions of SICH vary between trials and therefore we have used the SICH data as defined by each trial's primary definition rather than attempting to standardise the definition.
-
Fatal intracranial haemorrhage.
-
Deaths within the first seven to 10 days not due to intracranial haemorrhage.
-
Symptomatic infarct swelling (oedema).
-
Deaths occurring between the end of the first seven to 10 days and three to six months.
-
Deaths from all causes during the whole trial follow‐up period.
-
Poor functional outcome at the end of follow‐up. This was the primary outcome measure for the review and was defined as death or dependency, measured by the modified Rankin or Barthel scales, at the end of the trial follow‐up period. Poor functional outcome (the converse of good functional outcome) is the most clinically relevant and important measure of outcome, since the aim of treatment should be not merely to avoid death but also to decrease dependency among the survivors; that is, to increase the proportion of independent survivors and conversely to reduce the risk of survival with serious disability. Dependency in the present analysis was defined as a score of between 3 and 5 inclusive on the modified Rankin Scale (mRS). Some would prefer a definition of 'good outcome' (independence) including Rankin 0 and 1 only; therefore, wherever possible we sought data on the number of participants in each individual Rankin category so as to compare poor functional outcome defined as mRS 2 to 6 with the definition of 3 to 6. Where data were not available for mRS 3 to 6, we used mRS 2 to 6 instead, rather than excluding the trial from analysis.
Search methods for identification of studies
See the 'Specialized register' section in the Cochrane Stroke Group module. We searched for all trials in all languages using the following overlapping methods, and arranged translation of relevant papers published in languages other than English.
Electronic searches
We searched the Cochrane Stroke Group's Trials Register, which was last searched by the Managing Editor on 18 November 2013. In addition, we carried out comprehensive searches of MEDLINE (Ovid) (1966 to November 2013) (Appendix 1) and EMBASE (Ovid) (1980 to November 2013) (Appendix 2). We developed the search strategies for MEDLINE and EMBASE with the help of the Cochrane Stroke Group Trials Search Co‐ordinator.
Searching other resources
-
We handsearched the following conference proceedings and stroke and neurological journals: Stroke, Cerebrovascular Diseases, International Journal of Stroke, Journal of Stroke and Cerebrovascular Diseases, Neurology and Journal of Neurology, Neurosurgery and Psychiatry published to March 2014.
-
We checked multiple international conference proceedings on stroke and specifically on thrombolysis since 1991. These include all European Stroke Conferences (since 1992, annual since 1994), all International Stroke Conferences hosted by the American Heart Association (annual), all World Stroke Conferences (biannual), all Thrombolysis in Acute Ischaemic Stroke symposia (biannual).
-
We examined reference lists quoted in thrombolytic therapy papers.
-
We made direct contact with principal investigators of trials in Europe, North America, Japan, China, and Australasia.
-
We have been in regular contact with the manufacturer of rt‐PA, and other companies involved in ongoing studies of thrombolysis identified from the Washington Internet Stroke Center Register of ongoing trials (www.strokecenter.org).
For previous versions of this review:
-
We handsearched the following journals from 1979 to April 1994: Japanese Journal of Stroke, Clinical Evaluation, Japanese Journal of Pharmacology & Therapeutics, and Rinsho Ketsueki (we obtained translations of the non‐English language publications from people in whose native language the paper was published);
-
We contacted 321 pharmaceutical companies for more information about trials known to exist from the above efforts, and for information on any trials which were so far unknown to us (the last systematic contact was made in December 1997); all companies except one (which was known to be doing a trial in any case) responded, and no trials were identified that we did not already know about.
Data collection and analysis
This review builds on a continuous data collection process that started in 1989.
Selection of studies
Two review authors (JW, VM) screened the records obtained from the electronic searches and excluded obviously irrelevant studies. We obtained the full paper copy of the remaining studies and the same two review authors selected truly randomised trials comparing a thrombolytic drug with placebo or open control in people with acute ischaemic stroke, brain imaging having excluded cerebral haemorrhage and other structural causes of stroke‐like symptoms. We sought additional unpublished information from the principal investigators of all the trials that appeared to meet our inclusion criteria. We resolved any disagreements by discussion. The selection for 2003 update was verified by EB.
Data extraction and management
Two review authors (JM and VM) checked the data extraction and resolved any discrepancies or uncertainties by discussion or clarification with the principal investigator. We aimed to extract the number of participants originally allocated to each treatment group in each trial to allow an intention‐to‐treat analysis if the trial had not already been presented in this way.
Assessment of risk of bias in included studies
We assessed risk of bias as specified in the Cochrane Handbook for Systematic Reviews of Interventions, Version 5.1.0 (March 2011), Chapter 8 (Higgins 2011). We assessed whether the method of randomisation would allow allocation concealment, the adequacy of efforts to blind treatment administration and outcome assessment. For each included trial we collected information about:
-
the method of randomisation (including information on allocation concealment);
-
blinding of treatment administration;
-
blinding of outcome assessment; and
-
whether an intention‐to‐treat analysis was done, or could possibly be done.
We provide detailed 'Risk of bias' tables for the trial included since the last update.
Measures of treatment effect
We extracted the number of participants in the treated and control groups who had:
-
died within the first seven to 10 days;
-
developed any intracranial haemorrhages, symptomatic or fatal intracranial haemorrhage early after the stroke (within the first seven to 10 days);
-
developed symptomatic (including fatal) infarct swelling;
-
died by the end of the trial follow‐up; and
-
were dependent on others in activities of daily living (mRS 3 to 5) by the end of the trial follow‐up period (the converse is the number who were alive and independent at the end of follow‐up).
We also extracted data to perform subgroup analyses on time to treatment, age, stroke severity, prior or concomitant antithrombotic drug use, and attempted to find information on pretreatment brain imaging findings, blood pressure, and diabetes (details below).
Unit of analysis issues
Our definition of SICH included people who died or deteriorated clinically as a result of intracranial haemorrhage. This could be either secondary bleeding into the infarct or new bleeding at an anatomically separate site elsewhere in the brain or its surrounding spaces after randomisation, confirmed by CT or MR scanning or post‐mortem examination. We have defined 'early after the stroke' as within the first seven to 10 days, as the trials each tended to use a slightly different time point, but all had collected information on intracranial haemorrhage certainly within the first 10 days. Many symptomatic haemorrhages actually occurred within the first few days of the stroke. It is difficult to estimate the exact number of SICHs because some people died without a CT scan or post‐mortem examination. Thus the true number with SICH may be higher than that suggested by these data. On the other hand, heightened awareness of an association between haemorrhagic transformation and thrombolysis may mean that the investigators too readily attributed any neurological deterioration following treatment to intracranial haemorrhage, even if the amount of blood was small. A review of published CT findings suggests that, at least for some trials, SICH included people with very large swollen and oedematous infarcts with trivial amounts of haemorrhage within them (ECASS 1995; NINDS 1995). Therefore, it is also possible that the risk of intracranial haemorrhage has been overestimated (Von Kummer 2002). The ECASS trial (ECASS 1995) did not report the number with SICH, but whether the radiological appearance of the haemorrhage suggested haemorrhagic transformation of an infarct or parenchymatous haematoma (and its size). Most parenchymatous haemorrhages were associated with symptoms, so we used the number of participants with parenchymatous haematoma as the number with symptomatic haemorrhages.
Dealing with missing data
We contacted trial investigators to obtain all unpublished missing data where possible. Where data were still missing or had not been collected in the original trial, then that trial did not contribute to the relevant outcome. We clarified missing or unclear data with the principal investigator. The outcomes in two studies were very clearly described in the original texts and verification with the principal investigators was not necessary (Haley 1993; Morris 1995).
Assessment of heterogeneity
We tested for heterogeneity between trial results using the I² statistic. Heterogeneity might arise from a wide variety of factors, such as the design of the trials, the type of participants included, the use of concomitant treatments like aspirin or heparin, ancillary care during the acute treatment period or rehabilitation, lack of availability of certain data for a particular trial so that a trial appears as missing for a particular outcome, or simply by the play of chance, particularly in small trials (Deeks 2001; Higgins 2003).
Assessment of reporting biases
We have endeavoured to include data from all trials on all prespecified outcomes, obtained from secondary publications or the trial investigators if unpublished. We assessed the likelihood of missing trials using a funnel plot.
Data synthesis
We calculated odds ratios (ORs) for each outcome (that is, the ratio of the odds of an unfavourable outcome among treatment‐allocated participants to the corresponding odds amongst controls), which we calculated using the Peto fixed‐effect method (APT 1994), and the random‐effects method for outcomes if there was significant heterogeneity between trials. We calculated absolute numbers of events avoided (or caused) per 1000 patients treated using the risk differences method provided in the Review Manager 5 software (RevMan 2012) and also as the straight percentages calculated from the number of events per number randomised in the treated and control groups. However, please note that these events per 1000 treated data should be regarded with caution as they may produce misleading results, since the absolute risk amongst controls varies between trials.
Subgroup analysis and investigation of heterogeneity
We examined the effect of stroke severity, age under or over 80 years, time from stroke to treatment and the effect of having a large infarct on plain CT (ASPECT score 7 or less) on outcome after thrombolysis. We assessed the effect of time by several approaches: we examined the effect of time in all trials regardless of what time windows they contributed to, then in only those trials that contributed to all time windows, and then by latest time to randomisation. These approaches were used to maximise use of available data and minimise bias by excluding some trials from some analyses (e.g. the NINDS 1995 trial only recruited participants up to three hours and therefore would not contribute to an analysis comparing treatment administered within three hours with that administered between three and six hours, where inclusion was restricted to trials which included participants in both time windows). We used the proportion who died in the control group to estimate the severity of stroke. We assessed:
-
effect of time to treatment; the number of participants who had symptomatic intracranial haemorrhage, died or were dependent at the end of follow‐up according to whether they had been treated within three hours of the stroke or later than three hours (in trials which randomised participants beyond three hours after the stroke);
-
the number of participants aged over or under 80 years who had symptomatic intracranial haemorrhage, died or were dependent at the end of follow‐up;
-
the number of participants who were dead or dependent at the end of follow‐up according to whether they had been assessed for inclusion in a trial using CT scanning or MR diffusion‐ and perfusion‐weighted imaging (DWI/PWI);
-
the number of participants alive and independent (mRS 0 to 1) at end of follow‐up according to whether they had visible or not‐visible or small or large infarction on plain CT, measured by the ASPECT score.
Sensitivity analysis
We examined primarily the effect of the thrombolytic drug in all studies for all drugs combined. However, we also examined the effect of different thrombolytic drugs (streptokinase, urokinase, rt‐PA). We assessed whether the effect of thrombolysis on functional outcome varied with the definition of dependency (mRS 2 to 5, instead of 3 to 5). Additionally, we compared trials which included participants on the basis of plain CT scanning versus those which used diffusion/perfusion MR imaging or perfusion/angiography CT imaging. We stratified trials by the proportion of participants given aspirin or heparin within the treatment period by time after stroke;
Results
Description of studies
Results of the search
The search of the Cochrane Stroke Group Trials Register identified 19 potentially relevant new or ongoing trials, of which only one was completed and relevant (IST3 2012). Five trials are ongoing (DIAS‐3; DIAS‐4; DIAS‐J; EXTEND; WAKE‐UP 2011). Three trials are awaiting classification (FRALYSE; Lin 2006; TESPI): TESPI has recently been completed but not yet reported, and the other two are thought to have been completed but have not yet been published. The remainder of the publications were not relevant. The search of MEDLINE and EMBASE identified 3958 references, which included many additional publications to trials that were already in the review, and several that were relevant to another review (Wardlaw 2013), but none that was relevant to this review.
Included studies
We include 27 trials, involving 10,239 randomised participants, but data for only 10,187 participants were available for inclusion in the review (Abe 1981; ASK 1996; Atarashi 1985; ATLANTIS A 2000; ATLANTIS B 1999; AUST 2005; Chen 2000; DEDAS 2006; DIAS 2005; DIAS 2 2008; ECASS 1995; ECASS II 1998; ECASS 3 2008; EPITHET 2008; Haley 1993; IST3 2012; JTSG 1993; MAST‐E 1996; MAST‐I 1995; MELT 2007; Mori 1992; Morris 1995; NINDS 1995; Ohtomo 1985; PROACT 1998; PROACT 2 1999; Wang 2003). This review includes all possible available information about all trials in an effort to provide as complete a record as possible of the available data on thrombolysis for acute ischaemic stroke. The NINDS trial (NINDS 1995) was conducted in two consecutive parts, A and B, but published in one paper, so is included as one trial in this review. Although the USA Food and Drug Administration review of the primary analysis of the NINDS trial referred to an 'on‐treatment' analysis, the analysis was actually 'intention‐to‐treat' as no participants who had been entered into the trial were excluded from that analysis (NINDS 1995). Reasons for these comments and further analyses are provided in the Clinical Reviews submitted by Genentech to the USA Food and Drug administration in support of the license application for alteplase (www.fda.gov/cder/biologics/products/altegen061896.htm; see Clinical Review 2, pages 18 to 20).
The trials performed in the 1980s (Abe 1981; Atarashi 1985; Ohtomo 1985) were methodologically different to the trials performed from the 1990s onwards. The 1980s trials used very low doses of thrombolytic drug, given daily intravenously for several days, and started up to five or 14 days after the stroke. The trials from the 1990s onwards used a single large dose of thrombolytic drug (in the region of 80 mg to 100 mg rt‐PA or equivalent), given intravenously or intra‐arterially, in most trials, within three, six, nine or 24 hours of the stroke. The 1980s trials did not collect data on functional outcome and therefore only the 1990s‐onwards trials contribute to the analysis of death or dependency. All trials, however, contributed to analyses of intracranial haemorrhage and death by the end of follow‐up (although very few deaths or intracranial haemorrhages occurred in the trials in the 1980s). However, it is possible to see in the figures what effect the exclusion of these early trials would have on the overall results.
The MAST‐I trial (MAST‐I 1995), which tested intravenous streptokinase and oral aspirin given within six hours of stroke onset in a two‐by‐two factorial design, is the only trial to have tested for an interaction between thrombolytic and antithrombotic drugs in a randomised trial; the comparison of streptokinase plus aspirin versus aspirin from MAST‐I 1995 is included in this review (separated from the MAST‐I 1995 data in the absence of aspirin) because it represents the only available randomised evidence on this important interaction. As there was a significant adverse interaction between streptokinase and aspirin, which we felt was important to highlight, the data for the participants receiving streptokinase in the presence or absence of aspirin are presented separately (that is, streptokinase versus control separate from streptokinase with aspirin versus aspirin). It would not be methodologically appropriate to exclude MAST‐I 1995 participants allocated aspirin because in most other trials, some antithrombotic agents were used, and while it is possible to identify the proportion of participants in the trial that received antithrombotic treatment, it is not possible to identify and then exclude the individual participants.
Types and severities of strokes included
The selection of participants was based initially on clinical criteria to diagnose the stroke sub‐type (cortical versus lacunar versus posterior circulation):
-
eight trials randomised all types of ischaemic stroke: cortical, lacunar and posterior circulation (ATLANTIS A 2000; ATLANTIS B 1999; ECASS 3 2008; Haley 1993; IST3 2012; MAST‐I 1995; NINDS 1995; Wang 2003);
-
two trials included cortical and lacunar strokes (ASK 1996; Chen 2000);
-
five trials included only participants with symptoms of hemispheric cortical ischaemia (ECASS 1995; ECASS II 1998; EPITHET 2008; MAST‐E 1996; Morris 1995);
-
six trials included participants with angiographically proven occlusion of the internal carotid or middle cerebral artery (JTSG 1993; MELT 2007; Mori 1992; PROACT 1998; PROACT 2 1999) or vertebrobasilar arteries (AUST 2005);
-
three trials included presumed 'thrombotic' stroke of most severities and excluded presumed cardio‐embolic strokes (although it is not clear whether artery‐to‐artery embolism counted as 'embolic' in this context) (Abe 1981; Atarashi 1985; Ohtomo 1985);
-
three trials included participants with 'tissue at risk' as identified by MR DWI/PWI or CT perfusion imaging (DEDAS 2006; DIAS 2005; DIAS 2 2008).
Most trials used a stroke severity scale, such as the National Institutes of Health Stroke Scale (NIHSS) or Scandinavian Stroke Scale (SSS) or developed their own neurological stroke severity scale to measure the severity of the stroke at baseline.
All trials excluded people who were in a coma; most trials did not randomise many participants who were drowsy except one (MAST‐E 1996) in which 50% of the participants were drowsy or stuporous at randomisation.
Age of included participants
-
Only seven trials had no upper age limit at all and included also very elderly participants (Abe 1981; Atarashi 1985; EPITHET 2008; IST3 2012; MAST‐E 1996; MAST‐I 1995; Ohtomo 1985). EPITHET included 25 participants aged over 80 years and IST‐3 included 1617 participants aged over 80 years.
-
Seven trials had an upper age limit of 85 years (ASK 1996; AUST 2005; DEDAS 2006; DIAS 2005; DIAS 2 2008; PROACT 1998; PROACT 2 1999).
-
The NINDS trial (NINDS 1995) initial protocol stated an upper age limit of 80 years. However, this was removed after 188 participants had been recruited into Part A of the trial on 30 March 1992, and thereafter 69 participants over the age of 80 were randomised (the oldest participant was 90) (www.fda.gov/cber/products/altegen061896.htm; Clinical Review 2, page 27).
-
All the remaining trials, including all the other rt‐PA trials, (except EPITHET 2008; and IST3 2012), had an upper age limit of 80 years.
-
The upper age limit in two trials (Chen 2000; MELT 2007) was 75 years.
Visible infarction on the CT scan at randomisation
-
Three trials specified that the pre‐randomisation CT had to be normal (JTSG 1993; MELT 2007; Mori 1992).
-
One trial excluded people with early visible infarction (Wang 2003).
-
Six trials specified that the pre‐randomisation CT scan had to be normal or only show ischaemic changes in less than one‐third of the middle cerebral artery supply territory (ATLANTIS B 1999; ECASS 1995; ECASS II 1998; ECASS 3 2008; EPITHET 2008; Wang 2003).
-
Two trials excluded people with mass effect and midline shift on CT (PROACT 1998; PROACT 2 1999).
-
None of the other trials specified that people with a CT scan that showed an infarct (which was likely to be symptomatic) should be excluded, although individual doctors may have excluded these individuals in some centres depending on local opinion.
-
Three trials selected participants with 'tissue at risk' on the basis of DWI/PWI (DEDAS 2006; DIAS 2005), or MR DWI/PWI or CT with CT perfusion imaging (DIAS 2 2008).
Time to randomisation
The maximum time interval allowed between the onset of the stroke and the start of the treatment administration varied from within three hours to up to two weeks.
-
Two trials randomised participants within three hours (Haley 1993; NINDS 1995).
-
One trial randomised participants within four hours (ASK 1996).
-
One trial randomised participants between three hours and 4.5 hours (ECASS 3 2008).
-
One trial randomised participants between three hours and five hours (ATLANTIS B 1999).
-
14 trials randomised participants within six hours (ATLANTIS A 2000; Chen 2000; ECASS 1995; ECASS II 1998; IST3 2012; JTSG 1993; MAST‐E 1996; MAST‐I 1995; MELT 2007; Mori 1992; Morris 1995; PROACT 1998; PROACT 2 1999; Wang 2003). However, please note that in three studies (MELT 2007; PROACT 1998; PROACT 2 1999), the majority of the participants were actually randomised between three and six hours.
-
One trial randomised participants within three to six hours (EPITHET 2008).
-
Three trials randomised participants between three and nine hours (DEDAS 2006; DIAS 2005; DIAS 2 2008).
-
One trial randomised participants within 24 hours (AUST 2005).
-
Two trials randomised participants within five days (Atarashi 1985; Ohtomo 1985).
-
One trial randomised participants within two weeks (Abe 1981).
Please note that the latter three trials (Abe 1981; Atarashi 1985; Ohtomo 1985) do not contribute data to the analysis of early deaths or of death and dependency, as early deaths were not recorded and a functional outcome measure was not used in these trials. They do contribute data to the analyses of intracranial haemorrhages and deaths by the end of follow‐up.
Drug and dosage
Trials using intravenous rt‐PA contribute 7012 of the 10,187 participants, that is, 69% of the data in this review. Data and outcomes of all included substances are reported for completeness. However, rt‐PA data are also given as appropriate.
-
Four trials used streptokinase (ASK 1996; MAST‐E 1996; MAST‐I 1995, Morris 1995).
-
Twelve trials used recombinant tissue plasminogen activator (rt‐PA) (ATLANTIS A 2000; ATLANTIS B 1999; ECASS 1995; ECASS II 1998; ECASS 3 2008; EPITHET 2008; Haley 1993; IST3 2012; JTSG 1993; Mori 1992; NINDS 1995; Wang 2003).
-
Six used urokinase (UK) (Abe 1981; Atarashi 1985; AUST 2005; Chen 2000; MELT 2007; Ohtomo 1985).
-
Two used pro‐urokinase (pro‐UK) (PROACT 1998; PROACT 2 1999).
-
Three used desmoteplase (DEDAS 2006; DIAS 2005; DIAS 2 2008).
The mode of administration was intravenous in most trials.
-
In all except four of the above trials, the thrombolytic agent was administered intravenously.
-
In two studies (AUST 2005; MELT 2007) the thrombolytic agent was given intra‐arterially into the cerebral circulation.
-
Two studies used recombinant pro‐urokinase (rpro‐UK) given intra‐arterially into the cerebral circulation (PROACT 1998; PROACT 2 1999).
-
Please note that trials testing lumbrokinase did not meet the inclusion criteria for this review. Ongoing trials are testing other new thrombolytic agents such as microplasmin or tenecteplase (see Characteristics of studies awaiting classification and Characteristics of ongoing studies).
The doses were:
-
the streptokinase dose was 1.5 MU (as used to treat acute myocardial infarction) in four studies (ASK 1996; MAST‐E 1996; MAST‐I 1995; Morris 1995);
-
the rt‐PA dose was similar to that used to treat acute myocardial infarction at 1.1 mg/kg to a maximum of 100 mg in one study (ECASS 1995); about 20% less at 0.9 mg/kg to a maximum of 90 mg in eight studies (ATLANTIS A 2000; ATLANTIS B 1999; ECASS II 1998; ECASS 3 2008; EPITHET 2008; Haley 1993; IST3 2012; NINDS 1995); either 0.7 or 0.9 mg/kg in one study (Wang 2003); and about one‐third of 0.9 mg/kg in two studies (JTSG 1993; Mori 1992). All streptokinase and rt‐PA doses were administered by intravenous infusion through a peripheral arm vein, over one hour.
-
the urokinase dose in the Chinese UK trial (Chen 2000) was 1.5 or 1.0 MU intravenously over 30 minutes (considered to be similar to that used to treat acute myocardial infarction); in three studies (Abe 1981; Atarashi 1985; Ohtomo 1985) the urokinase dose was much lower than the equivalent for acute myocardial infarction and was administered intravenously once daily for seven days. The intra‐arterial urokinase dose in one study (AUST 2005) was up to 1.0 MU maximum and in another study (MELT 2007) was up to 60,000 IU;
-
the rpro‐UK dose was 6 mg in PROACT 1998 and 9 mg in PROACT 2 1999: in both trials it was given intra‐arterially, through a catheter with its tip embedded in the occluding thrombus;
-
the dose of desmoteplase was 62.5 μ/kg, 90 μ/kg or 125 μ/kg in one study (DIAS 2005), and 90 μ/kg or 125 μ/kg in two studies (DEDAS 2006; DIAS 2 2008).
Concomitant use of antithrombotic treatment
One trial (MAST‐I 1995) compared streptokinase versus control among participants who were either allocated to aspirin, or allocated to no aspirin, started within six hours of stroke onset, in a factorial randomisation (in the groups randomised to receive aspirin, it was continued for 10 days).
Antithrombotic use was not randomly assigned in any other trial and its permitted use varied:
-
in one study ASK 1996) all participants were to receive 300 mg aspirin starting within four hours of the streptokinase infusion and continued daily thereafter;
-
in one study (PROACT 1998) all participants were to receive 1000 u/hour intravenous heparin during the trial angiogram, reduced to 500 u/hour halfway through the trial;
-
in one study (PROACT 2 1999) all participants were to receive intravenous heparin 500 u/hour for four hours starting at the time of the angiogram infusion;
-
in one study (AUST 2005) all participants received 5000 IU heparin intra‐arterially followed by intravenous heparin to a target activated partial thromboplastin time (APTT) of 60 to 80 seconds for a minimum of two days followed by oral warfarin to a target international normalised ratio (INR) of 1.5 to 2.5 for six months;
-
in one study (MAST‐E 1996) aspirin and intravenous heparin were allowed to start at any time and continue for any time (about 25% of participants received aspirin or heparin within 24 hours and 75% within the first week of the stroke);
-
in three studies (ECASS 1995; ECASS II 1998; ECASS 3 2008) subcutaneous heparin was allowed within 24 hours of the stroke (and thereafter) and aspirin after 24 hours (in ECASS II 1998, about 20% of participants were taking aspirin at the time of their stroke and 54% of rt‐PA‐treated participants received subcutaneous heparin within the first 24 hours, but we are unsure of the corresponding numbers for ECASS 1995, or ECASS 3 2008, nor how many participants in either trial received aspirin or heparin after 24 hours);
-
in one study (Haley 1993) a few participants received antithrombotic drugs within 24 hours and thereafter;
-
in 10 studies (ATLANTIS A 2000; ATLANTIS B 1999; Chen 2000; DEDAS 2006; DIAS 2005; DIAS 2 2008; IST3 2012; MELT 2007; Mori 1992; NINDS 1995) no antithrombotic drugs were allowed within 24 hours but aspirin was allowed thereafter;
-
in three studies (Abe 1981; Atarashi 1985; Ohtomo 1985) antithrombotic drugs were not allowed during the seven days of treatment infusion, but could be used thereafter;
-
the antithrombotic drug use is not stated clearly three studies (EPITHET 2008; JTSG 1993; Morris 1995).
Follow‐up
Early outcome assessments were made at around seven to 10 days in most trials. Some trials also performed more frequent assessments in the first few hours and days after the trial treatment. In this review, outcome events occurring within the first seven to 10 days (whichever was the later date at which data were collected) have been used to determine the effect of thrombolytic therapy on early outcome.
The final outcome assessment was at:
-
about one month after the stroke (Abe 1981; Atarashi 1985; JTSG 1993; Mori 1992; Morris 1995; Ohtomo 1985);
-
three months after the stroke (ASK 1996; ATLANTIS A 2000; ATLANTIS B 1999; Chen 2000; DEDAS 2006; DIAS 2005; DIAS 2 2008; ECASS 1995; ECASS II 1998; ECASS 3 2008; EPITHET 2008; Haley 1993; MELT 2007; NINDS 1995; PROACT 1998; PROACT 2 1999; Wang 2003); and
-
six months after the stroke (AUST 2005; IST3 2012; MAST‐E 1996; MAST‐I 1995).
Please note that follow‐up at six months and one year have subsequently been reported for one study (NINDS 1995), but the three‐month outcome, the primary outcome originally reported, is used in this review. This also occurred in another study (IST3 2012) where the primary six‐month outcome originally reported is used, even if the 18‐month follow‐up, of a predefined vast majority of participating countries, has been subsequently reported.
Please note that because of the difficulty of blinding the biological effect of thrombolytic therapy, it is important to ensure that outcome assessment is blinded and objective. Follow‐up should therefore be performed by individuals unaware of the trial treatment allocation either because they have not been involved in the administration of the trial treatment, or in the care of the participant during at least the first few days. In one study (MAST‐I 1995) the six‐month follow‐up was by telephone by a trained observer blind to the treatment allocation. In another study (IST3 2012) the six‐month follow‐up was blinded and performed either by postal mail or telephone by a trained observer blind to the treatment allocation. Seven studies (ASK 1996; DEDAS 2006; DIAS 2005; DIAS 2 2008; EPITHET 2008; MAST‐E 1996; Wang 2003) did not specify who performed the follow‐up or that they should not have been involved in the trial treatment administration or participant care in the first 24 hours. In five studies (ATLANTIS A 2000; ATLANTIS B 1999; Chen 2000; ECASS 3 2008; NINDS 1995), follow‐up at all stages was done by a doctor who had not been involved in the randomisation or care of the participant in the first 24 hours. In four studies (ECASS 1995; ECASS II 1998; PROACT 1998; PROACT 2 1999), follow‐up was by a mixture of individuals; if possible, by someone who had not been involved in the participant's care within the first 24 hours but this may not always have been the case.
Assessment of functional outcome
The assessment of functional outcome was by:
-
the Barthel Scale in four studies (ASK 1996; JTSG 1993; Mori 1992; Morris 1995);
-
an undefined scale (no, mild, moderate or severe 'limitation') in one study (Haley 1993);
-
the Rankin Scale in two studies (MAST‐E 1996; MAST‐I 1995);
-
the modified Rankin Scale in 16 studies (ATLANTIS A 2000; ATLANTIS B 1999; AUST 2005; Chen 2000; DEDAS 2006; DIAS 2005; DIAS 2 2008; ECASS 1995; ECASS II 1998; ECASS 3 2008; EPITHET 2008; MELT 2007; NINDS 1995; PROACT 1998; PROACT 2 1999; Wang 2003);
-
the Oxford Handicap Scale (OHS), a commonly used variant of the modified Rankin score, was used in one study (IST3 2012);
-
it was not assessed in three studies (Abe 1981; Atarashi 1985; Ohtomo 1985).
Some trials used more than one scale to measure outcome; for example, six studies (ATLANTIS A 2000; ATLANTIS B 1999; DEDAS 2006; DIAS 2005; DIAS 2 2008; NINDS 1995) favoured a 'Global Outcome Statistic' which involved collecting Barthel, Rankin, Glasgow Outcome Score and NIHSS scores individually and then combining the four scores. Three trials (Abe 1981; Atarashi 1985; Ohtomo 1985) used the 'Global Improvement Rating', which measures change in neurological status and safety outcome as a composite surrogate for functional outcome.
There are differences in the primary outcome measure used between trials, in that some used a 'poor functional outcome' and some used a 'good outcome'. The following trials sought 'dependency' (that is, whether the participant was dependent or not in activities of daily living) as a measure of poor functional outcome: two studies (MAST‐E 1996; MAST‐I 1995) defined dependency as Rankin 3 or worse, and two studies (ASK 1996; Morris 1995) defined dependency as a Barthel score of 60 or worse. In one study (IST3 2012) 'alive and independent' (OHS 0 to 2; mRS 0 to 2) was the primary measure of outcome. The 'alive and favourable outcome' (mRS 0 to 1) and ordinal analysis were included in prespecified secondary outcome analyses.
Thirteen trials sought 'good functional outcome' (that is, whether the participant had made a complete or virtually complete recovery) defining 'good outcome' as mRS 0 or 1 (ATLANTIS A 2000; ATLANTIS B 1999; Chen 2000; DEDAS 2006; DIAS 2005; DIAS 2 2008; ECASS 1995; ECASS II 1998; ECASS 3 2008; EPITHET 2008; MELT 2007; NINDS 1995; Wang 2003).
For most trials, it has been possible to obtain data on participants in each individual Rankin (or Barthel) group, or data dichotomised on Rankin 0 to 2 versus 3 to 6, or 0 to 1 versus 2 to 6, so that dependency in this review refers to Rankin, (mRS or OHS) 3 to 5 (6 being dead) unless otherwise stated. There are only two trials for which the number of participants in individual Rankin groups is not so far available (and therefore the data shown are for Rankin 2 or worse) (ATLANTIS A 2000; PROACT 1998).
Excluded studies
We excluded two trials conducted prior to the availability of CT scanning (Meyer 1963; Meyer 1964) as there was no way of confirming that the stroke was ischaemic. One small trial of intra‐arterial streptokinase stopped prematurely after four participants had been randomised due to the impracticality of the intra‐arterial technique (Edinburgh 1991). A trial started in Hong Kong was abandoned after a few participants had been randomised because of concerns that streptokinase might cause too many haemorrhages (Hong Kong 1994) (two trials (ASK 1996; MAST‐E 1996) had both just stopped prematurely creating an adverse climate for the conduct of trials testing streptokinase). We excluded one trial (Naito 1984) after discussion with Professor T Abe (co‐investigator) as it was not possible to account for 11 of the 101 randomised participants (most of whom were in the control group). We excluded six trials conducted in China, two because of confounding (Xiang 1995; Yuan 1995), one because the duration of follow‐up was only three weeks (Pang 1993), two that evaluated oral lumbrokinase thrice daily for 21 days but within an unspecified time window and without clinical outcome assessment (Jin Urokinase metaanalysis 2000; Huang 2000), and one that assessed ahylysantifarctase but lacked clinical outcomes (Liu 1994). A further 73 trials have also been excluded due to a range of reasons given in the Characteristics of excluded studies table. Studies that were potentially relevant but were confounded are listed in the Characteristics of excluded studies table and the reason given.
Risk of bias in included studies
We have included 27 trials: six trials using intravenous thrombolytic therapy published prior to 1995, 17 trials from 1995 to 2012, and four trials using intra‐arterial thrombolytic therapy.
Allocation
Among the included studies 14 (52%) fulfilled criteria for high grade concealment. The concealment has successively improved over time with the development and utilisation of new randomisation methods, such as the use of a centralised computerised method with interactive interface for randomisation over the telephone or Internet.
-
Twelve trials used central telephone or Internet randomisation (ASK 1996; AUST 2005; DEDAS 2006; DIAS 2005; DIAS 2 2008; ECASS 3 2008; IST3 2012; MAST‐E 1996; MAST‐I 1995; MELT 2007; PROACT 1998; PROACT 2 1999). In five studies (AUST 2005; IST3 2012, MAST‐I 1995; MELT 2007; PROACT 2 1999), the allocated treatment was then given unblinded without a placebo. In one of the studies (IST3 2012) with the exception of 276 participants treated in the double‐blinded phase of the trial, the remaining participants (2759) were treated unblinded without placebo. In four other studies (ASK 1996; ECASS 3 2008; MAST‐E 1996; PROACT 1998) sealed prepacks of thrombolytic drug or identical‐appearing placebo were given according to the randomisation instructions.
-
In three trials randomisation was at the participating hospital by selection of a sealed, sequentially‐numbered, prepack (of active drug or identical appearing placebo) followed within two hours by a telephone call to the Central Trial Co‐ordinating Office to notify them of the participant and the number of the drug pack (ATLANTIS A 2000; ATLANTIS B 1999; NINDS 1995). In one study (NINDS 1995), the randomisation system, set up in an effort to reduce delays to treatment, led to 'out of order' trial treatment allocations in between 13 and 31 participants, which affected every subsequent participant until the error was detected, and led to participants appearing to cross between treatment allocations (more moved from rt‐PA to placebo than the other way round). Also in the interests of reducing delays to trial treatment administration, there were some participants who ultimately were not entered into the study after the pharmacy had prepared the trial pack (and therefore some discarded trial packs). Details of the randomisation are given at www.fda.gov/cber/products/altegen061896.htm; see Clinical Review 2, page 11‐12 and 18‐19.
-
In three trials, randomisation was by selection of a sequentially numbered, sealed drug prepack at the participating centre provided by the sponsor from a randomisation schedule drawn up centrally (ECASS 1995; ECASS II 1998; EPITHET 2008).
Of the remaining trials:
-
five trials used sealed drug prepacks of active drug or identical‐appearing placebo (Abe 1981; Atarashi 1985; JTSG 1993; Mori 1992; Ohtomo 1985);
-
one used sealed envelopes (Haley 1993);
-
one used sealed drug prepacks of active drug or normal saline (as placebo) (Chen 2000);
-
the method was not stated in two (Morris 1995; Wang 2003).
Please note that, therefore, only two of the rt‐PA trials (ECASS 3 2008: IST3 2012) recorded the participant details centrally over the telephone or Internet prior to starting trial treatment. In one of these trials (IST3 2012) a minimisation algorithm was used to balance the study arms for key prognostic variables like stroke severity before randomisation. Several later studies have made use of modern randomisation techniques and entering key prognostic variables into the IT system before randomisation, which allows balancing of the study arms ‐ as has been introduced in one trial (IST3 2012) .
Blinding
Five trials were single‐blind without a placebo (AUST 2005; MAST‐I 1995; MELT 2007; PROACT 2 1999; Wang 2003). In one trial (IST3 2012) the first 276 participants were treated in the double‐blinded phase of the trial and all 2759 remaining participants were included into the open phase of the trial. All participants in the study, irrespective of study phase, were blindly assessed by postal mail or telephone by a blinded and trained observer. In PROACT 2 1999, the control group underwent catheter placement but received no infusion. All the rest were double‐blind placebo‐controlled trials. However, it should also be noted that thrombolysis, due to its effects on the coagulation system at high doses, can be difficult to blind completely due to the obvious signs of bleeding (prolonged bleeding at venepuncture sites, easy bruising, gingival or conjunctival haemorrhages, etc). Thus, provision of an identical‐appearing placebo (in the syringe) may not fully blind investigators to treatment allocation. Furthermore, as thrombolytic agents are proteins, they froth when shaken in solution with water or saline, rather like egg white mixed with water and shaken. Normal saline is therefore not an identical‐looking placebo for a thrombolytic agent. Thus, in addition to the possibilities for failure of treatment allocation concealment inherent in the randomisation methods used as outlined above, it is possible that treatment allocation could be guessed accurately by the physicians caring for the participant in the acute phase because of these biological effects. Accordingly, methods for ensuring complete blinding of treatment allocation at late follow‐up are crucial. Only one study (MAST‐I 1995) used central telephone follow‐up by a blinded trained observer. Although seven other trials specified that follow‐up was to be by a physician not involved in the acute care of the participant, it is uncertain how completely this was achieved in practice. Other trials either did not specify who should do the follow‐up, or did not make it mandatory that follow‐up was by an independent physician, so in either case follow‐up may have been carried out by the acute phase physician who could have been influenced by their knowledge of events in the acute phase.
Incomplete outcome data
All available data are included. Data on six participants were missing from the ATLANTIS B 1999 trial publication and details have not been forthcoming from the investigators, and we have not yet received data on 46 participants from the Chinese UK Trial (Chen 2000) (these participants were randomised after the trial's six‐hour time limit and have not yet been supplied). More information is available for some trials than for others, either because the trial collaborators have published very actively on various aspects of their trial, or because in some cases further information is available from other sources (for example, reports on NINDS 1995 appear on the US Food and Drug Administration (FDA) website as part of the licence application process). The more frequent reporting or greater completeness of the data for some trials is merely a reflection that more information is available for those trials, and not intended to over‐ or under‐emphasise the actual results or quality of any particular trial (or trials) compared with others for which there is less detailed information available.
Selective reporting
We have avoided, as far as possible, any reporting bias by obtaining original data from the trial investigators where these have not been published. Only the intention‐to‐treat results are included here. In any trials where there have been exclusions, these were made prior to the breaking of the randomisation code. A strict intention‐to‐treat analysis was used in 18 studies (ASK 1996; ATLANTIS A 2000; ATLANTIS B 1999; AUST 2005; DEDAS 2006; DIAS 2005; DIAS 2 2008; ECASS 1995; ECASS II 1998; ECASS 3 2008; EPITHET 2008; IST3 2012; MAST‐E 1996; MAST‐I 1995; MELT 2007; PROACT 1998; PROACT 2 1999; Wang 2003), but not in any of the earlier trials. The administrative problems with randomisation in one study (NINDS 1995) led the FDA reviewer to describe the primary analysis as an 'on‐treatment analysis'. However, the primary analysis was undertaken without excluding any participants entered into the trial and was, therefore, an intention‐to‐treat analysis (www.fda.gov/cber/products/altegen061896.htm; see Clinical Review 2, page 20). For the earlier trials, with additional information from the principal investigators if necessary, we have attempted to find a final outcome for all randomised participants, rather than simply relying on the published data from which some randomised participants may have been excluded. Note that one trial (ECASS 1995) was published as intention‐to‐treat and as a 'target population' after about 20% of the randomised participants had been excluded, but only the intention‐to‐treat data have been included here.
Other potential sources of bias
Randomisation in two trials, ASK 1996 (in the over‐three‐hour group) and MAST‐E 1996, was stopped on the advice of their respective data monitoring committees after only about half of the originally intended number of participants had been randomised. One study (MAST‐I 1995) was suspended by its steering committee (in view of the stopping of MAST‐E 1996 and ASK 1996) to examine its interim results after randomising about one third of its originally intended number. Another study (MELT 2007) was discontinued on the advice of its data monitoring committee when rt‐PA was licensed in Japan in 2005. Another study (AUST 2005) was discontinued on the basis of very slow recruitment after 24 participants of a planned sample of 200 had been included. Four studies (ECASS 1995; ECASS II 1998; NINDS 1995; PROACT 2 1999) all reached their planned targets. One study (PROACT 1998) was stopped after completing two of its planned three dosage arms by the pharmaceutical provider. Another study (ATLANTIS A 2000) was stopped on publication of the NINDS 1995 trial, and continued in modified form as ATLANTIS B 1999, which in turn stopped in 1998 following a 'futility analysis' prompted by results from the ECASS II 1998 study. Examination of funnel plots for the main outcomes showed these to be symmetrical and therefore provided little evidence of publication bias.
Effects of interventions
See Data and analyses. Note that in each analysis, trials are grouped by thrombolytic drug and whether intravenous or intra‐arterial, with a subtotal odds ratio (OR) for that group. The overall OR for all trials appears at the bottom of each plot. Note that one study (MAST‐I 1995) appears twice in the analyses because the data in participants allocated aspirin have been entered separately from the participants allocated no aspirin. Also note that some outcomes have fewer trials contributing data than other outcomes. This is because not all trials collected data on all outcomes examined in this review, or if they did collect data on the particular outcome, it may not be available. If data were available for a particular outcome, then the trial appears listed in the relevant analysis. The 2012 systematic review and meta‐analysis of rt‐PA (Wardlaw 2012) conducted a comparison of the 11 earlier rt‐PA studies (ATLANTIS A 2000; ATLANTIS B 1999; ECASS 1995; ECASS 3 2008; ECASS II 1998; EPITHET 2008; Haley 1993; JTSG 1993; Mori 1992; NINDS 1995; Wang 2003) and IST3 2012 on its own, and analysed the effect of adding IST‐3 to the 11 earlier trials. That analysis is not repeated here.
Deaths from all causes within seven to 10 days
Data on deaths occurring within the first seven to 10 days were available for 13 trials (7458 participants; Analysis 1.1). Amongst the larger and more recently completed trials, data were not available for seven trials (ATLANTIS A 2000; ATLANTIS B 1999; DEDAS 2006; DIAS 2005; NINDS 1995; PROACT 1998; PROACT 2 1999). There was a significant excess of early deaths with thrombolysis: 11.5% of those allocated to thrombolytic therapy died compared with 7.4% of those allocated to control (OR 1.69, 95% confidence interval (CI) 1.44 to 1.98, P < 0.00001). In absolute terms, if confirmed, this is an increase of 40 (95% CI 30 to 55) early deaths per 1000 participants treated with thrombolysis. There was borderline significant heterogeneity (I² = 41%).
Data on early deaths were available for eight trials using intravenous rt‐PA. The numerical (tabular) data on early deaths for the NINDS trial (NINDS 1995) have not been published, but the NINDS trial did publish a survival curve which suggested that fewer deaths occurred in the rt‐PA‐treated participants from 24 hours after treatment onwards. The tabular data available from the other rt‐PA trials showed a significant excess of early deaths: the OR was 1.44 (95% CI 1.18 to 1.76, P = 0.0003; 5535 participants) with no significant heterogeneity; the absolute effect was 25 more (95% CI 11 to 40 more) deaths per 1000 participants treated. In the three trials using streptokinase, there was also a significant excess of early deaths (OR 1.90, 95% CI 1.37 to 2.63; 963 participants).
We also performed an analysis of the data using a random‐effects model. This also shows a statistically significant excess of deaths with thrombolysis of similar magnitude to the fixed‐effect analysis (all trials: OR 1.68, 95% CI 1.30 to 2.16, P < 0.0001; just trials of rt‐PA: OR 1.44 , 95% CI 1.18 to 1.77, P = 0.0004).
Fatal intracranial haemorrhage within seven to 10 days
Data were available from 17 trials on fatal intracranial haemorrhage (9066 participants; Analysis 1.2). There are 10 trials for which this outcome is not currently available (Abe 1981; AUST 2005; DEDAS 2006; DIAS 2005; DIAS 2005; EPITHET 2008; JTSG 1993; Mori 1992; PROACT 2 1999; Wang 2003). This outcome may underestimate the frequency of intracranial haemorrhage since some of the participants who died without a post‐mortem examination or CT scan may have died of intracranial haemorrhage. There was a significant, approximate six‐fold increase in the rate of fatal intracranial haemorrhage with thrombolysis (4.19% of participants allocated to thrombolysis compared with 0.65% of those allocated to control, OR 4.53, 95% CI 3.47 to 5.91, P < 0.00001). There was no statistically significant heterogeneity (I² = 0%).
In eight trials using rt‐PA, there were 30 (95% CI 20 to 40) extra fatal intracranial haemorrhages per 1000 participants treated (OR 4.18, 95% CI 2.99 to 5.84, P < 0.00001; 6683 participants) with no statistically significant heterogeneity between trials (I² = 0%).
The combination of streptokinase with aspirin in one study (MAST‐I 1995) significantly increased fatal intracranial haemorrhage (OR 4.56, 95% CI 1.62 to 12.84; 309 participants), and more participants died of cerebral causes without a CT scan or autopsy who may therefore also have had intracranial haemorrhage than in the group who received aspirin alone.
Deaths within the first seven to 10 days from causes other than fatal intracranial haemorrhage
We calculated the effect of thrombolysis on death from causes other than fatal intracranial haemorrhage for the 10 trials that provided data on both early death and fatal intracranial haemorrhage (7226 participants; Analysis 1.3). Note that, unfortunately, this excludes several large trials (ATLANTIS A 2000; ATLANTIS B 1999; DEDAS 2006; DIAS 2005; NINDS 1995; PROACT 1998; PROACT 2 1999), which did not provide data on early death. There were 264/3752 (7.0%) non‐intracranial haemorrhage deaths in the thrombolysis‐treated participants and 234/3474 (6.7%) in the control participants (OR 1.08, 95% CI 0.90 to 1.30, P = 0.39) with significant between‐trial heterogeneity (I² = 53%, P = 0.02). In comparison with Analysis 1.2 this suggests that most of the excess in early deaths of 42 per 1000 treated with thrombolysis is attributable to intracranial haemorrhage.
In participants treated with rt‐PA (ECASS 1995; ECASS 3 2008; ECASS II 1998; Haley 1993; IST3 2012), 141/2669 (5.2%) died within the first seven to 10 days of causes other than intracranial haemorrhage, compared with 150/2634 (5.7%) in the control group, OR 0.93, 95% CI 0.73 to 1.18, P = 0.54, I² = 30%; 5303 participants),
Symptomatic (including fatal) intracranial haemorrhage within seven to 10 days
All trials provided data on intracranial haemorrhage and most provided them in a form that made it clear how many participants had suffered a neurological deterioration associated with the appearance of new haemorrhage in the brain on a CT or MR brain scan or at post‐mortem examination (10,186 participants; Analysis 1.4). There was a highly significant four‐fold increase in symptomatic intracranial haemorrhage with thrombolysis in 7.5% of those allocated to thrombolysis versus 1.7% of those allocated to control (OR 3.75, 95% CI 3.11 to 4.51, P < 0.00001) with no statistically significant between‐trial heterogeneity (P = 0.36). This represents an extra 60 (95% CI 50 to 65) symptomatic intracranial haemorrhages per 1000 participants treated.
In 12 trials using rt‐PA, there were 60 (95% CI 50 to 70) extra symptomatic intracranial haemorrhages per 1000 participants treated (OR 3.72, 95% CI 2.98 to 4.64, P < 0.00001; 7011 participants) with no heterogeneity between trials (I² = 28%, P = 0.17).
Excluding the trials that used lower doses of thrombolysis and had lower rates of fatal and symptomatic intracranial haemorrhage had little effect on the overall result as they contributed relatively few of the data to this analysis.
Symptomatic (including fatal) cerebral oedema
Six trials all testing rt‐PA provided data on symptomatic including fatal infarct swelling (ATLANTIS B 1999; ECASS 1995; ECASS II 1998; ECASS 3 2008; IST3 2012; NINDS 1995) (Analysis 1.5; 5961 participants). There was no overall reduction in symptomatic infarct swelling with thrombolysis: 10.2% of those allocated thrombolysis had symptomatic infarct swelling compared with 10.4% of those allocated control (OR 0.97, 95% CI 0.79 to 1.19, P = 0.75) with significant heterogeneity (I² = 71%, P = 0.004). Due to the heterogeneity we undertook an analysis according to a random‐effects model. This gave very similar results (OR 0.79, 95% CI 0.62 to 1.51, P = 0.88), and identical heterogeneity compared with the fixed‐effect model.
Deaths from all causes during follow‐up
Data were available for all 27 trials (10,187 participants) (Analysis 1.8). There was a modest but significant increase in deaths within scheduled follow‐up, from 18.0% in controls to 19.4% in the participants allocated to thrombolysis (OR 1.18, 95% CI 1.06 to 1.30 , P < 0.002). In absolute terms, this represented an extra 15 (95% CI six fewer to 30 more) deaths at the end of follow‐up per 1000 participants treated with thrombolysis. There was heterogeneity between the trials (I² = 48%, P = 0.003) reflected in the fact that some trials (for example, ECASS II 1998; IST3 2012; MAST‐I 1995 (of participants allocated to the thrombolytic agent alone) and NINDS 1995) showed a non‐significant reduction and others (for example, ASK 1996, ATLANTIS A 2000 and MAST‐I 1995 (of participants allocated to the thrombolytic agent plus aspirin)) showed a significant increase in case fatality with thrombolysis.
In the 12 trials using intravenous rt‐PA, there was no net effect on deaths (OR 1.06, 95% CI 0.94 to 1.20; 7012 participants) equivalent overall to seven more (two fewer to 25 more) deaths per 1000 participants treated. The heterogeneity of treatment effect among the trials of rt‐PA was not quite statistically significant (I² = 38%, P = 0.09).
In view of the statistically significant heterogeneity for all trials (I² = 48%), we performed an analysis of the data using a random‐effects model. This also shows a statistically significant excess of deaths with thrombolysis of similar magnitude to the fixed‐effect analysis (all trials: OR 1.26, 95% CI 1.04 to 1.52 P = 0.02).The results for just trials of rt‐PA (OR 1.12, 95% CI 0.90 to 1.38, P = 0.31) were also of similar magnitude as the fixed‐effect model and still without any statistical significance.
Deaths occurring between seven and 10 days and the end of follow‐up
We examined the number of deaths occurring between the first seven to 10 days and the end of follow‐up in the 13 trials that provided data for both early and late deaths (ASK 1996; Chen 2000; DIAS 2 2008; ECASS 1995; ECASS II 1998; ECASS 3 2008; EPITHET 2008; Haley 1993; IST3 2012; MAST‐E 1996; MAST‐I 1995; Mori 1992; Wang 2003). There were 425/3890 (10.9%) deaths in this period in the thrombolysis‐treated participants compared with 460/3568 (12.9%) in the control participants, a difference of 2 per 1000, OR 0.88 (95% CI 0.76, 1.02, P = 0.09; 7458 participants). There was significant heterogeneity (I² = 57%, P = 0.007) (Analysis 1.7). In eight trials testing rt‐PA, the corresponding OR was 0.84 (95% CI 0.71 to 0.99; 5535 participants) also indicating fewer deaths between seven and 10 days and the end of follow‐up. This analysis suggests that most of the deaths that occur following thrombolysis, including rt‐PA, occur in the first seven to 10 days, and that thereafter the number of deaths occurring in thrombolysis‐treated participants is very similar to that occurring in the control participants, or fewer than in the control group in trials testing rt‐PA. IST3 2012 provided data on death at six months, which suggested that the longer duration of follow‐up (six instead of three months) allowed for the deaths in the control group occurring after the first seven to 10 days (300/1520, 19.7%, versus 245/1515, 16.2% in rt‐PA treated participants) to overtake the excess of deaths due to fatal intracranial haemorrhage after rt‐PA occurring in the first seven to 10 days, leading to a net‐neutral overall effect on death at long‐term follow‐up with rt‐PA.
Death or dependency at the end of follow‐up
Analysable data from 22 trials (including all recently completed and large trials) on functional outcome were available for 9318 participants (Analysis 1.6). Two further trials also assessed functional outcome but the data from one (Haley 1993) were incomplete (3/27 participants were alive but lost to follow‐up), and in the other (JTSG 1993) the Barthel Scores were not available.
There was a significant reduction in death or dependency with thrombolysis: 54.8% compared with 58.9% of those allocated to control (OR 0.85, 95% CI 0.78 to 0.93, P = 0.0002). This is equivalent to 41 (95% CI 20 to 60) fewer dead or dependent participants per 1000 treated. There was significant heterogeneity of treatment effect between the trials (I² = 39%, P = 0.03).
For the 10 trials using intravenous rt‐PA (6886 participants), the OR was 0.84 (95% CI 0.77 to 0.93, P = 0.0006), equivalent to 40 (95% CI 20 to 65) fewer participants being dead or dependent per 1000 treated. There was significant heterogeneity of treatment effect among the trials using rt‐PA (I² = 63%, P = 0.004).
In view of the statistically significant between‐trial heterogeneity, we performed an analysis of the data on death or dependency using a random‐effects model. This gives an OR of 0.83 (95% CI 0.73 to 0.95, P = 0.006) for all trials, and of 0.80 (95% CI 0.66 to 0.97, P = 0.03) for just trials of rt‐PA. (Note of caution: random‐effects analyses place undue weight on smaller studies and possibly should be avoided with combined outcomes. Death and dependency actually reflect two outcomes which may 'pull' in different directions. Small studies may have more extreme results and give less reliable estimates of true treatment effect than large studies).
If an alternative definition of 'poor outcome' (Rankin score 2 to 6) is used in this analysis, and the analysis is restricted to just the 21 trials with both definitions available, then the ORs are as follows:
-
mRS 2 to 6 for any thrombolytic drug versus control OR 0.76 (95% CI 0.70 to 0.84, P = 0.00001; 8824 participants) with significant between‐trial heterogeneity (I² = 45%, P = 0.02); for just rt‐PA trials, the OR was 0.79 (95% CI 0.71 to 0.88, P = 0.00001; 6887 participants), but also with significant heterogeneity (I² = 64%, P = 0.003) (Analysis 1.9);
-
mRS 3 to 6 for any thrombolytic drug versus control OR 0.85 (95% CI 0.78 to 0.93, P = 0.15 with non‐significant between‐trial heterogeneity (I² = 25%; 8824 participants); for 10 just rt‐PA trials, the OR was 0.85 (95% CI 0.77 to 0.94, P = 0.001; 6887 participants), and also with borderline significant heterogeneity (I² = 47%, P = 0.05) (Analysis 1.10).
Although the confidence intervals for poor outcome defined by mRS 3 to 6 and 2 to 6 overlap for analyses of all thrombolytic drugs and of just rt‐PA, these data suggest that choosing mRS 2 to 6 as the primary outcome may provide a more positive trial result. Heterogeneity is present for poor outcome defined as mRS 2 to 6 as for poor outcome defined as mRS 3 to 6. This suggests that none of these dichotomous outcomes is specifically robust and that a more cautious estimate of overall thrombolysis and of rt‐PA effect, such as the ordinal shift analysis, is wise. Note that some individual trials 'wobble' from being positive to not positive in going between the mRS definitions (some go one way and some the other) but overall the trend is to more positive results with mRS 2 to 6. For example, ECASS II 1998 was neutral on its primary outcome of mRS 2 to 6, but positive on the alternative outcome of mRS 3 to 6; ECASS 3 2008 was positive on its primary outcome of mRS 2 to 6, but neutral on mRS 3 to 6; NINDS 1995 became less positive on mRS 3 to 6; Wang 2003 moves from very positive on mRS 2 to 6 to neutral on mRS 3 to 6, the latter trial illustrating the particular instability of small and highly positive studies, and IST3 2012 went from neutral on mRS 3 to 6 to positive on mRS 2 to 6 as well as on ordinal shift analysis.
Dependency at the end of follow‐up
We examined the effect of thrombolysis on dependency defined as mRS 3 to 5 in the 22 trials with analysable data (9318 participants; Analysis 1.11). There were 1649/4891 (33.7%) dependent participants amongst those treated with thrombolysis and 1761/4427 (39.8%) in the control group, an absolute reduction in dependent participants of 60 per 1000 participants treated with thrombolysis, OR 0.75 (95% CI 0.69 to 0.82, P < 0.00001), with borderline significant between‐trial heterogeneity (I² = 47%, P = 0.007) or between the groups treated with different thrombolytic drugs (I² = 55%, P = 0.04). This would suggest that amongst those who avoid early death (when most of the excess of deaths attributable to thrombolysis appear to occur), there is a highly significant and worthwhile reduction in the risk of being dependent with any thrombolytic treatment. Amongst those treated with rt‐PA, the reduction in dependency was similar, with an OR of 0.80 (95% CI 0.73 to 0.89, P < 0.0001; 6886 participants, 10 trials) but with between‐trial heterogeneity (I² = 53%, P = 0.02).
Alive and independent at the end of follow‐up
We provide data on the number of participants who were alive and independent (mRS 0 to 2) (Analysis 1.12) and alive and with favourable outcome (mRS 0 to 1) (Analysis 1.13) at the end of follow‐up for trials testing rt‐PA up to six hours after stroke. For mRS 0 to 2, 1611/3483 participants given rt‐PA were alive and independent versus 1434/3404 (42%) allocated control, OR 1.17 (95% CI 1.06 to 1.29, P = 0.001; 10 trials, 6887 participants) with significant heterogeneity (I² = 47%, P = 0.05). For mRS 0 to 1, 1211/3483 participants allocated rt‐PA versus 998/3404 allocated control were alive with a favourable outcome (OR 1.29, 95% CI 1.16 to 1.43, P < 0.00001; 10 trials, 6887 participants) but with significant heterogeneity (I² = 57%, P = 0.01).
Possible sources of between‐trial heterogeneity
To attempt to identify possible causes for the heterogeneity of the data on death (amongst all trials), functional outcome and symptomatic intracranial haemorrhage (SICH) in rt‐PA trials, we have ordered the trials by:
-
thrombolytic drug used (in all main outcome analyses);
-
concomitant antithrombotic drug usage;
-
time to treatment;
-
severity of stroke among participants randomised based on the case fatality in the control group (dichotomised on 0% to 19%, and 20% or more)
-
use of CT scanning versus MR diffusion‐ and perfusion‐weighted imaging (DWI/PWI) mismatch or CT perfusion prior to inclusion; and
-
CT scan ASPECTS score, which is a measure of the extent of acute ischaemic tissue changes.
We have also examined the effect of time to treatment and effect of imaging modality (CT versus MR DWI/PWI mismatch or CT perfusion) on:
-
death or dependency;
-
alive and independent;
-
death by the end of follow‐up; and
-
SICH.
There are obviously many other possible causes of heterogeneity, but it has not been possible to examine these systematically at the present time. These include, for example, the availability of data, the design of the trials, other aspects of the participant population apart from stroke severity, and the play of chance amongst what are still mainly relatively small trials.
Thrombolytic drug used
The indirect comparisons of the effects of each individual drug on death at the end of follow‐up (Analysis 1.8), death or dependency (Analysis 1.6), or SICH (Analysis 1.4) ‐ like all indirect comparisons ‐ are confounded by a number of factors, and hence not reliable. These trials differ in many respects apart from just the thrombolytic drug used, or its dose (for example the dose of streptokinase used in ASK 1996; MAST‐E 1996; and MAST‐I 1995 was similar to that used in myocardial infarction; a lower dose would perhaps be more relevant to a typical older stroke population). Although trends were observed, there were no statistically significant differences in symptomatic intracranial haemorrhage or death or dependency between trials using urokinase, streptokinase, rt‐PA or desmoteplase. There was significant between‐trial heterogeneity for death at the end of follow‐up (Analysis 1.8). Examination of this analysis shows that the MAST‐I streptokinase‐plus‐aspirin arm is a particular outlier with a large excess of deaths in the participants allocated streptokinase‐plus‐aspirin; the heterogeneity became non‐significant after removal of MAST‐I aspirin‐plus‐streptokinase‐allocated participants (I² dropped to 28%, P = 0.09). For all outcomes, including death at the end of follow‐up, there was considerable overlap between the 95% confidence intervals, clearly indicating that there are other differences between these trials in addition to the drug being tested. For example, the desmoteplase trials included participants as late as nine hours, whereas most other trials only included participants up to six hours. Any apparent differences between drugs may therefore be due to factors other than the drug in question.
Concomitant antithrombotic drug use
It is not possible to comment on the effect of aspirin use prior to the stroke; although some trials recorded prior aspirin use, we could not extract data from the publications in a comparable manner and none of the earlier trials balanced randomisation on prior aspirin use. In IST3 2012 treatment with antiplatelet drugs in the previous 48 hours was consistently collected and included among the pre‐randomisation variables. The interaction between thrombolytic drugs and antithrombotic drugs given simultaneously (or the latter very soon after the former) was only tested by random allocation in one study (MAST‐I 1995), which therefore provides the only truly valid evidence on this potential interaction. In this study there was a clinically important adverse interaction between aspirin and streptokinase when given simultaneously, resulting in a substantial increase in case fatality (early and late), which was not offset by a reduction in the number of dead or dependent participants by the end of follow‐up (28% of those allocated to streptokinase alone versus 43% of those allocated to streptokinase plus aspirin were dead by the end of follow‐up (P < 0.001), and 62% and 63% were dead or dependent respectively (versus 68% in the control group)). The actual cause of the increase in early and total deaths with streptokinase and aspirin appears largely to be due to cerebrovascular events. Aspirin with streptokinase significantly increased the number of deaths in hospital from all causes (OR 2.2, 95% CI 1.3 to 3.8), from neurological causes (OR 2.0, 95% CI 1.1 to 3.7), and intracranial haemorrhage on CT scan or at autopsy (OR 2.2, 95% CI 1.0 to 5.0) when compared with the group who received streptokinase alone. There was no difference in deaths from neurological causes without intracranial haemorrhage, but note also that more participants in the streptokinase plus aspirin group died of neurological causes without a CT scan or autopsy, so could also have had an intracranial haemorrhage, that is, the increase in intracranial haemorrhage with aspirin and streptokinase may be even greater (Ciccone 1998).
Information is also available on antithrombotic drug use (although not randomly allocated) in 20 other trials (ASK 1996; ATLANTIS A 2000; ATLANTIS B 1999; AUST 2005; Chen 2000; DEDAS 2006; DIAS 2005; DIAS 2 2008; ECASS 1995; ECASS II 1998; ECASS 3 2008; EPITHET 2008; Haley 1993; IST3 2012; MAST‐E 1996; MELT 2007; Mori 1992; NINDS 1995; PROACT 1998; PROACT 2 1999), and some further data in three other trials (Abe 1981; Atarashi 1985; Ohtomo 1985) (9674 participants; Analysis 1.14). The odds of death by the end of follow‐up were increased in line with the frequency, the amount, and proximity to the administration of thrombolysis of the concomitant antithrombotic drug use (OR 1.31 when all participants received antithrombotic drugs within 24 hours of thrombolysis; 1.27 when some participants received antithrombotic drugs within 24 hours; 1.13 when no participants received antithrombotic drugs within 24 hours but some thereafter; and 0.89 for no antithrombotic drugs within the first 10 to 14 days; I² = 50%, P = 0.002). Although these data are based on non‐randomised comparisons, they do support the evidence of a clinically significant adverse interaction between thrombolysis and antithrombotic drugs given concurrently found in the MAST‐I 1995 study and may go some way towards explaining the heterogeneity between the trials for case fatality
Severity of stroke among randomised participants
There was no obvious statistically significant difference in the effect of thrombolysis on case fatality between trials with a case fatality rate less than 19% in the control group (OR 1.31, 95% CI 1.08 to 1.58; 17 trials, 4973 participants) and those with a case fatality rate greater than 20% in the control group (OR 1.05, 95% CI 0.92 to 1.19; 10 trials, 4905 participants; pooled I² = 28%, P = 0.09) (Analysis 1.15). However, this crude comparison may mask an important relationship between stroke severity and hazard with thrombolysis. Post‐hoc statistical correction methods are unlikely to be adequate, so combined individual patient data from published rt‐PA trials may be incorrect. Also, unfortunately, analysis based on an outcome in the control group is prone to bias due to regression to the mean (Sharp 1996). Nonetheless, the post‐hoc analyses of both the NINDS (Ingall 2003) and MAST‐I trials (Wardlaw 1999a) suggested that the risk reduction for death or dependency varied with stroke severity, being largest for participants with moderate stroke (NIHSS score around 10 to 15) and least in severe stroke (NINDS score around 18 to 30). However, these findings were based on small numbers in post‐hoc analysis and need to be verified prospectively in larger randomised trials. A first attempt has now been made in the IST3 2012 trial. In IST‐3 severity was well balanced between the study arms through minimisation and more than 30% of all participants had a NINDS score of 15 or more, Furthermore, case fatality was 20% or more in the control group. The participants with more severe stroke had at least the same benefit of thrombolytic treatment as those with less severe stroke.
Effect of time to treatment (randomisation): death or dependency at the end of follow‐up
There was a significant reduction in the number of dead or dependent participants allocated thrombolysis who were randomised within three hours (57.4% of those allocated to thrombolysis were dead or dependent compared with 67% of those allocated to control, OR 0.66, 95% CI 0.56 to 0.79, P = 0.00001; 10 trials, 2160 participants) with no statistically significant heterogeneity (P = 0.91) (Analysis 1.16). In absolute terms, this is equivalent to 95 (95% CI 55 to 136) fewer dead or dependent participants per 1000 treated with thrombolysis (all drugs combined). In trials testing rt‐PA, 59.3% of those allocated rt‐PA were dead or dependent compared with 68.3% % of those allocated to control, OR 0.65 (95% CI 0.54 to 0.80, P < 0.0001; 6 trials, 1779 participants) with no significant heterogeneity, equivalent to 90 per 1000 fewer (95% CI 46 to 135) dead or dependent participants with rt‐PA. Thus, heterogeneity present in the analysis of all trials, all time windows and drugs, is removed for participants randomised within three hours of stroke. This reinforces the previous finding of no heterogeneity for rt‐PA and is presumably due to the fact that the vast majority of the participants (82.4%) in this analysis were treated with rt‐PA, an effect of the inclusion of the IST3 2012 trial.
To compare these data on the effects of treatment given within three hours with the effects when given after three hours, we examined only those trials that reported data for both time windows (ASK 1996; ATLANTIS A 2000; ATLANTIS B 1999; Chen 2000; ECASS 1995; ECASS II 1998; IST3 2012; MAST‐E 1996; MAST‐I 1995) to avoid confounding by other differences between trials (Analysis 1.17; 9 trials, 6941 participants). Although there appeared to be more reduction in death or dependency in participants treated within three hours, the difference was not significant: three hours, OR 0.69, 95% CI 0.55 to 0.85; between three and six hours OR 0.99, 95% CI 0.88 to 1.10, (I² = 28%, P = 0.13).
In trials using rt‐PA alone, amongst trials randomising in both less than three‐hour and three‐ to six‐hour time windows, the effect of treatment was not significantly different when given within three hours (OR 0.68, 95% CI 0.53 to 0.87; 5 trials, 1155 participants), or more than three hours after stroke (OR 0.97, 95% CI 0.85 to 1.09; 5 trials, 1449 participants), (I² = 45%, P = 0.06) (Analysis 1.18). Comparing all rt‐PA trials whether they randomised only under three hours or only between three and six hours or from zero to six hours made little difference (Analysis 1.19): within three hours OR 0.65, 95% CI 0.54 to 0.80; 6 trials, 1779 participants; between three and six hours OR 0.93, 95% CI 0.83 to 1.04; 7 trials, 4950 participants. This should not be interpreted to mean that time to treatment is unimportant, but rather that other factor(s) like stroke severity may have confounded the association between time and outcome, and cannot be corrected for in this tabular analysis.
We also compared the outcome death or dependency at the end of follow‐up across all trials stratified by their latest time allowed to randomisation (Analysis 1.20). This provided data at up to three hours, up to 4.5 hours, up to six hours, up to nine hours and up to 24 hours. There was surprisingly little difference in ORs for each time point: zero to three hours, OR 0.62, 95% CI 0.45 to 0.85 (1 trial, 624 participants); zero to 4.5 hours, OR 0.93, 95% CI 0.66 to 1.32 (2 trials, 1161 participants); zero to six hours, OR 0.81, 95% CI 0.69 to 0.95 (15 trials, 6883 participants); zero to nine hours, OR 0.74, 95% CI 0.35 to 1.59 (3 trials, 325 participants); zero to 24 hours OR 0.14, 95% CI 0.01 to 1.76 (1 trial, 16 participants); I² = 35%, P = 0.05.
An analysis of the effect of time on the proportion of participants who were alive and independent (Analysis 1.21; 8 trials, 6750 participants) or alive and with favourable outcome (Analysis 1.22; 6 trials, 1779 participants) for trials testing rt‐PA (other trials not assessed) suggested that earlier treatment increased the proportion with better outcomes than later treatment: for every 1000 participants given rt‐PA within three hours, 90 more would be alive and independent (P < 0.0001) with no heterogeneity, compared with 10 more if treated between three and six hours after stroke (P = 0.58).
Effect of time to treatment (randomisation): death during follow‐up
Data on participants treated within three hours of stroke are available for 11 trials (Analysis 1.23). The NINDS 1995 trial contributes 29% of the data on all drugs (624/2187 participants). There was no excess of deaths during follow‐up with thrombolysis: 25.5 % of participants allocated to thrombolysis versus 25.8% of those allocated to control (OR 0.99 95% CI 0.82 to 1.21) but with statistically significant heterogeneity (I² = 65%, P = 0.0008). The main outlier was the MAST‐I 1995 streptokinase‐plus‐aspirin‐allocated participants who showed a significant excess of deaths even with treatment within three hours. In trials using rt‐PA, the equivalent figures were OR 0.91 (95% CI 0.73 to 1.13, P = 0.39; 7 trials, 1806 participants), with no statistically significant heterogeneity (P = 0.22 ) and 14 fewer per 1000 deaths (95% CI 26 fewer to 55 fewer).
To compare treatment within three hours with treatment between three and six hours, we performed a similar analysis to those above for death and dependency (Analysis 1.24). Here there was a significant difference in treatment effect between those treated within three hours (OR 1.08, 95% CI 0.86 to 1.35; 9 trials, 1536 participants) and between three and six hours (OR 1.29, 95% CI 1.13 to 1.48; 9 trials, 5400 participants) after the stroke (I² = 63%, P = 0.0002) for all trials providing data in both time windows. For just trials testing intravenous rt‐PA (Analysis 1.25), there was a marginally significant excess of deaths for participants treated between three and six hours (OR 1.17, 95% CI 1.00 to 1.38; 5 trials, 4044 participants), compared with those treated within three hours (OR 0.97, 95% CI 0.75 to 1.26; 5 trials, 1155 participants. I² = 46%, P = 0.05). Including all rt‐PA data (i.e. all trials, all time windows) (Analysis 1.26) made little difference: within three hours: OR 0.91, 95% CI 0.73 to 1.13; 7 trials, 1806 participants; between three and six hours OR 1.16, 95% CI 1.00 to 1.35 (P = 0.07); 7 trials, 4966 participants.
We also compared the outcome death at the end of follow‐up across all trials stratified by latest time to randomisation (Analysis 1.27). This provided data at up to three hours, up to 4.5 hours, up to six hours, up to nine hours and up to 24 hours. Although 'wobbly', there appeared to be an increase in ORs with increasing latest time to randomisation (and this was also just statistically significant, P = 0.04), but bear in mind that there are other major differences between these studies and very few data for later time windows: zero to three hours, OR 0.79 (95% CI 0.53 to 1.17; 2 trials, 651 participants); zero to 4.5 hours, OR 1.43 (95% CI 1.01 to 2.03; 2 trials, 1161 participants); zero to six hours, OR 1.12 (95% CI 0.99 to 1.26; 16 trials, 6886 participants ); zero to nine hours, OR 2.10 (95% CI 0.79 to 5.58; 3 trials, 325 participants); zero to 24 hours, OR 1.00 (95% CI 0.14 to 7.10; 1 trial, 16 participants; I² = 33%, P = 0.07).
Effect of time to treatment (randomisation) ‐ symptomatic intracranial haemorrhage (SICH)
Data are available on SICH from trials randomising both in under three hours and between three‐ and six‐hour time windows for five rt‐PA trials (ATLANTIS B 1999; ATLANTIS A 2000; ECASS 1995; ECASS II 1998; IST3 2012) (Analysis 1.28). Within three hours, there was an excess of SICH with rt‐PA (OR 4.25, 95% CI 2.53 to 7.16; 1155 participants). This did not differ to the increase in SICH in participants randomised between three and six hours (OR 3.62 , 95% CI 2.76 to 4.76; 4013 participants; I² = 0%). When data from all rt‐PA trials were included (that is, those randomising only within three or only between three and six hours) (Analysis 1.29), there was little difference: within three hours OR 4.55 (95% CI 2.92 to 7.09; 6 trials, 1779 participants); between three and six hours OR 3.73 (95% CI 2.86 to 4.86; 7 trials, 4935 participants; I² = 0%).
We also compared the outcome SICH across all trials stratified by latest time to randomisation (Analysis 1.30). There was surprisingly little difference in ORs for each time point: zero to three hours, OR 5.85 (95% CI 1.54 to 22.26; 2 trials, 651 participants); zero to 4.5 hours, OR 6.56 (95% CI 2.51 to 17.18; 2 trials, 1161 participants); zero to six hours, OR 4.20 (95% CI 3.21 to 5.50; 15 trials, 6951 participants); zero to nine hours, OR 6.82 (95% CI 0.88 to 52.78; 3 trials, 325 participants); zero to 24 hours, no SICH in AUST 2005; I² = 23, P = 0.17.
Effect of age under or over 80 years on death or dependency and alive and independent
We analysed the effect of age in just the rt‐PA trials. Three trials included participants aged over 80 years (EPITHET 2008; IST3 2012; NINDS 1995), most coming from IST3 2012. With treatment up to six hours, the effect of rtPA on reducing the proportion of participants who were dead or dependent aged over 80 years (OR 0.80, 95% CI 0.64 to 0.99, P = 0.04; 3 trials, 1696 participants) was the same as in participants aged up to and including 80 years (OR 0.85, 95% CI 0.76 to 0.95, P = 0.004; 10 trials, 5175 participants) (Analysis 1.31). For participants treated within three hours (Analysis 1.32), those aged over 80 (OR 0.56, 95% CI 0.40 to 0.78, P = 0.0007; 2 trials, 726 participants) did as well as those aged up to or including 80 years (0.66, 95% CI 0.52, 0.85, P = 0.001; 6 trials, 1039 participants) with no heterogeneity. There was similarly little difference between the proportions of those aged under or over 80 years who were alive and independent after rt‐PA whether treated up to six hours (Analysis 1.33; 10 trials, 6885 participants), within three hours (Analysis 1.34; 6 trials, 1779 participants) or between three and six hours (Analysis 1.35; 7 trials, 4971 participants).
Selection using CT scanning or Magnetic Resonance diffusion and perfusion (DWI/PWI) mismatch
We restricted this analysis to just trials testing intravenous thrombolysis. Eleven trials contributed data on selection using CT scanning (ATLANTIS A 2000; ATLANTIS B 1999; Chen 2000; ECASS 1995; ECASS II 1998; ECASS 3 2008; IST3 2012; MAST‐E 1996; MAST‐I 1995; NINDS 1995; Wang 2003) and four trials contributed data on selection using DWI/PWI mismatch (DEDAS 2006; DIAS 2005; DIAS 2 2008; EPITHET 2008). We included the EPITHET trial in the DWI/PWI section, although participants were not actually selected for inclusion on the basis of the MR findings, but rather on the basis of plain CT. However EPITHET obtained MR DWI/PWI data prior to randomisation and provided data on mismatch findings in relation to thrombolysis effect. Amongst 8334 participants selected on the basis of plain CT, 19% allocated thrombolysis and 19.3% allocated control were dead at the end of follow‐up (OR 1.12, 95% CI 1.00 to 1.25; 15 trials); amongst 426 participants selected on the basis of DWI/PWI mismatch, 14% allocated thrombolysis and 8.2% allocated control were dead at the end of follow‐up (OR 2.05, 95% CI 1.02 to 4.15; 4 trials) (Analysis 1.36). Amongst 7843 participants selected on the basis of plain CT, 60.5% allocated thrombolysis and 66.3% allocated control were dead or dependent at the end of follow‐up (OR 0.81, 95% CI 0.73 to 0.89; 11 trials); amongst 425 participants selected on the basis of DWI/PWI mismatch, 58.6% allocated thrombolysis and 61.2% allocated control were dead or dependent at the end of follow‐up (OR 0.88, 95% CI 0.58 to 1.35; 4 trials) (Analysis 1.37). Amongst 8358 participants selected on the basis of plain CT, 8.1% allocated thrombolysis and 1.9% allocated control developed SICH (OR 4.38, 95% CI 3.38 to 5.69; 16 trials); amongst 426 participants selected on the basis of DWI/PWI mismatch, 6.4% allocated thrombolysis and 0% allocated control developed SICH (OR 7.51, 95% CI 1.40 to 40.35; 4 trials) (Analysis 1.38). These differences between selection by CT and by DWI/PWI mismatch were not statistically different.
Four studies (ECASS II 1998; IST3 2012; NINDS 1995; PROACT 2 1999) assessed ischaemic tissue extent on plain CT according to the ASPECT score, 8 to 10 versus 0 to 7, and the probability of being alive and independent (mRS 0 to 1) by end of follow‐up after thrombolysis (Analysis 1.39). In all, 4567 participants provided data for this analysis. Among the 3317 participants with an ASPECT score indicating no or only a small area of ischaemic change (ASPECT 8 to 10), 38.9% of those allocated control versus 43.4% of those allocated thrombolysis had a favourable outcome (mRS 0 to 1) at the end of follow‐up, (OR 1.21, 95% CI 1.06 to 1.39, P = 0.006; 4 trials, I² = 79%, P = 0.002). For the 1250 participants with an ASPECT score indicative of more extensive ischaemia (ASPECT 0 to 7) 19.3% of participants allocated control versus 22.5% of participants allocated thrombolysis were alive and independent (OR 1.20, 95% CI 0.91 to 1.58, P = 0.19; 4 trials), with no heterogeneity (I² = 1%, P = 0.39). However, there was heterogeneity between the effect of rt‐PA in the participants with no or mild and extensive ischaemic change on CT (I² = 60, P = 0.01). In this relatively small sample tested for the effect on outcome by grade of CT‐visible infarction, there were several types of drugs and different administration (pro‐urokinase intra‐arterially and rt‐PA intravenously) which may account for the between‐group heterogeneity.
Trials testing intra‐arterial thrombolysis
Amongst participants allocated to thrombolysis, 56.6% were dead or dependent at the end of follow‐up compared with 70.3% of those allocated to control, OR 0.49 (95% CI 0.31 to 0.79; 4 trials, 350 participants) (Analysis 1.40). This can be compared crudely with analysis of death or dependency for the combined intravenous thrombolysis trials which gave an OR of 0.79 (95% CI 0.71 to 0.89). These are not direct comparisons, and there are many other differences between the trials apart from the route of administration; this analysis should therefore be regarded with extreme caution. A separate Cochrane review presents the evidence, at present very limited, on direct randomised comparisons of intravenous with intra‐arterial thrombolysis (Wardlaw 2013).
Discussion
Summary of main results
There is strong evidence from 27 trials in 10,187 participants on the immediate hazards and the apparent net benefit of thrombolytic therapy given up to within three hours of acute ischaemic stroke, with overall benefit suggested up to six hours, for people aged over or under 80 years, and with different stroke severities. Overall, thrombolytic therapy was associated with a significant excess of deaths within the first seven to 10 days, symptomatic and fatal intracranial haemorrhages and (for all drugs) deaths by the end of follow‐up. Most of the excess of deaths with thrombolysis occurred early and was explained by fatal intracranial haemorrhage. However, dependency was reduced in survivors so overall there was a significant net benefit. For every 1000 people treated with thrombolysis, 41 avoided death or dependency. Treatment within three hours resulted in 95/1000 fewer dead or dependent people. Trials using intravenous recombinant tissue plasminogen activator (rt‐PA) contributed the most data to this review, and rt‐PA appeared more favourable. Nevertheless, it was associated with an excess of early deaths, virtually all attributable to fatal intracranial haemorrhage (ICH), and a significant excess of symptomatic intracranial haemorrhage (SICH), but a neutral effect on deaths by the end of follow‐up, and significantly more people avoiding dependent survival. If the factors associated with early fatal ICH can be identified (Whiteley 2012), then it may become easier to identify those who are at greatest risk of harm and clarify the risk‐to‐benefit ratio for thrombolysis. There was no clear increase in hazard (ICH or death) with increasing time up to six hours after stroke, although there was some evidence of decreasing benefit (reduction in death and dependency). Therefore, increasing time to treatment may reduce benefit more than it increases the hazard of thrombolysis.
IST3 2012 has provided substantial new data since the last update, and includes a wide range of participants that has helped to answer questions about how to select patients (to maximise benefit and minimise hazard), by using the variables age, time from onset, stroke severity, stroke subtype, role of imaging findings and co‐morbidities. However, questions remain about whether hazard can be minimised by novel thrombolytic drugs, different doses and routes or speed of administration (Wardlaw 2013) or strategies to improve access of rt‐PA to the occluding thrombus (e.g. ultrasound or glyceryl trinitrate (GTN)): some trials addressing these questions are ongoing or are in the planning stages.
There is now good data on the effect of thrombolytic therapy in the elderly, in whom stroke is most common. Prior to IST3 2012, only EPITHET 2008, MAST‐E 1996, MAST‐I 1995, and NINDS 1995 did not have an upper age limit but they included few participants (69 in NINDS and 25 in EPITHET) older than 80 years. People over 80 constitute a significant and increasing proportion of patients with stroke. The European license has an upper age limit of 80 years and has further strict selection criteria compared with the USA, where the license is based mainly on the NINDS 1995 trial and does not have an upper age limit. Among other limitations in Europe, an upper limit of stroke severity has also been introduced, as has a contraindication in people with the combined occurrence of diabetes and previous stroke. Hopefully these new data showing similar benefits of rt‐PA in older as in younger people, particularly if treated within three hours of stroke, will lead to a relaxation of the licence.
Despite the large increase in available data with the inclusion of IST3 2012 (and near doubling of data for rt‐PA) there is still significant between‐trial heterogeneity for death or dependency at the end of follow‐up both for trials testing rt‐PA, and for all thrombolysis trials together. For rt‐PA, there is heterogeneity for death or dependency whether defined as modified Rankin Score (mRS) 3 to 6 or 2 to 6. This indicates that more data are needed to provide more robust results. The need for more data from new trials is also supported by the fact that the data are relatively unstable. For example, changing the definition of death or dependency from mRS 3 to 6 to 2 to 6 increases the heterogeneity for all thrombolysis trials (and is still present for just rt‐PA trials) (Wardlaw 2000). In this latter analysis, although the overall conclusion of the trials combined was not materially altered, some individual trials 'wobbled' between being statistically significantly positive to statistically non‐significant on moving from Rankin score 2 to 6 to 3 to 6, and vice versa (ECASS II 1998; ECASS 3 2008; PROACT 2 1999; Wardlaw 2000), with the most recent victim of this play of chance being IST3 2012. The fact that a neutral trial can become positive, or vice versa, or heterogeneity can be apparently removed by such a small alteration in the endpoint analysed simply emphasises the instability of the data and also advocates for alternative more robust ways of analysing data. The heterogeneity could have arisen from many sources, including differences in the design of the trials, in the type of participants included, in the availability of data to contribute to the present analysis (not all trials contributed data to all outcome analyses), and in the fact that these can only be considered as small trials for a condition as heterogeneous as ischaemic stroke. Individual data will be able to examine whether factors such as sex, blood glucose, etc. influence the effect of thrombolysis (Kent 2005a; Kent 2005b; Kent 2007; Mann 2005; Sandercock 2006). Comparisons of different thrombolysis drugs, doses and routes of administration are addressed in a separate Cochrane review (Wardlaw 2013).
There was a suggestion that the presence of a visible recent infarct on the CT scan prior to randomisation may be related to increased hazard (risk of ICH and death) but this was based on a post‐hoc analysis of the CT scans in ECASS 1995, in which the baseline CT scans were not read blind to follow‐up CT scans. Some trials had CT‐visible infarction exclusion criteria and some, including NINDS 1995, did not. The reported rate of CT‐visible infarction varied between trials, either reflecting differences in participant selection, observer sensitivity, or definition of visible infarction signs. We have now been able to include data on CT‐visible infarct extent categorised using the ASPECTS score from secondary analyses of CT scans in several trials. We did not find any evidence of an interaction between visible infarct extent and rt‐PA on death or dependency. Other possible risk factors identifiable on the CT scan that might interact with rt‐PA (such as evidence of small vessel disease), are being addressed in IST3 2012. Whether or not other, more advanced imaging modalities, such as CT perfusion or magnetic resonance (MR) diffusion with perfusion, would improve patient selection or allow an extension of time window to treatment is the subject of ongoing trials (EXTEND). At present, the modest data available in an indirect comparison do not suggest that selection on the basis of MR diffusion‐ or perfusion‐weighted imaging (DWI/PWI) leads to better effect of thrombolysis than for those selected on the basis of plain CT (Analysis 1.36; Analysis 1.37).
Overall completeness and applicability of evidence
The trials included in this review are small in comparison with the thrombolytic therapy in myocardial infarction trials. Nonetheless, this version of the review, with the addition of IST3 2012, includes a wider range of participants, with many more aged over 80 years, than previous versions. This is an effect of the principal methodology of IST3 2012 with the application of the uncertainty principle, which states that when there is a clear indication for treatment the person should be treated, and when there clearly is a contraindicated the person should not be treated; only where the tested treatment is promising but unproven could the participant be randomised. This approach provides the chance to test wider treatment criteria. There are substantially more data with the inclusion of 3035 participants from IST3 2012. However, not all trials contributed to all analyses, some analyses only include five or so trials and there were imbalances in stroke severity and age between treatment groups in some earlier trials. There remains significant heterogeneity for some outcomes and lack of a complete picture of the sources of heterogeneity, meaning that there is scope for more trials. This is particularly the case for mild strokes. Although there is a lack of information on concomitant aspirin usage, it seems fairly clear from MAST‐I 1995 and the non‐random comparisons in Analysis 1.14 that aspirin (or other antithrombotic drugs) given at the same time as thrombolysis is hazardous. The adverse effect of aspirin together with rt‐PA was confirmed in one recent trial that stopped prematurely due to excess bleeding with aspirin and rt‐PA combined (Zinkstok 2008). We have not been able to identify clear reasons why some people do poorly with thrombolysis. For example, the absence of any apparent time dependence of SICH with thrombolysis suggests that some other non‐time‐dependent factors may increase haemorrhage risk ‐ i.e., not the presence of acute ischaemic change or other time‐dependent factors. In contrast, the benefit of thrombolysis declines with time, fewer patients being alive and independent the later the treatment. The independent data meta‐analysis of all rt‐PA trials may be better able to identify factors influencing hazard.
The time window beyond which there is unlikely to be any benefit (or too much hazard) with thrombolytic therapy is unclear. The modifiers of the adverse effects of thrombolytic mode of action remain undetermined. There is a clear time dependency, with fewer participants treated within three hours of stroke being dead or dependent, than participants treated between three and six hours, but the latest time window remains undetermined. Other trials that tested other thrombolytic regimens beyond six hours suggest that the benefit may extend to nine hours or even longer in selected people. Although these trials were themselves not positive, when combined the overall result suggests that thrombolysis reduces death or dependency even at these later times. Thus, the time window for benefit probably extends to, and even beyond, six hours in selected people. However, this should not encourage complacency about the need for speedy treatment in ischaemic stroke. It simply underlines the need for more data so as to be able to provide individually‐tailored treatment accounting for age, sex, stroke severity, prior aspirin use, brain scan appearances, etc., to name but a few factors in addition to time, which are likely to affect thrombolysis effect.
There is little information on which thrombolytic drug might have most benefit and least hazard, and there is little information on which dosage of drug has least hazard and most benefit (Wardlaw 2013). Direct randomised comparisons would be required (Dundar 2003). The Chinese UK trial (Chen 2000) had two doses of urokinase, but was underpowered to detect any difference between them. Similarly, the DEDAS 2006, DIAS 2005, and DIAS 2 2008 trials were together underpowered to detect a difference between doses of desmoteplase. Note that further details on direct randomised comparisons of drug or dose are included in a separate Cochrane Review (Wardlaw 2013), for which there are few additional data since its original publication.
There is limited information about the effect of thrombolysis on survival in a longer time frame, as most of the trials (all of the recent rt‐PA trials) performed the follow‐up at three months. NINDS 1995 published data on functional outcome at six months and one year which indicate that the effect of rt‐PA was sustained beyond three months. IST3 2012 published data on functional outcome and death at 18 months which also indicate long‐term benefits, but there are few other data on whether the benefit of thrombolysis is sustained (or even increases) at one year. This information is important for understanding the impact of thrombolytic treatment on health economics.
It is difficult to assess the cost effectiveness of thrombolytic treatment. A review for the UK National Health Service Health Technology Assessment (HTA) Programme on the cost effectiveness of thrombolytic treatment for acute ischaemic stroke needs to be updated (Sandercock 2002). One trial has a prospective substudy ongoing for the measured and modelled evaluation of cost effectiveness (IST3 2012).
Quality of the evidence
The overall quality of evidence, particularly for the drug with the majority of data, rt‐PA, is good. The concerns about quality in earlier trials are largely overcome. The recent trials had good allocation concealment, central telephone randomisation, central blinded follow‐up, and very few losses to follow‐up.
Potential biases in the review process
This review is the result of an ongoing process involving the collaborative effort of many researchers worldwide and the principal investigators of many of the thrombolysis trials. At present, this review represents all of the evidence from the randomised controlled studies on the effects of thrombolytic therapy on acute ischaemic stroke. Comparisons of trials using different thrombolytic drugs should be treated with caution as these comparisons are indirect; available data on direct comparisons are presented in the companion review (Wardlaw 2013). We have tried to include all available tabular data and have checked the accuracy of it rigorously. We have tried not to miss any relevant completed trials. We can only apologise if we have overlooked some available data on an outcome in an included trial or have overlooked a trial completely.
Agreements and disagreements with other studies or reviews
A more detailed individual patient data meta‐analysis of the streptokinase trials, using data from MAST‐E 1996, MAST‐I 1995 and ASK 1996, has been completed (TAS‐PP 1999); urokinase trials (Jin Urokinase metaanalysis 2000) have been completed, and three rounds of a meta‐analysis of individual data from the rt‐PA trials have been published (rt‐PA pooled analysis 2004; rt‐PA pooled analysis 2008; TTAS) with a third completed and accepted for publication (in press). The analyses based on tabular data in the present review are consistent with these individual patient data analyses.
The SICH, death and functional outcome rates in the large registry of people treated open‐label with rt‐PA (SITS‐MOST) are also similar to those found in the randomised trials. However, patient surveys are ultimately voluntary and therefore are inevitably prone to potential bias through incomplete data.

Comparison 1 Any thrombolytic agent versus control, Outcome 1 Deaths from all causes within 7 to 10 days.

Comparison 1 Any thrombolytic agent versus control, Outcome 2 Fatal intracranial haemorrhage within 7 to 10 days.

Comparison 1 Any thrombolytic agent versus control, Outcome 3 Deaths within the first 7 to 10 days from causes other than fatal intracranial haemorrhage.

Comparison 1 Any thrombolytic agent versus control, Outcome 4 Symptomatic (including fatal) intracranial haemorrhage within 7 to 10 days.

Comparison 1 Any thrombolytic agent versus control, Outcome 5 Symptomatic (including fatal) cerebral oedema.

Comparison 1 Any thrombolytic agent versus control, Outcome 6 Death or dependency at the end of follow‐up.

Comparison 1 Any thrombolytic agent versus control, Outcome 7 Deaths occurring between 7 and 10 days and the end of follow‐up.
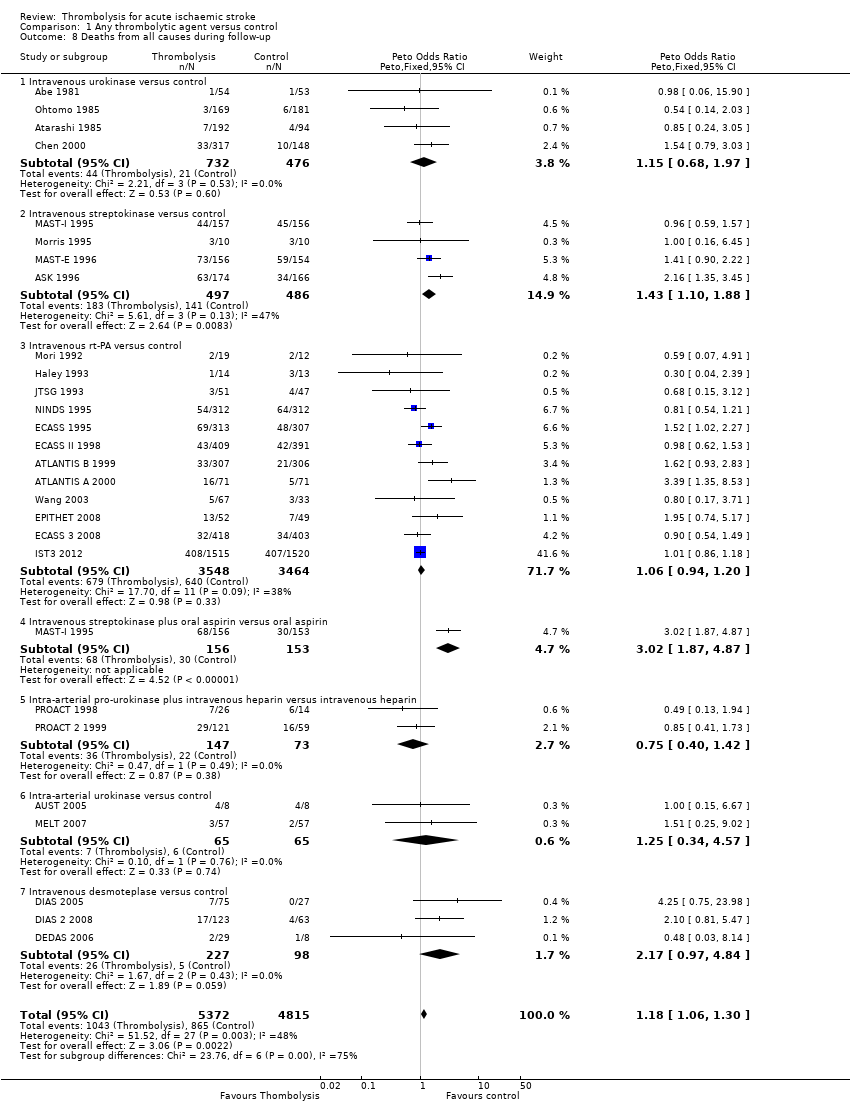
Comparison 1 Any thrombolytic agent versus control, Outcome 8 Deaths from all causes during follow‐up.

Comparison 1 Any thrombolytic agent versus control, Outcome 9 Death or dependency defined as mRS 2 to 6.

Comparison 1 Any thrombolytic agent versus control, Outcome 10 Death or dependency defined as mRS 3 to 6.
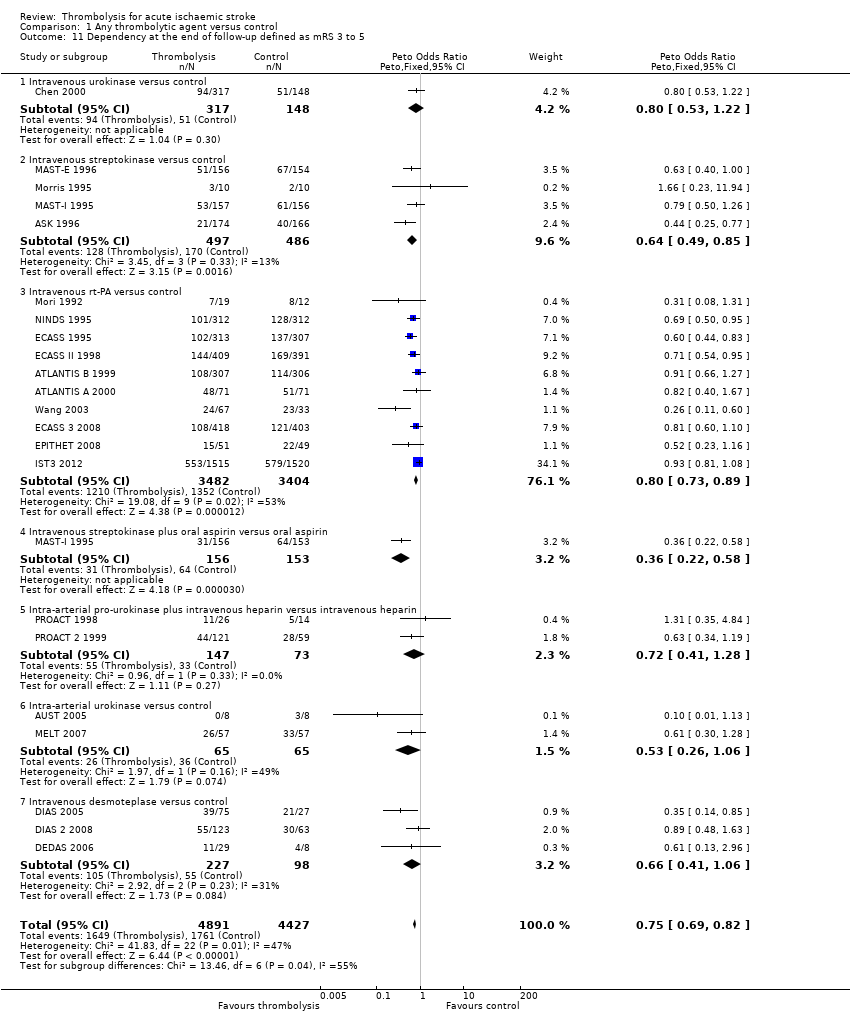
Comparison 1 Any thrombolytic agent versus control, Outcome 11 Dependency at the end of follow‐up defined as mRS 3 to 5.

Comparison 1 Any thrombolytic agent versus control, Outcome 12 Alive and independent (mRS 0 to 2) at end of follow‐up, participants treated up to six hours.

Comparison 1 Any thrombolytic agent versus control, Outcome 13 Alive and favourable outcome (mRS 0 to 1) at end of follow‐up, participants treated up to six hours.

Comparison 1 Any thrombolytic agent versus control, Outcome 14 Deaths from all causes ordered by antithrombotic drug use.

Comparison 1 Any thrombolytic agent versus control, Outcome 15 Deaths from all causes ordered by stroke severity.

Comparison 1 Any thrombolytic agent versus control, Outcome 16 Death or dependency at the end of follow‐up: participants randomised within 3 hours of stroke.
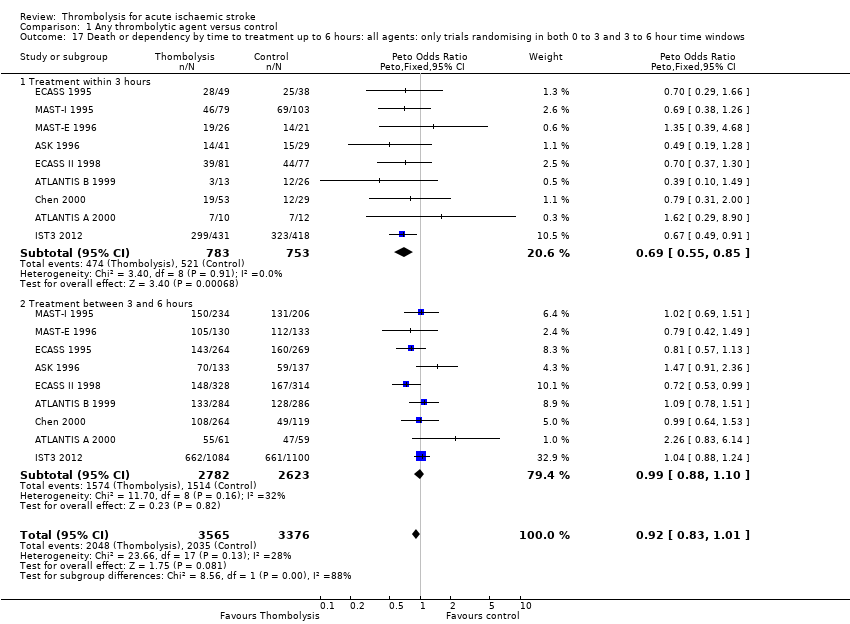
Comparison 1 Any thrombolytic agent versus control, Outcome 17 Death or dependency by time to treatment up to 6 hours: all agents: only trials randomising in both 0 to 3 and 3 to 6 hour time windows.
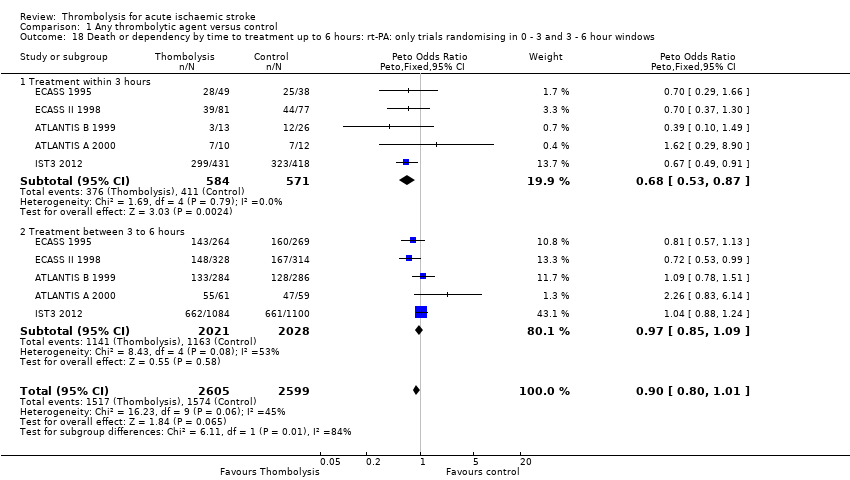
Comparison 1 Any thrombolytic agent versus control, Outcome 18 Death or dependency by time to treatment up to 6 hours: rt‐PA: only trials randomising in 0 ‐ 3 and 3 ‐ 6 hour windows.
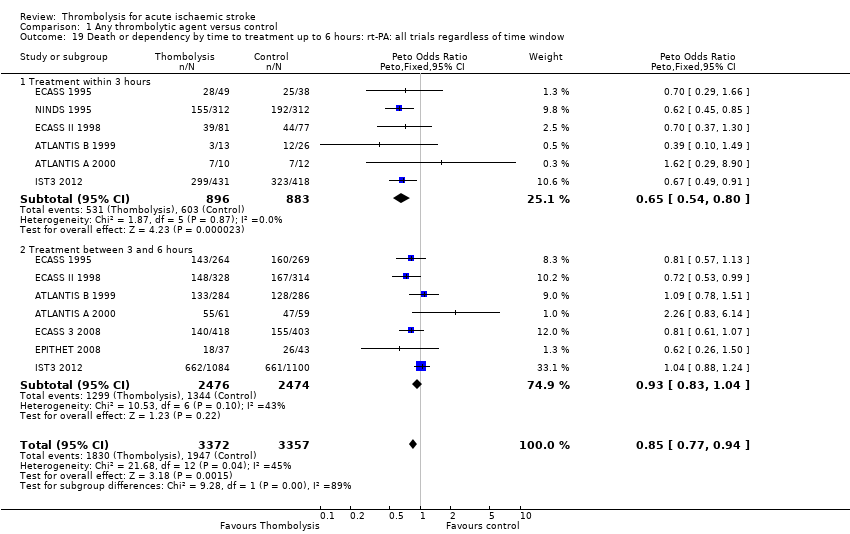
Comparison 1 Any thrombolytic agent versus control, Outcome 19 Death or dependency by time to treatment up to 6 hours: rt‐PA: all trials regardless of time window.

Comparison 1 Any thrombolytic agent versus control, Outcome 20 Death or dependency by latest time to randomisation.

Comparison 1 Any thrombolytic agent versus control, Outcome 21 Alive and independent (mRS 0 to 2) at end of follow‐up, participants treated < 3 versus 3 to 6 hours, all trials regardless of latest time window.

Comparison 1 Any thrombolytic agent versus control, Outcome 22 Alive and favourable outcome (mRS 0 to 1) at end of follow‐up, < 3 versus 3 ‐ 6 hours, only trials randomising in both time windows.
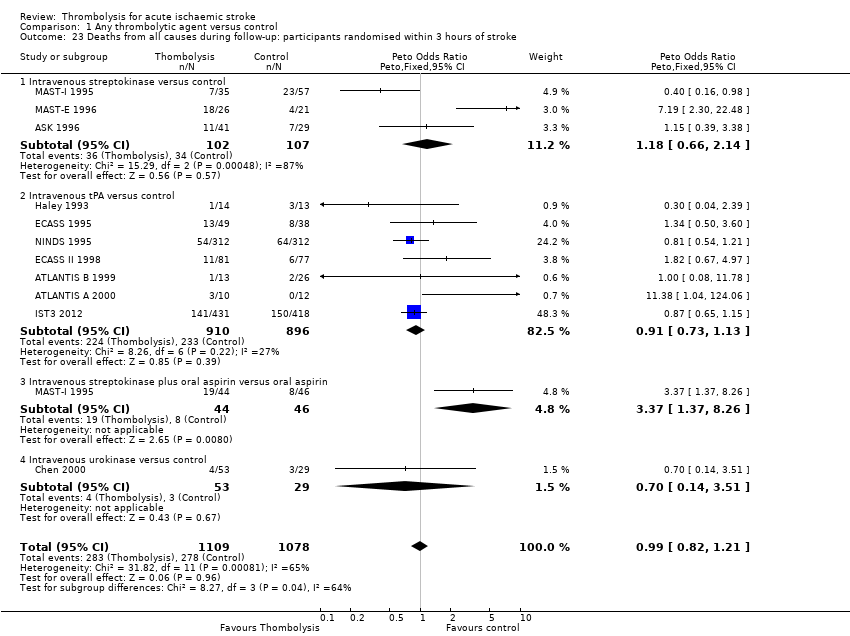
Comparison 1 Any thrombolytic agent versus control, Outcome 23 Deaths from all causes during follow‐up: participants randomised within 3 hours of stroke.

Comparison 1 Any thrombolytic agent versus control, Outcome 24 Deaths by time to treatment up to 6 hours: all agents: only trials randomising in both 0 ‐ 3 and 3 ‐ 6 hour time windows.

Comparison 1 Any thrombolytic agent versus control, Outcome 25 Deaths by time to treatment up to 6 hours: rt‐PA: only trials randomising in both 0 to 3 and 3 to 6 hour time windows.

Comparison 1 Any thrombolytic agent versus control, Outcome 26 Deaths by time to treatment up to 6 hours: rt‐PA: all trials regardless of time window.

Comparison 1 Any thrombolytic agent versus control, Outcome 27 Death by latest time to treatment.
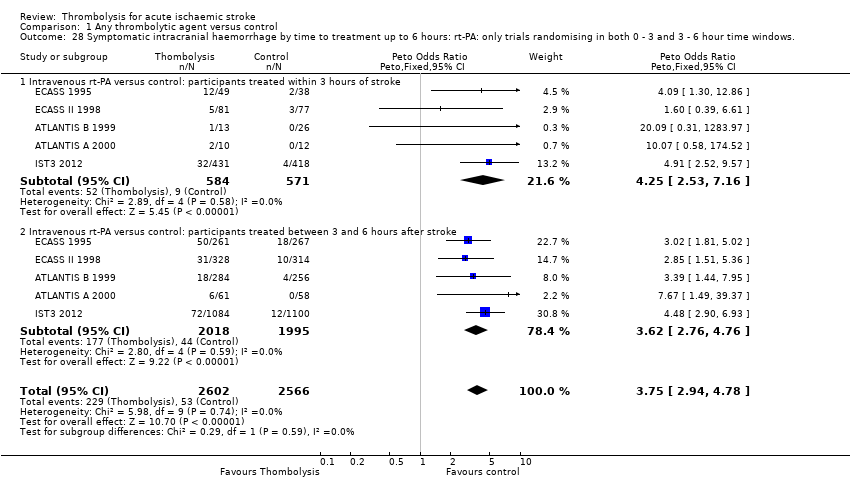
Comparison 1 Any thrombolytic agent versus control, Outcome 28 Symptomatic intracranial haemorrhage by time to treatment up to 6 hours: rt‐PA: only trials randomising in both 0 ‐ 3 and 3 ‐ 6 hour time windows..
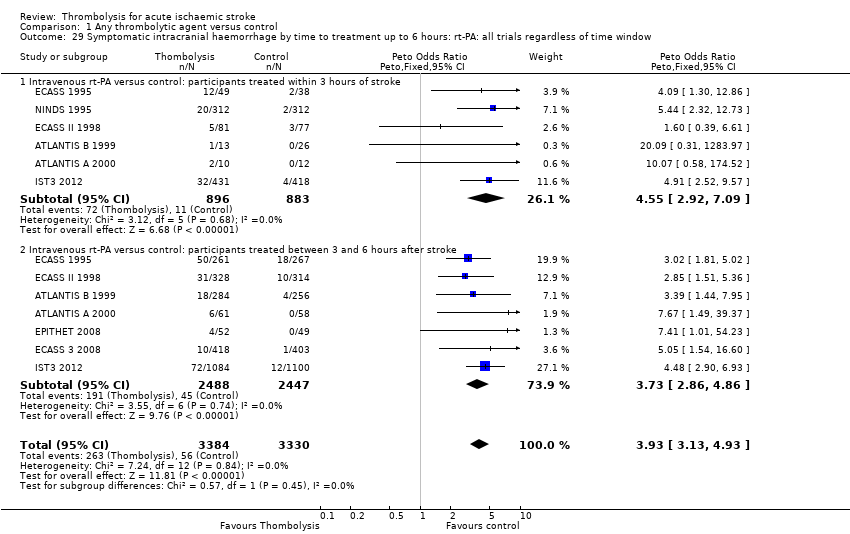
Comparison 1 Any thrombolytic agent versus control, Outcome 29 Symptomatic intracranial haemorrhage by time to treatment up to 6 hours: rt‐PA: all trials regardless of time window.

Comparison 1 Any thrombolytic agent versus control, Outcome 30 Symptomatic intracranial haemorrhage by latest time to treatment.
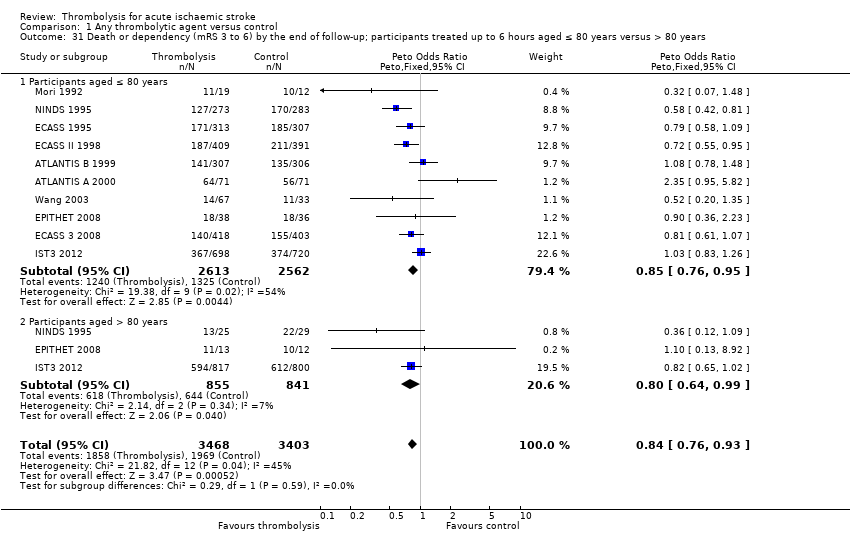
Comparison 1 Any thrombolytic agent versus control, Outcome 31 Death or dependency (mRS 3 to 6) by the end of follow‐up; participants treated up to 6 hours aged ≤ 80 years versus > 80 years.

Comparison 1 Any thrombolytic agent versus control, Outcome 32 Death or dependency (mRS 3 to 6) by the end of follow‐up, participants treated within 3 hours aged ≤ 80 years versus > 80 years.

Comparison 1 Any thrombolytic agent versus control, Outcome 33 Alive and independent (mRS 0 to 2) at end of follow‐up, participants treated up to 6 hours aged ≤ 80 years versus > 80 years.

Comparison 1 Any thrombolytic agent versus control, Outcome 34 Alive and independent (mRS 0 to 2) at end of folllow‐up, participants treated within 3 hours, aged ≤ 80 years versus > 80 years.

Comparison 1 Any thrombolytic agent versus control, Outcome 35 Alive and independent (mRS 0 to 2) at end of follow‐up, participants treated 3 ‐ 6 hours, aged ≤ 80 years versus > 80 years.

Comparison 1 Any thrombolytic agent versus control, Outcome 36 Death: selection by MR DWI/PWI or CT.
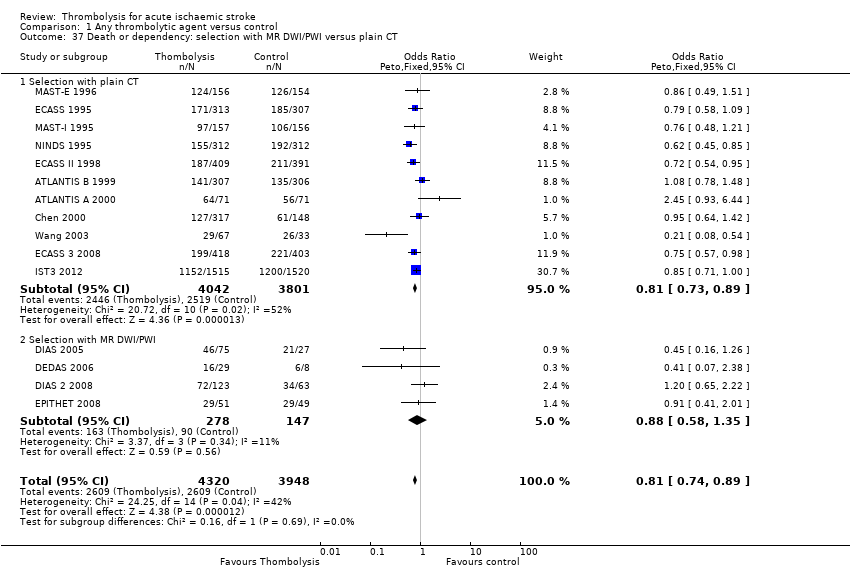
Comparison 1 Any thrombolytic agent versus control, Outcome 37 Death or dependency: selection with MR DWI/PWI versus plain CT.

Comparison 1 Any thrombolytic agent versus control, Outcome 38 Symptomatic intracranial haemorrhage: selection with MR DWI/PWI or CT.

Comparison 1 Any thrombolytic agent versus control, Outcome 39 Alive and independent (mRS 0 to 1) at end of follow‐up, by plain CT ASPECTS score.
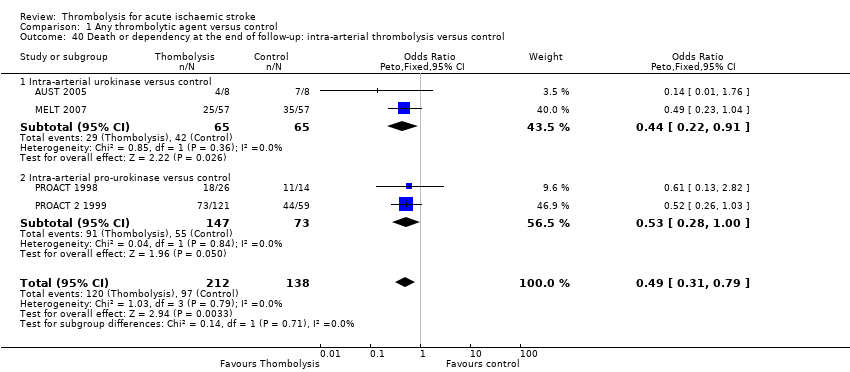
Comparison 1 Any thrombolytic agent versus control, Outcome 40 Death or dependency at the end of follow‐up: intra‐arterial thrombolysis versus control.
| Outcome or subgroup title | No. of studies | No. of participants | Statistical method | Effect size |
| 1 Deaths from all causes within 7 to 10 days Show forest plot | 13 | 7458 | Peto Odds Ratio (Peto, Fixed, 95% CI) | 1.69 [1.44, 1.98] |
| 1.1 Intravenous urokinase versus control | 1 | 465 | Peto Odds Ratio (Peto, Fixed, 95% CI) | 1.35 [0.62, 2.94] |
| 1.2 Intravenous streptokinase versus control | 3 | 963 | Peto Odds Ratio (Peto, Fixed, 95% CI) | 1.90 [1.37, 2.63] |
| 1.3 Intravenous rt‐PA versus control | 8 | 5535 | Peto Odds Ratio (Peto, Fixed, 95% CI) | 1.44 [1.18, 1.76] |
| 1.4 Intravenous streptokinase plus oral aspirin versus oral aspirin | 1 | 309 | Peto Odds Ratio (Peto, Fixed, 95% CI) | 3.86 [2.26, 6.59] |
| 1.5 Intravenous desmoteplase versus control | 1 | 186 | Peto Odds Ratio (Peto, Fixed, 95% CI) | 4.73 [0.85, 26.26] |
| 2 Fatal intracranial haemorrhage within 7 to 10 days Show forest plot | 17 | 9066 | Peto Odds Ratio (Peto, Fixed, 95% CI) | 4.53 [3.47, 5.91] |
| 2.1 Intravenous urokinase versus control | 2 | 751 | Peto Odds Ratio (Peto, Fixed, 95% CI) | 4.43 [1.08, 18.18] |
| 2.2 Intravenous streptokinase versus control | 4 | 983 | Peto Odds Ratio (Peto, Fixed, 95% CI) | 6.03 [3.47, 10.47] |
| 2.3 Intravenous rt‐PA versus control | 8 | 6683 | Peto Odds Ratio (Peto, Fixed, 95% CI) | 4.18 [2.99, 5.84] |
| 2.4 Intravenous streptokinase plus oral aspirin versus oral aspirin | 1 | 309 | Peto Odds Ratio (Peto, Fixed, 95% CI) | 4.56 [1.62, 12.84] |
| 2.5 Intra‐arterial pro‐urokinase plus intravenous heparin versus intravenous heparin | 1 | 40 | Peto Odds Ratio (Peto, Fixed, 95% CI) | 0.51 [0.03, 9.65] |
| 2.6 Intra‐arterial urokinase versus control | 1 | 114 | Peto Odds Ratio (Peto, Fixed, 95% CI) | 7.39 [0.15, 372.38] |
| 2.7 Intravenous desmoteplase versus control | 1 | 186 | Peto Odds Ratio (Peto, Fixed, 95% CI) | 4.65 [0.58, 37.52] |
| 3 Deaths within the first 7 to 10 days from causes other than fatal intracranial haemorrhage Show forest plot | 10 | 7226 | Peto Odds Ratio (Peto, Fixed, 95% CI) | 1.08 [0.90, 1.30] |
| 3.1 Intravenous urokinase versus control | 1 | 465 | Peto Odds Ratio (Peto, Fixed, 95% CI) | 0.87 [0.35, 2.13] |
| 3.2 Intravenous streptokinase versus control | 3 | 963 | Peto Odds Ratio (Peto, Fixed, 95% CI) | 1.05 [0.72, 1.53] |
| 3.3 Intravenous rt‐PA versus control | 5 | 5303 | Peto Odds Ratio (Peto, Fixed, 95% CI) | 0.93 [0.73, 1.18] |
| 3.4 Intravenous streptokinase plus oral aspirin versus oral aspirin | 1 | 309 | Peto Odds Ratio (Peto, Fixed, 95% CI) | 3.13 [1.74, 5.62] |
| 3.5 Intravenous desmoteplase versus control | 1 | 186 | Peto Odds Ratio (Peto, Fixed, 95% CI) | 4.57 [0.24, 86.20] |
| 4 Symptomatic (including fatal) intracranial haemorrhage within 7 to 10 days Show forest plot | 27 | 10186 | Peto Odds Ratio (Peto, Fixed, 95% CI) | 3.75 [3.11, 4.51] |
| 4.1 Intravenous urokinase versus control | 4 | 1208 | Peto Odds Ratio (Peto, Fixed, 95% CI) | 1.28 [0.47, 3.48] |
| 4.2 Intravenous streptokinase versus control | 4 | 983 | Peto Odds Ratio (Peto, Fixed, 95% CI) | 5.20 [3.25, 8.32] |
| 4.3 Intravenous rt‐PA versus control | 12 | 7011 | Peto Odds Ratio (Peto, Fixed, 95% CI) | 3.72 [2.98, 4.64] |
| 4.4 Intravenous streptokinase plus oral aspirin versus oral aspirin | 1 | 309 | Peto Odds Ratio (Peto, Fixed, 95% CI) | 4.02 [1.55, 10.40] |
| 4.5 Intra‐arterial pro‐urokinase plus intravenous heparin versus intravenous heparin | 2 | 220 | Peto Odds Ratio (Peto, Fixed, 95% CI) | 2.39 [0.88, 6.47] |
| 4.6 Intra‐arterial urokinase versus control | 2 | 130 | Peto Odds Ratio (Peto, Fixed, 95% CI) | 4.04 [0.79, 20.74] |
| 4.7 Intravenous desmoteplase versus control | 3 | 325 | Peto Odds Ratio (Peto, Fixed, 95% CI) | 4.50 [1.37, 14.81] |
| 5 Symptomatic (including fatal) cerebral oedema Show forest plot | 6 | 5961 | Peto Odds Ratio (Peto, Fixed, 95% CI) | 0.97 [0.79, 1.19] |
| 6 Death or dependency at the end of follow‐up Show forest plot | 22 | 9318 | Peto Odds Ratio (Peto, Fixed, 95% CI) | 0.85 [0.78, 0.93] |
| 6.1 Intravenous urokinase versus control | 1 | 465 | Peto Odds Ratio (Peto, Fixed, 95% CI) | 0.95 [0.64, 1.42] |
| 6.2 Intravenous streptokinase versus control | 4 | 983 | Peto Odds Ratio (Peto, Fixed, 95% CI) | 0.94 [0.72, 1.24] |
| 6.3 Intravenous rtA versus control | 10 | 6886 | Peto Odds Ratio (Peto, Fixed, 95% CI) | 0.84 [0.77, 0.93] |
| 6.4 Intravenous streptokinase plus oral aspirin versus oral aspirin | 1 | 309 | Peto Odds Ratio (Peto, Fixed, 95% CI) | 1.09 [0.69, 1.73] |
| 6.5 Intra‐arterial pro‐urokinase plus intravenous heparin versus intravenous heparin | 2 | 220 | Peto Odds Ratio (Peto, Fixed, 95% CI) | 0.55 [0.31, 1.00] |
| 6.6 Intra‐arterial urokinase versus control | 2 | 130 | Peto Odds Ratio (Peto, Fixed, 95% CI) | 0.57 [0.28, 1.14] |
| 6.7 Intravenous desmoteplase versus control | 3 | 325 | Peto Odds Ratio (Peto, Fixed, 95% CI) | 0.86 [0.53, 1.40] |
| 7 Deaths occurring between 7 and 10 days and the end of follow‐up Show forest plot | 13 | 7458 | Peto Odds Ratio (Peto, Fixed, 95% CI) | 0.88 [0.76, 1.02] |
| 7.1 Intravenous urokinase versus control | 1 | 465 | Peto Odds Ratio (Peto, Fixed, 95% CI) | 2.05 [0.60, 6.99] |
| 7.2 Intravenous streptokinase versus control | 3 | 963 | Peto Odds Ratio (Peto, Fixed, 95% CI) | 0.88 [0.61, 1.26] |
| 7.3 Intravenous rt‐PA versus control | 8 | 5535 | Peto Odds Ratio (Peto, Fixed, 95% CI) | 0.84 [0.71, 0.99] |
| 7.4 Intravenous streptokinase plus oral aspirin versus control | 1 | 309 | Peto Odds Ratio (Peto, Fixed, 95% CI) | 1.06 [0.49, 2.27] |
| 7.5 Intravenous desmoteplase versus control | 1 | 186 | Peto Odds Ratio (Peto, Fixed, 95% CI) | 4.95 [1.37, 17.86] |
| 8 Deaths from all causes during follow‐up Show forest plot | 27 | 10187 | Peto Odds Ratio (Peto, Fixed, 95% CI) | 1.18 [1.06, 1.30] |
| 8.1 Intravenous urokinase versus control | 4 | 1208 | Peto Odds Ratio (Peto, Fixed, 95% CI) | 1.15 [0.68, 1.97] |
| 8.2 Intravenous streptokinase versus control | 4 | 983 | Peto Odds Ratio (Peto, Fixed, 95% CI) | 1.43 [1.10, 1.88] |
| 8.3 Intravenous rt‐PA versus control | 12 | 7012 | Peto Odds Ratio (Peto, Fixed, 95% CI) | 1.06 [0.94, 1.20] |
| 8.4 Intravenous streptokinase plus oral aspirin versus oral aspirin | 1 | 309 | Peto Odds Ratio (Peto, Fixed, 95% CI) | 3.02 [1.87, 4.87] |
| 8.5 Intra‐arterial pro‐urokinase plus intravenous heparin versus intravenous heparin | 2 | 220 | Peto Odds Ratio (Peto, Fixed, 95% CI) | 0.75 [0.40, 1.42] |
| 8.6 Intra‐arterial urokinase versus control | 2 | 130 | Peto Odds Ratio (Peto, Fixed, 95% CI) | 1.25 [0.34, 4.57] |
| 8.7 Intravenous desmoteplase versus control | 3 | 325 | Peto Odds Ratio (Peto, Fixed, 95% CI) | 2.17 [0.97, 4.84] |
| 9 Death or dependency defined as mRS 2 to 6 Show forest plot | 21 | 8824 | Peto Odds Ratio (Peto, Fixed, 95% CI) | 0.76 [0.70, 0.84] |
| 9.1 Intravenous urokinase versus control | 1 | 465 | Peto Odds Ratio (Peto, Fixed, 95% CI) | 0.57 [0.38, 0.85] |
| 9.2 Intravenous streptokinase versus control | 4 | 983 | Peto Odds Ratio (Peto, Fixed, 95% CI) | 0.82 [0.61, 1.10] |
| 9.3 Intravenous rt‐PA versus control | 10 | 6887 | Peto Odds Ratio (Peto, Fixed, 95% CI) | 0.79 [0.71, 0.88] |
| 9.4 Intravenous desmoteplase versus control | 2 | 139 | Peto Odds Ratio (Peto, Fixed, 95% CI) | 0.64 [0.28, 1.43] |
| 9.5 Intra‐arterial pro‐urokinase versus control | 2 | 220 | Peto Odds Ratio (Peto, Fixed, 95% CI) | 0.62 [0.32, 1.19] |
| 9.6 Intra‐arterial urokinase versus control | 2 | 130 | Peto Odds Ratio (Peto, Fixed, 95% CI) | 0.37 [0.17, 0.77] |
| 10 Death or dependency defined as mRS 3 to 6 Show forest plot | 21 | 8824 | Peto Odds Ratio (Peto, Fixed, 95% CI) | 0.85 [0.78, 0.93] |
| 10.1 Intravenous urokinase versus control | 1 | 465 | Peto Odds Ratio (Peto, Fixed, 95% CI) | 0.99 [0.67, 1.47] |
| 10.2 Intravenous streptokinase versus control | 4 | 983 | Peto Odds Ratio (Peto, Fixed, 95% CI) | 0.94 [0.72, 1.24] |
| 10.3 Intravenous rt‐PA versus control | 10 | 6887 | Peto Odds Ratio (Peto, Fixed, 95% CI) | 0.85 [0.77, 0.94] |
| 10.4 Intravenous desmoteplase versus control | 2 | 139 | Peto Odds Ratio (Peto, Fixed, 95% CI) | 0.49 [0.22, 1.08] |
| 10.5 Intra‐arterial pro‐urokinase versus control | 2 | 220 | Peto Odds Ratio (Peto, Fixed, 95% CI) | 0.55 [0.31, 1.00] |
| 10.6 Intra‐arterial urokinase versus control | 2 | 130 | Peto Odds Ratio (Peto, Fixed, 95% CI) | 0.57 [0.28, 1.14] |
| 11 Dependency at the end of follow‐up defined as mRS 3 to 5 Show forest plot | 22 | 9318 | Peto Odds Ratio (Peto, Fixed, 95% CI) | 0.75 [0.69, 0.82] |
| 11.1 Intravenous urokinase versus control | 1 | 465 | Peto Odds Ratio (Peto, Fixed, 95% CI) | 0.80 [0.53, 1.22] |
| 11.2 Intravenous streptokinase versus control | 4 | 983 | Peto Odds Ratio (Peto, Fixed, 95% CI) | 0.64 [0.49, 0.85] |
| 11.3 Intravenous rt‐PA versus control | 10 | 6886 | Peto Odds Ratio (Peto, Fixed, 95% CI) | 0.80 [0.73, 0.89] |
| 11.4 Intravenous streptokinase plus oral aspirin versus oral aspirin | 1 | 309 | Peto Odds Ratio (Peto, Fixed, 95% CI) | 0.36 [0.22, 0.58] |
| 11.5 Intra‐arterial pro‐urokinase plus intravenous heparin versus intravenous heparin | 2 | 220 | Peto Odds Ratio (Peto, Fixed, 95% CI) | 0.72 [0.41, 1.28] |
| 11.6 Intra‐arterial urokinase versus control | 2 | 130 | Peto Odds Ratio (Peto, Fixed, 95% CI) | 0.53 [0.26, 1.06] |
| 11.7 Intravenous desmoteplase versus control | 3 | 325 | Peto Odds Ratio (Peto, Fixed, 95% CI) | 0.66 [0.41, 1.06] |
| 12 Alive and independent (mRS 0 to 2) at end of follow‐up, participants treated up to six hours Show forest plot | 10 | 6887 | Peto Odds Ratio (Peto, Fixed, 95% CI) | 1.17 [1.06, 1.29] |
| 13 Alive and favourable outcome (mRS 0 to 1) at end of follow‐up, participants treated up to six hours Show forest plot | 10 | 6887 | Peto Odds Ratio (Peto, Fixed, 95% CI) | 1.29 [1.16, 1.43] |
| 14 Deaths from all causes ordered by antithrombotic drug use Show forest plot | 24 | 9674 | Peto Odds Ratio (Peto, Fixed, 95% CI) | 1.20 [1.08, 1.33] |
| 14.1 All participants received antithrombotic drugs < 24 hours | 6 | 2191 | Peto Odds Ratio (Peto, Fixed, 95% CI) | 1.31 [1.09, 1.58] |
| 14.2 Some participants received antithrombotic drugs < 24 hours | 4 | 1757 | Peto Odds Ratio (Peto, Fixed, 95% CI) | 1.27 [0.99, 1.63] |
| 14.3 Some participants received antithrombotics but not < 24 hours | 12 | 4670 | Peto Odds Ratio (Peto, Fixed, 95% CI) | 1.13 [0.96, 1.34] |
| 14.4 No participants received antithrombotic drugs < 10 days | 4 | 1056 | Peto Odds Ratio (Peto, Fixed, 95% CI) | 0.89 [0.58, 1.37] |
| 15 Deaths from all causes ordered by stroke severity Show forest plot | 27 | 9878 | Peto Odds Ratio (Peto, Fixed, 95% CI) | 1.12 [1.01, 1.25] |
| 15.1 Case fatality 0% ‐ 19% in the control group | 17 | 4973 | Peto Odds Ratio (Peto, Fixed, 95% CI) | 1.31 [1.08, 1.58] |
| 15.2 Case fatality 20% or greater in the control group | 10 | 4905 | Peto Odds Ratio (Peto, Fixed, 95% CI) | 1.05 [0.92, 1.19] |
| 16 Death or dependency at the end of follow‐up: participants randomised within 3 hours of stroke Show forest plot | 10 | 2160 | Peto Odds Ratio (Peto, Fixed, 95% CI) | 0.66 [0.56, 0.79] |
| 16.1 Intravenous urokinase versus control | 1 | 82 | Peto Odds Ratio (Peto, Fixed, 95% CI) | 0.79 [0.31, 2.00] |
| 16.2 Intravenous streptokinase versus control | 3 | 209 | Peto Odds Ratio (Peto, Fixed, 95% CI) | 0.62 [0.35, 1.09] |
| 16.3 Intravenous rt‐PA versus control | 6 | 1779 | Peto Odds Ratio (Peto, Fixed, 95% CI) | 0.65 [0.54, 0.80] |
| 16.4 Intravenous streptokinase plus oral aspirin versus oral aspirin | 1 | 90 | Peto Odds Ratio (Peto, Fixed, 95% CI) | 0.93 [0.40, 2.18] |
| 17 Death or dependency by time to treatment up to 6 hours: all agents: only trials randomising in both 0 to 3 and 3 to 6 hour time windows Show forest plot | 9 | 6941 | Peto Odds Ratio (Peto, Fixed, 95% CI) | 0.92 [0.83, 1.01] |
| 17.1 Treatment within 3 hours | 9 | 1536 | Peto Odds Ratio (Peto, Fixed, 95% CI) | 0.69 [0.55, 0.85] |
| 17.2 Treatment between 3 and 6 hours | 9 | 5405 | Peto Odds Ratio (Peto, Fixed, 95% CI) | 0.99 [0.88, 1.10] |
| 18 Death or dependency by time to treatment up to 6 hours: rt‐PA: only trials randomising in 0 ‐ 3 and 3 ‐ 6 hour windows Show forest plot | 5 | 5204 | Peto Odds Ratio (Peto, Fixed, 95% CI) | 0.90 [0.80, 1.01] |
| 18.1 Treatment within 3 hours | 5 | 1155 | Peto Odds Ratio (Peto, Fixed, 95% CI) | 0.68 [0.53, 0.87] |
| 18.2 Treatment between 3 to 6 hours | 5 | 4049 | Peto Odds Ratio (Peto, Fixed, 95% CI) | 0.97 [0.85, 1.09] |
| 19 Death or dependency by time to treatment up to 6 hours: rt‐PA: all trials regardless of time window Show forest plot | 8 | 6729 | Peto Odds Ratio (Peto, Fixed, 95% CI) | 0.85 [0.77, 0.94] |
| 19.1 Treatment within 3 hours | 6 | 1779 | Peto Odds Ratio (Peto, Fixed, 95% CI) | 0.65 [0.54, 0.80] |
| 19.2 Treatment between 3 and 6 hours | 7 | 4950 | Peto Odds Ratio (Peto, Fixed, 95% CI) | 0.93 [0.83, 1.04] |
| 20 Death or dependency by latest time to randomisation Show forest plot | 22 | 9009 | Odds Ratio (M‐H, Random, 95% CI) | 0.81 [0.71, 0.92] |
| 20.1 3 hours | 1 | 624 | Odds Ratio (M‐H, Random, 95% CI) | 0.62 [0.45, 0.85] |
| 20.2 4.5 hours | 2 | 1161 | Odds Ratio (M‐H, Random, 95% CI) | 0.93 [0.66, 1.32] |
| 20.3 6 hours | 15 | 6883 | Odds Ratio (M‐H, Random, 95% CI) | 0.81 [0.69, 0.95] |
| 20.4 9 hours | 3 | 325 | Odds Ratio (M‐H, Random, 95% CI) | 0.74 [0.35, 1.59] |
| 20.5 24 hours | 1 | 16 | Odds Ratio (M‐H, Random, 95% CI) | 0.14 [0.01, 1.76] |
| 21 Alive and independent (mRS 0 to 2) at end of follow‐up, participants treated < 3 versus 3 to 6 hours, all trials regardless of latest time window Show forest plot | 8 | 6750 | Peto Odds Ratio (Peto, Fixed, 95% CI) | 1.17 [1.06, 1.29] |
| 21.1 Participants treated within three hours | 6 | 1779 | Peto Odds Ratio (Peto, Fixed, 95% CI) | 1.53 [1.26, 1.86] |
| 21.2 Participants treated 3 ‐ 6 hours | 7 | 4971 | Peto Odds Ratio (Peto, Fixed, 95% CI) | 1.07 [0.96, 1.20] |
| 22 Alive and favourable outcome (mRS 0 to 1) at end of follow‐up, < 3 versus 3 ‐ 6 hours, only trials randomising in both time windows Show forest plot | 6 | 1779 | Peto Odds Ratio (Peto, Fixed, 95% CI) | 1.61 [1.30, 1.99] |
| 22.1 Participants treated < 3 hours | 6 | 1779 | Peto Odds Ratio (Peto, Fixed, 95% CI) | 1.61 [1.30, 1.99] |
| 22.2 Participants treated 3 ‐ 6 hours | 0 | 0 | Peto Odds Ratio (Peto, Fixed, 95% CI) | 0.0 [0.0, 0.0] |
| 23 Deaths from all causes during follow‐up: participants randomised within 3 hours of stroke Show forest plot | 11 | 2187 | Peto Odds Ratio (Peto, Fixed, 95% CI) | 0.99 [0.82, 1.21] |
| 23.1 Intravenous streptokinase versus control | 3 | 209 | Peto Odds Ratio (Peto, Fixed, 95% CI) | 1.18 [0.66, 2.14] |
| 23.2 Intravenous tPA versus control | 7 | 1806 | Peto Odds Ratio (Peto, Fixed, 95% CI) | 0.91 [0.73, 1.13] |
| 23.3 Intravenous streptokinase plus oral aspirin versus oral aspirin | 1 | 90 | Peto Odds Ratio (Peto, Fixed, 95% CI) | 3.37 [1.37, 8.26] |
| 23.4 Intravenous urokinase versus control | 1 | 82 | Peto Odds Ratio (Peto, Fixed, 95% CI) | 0.70 [0.14, 3.51] |
| 24 Deaths by time to treatment up to 6 hours: all agents: only trials randomising in both 0 ‐ 3 and 3 ‐ 6 hour time windows Show forest plot | 9 | 6936 | Peto Odds Ratio (Peto, Fixed, 95% CI) | 1.23 [1.10, 1.38] |
| 24.1 Treatment within 3 hours | 9 | 1536 | Peto Odds Ratio (Peto, Fixed, 95% CI) | 1.08 [0.86, 1.35] |
| 24.2 Treatment between 3 and 6 hours | 9 | 5400 | Peto Odds Ratio (Peto, Fixed, 95% CI) | 1.29 [1.13, 1.48] |
| 25 Deaths by time to treatment up to 6 hours: rt‐PA: only trials randomising in both 0 to 3 and 3 to 6 hour time windows Show forest plot | 5 | 5199 | Peto Odds Ratio (Peto, Fixed, 95% CI) | 1.11 [0.97, 1.28] |
| 25.1 Treatment within 3 hours | 5 | 1155 | Peto Odds Ratio (Peto, Fixed, 95% CI) | 0.97 [0.75, 1.26] |
| 25.2 Treatment between 3 and 6 hours | 5 | 4044 | Peto Odds Ratio (Peto, Fixed, 95% CI) | 1.17 [1.00, 1.38] |
| 26 Deaths by time to treatment up to 6 hours: rt‐PA: all trials regardless of time window Show forest plot | 9 | 6772 | Peto Odds Ratio (Peto, Fixed, 95% CI) | 1.07 [0.95, 1.21] |
| 26.1 Treatment within 3 hours | 7 | 1806 | Peto Odds Ratio (Peto, Fixed, 95% CI) | 0.91 [0.73, 1.13] |
| 26.2 Treatment between 3 and 6 hours | 7 | 4966 | Peto Odds Ratio (Peto, Fixed, 95% CI) | 1.16 [1.00, 1.35] |
| 27 Death by latest time to treatment Show forest plot | 24 | 9039 | Odds Ratio (Peto, Fixed, 95% CI) | 1.12 [1.01, 1.25] |
| 27.1 3 hours | 2 | 651 | Odds Ratio (Peto, Fixed, 95% CI) | 0.79 [0.53, 1.17] |
| 27.2 4.5 hours | 2 | 1161 | Odds Ratio (Peto, Fixed, 95% CI) | 1.43 [1.01, 2.03] |
| 27.3 6 hours | 16 | 6886 | Odds Ratio (Peto, Fixed, 95% CI) | 1.12 [0.99, 1.26] |
| 27.4 9 hours | 3 | 325 | Odds Ratio (Peto, Fixed, 95% CI) | 2.10 [0.79, 5.58] |
| 27.5 24 hours | 1 | 16 | Odds Ratio (Peto, Fixed, 95% CI) | 1.0 [0.14, 7.10] |
| 28 Symptomatic intracranial haemorrhage by time to treatment up to 6 hours: rt‐PA: only trials randomising in both 0 ‐ 3 and 3 ‐ 6 hour time windows. Show forest plot | 5 | 5168 | Peto Odds Ratio (Peto, Fixed, 95% CI) | 3.75 [2.94, 4.78] |
| 28.1 Intravenous rt‐PA versus control: participants treated within 3 hours of stroke | 5 | 1155 | Peto Odds Ratio (Peto, Fixed, 95% CI) | 4.25 [2.53, 7.16] |
| 28.2 Intravenous rt‐PA versus control: participants treated between 3 and 6 hours after stroke | 5 | 4013 | Peto Odds Ratio (Peto, Fixed, 95% CI) | 3.62 [2.76, 4.76] |
| 29 Symptomatic intracranial haemorrhage by time to treatment up to 6 hours: rt‐PA: all trials regardless of time window Show forest plot | 8 | 6714 | Peto Odds Ratio (Peto, Fixed, 95% CI) | 3.93 [3.13, 4.93] |
| 29.1 Intravenous rt‐PA versus control: participants treated within 3 hours of stroke | 6 | 1779 | Peto Odds Ratio (Peto, Fixed, 95% CI) | 4.55 [2.92, 7.09] |
| 29.2 Intravenous rt‐PA versus control: participants treated between 3 and 6 hours after stroke | 7 | 4935 | Peto Odds Ratio (Peto, Fixed, 95% CI) | 3.73 [2.86, 4.86] |
| 30 Symptomatic intracranial haemorrhage by latest time to treatment Show forest plot | 23 | 9104 | Odds Ratio (Peto, Fixed, 95% CI) | 4.41 [3.43, 5.69] |
| 30.1 3 hours | 2 | 651 | Odds Ratio (Peto, Fixed, 95% CI) | 5.85 [1.54, 22.26] |
| 30.2 4.5 hours | 2 | 1161 | Odds Ratio (Peto, Fixed, 95% CI) | 6.56 [2.51, 17.18] |
| 30.3 6 hours | 15 | 6951 | Odds Ratio (Peto, Fixed, 95% CI) | 4.20 [3.21, 5.50] |
| 30.4 9 hours | 3 | 325 | Odds Ratio (Peto, Fixed, 95% CI) | 6.82 [0.88, 52.78] |
| 30.5 24 hours | 1 | 16 | Odds Ratio (Peto, Fixed, 95% CI) | 0.0 [0.0, 0.0] |
| 31 Death or dependency (mRS 3 to 6) by the end of follow‐up; participants treated up to 6 hours aged ≤ 80 years versus > 80 years Show forest plot | 10 | 6871 | Peto Odds Ratio (Peto, Fixed, 95% CI) | 0.84 [0.76, 0.93] |
| 31.1 Participants aged ≤ 80 years | 10 | 5175 | Peto Odds Ratio (Peto, Fixed, 95% CI) | 0.85 [0.76, 0.95] |
| 31.2 Participants aged > 80 years | 3 | 1696 | Peto Odds Ratio (Peto, Fixed, 95% CI) | 0.80 [0.64, 0.99] |
| 32 Death or dependency (mRS 3 to 6) by the end of follow‐up, participants treated within 3 hours aged ≤ 80 years versus > 80 years Show forest plot | 6 | 1765 | Peto Odds Ratio (Peto, Fixed, 95% CI) | 0.62 [0.51, 0.76] |
| 32.1 Participants aged ≤ 80 years | 6 | 1039 | Peto Odds Ratio (Peto, Fixed, 95% CI) | 0.66 [0.52, 0.85] |
| 32.2 Participants aged > 80 years | 2 | 726 | Peto Odds Ratio (Peto, Fixed, 95% CI) | 0.56 [0.40, 0.78] |
| 33 Alive and independent (mRS 0 to 2) at end of follow‐up, participants treated up to 6 hours aged ≤ 80 years versus > 80 years Show forest plot | 10 | 6885 | Peto Odds Ratio (Peto, Fixed, 95% CI) | 1.18 [1.07, 1.31] |
| 33.1 Participants aged ≤ 80 years | 10 | 5174 | Peto Odds Ratio (Peto, Fixed, 95% CI) | 1.17 [1.05, 1.31] |
| 33.2 Participants aged > 80 years or over | 3 | 1711 | Peto Odds Ratio (Peto, Fixed, 95% CI) | 1.22 [0.98, 1.52] |
| 34 Alive and independent (mRS 0 to 2) at end of folllow‐up, participants treated within 3 hours, aged ≤ 80 years versus > 80 years Show forest plot | 6 | 1779 | Peto Odds Ratio (Peto, Fixed, 95% CI) | 1.56 [1.28, 1.90] |
| 34.1 Participants aged ≤ 80 years versus | 6 | 1038 | Peto Odds Ratio (Peto, Fixed, 95% CI) | 1.50 [1.18, 1.92] |
| 34.2 Participants aged > 80 years and over | 2 | 741 | Peto Odds Ratio (Peto, Fixed, 95% CI) | 1.68 [1.20, 2.34] |
| 35 Alive and independent (mRS 0 to 2) at end of follow‐up, participants treated 3 ‐ 6 hours, aged ≤ 80 years versus > 80 years Show forest plot | 7 | 4971 | Peto Odds Ratio (Peto, Fixed, 95% CI) | 1.07 [0.96, 1.21] |
| 35.1 Participants aged ≤ 80 years | 7 | 4001 | Peto Odds Ratio (Peto, Fixed, 95% CI) | 1.09 [0.96, 1.24] |
| 35.2 Participants aged > 80 years | 2 | 970 | Peto Odds Ratio (Peto, Fixed, 95% CI) | 0.97 [0.73, 1.30] |
| 36 Death: selection by MR DWI/PWI or CT Show forest plot | 19 | 8760 | Odds Ratio (Peto, Fixed, 95% CI) | 1.14 [1.02, 1.27] |
| 36.1 Plain CT | 15 | 8334 | Odds Ratio (Peto, Fixed, 95% CI) | 1.12 [1.00, 1.25] |
| 36.2 MR DWI/PWI | 4 | 426 | Odds Ratio (Peto, Fixed, 95% CI) | 2.05 [1.02, 4.15] |
| 37 Death or dependency: selection with MR DWI/PWI versus plain CT Show forest plot | 15 | 8268 | Odds Ratio (Peto, Fixed, 95% CI) | 0.81 [0.74, 0.89] |
| 37.1 Selection with plain CT | 11 | 7843 | Odds Ratio (Peto, Fixed, 95% CI) | 0.81 [0.73, 0.89] |
| 37.2 Selection with MR DWI/PWI | 4 | 425 | Odds Ratio (Peto, Fixed, 95% CI) | 0.88 [0.58, 1.35] |
| 38 Symptomatic intracranial haemorrhage: selection with MR DWI/PWI or CT Show forest plot | 20 | 8784 | Odds Ratio (Peto, Fixed, 95% CI) | 4.44 [3.43, 5.75] |
| 38.1 Plain CT | 16 | 8358 | Odds Ratio (Peto, Fixed, 95% CI) | 4.38 [3.38, 5.69] |
| 38.2 MR DWI/PWI | 4 | 426 | Odds Ratio (Peto, Fixed, 95% CI) | 7.51 [1.40, 40.35] |
| 39 Alive and independent (mRS 0 to 1) at end of follow‐up, by plain CT ASPECTS score Show forest plot | 4 | 4567 | Peto Odds Ratio (Peto, Fixed, 95% CI) | 1.21 [1.07, 1.37] |
| 39.1 ASPECTS score 8 ‐ 10 | 4 | 3317 | Peto Odds Ratio (Peto, Fixed, 95% CI) | 1.21 [1.06, 1.39] |
| 39.2 ASPECTS score 0 ‐ 7 | 4 | 1250 | Peto Odds Ratio (Peto, Fixed, 95% CI) | 1.20 [0.91, 1.58] |
| 40 Death or dependency at the end of follow‐up: intra‐arterial thrombolysis versus control Show forest plot | 4 | 350 | Odds Ratio (Peto, Fixed, 95% CI) | 0.49 [0.31, 0.79] |
| 40.1 Intra‐arterial urokinase versus control | 2 | 130 | Odds Ratio (Peto, Fixed, 95% CI) | 0.44 [0.22, 0.91] |
| 40.2 Intra‐arterial pro‐urokinase versus control | 2 | 220 | Odds Ratio (Peto, Fixed, 95% CI) | 0.53 [0.28, 1.00] |