| 1 Deaths from all causes within 7 to 10 days Show forest plot | 12 | 4423 | Peto Odds Ratio (Peto, Fixed, 95% CI) | 1.76 [1.44, 2.16] |
|
| 1.1 Intravenous urokinase versus control | 1 | 465 | Peto Odds Ratio (Peto, Fixed, 95% CI) | 1.35 [0.62, 2.94] |
| 1.2 Intravenous streptokinase versus control | 3 | 963 | Peto Odds Ratio (Peto, Fixed, 95% CI) | 1.90 [1.37, 2.63] |
| 1.3 Intravenous tPA versus control | 7 | 2500 | Peto Odds Ratio (Peto, Fixed, 95% CI) | 1.23 [0.88, 1.71] |
| 1.4 Intravenous streptokinase plus oral aspirin versus oral aspirin | 1 | 309 | Peto Odds Ratio (Peto, Fixed, 95% CI) | 3.86 [2.26, 6.59] |
| 1.5 Intravenous desmoteplase versus control | 1 | 186 | Peto Odds Ratio (Peto, Fixed, 95% CI) | 4.73 [0.85, 26.26] |
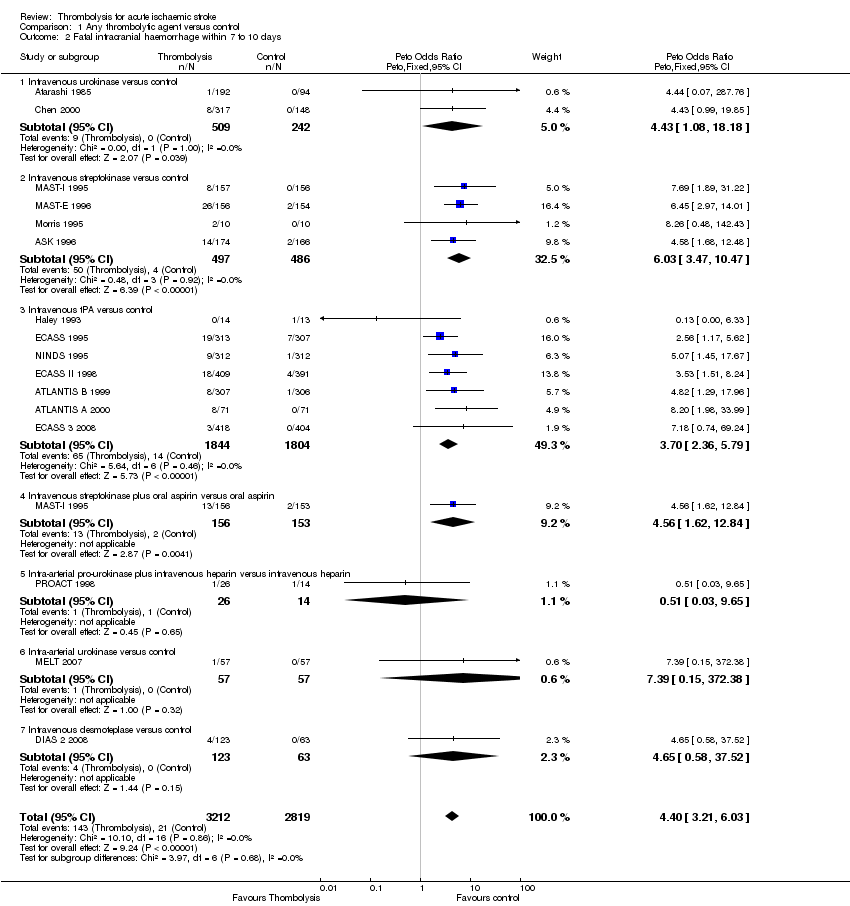
| 2 Fatal intracranial haemorrhage within 7 to 10 days Show forest plot | 16 | 6031 | Peto Odds Ratio (Peto, Fixed, 95% CI) | 4.40 [3.21, 6.03] |
|
| 2.1 Intravenous urokinase versus control | 2 | 751 | Peto Odds Ratio (Peto, Fixed, 95% CI) | 4.43 [1.08, 18.18] |
| 2.2 Intravenous streptokinase versus control | 4 | 983 | Peto Odds Ratio (Peto, Fixed, 95% CI) | 6.03 [3.47, 10.47] |
| 2.3 Intravenous tPA versus control | 7 | 3648 | Peto Odds Ratio (Peto, Fixed, 95% CI) | 3.70 [2.36, 5.79] |
| 2.4 Intravenous streptokinase plus oral aspirin versus oral aspirin | 1 | 309 | Peto Odds Ratio (Peto, Fixed, 95% CI) | 4.56 [1.62, 12.84] |
| 2.5 Intra‐arterial pro‐urokinase plus intravenous heparin versus intravenous heparin | 1 | 40 | Peto Odds Ratio (Peto, Fixed, 95% CI) | 0.51 [0.03, 9.65] |
| 2.6 Intra‐arterial urokinase versus control | 1 | 114 | Peto Odds Ratio (Peto, Fixed, 95% CI) | 7.39 [0.15, 372.38] |
| 2.7 Intravenous desmoteplase versus control | 1 | 186 | Peto Odds Ratio (Peto, Fixed, 95% CI) | 4.65 [0.58, 37.52] |
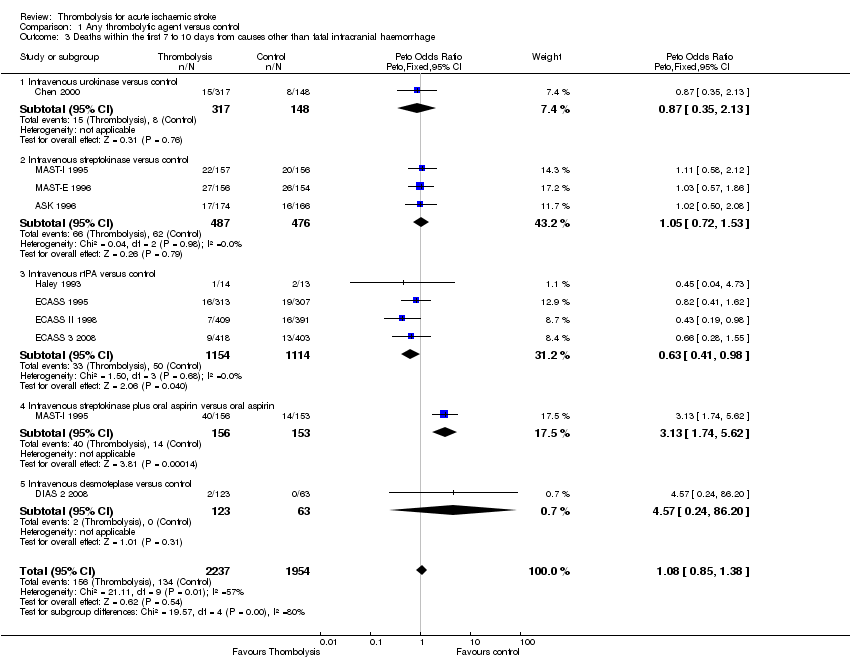
| 3 Deaths within the first 7 to 10 days from causes other than fatal intracranial haemorrhage Show forest plot | 9 | 4191 | Peto Odds Ratio (Peto, Fixed, 95% CI) | 1.08 [0.85, 1.38] |
|
| 3.1 Intravenous urokinase versus control | 1 | 465 | Peto Odds Ratio (Peto, Fixed, 95% CI) | 0.87 [0.35, 2.13] |
| 3.2 Intravenous streptokinase versus control | 3 | 963 | Peto Odds Ratio (Peto, Fixed, 95% CI) | 1.05 [0.72, 1.53] |
| 3.3 Intravenous rtPA versus control | 4 | 2268 | Peto Odds Ratio (Peto, Fixed, 95% CI) | 0.63 [0.41, 0.98] |
| 3.4 Intravenous streptokinase plus oral aspirin versus oral aspirin | 1 | 309 | Peto Odds Ratio (Peto, Fixed, 95% CI) | 3.13 [1.74, 5.62] |
| 3.5 Intravenous desmoteplase versus control | 1 | 186 | Peto Odds Ratio (Peto, Fixed, 95% CI) | 4.57 [0.24, 86.20] |
| 4 Symptomatic (including fatal) intracranial haemorrhage within 7 to 10 days Show forest plot | 26 | 7152 | Peto Odds Ratio (Peto, Fixed, 95% CI) | 3.49 [2.81, 4.33] |
|
| 4.1 Intravenous urokinase versus control | 4 | 1208 | Peto Odds Ratio (Peto, Fixed, 95% CI) | 1.28 [0.47, 3.48] |
| 4.2 Intravenous streptokinase versus control | 4 | 983 | Peto Odds Ratio (Peto, Fixed, 95% CI) | 5.20 [3.25, 8.32] |
| 4.3 Intravenous tPA versus control | 11 | 3977 | Peto Odds Ratio (Peto, Fixed, 95% CI) | 3.28 [2.48, 4.33] |
| 4.4 Intravenous streptokinase plus oral aspirin versus oral aspirin | 1 | 309 | Peto Odds Ratio (Peto, Fixed, 95% CI) | 4.02 [1.55, 10.40] |
| 4.5 Intra‐arterial pro‐urokinase plus intravenous heparin versus intravenous heparin | 2 | 220 | Peto Odds Ratio (Peto, Fixed, 95% CI) | 2.39 [0.88, 6.47] |
| 4.6 Intra‐arterial urokinase versus control | 2 | 130 | Peto Odds Ratio (Peto, Fixed, 95% CI) | 4.04 [0.79, 20.74] |
| 4.7 Intravenous desmoteplase versus control | 3 | 325 | Peto Odds Ratio (Peto, Fixed, 95% CI) | 4.50 [1.37, 14.81] |
| 5 Symptomatic (including fatal) cerebral oedema Show forest plot | 6 | 3040 | Odds Ratio (Peto, Fixed, 95% CI) | 0.79 [0.62, 1.01] |
|
| 6 Deaths from all causes during follow up Show forest plot | 26 | 7152 | Peto Odds Ratio (Peto, Fixed, 95% CI) | 1.31 [1.14, 1.50] |
|
| 6.1 Intravenous urokinase versus control | 4 | 1208 | Peto Odds Ratio (Peto, Fixed, 95% CI) | 1.15 [0.68, 1.97] |
| 6.2 Intravenous streptokinase versus control | 4 | 983 | Peto Odds Ratio (Peto, Fixed, 95% CI) | 1.43 [1.10, 1.88] |
| 6.3 Intravenous tPA versus control | 11 | 3977 | Peto Odds Ratio (Peto, Fixed, 95% CI) | 1.14 [0.95, 1.38] |
| 6.4 Intravenous streptokinase plus oral aspirin versus oral aspirin | 1 | 309 | Peto Odds Ratio (Peto, Fixed, 95% CI) | 3.02 [1.87, 4.87] |
| 6.5 Intra‐arterial pro‐urokinase plus intravenous heparin versus intravenous heparin | 2 | 220 | Peto Odds Ratio (Peto, Fixed, 95% CI) | 0.75 [0.40, 1.42] |
| 6.6 Intra‐arterial urokinase versus control | 2 | 130 | Peto Odds Ratio (Peto, Fixed, 95% CI) | 1.25 [0.34, 4.57] |
| 6.7 Intravenous desmoteplase versus control | 3 | 325 | Peto Odds Ratio (Peto, Fixed, 95% CI) | 2.17 [0.97, 4.84] |
| 7 Deaths occurring between 7 and 10 days and the end of follow up Show forest plot | 12 | 4423 | Peto Odds Ratio (Peto, Fixed, 95% CI) | 1.05 [0.84, 1.31] |
|
| 7.1 Intravenous urokinase versus control | 1 | 465 | Peto Odds Ratio (Peto, Fixed, 95% CI) | 2.05 [0.60, 6.99] |
| 7.2 Intravenous streptokinase versus control | 3 | 963 | Peto Odds Ratio (Peto, Fixed, 95% CI) | 0.88 [0.61, 1.26] |
| 7.3 Intravenous rt‐PA versus control | 7 | 2500 | Peto Odds Ratio (Peto, Fixed, 95% CI) | 1.04 [0.75, 1.45] |
| 7.4 Intravenous streptokinase plus oral aspirin versus control | 1 | 309 | Peto Odds Ratio (Peto, Fixed, 95% CI) | 1.06 [0.49, 2.27] |
| 7.5 Intravenous desmoteplase versus control | 1 | 186 | Peto Odds Ratio (Peto, Fixed, 95% CI) | 4.95 [1.37, 17.86] |
| 8 Death or dependency at the end of follow up Show forest plot | 21 | 6283 | Peto Odds Ratio (Peto, Fixed, 95% CI) | 0.81 [0.73, 0.90] |
|
| 8.1 Intravenous urokinase versus control | 1 | 465 | Peto Odds Ratio (Peto, Fixed, 95% CI) | 0.95 [0.64, 1.42] |
| 8.2 Intravenous streptokinase versus control | 4 | 983 | Peto Odds Ratio (Peto, Fixed, 95% CI) | 0.94 [0.72, 1.24] |
| 8.3 Intravenous tPA versus control | 9 | 3851 | Peto Odds Ratio (Peto, Fixed, 95% CI) | 0.78 [0.68, 0.88] |
| 8.4 Intravenous streptokinase plus oral aspirin versus oral aspirin | 1 | 309 | Peto Odds Ratio (Peto, Fixed, 95% CI) | 1.09 [0.69, 1.73] |
| 8.5 Intra‐arterial pro‐urokinase plus intravenous heparin versus intravenous heparin | 2 | 220 | Peto Odds Ratio (Peto, Fixed, 95% CI) | 0.55 [0.31, 1.00] |
| 8.6 Intra‐arterial urokinase versus control | 2 | 130 | Peto Odds Ratio (Peto, Fixed, 95% CI) | 0.57 [0.28, 1.14] |
| 8.7 Intravenous desmoteplase versus control | 3 | 325 | Peto Odds Ratio (Peto, Fixed, 95% CI) | 0.86 [0.53, 1.40] |
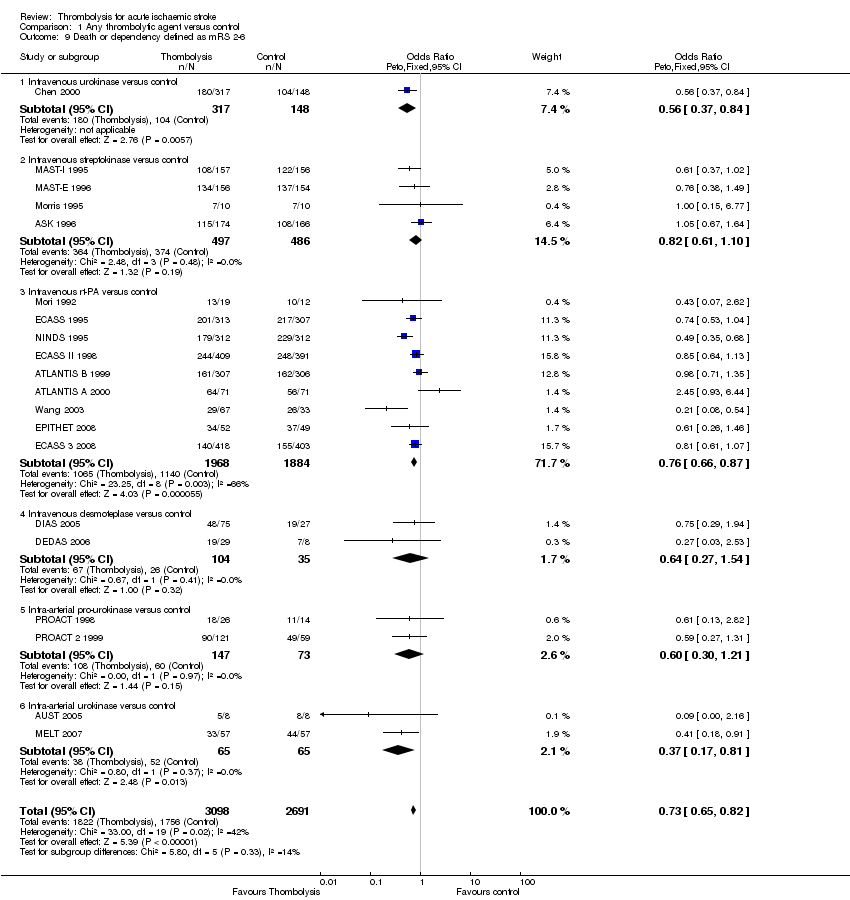
| 9 Death or dependency defined as mRS 2‐6 Show forest plot | 20 | 5789 | Odds Ratio (Peto, Fixed, 95% CI) | 0.73 [0.65, 0.82] |
|
| 9.1 Intravenous urokinase versus control | 1 | 465 | Odds Ratio (Peto, Fixed, 95% CI) | 0.56 [0.37, 0.84] |
| 9.2 Intravenous streptokinase versus control | 4 | 983 | Odds Ratio (Peto, Fixed, 95% CI) | 0.82 [0.61, 1.10] |
| 9.3 Intravenous rt‐PA versus control | 9 | 3852 | Odds Ratio (Peto, Fixed, 95% CI) | 0.76 [0.66, 0.87] |
| 9.4 Intravenous desmoteplase versus control | 2 | 139 | Odds Ratio (Peto, Fixed, 95% CI) | 0.64 [0.27, 1.54] |
| 9.5 Intra‐arterial pro‐urokinase versus control | 2 | 220 | Odds Ratio (Peto, Fixed, 95% CI) | 0.60 [0.30, 1.21] |
| 9.6 Intra‐arterial urokinase versus control | 2 | 130 | Odds Ratio (Peto, Fixed, 95% CI) | 0.37 [0.17, 0.81] |
| 10 Death or dependency defined as mRS 3‐6 Show forest plot | 20 | 5789 | Odds Ratio (Peto, Fixed, 95% CI) | 0.81 [0.72, 0.90] |
|
| 10.1 Intravenous urokinase versus control | 1 | 465 | Odds Ratio (Peto, Fixed, 95% CI) | 0.99 [0.67, 1.47] |
| 10.2 Intravenous streptokinase versus control | 4 | 983 | Odds Ratio (Peto, Fixed, 95% CI) | 0.94 [0.72, 1.24] |
| 10.3 Intravenous rt‐PA versus control | 9 | 3852 | Odds Ratio (Peto, Fixed, 95% CI) | 0.79 [0.69, 0.90] |
| 10.4 Intravenous desmoteplase versus control | 2 | 139 | Odds Ratio (Peto, Fixed, 95% CI) | 0.46 [0.20, 1.09] |
| 10.5 Intra‐arterial pro‐urokinase versus control | 2 | 220 | Odds Ratio (Peto, Fixed, 95% CI) | 0.53 [0.28, 1.00] |
| 10.6 Intra‐arterial urokinase versus control | 2 | 130 | Odds Ratio (Peto, Fixed, 95% CI) | 0.58 [0.28, 1.18] |
| 11 Dependency at the end of follow up defined as mRS 3‐5 Show forest plot | 21 | 6283 | Peto Odds Ratio (Peto, Fixed, 95% CI) | 0.67 [0.61, 0.75] |
|
| 11.1 Intravenous urokinase versus control | 1 | 465 | Peto Odds Ratio (Peto, Fixed, 95% CI) | 0.80 [0.53, 1.22] |
| 11.2 Intravenous streptokinase versus control | 4 | 983 | Peto Odds Ratio (Peto, Fixed, 95% CI) | 0.64 [0.49, 0.85] |
| 11.3 Intravenous tPA versus control | 9 | 3851 | Peto Odds Ratio (Peto, Fixed, 95% CI) | 0.71 [0.62, 0.81] |
| 11.4 Intravenous streptokinase plus oral aspirin versus oral aspirin | 1 | 309 | Peto Odds Ratio (Peto, Fixed, 95% CI) | 0.36 [0.22, 0.58] |
| 11.5 Intra‐arterial pro‐urokinase plus intravenous heparin versus intravenous heparin | 2 | 220 | Peto Odds Ratio (Peto, Fixed, 95% CI) | 0.72 [0.41, 1.28] |
| 11.6 Intra‐arterial urokinase versus control | 2 | 130 | Peto Odds Ratio (Peto, Fixed, 95% CI) | 0.53 [0.26, 1.06] |
| 11.7 Intravenous desmoteplase versus control | 3 | 325 | Peto Odds Ratio (Peto, Fixed, 95% CI) | 0.66 [0.41, 1.06] |
| 12 Deaths from all causes ordered by antithrombotic drug use Show forest plot | 23 | 6934 | Peto Odds Ratio (Peto, Fixed, 95% CI) | 1.33 [1.16, 1.52] |
|
| 12.1 All patients received antithrombotic drugs < 24 hours | 5 | 885 | Peto Odds Ratio (Peto, Fixed, 95% CI) | 1.92 [1.43, 2.57] |
| 12.2 Some patients received antithrombotic drugs < 24 hours | 4 | 1757 | Peto Odds Ratio (Peto, Fixed, 95% CI) | 1.27 [0.99, 1.63] |
| 12.3 Some patients received antithrombotics but not < 24 hours | 11 | 3236 | Peto Odds Ratio (Peto, Fixed, 95% CI) | 1.23 [0.98, 1.54] |
| 12.4 No patients received antithrombotic drugs < 10 days | 4 | 1056 | Peto Odds Ratio (Peto, Fixed, 95% CI) | 0.89 [0.58, 1.37] |
| 13 Deaths from all causes ordered by stroke severity Show forest plot | 26 | 6843 | Peto Odds Ratio (Peto, Fixed, 95% CI) | 1.22 [1.06, 1.40] |
|
| 13.1 Case fatality 0% to 19% in the control group | 17 | 4973 | Peto Odds Ratio (Peto, Fixed, 95% CI) | 1.31 [1.08, 1.58] |
| 13.2 Case fatality 20% or greater in the control group | 9 | 1870 | Peto Odds Ratio (Peto, Fixed, 95% CI) | 1.13 [0.91, 1.39] |
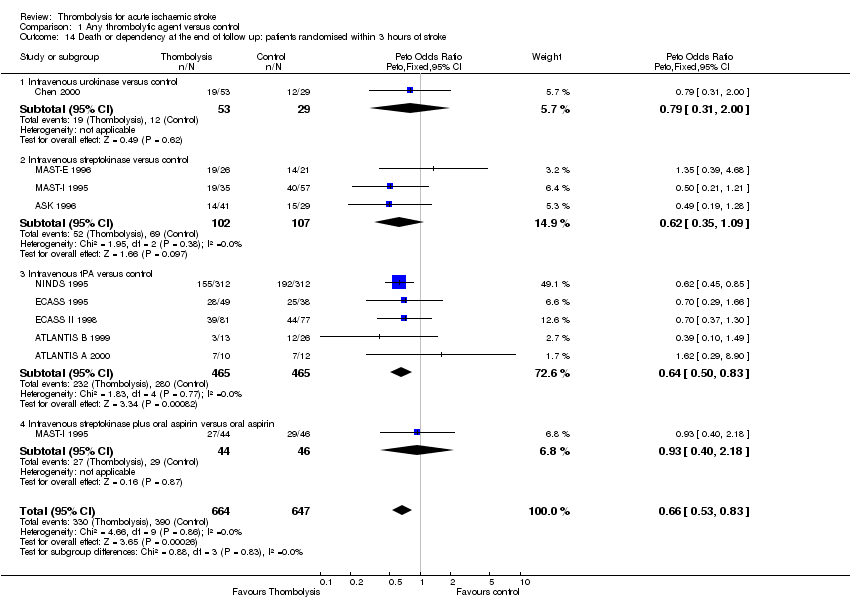
| 14 Death or dependency at the end of follow up: patients randomised within 3 hours of stroke Show forest plot | 9 | 1311 | Peto Odds Ratio (Peto, Fixed, 95% CI) | 0.66 [0.53, 0.83] |
|
| 14.1 Intravenous urokinase versus control | 1 | 82 | Peto Odds Ratio (Peto, Fixed, 95% CI) | 0.79 [0.31, 2.00] |
| 14.2 Intravenous streptokinase versus control | 3 | 209 | Peto Odds Ratio (Peto, Fixed, 95% CI) | 0.62 [0.35, 1.09] |
| 14.3 Intravenous tPA versus control | 5 | 930 | Peto Odds Ratio (Peto, Fixed, 95% CI) | 0.64 [0.50, 0.83] |
| 14.4 Intravenous streptokinase plus oral aspirin versus oral aspirin | 1 | 90 | Peto Odds Ratio (Peto, Fixed, 95% CI) | 0.93 [0.40, 2.18] |
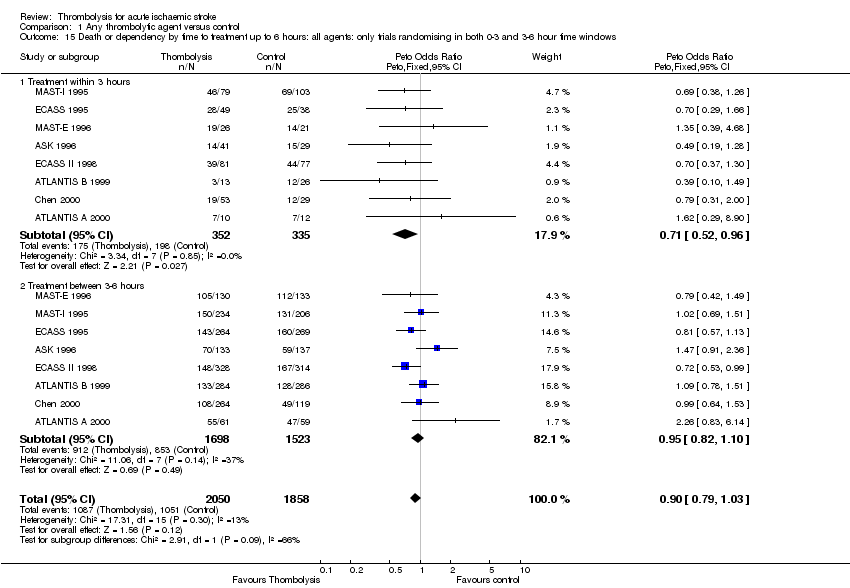
| 15 Death or dependency by time to treatment up to 6 hours: all agents: only trials randomising in both 0‐3 and 3‐6 hour time windows Show forest plot | 8 | 3908 | Peto Odds Ratio (Peto, Fixed, 95% CI) | 0.90 [0.79, 1.03] |
|
| 15.1 Treatment within 3 hours | 8 | 687 | Peto Odds Ratio (Peto, Fixed, 95% CI) | 0.71 [0.52, 0.96] |
| 15.2 Treatment between 3‐6 hours | 8 | 3221 | Peto Odds Ratio (Peto, Fixed, 95% CI) | 0.95 [0.82, 1.10] |
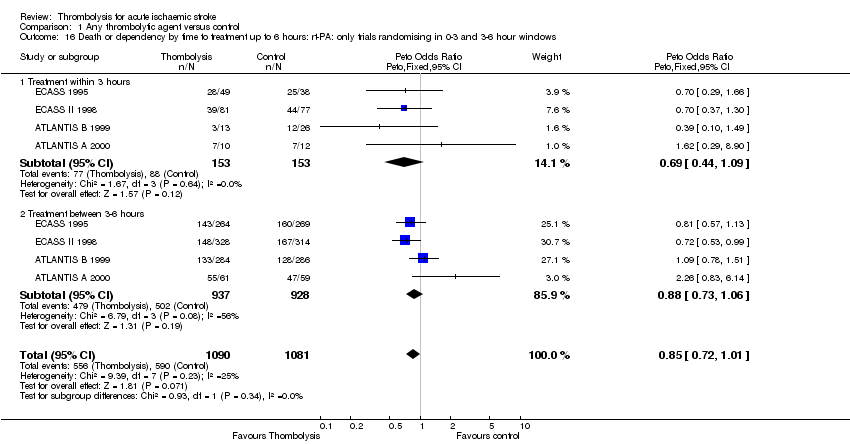
| 16 Death or dependency by time to treatment up to 6 hours: rt‐PA: only trials randomising in 0‐3 and 3‐6 hour windows Show forest plot | 4 | 2171 | Peto Odds Ratio (Peto, Fixed, 95% CI) | 0.85 [0.72, 1.01] |
|
| 16.1 Treatment within 3 hours | 4 | 306 | Peto Odds Ratio (Peto, Fixed, 95% CI) | 0.69 [0.44, 1.09] |
| 16.2 Treatment between 3‐6 hours | 4 | 1865 | Peto Odds Ratio (Peto, Fixed, 95% CI) | 0.88 [0.73, 1.06] |
| 17 Death or dependency by time to treatment up to 6 hours: rt‐PA: all trials regardless of time window Show forest plot | 7 | 3696 | Peto Odds Ratio (Peto, Fixed, 95% CI) | 0.79 [0.69, 0.90] |
|
| 17.1 Treatment within 3 hours | 5 | 930 | Peto Odds Ratio (Peto, Fixed, 95% CI) | 0.64 [0.50, 0.83] |
| 17.2 Treatment between 3‐6 hours | 6 | 2766 | Peto Odds Ratio (Peto, Fixed, 95% CI) | 0.85 [0.73, 0.99] |
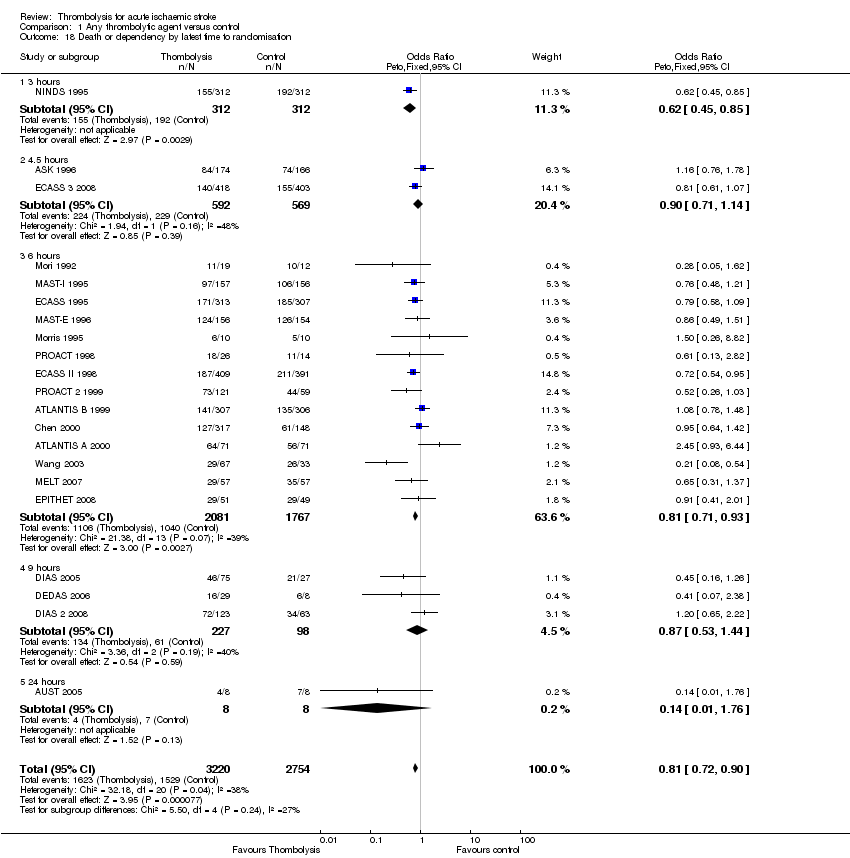
| 18 Death or dependency by latest time to randomisation Show forest plot | 21 | 5974 | Odds Ratio (Peto, Fixed, 95% CI) | 0.81 [0.72, 0.90] |
|
| 18.1 3 hours | 1 | 624 | Odds Ratio (Peto, Fixed, 95% CI) | 0.62 [0.45, 0.85] |
| 18.2 4.5 hours | 2 | 1161 | Odds Ratio (Peto, Fixed, 95% CI) | 0.90 [0.71, 1.14] |
| 18.3 6 hours | 14 | 3848 | Odds Ratio (Peto, Fixed, 95% CI) | 0.81 [0.71, 0.93] |
| 18.4 9 hours | 3 | 325 | Odds Ratio (Peto, Fixed, 95% CI) | 0.87 [0.53, 1.44] |
| 18.5 24 hours | 1 | 16 | Odds Ratio (Peto, Fixed, 95% CI) | 0.14 [0.01, 1.76] |
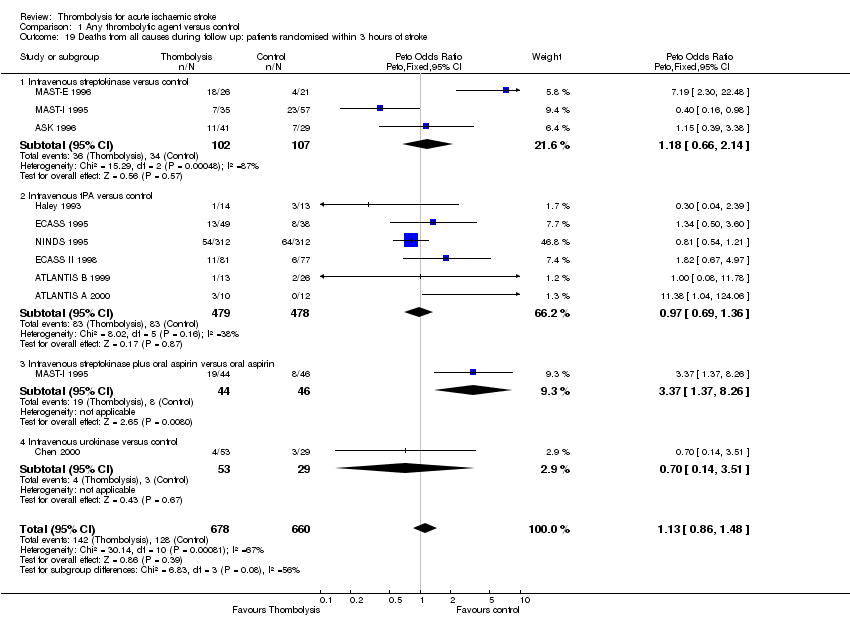
| 19 Deaths from all causes during follow up: patients randomised within 3 hours of stroke Show forest plot | 10 | 1338 | Peto Odds Ratio (Peto, Fixed, 95% CI) | 1.13 [0.86, 1.48] |
|
| 19.1 Intravenous streptokinase versus control | 3 | 209 | Peto Odds Ratio (Peto, Fixed, 95% CI) | 1.18 [0.66, 2.14] |
| 19.2 Intravenous tPA versus control | 6 | 957 | Peto Odds Ratio (Peto, Fixed, 95% CI) | 0.97 [0.69, 1.36] |
| 19.3 Intravenous streptokinase plus oral aspirin versus oral aspirin | 1 | 90 | Peto Odds Ratio (Peto, Fixed, 95% CI) | 3.37 [1.37, 8.26] |
| 19.4 Intravenous urokinase versus control | 1 | 82 | Peto Odds Ratio (Peto, Fixed, 95% CI) | 0.70 [0.14, 3.51] |
| 20 Deaths by time to treatment up to 6 hours: all agents: only trials randomising in both 0‐3 and 3‐6 hour time windows Show forest plot | 8 | 3896 | Peto Odds Ratio (Peto, Fixed, 95% CI) | 1.59 [1.34, 1.88] |
|
| 20.1 Treatment within 3 hours | 8 | 687 | Peto Odds Ratio (Peto, Fixed, 95% CI) | 1.58 [1.08, 2.31] |
| 20.2 Treatment between 3‐6 hours | 8 | 3209 | Peto Odds Ratio (Peto, Fixed, 95% CI) | 1.59 [1.32, 1.92] |
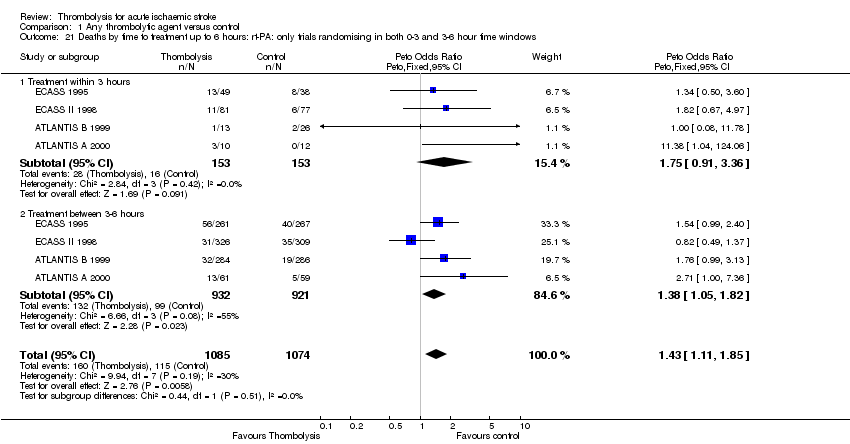
| 21 Deaths by time to treatment up to 6 hours: rt‐PA: only trials randomising in both 0‐3 and 3‐6 hour time windows Show forest plot | 4 | 2159 | Peto Odds Ratio (Peto, Fixed, 95% CI) | 1.43 [1.11, 1.85] |
|
| 21.1 Treatment within 3 hours | 4 | 306 | Peto Odds Ratio (Peto, Fixed, 95% CI) | 1.75 [0.91, 3.36] |
| 21.2 Treatment between 3‐6 hours | 4 | 1853 | Peto Odds Ratio (Peto, Fixed, 95% CI) | 1.38 [1.05, 1.82] |
| 22 Deaths by time to treatment up to 6 hours: rt‐PA: all trials regardless of time window Show forest plot | 7 | 3705 | Peto Odds Ratio (Peto, Fixed, 95% CI) | 1.18 [0.98, 1.44] |
|
| 22.1 Treatment within 3 hours | 5 | 930 | Peto Odds Ratio (Peto, Fixed, 95% CI) | 1.00 [0.71, 1.41] |
| 22.2 Treatment between 3‐6 hours | 6 | 2775 | Peto Odds Ratio (Peto, Fixed, 95% CI) | 1.28 [1.01, 1.62] |
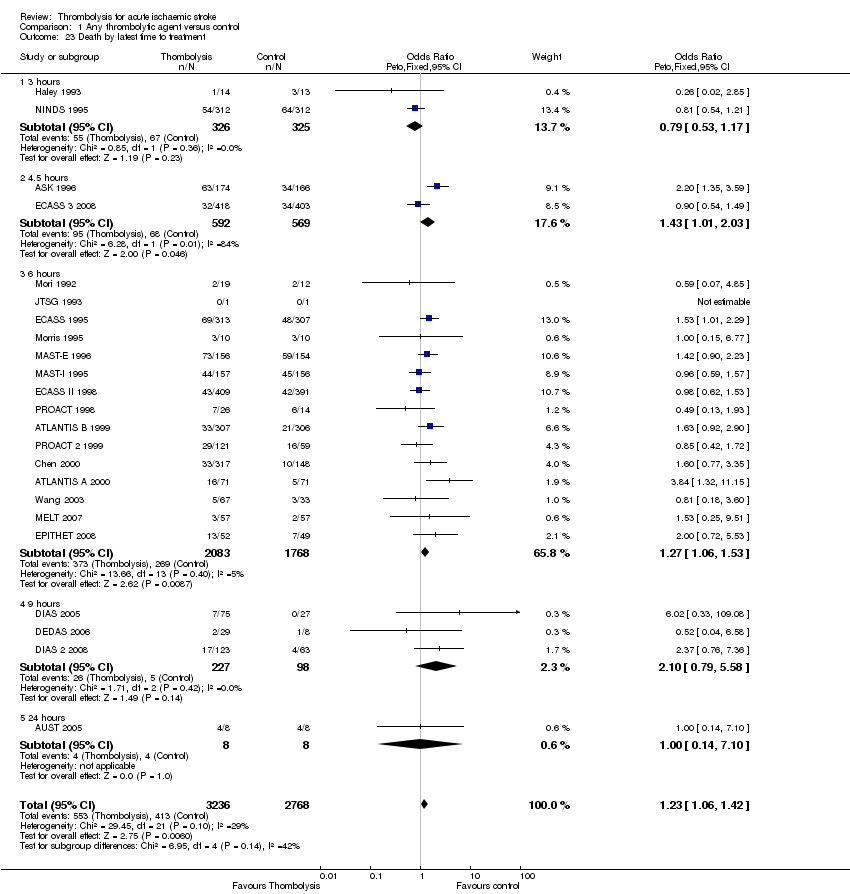
| 23 Death by latest time to treatment Show forest plot | 23 | 6004 | Odds Ratio (Peto, Fixed, 95% CI) | 1.23 [1.06, 1.42] |
|
| 23.1 3 hours | 2 | 651 | Odds Ratio (Peto, Fixed, 95% CI) | 0.79 [0.53, 1.17] |
| 23.2 4.5 hours | 2 | 1161 | Odds Ratio (Peto, Fixed, 95% CI) | 1.43 [1.01, 2.03] |
| 23.3 6 hours | 15 | 3851 | Odds Ratio (Peto, Fixed, 95% CI) | 1.27 [1.06, 1.53] |
| 23.4 9 hours | 3 | 325 | Odds Ratio (Peto, Fixed, 95% CI) | 2.10 [0.79, 5.58] |
| 23.5 24 hours | 1 | 16 | Odds Ratio (Peto, Fixed, 95% CI) | 1.0 [0.14, 7.10] |
| 24 Symptomatic intracranial haemorrhage by time to treatment up to 6 hours: rt‐PA: only trials randomising in both 0‐3 and 3‐6 hour time windows. Show forest plot | 4 | 2127 | Peto Odds Ratio (Peto, Fixed, 95% CI) | 3.18 [2.30, 4.40] |
|
| 24.1 Intravenous rt‐PA versus control: patients treated within 3 hours of stroke | 4 | 306 | Peto Odds Ratio (Peto, Fixed, 95% CI) | 3.40 [1.48, 7.84] |
| 24.2 Intravenous rt‐PA versus control: patients treated between 3‐6 hours after stroke | 4 | 1821 | Peto Odds Ratio (Peto, Fixed, 95% CI) | 3.14 [2.21, 4.47] |
| 25 Symptomatic intracranial haemorrhage by time to treatment up to 6 hours: rt‐PA: all trials regardless of time window Show forest plot | 7 | 3673 | Peto Odds Ratio (Peto, Fixed, 95% CI) | 3.54 [2.65, 4.74] |
|
| 25.1 Intravenous rt‐PA versus control: patients treated within 3 hours of stroke | 5 | 930 | Peto Odds Ratio (Peto, Fixed, 95% CI) | 4.28 [2.36, 7.77] |
| 25.2 Intravenous rt‐PA versus control: patients treated between 3‐6 hours after stroke | 6 | 2743 | Peto Odds Ratio (Peto, Fixed, 95% CI) | 3.34 [2.40, 4.66] |
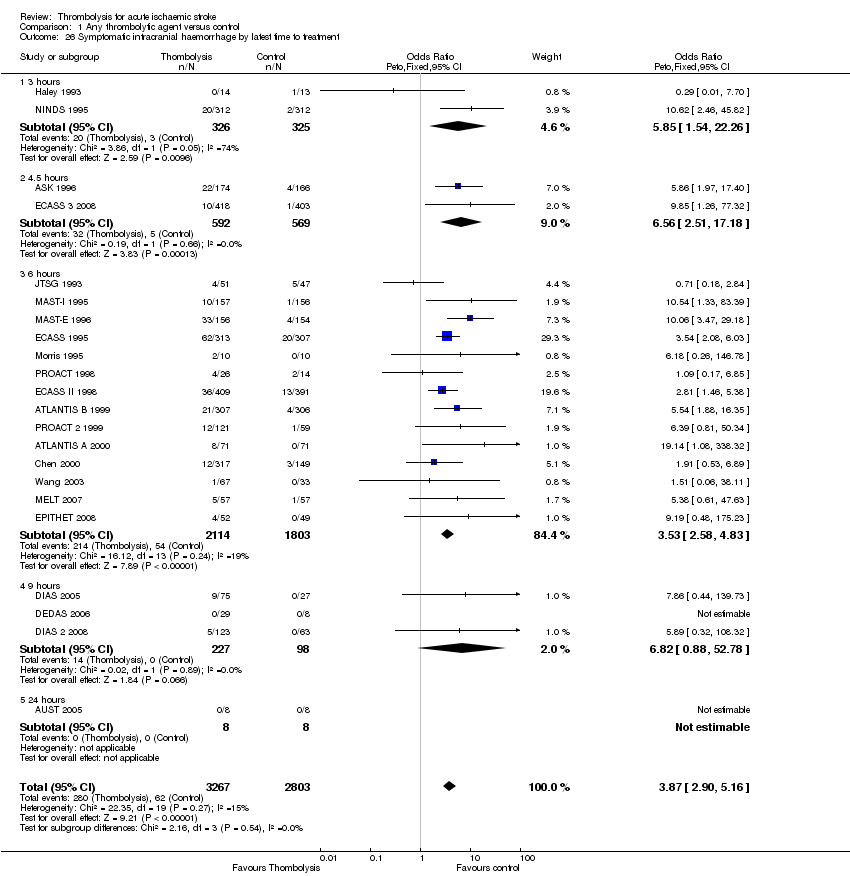
| 26 Symptomatic intracranial haemorrhage by latest time to treatment Show forest plot | 22 | 6070 | Odds Ratio (Peto, Fixed, 95% CI) | 3.87 [2.90, 5.16] |
|
| 26.1 3 hours | 2 | 651 | Odds Ratio (Peto, Fixed, 95% CI) | 5.85 [1.54, 22.26] |
| 26.2 4.5 hours | 2 | 1161 | Odds Ratio (Peto, Fixed, 95% CI) | 6.56 [2.51, 17.18] |
| 26.3 6 hours | 14 | 3917 | Odds Ratio (Peto, Fixed, 95% CI) | 3.53 [2.58, 4.83] |
| 26.4 9 hours | 3 | 325 | Odds Ratio (Peto, Fixed, 95% CI) | 6.82 [0.88, 52.78] |
| 26.5 24 hours | 1 | 16 | Odds Ratio (Peto, Fixed, 95% CI) | 0.0 [0.0, 0.0] |
| 27 Death: selection by MR DWI/PWI or CT Show forest plot | 18 | 5725 | Odds Ratio (Peto, Fixed, 95% CI) | 1.27 [1.09, 1.47] |
|
| 27.1 Plain CT | 14 | 5299 | Odds Ratio (Peto, Fixed, 95% CI) | 1.24 [1.06, 1.45] |
| 27.2 MR DWI/PWI | 4 | 426 | Odds Ratio (Peto, Fixed, 95% CI) | 2.05 [1.02, 4.15] |
| 28 Death or dependency: selection with MR DWI/PWI versus plain CT Show forest plot | 14 | 5233 | Odds Ratio (Peto, Fixed, 95% CI) | 0.79 [0.71, 0.89] |
|
| 28.1 Selection with plain CT | 10 | 4808 | Odds Ratio (Peto, Fixed, 95% CI) | 0.79 [0.70, 0.89] |
| 28.2 Selection with MR DWI/PWI | 4 | 425 | Odds Ratio (Peto, Fixed, 95% CI) | 0.88 [0.58, 1.35] |
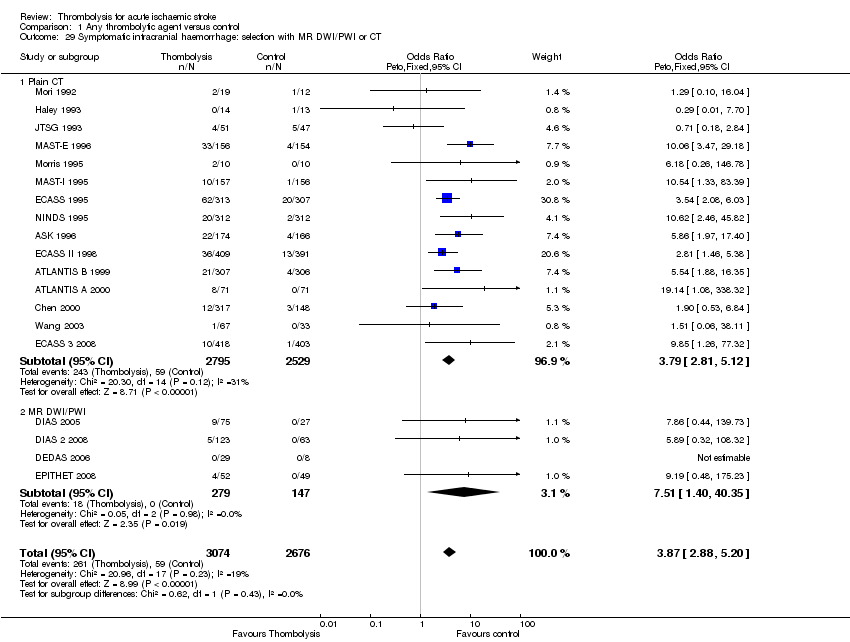
| 29 Symptomatic intracranial haemorrhage: selection with MR DWI/PWI or CT Show forest plot | 19 | 5750 | Odds Ratio (Peto, Fixed, 95% CI) | 3.87 [2.88, 5.20] |
|
| 29.1 Plain CT | 15 | 5324 | Odds Ratio (Peto, Fixed, 95% CI) | 3.79 [2.81, 5.12] |
| 29.2 MR DWI/PWI | 4 | 426 | Odds Ratio (Peto, Fixed, 95% CI) | 7.51 [1.40, 40.35] |
| 30 Death or dependency at the end of follow up:intra‐arterial thrombolysis versus control Show forest plot | 4 | 350 | Odds Ratio (Peto, Fixed, 95% CI) | 0.49 [0.31, 0.79] |
|
| 30.1 Intra‐arterial urokinase versus control | 2 | 130 | Odds Ratio (Peto, Fixed, 95% CI) | 0.44 [0.22, 0.91] |
| 30.2 Intra‐arterial pro‐urokinase versus control | 2 | 220 | Odds Ratio (Peto, Fixed, 95% CI) | 0.53 [0.28, 1.00] |