Tratamientos misceláneos para la discinesia tardía inducida por antipsicóticos
Información
- DOI:
- https://doi.org/10.1002/14651858.CD000208.pub2Copiar DOI

- Base de datos:
-
- Cochrane Database of Systematic Reviews
- Versión publicada:
-
- 19 marzo 2018see what's new
- Tipo:
-
- Intervention
- Etapa:
-
- Review
- Grupo Editorial Cochrane:
-
Grupo Cochrane de Esquizofrenia
- Copyright:
-
- Copyright © 2018 The Cochrane Collaboration. Published by John Wiley & Sons, Ltd.
Cifras del artículo
Altmetric:
Citado por:
Autores
Contributions of authors
Karla Soares‐Weiser (KSW) ‐ protocol development, searching, study selection, data extraction and assimilation, report writing ‐ all versions.
John Rathbone (JR ‐ helped update review in 2009
Hanna Bergman (HB) ‐ updated review in 2017
Sources of support
Internal sources
-
CAPES ‐ Ministry of Education, Brazil, Brazil.
-
Universidade Federal de Sao Paulo, Brazil, Brazil.
-
Cochrane Schizophrenia Group, UK.
-
Enhance Reviews Ltd., UK.
Logistics support for Hanna Bergman for the 2016 update.
External sources
-
NIHR HTA Project Grant, reference number: 14/27/02, UK.
Salary support for Hanna Bergman.
Support for patient involvement consultation.
Declarations of interest
KSW is the Deputy Editor‐in‐Chief for Cochrane and Cochrane Innovations. When the NHIR HTA programme grant relevant to this review update was awarded, KSW was the Managing Director of Enhance Reviews Ltd.
JR ‐ none known.
HB worked for Enhance Reviews Ltd. during preparation of this review and was paid for her contribution to this review. Enhance Reviews Ltd. is a private company that performs systematic reviews of literature. HB works for Cochrane Response, an evidence consultancy linked to Cochrane that take commissions from healthcare guideline developers and policy makers.
Acknowledgements
The authors are indebted to Geoff Davies, Kirsten Mason, Carmel Meir and Leanne Roberts for assistance with this review.
We are especially grateful to the following trialists who provided additional material; Professor Jes Gerlach, Dr Tetsuo Matsunaga, Dr Jacques Mouret, Dr Jan Sikora, Dr Krishna Viddadi and Dr Adam Wolkin. Thank you to John McGrath for protocol development, data extraction and assimilation and report writing. John authored this review from 1997‐2002.
For the 2017 update, we wish to thank Rosie Asher (RA) and Antonio Grande (AG) for screening literature and helping with data extraction, Farhad Sokraneh for carrying out the trial search and helping to find full‐text papers, Ben Gray for writing the Plain language summary, and Nicholas Henschke and Loukia Spineli for assistance with preparing the report. We also acknowledge Dawn‐Marie Walker, Ruth Sayers, Megan Lees, and Vanessa Pinfold from McPin Foundation for organising and holding the public and patient involvement consultation with TD service users that contributed to selecting outcomes for the 'Summary of findings' tables and to guide future research. Finally, we wish to thank Sai Zhao and Jun Xia for assessing and extracting data from articles in Chinese.
The Cochrane Schizophrenia Group Editorial Base in Nottingham produces and maintains standard text for use in the Methods sections of their reviews. We have used this text as the basis of what appears here and adapted it as required.
Version history
| Published | Title | Stage | Authors | Version |
| 2018 Mar 19 | Miscellaneous treatments for antipsychotic‐induced tardive dyskinesia | Review | Karla Soares‐Weiser, John Rathbone, Yusuke Ogawa, Kiyomi Shinohara, Hanna Bergman | |
| 2003 Apr 22 | Miscellaneous treatments for neuroleptic‐induced tardive dyskinesia | Review | Karla Soares‐Weiser, Claire B Irving, John Rathbone | |
Differences between protocol and review
The protocol as published with this review has evolved over time. The revisions of protocol are in line with the development of RevMan and in keeping with Cochrane guidance. We think the revisions have greatly improved and enhanced this review. We do not think, however, that it has materially affected our conduct of the review or interpretation of the results.
There was a substantial update to the protocol in the 2016 review update with main changes being to:
-
change the title from 'Miscellaneous treatments for neuroleptic‐induced tardive dyskinesia';
-
broaden the inclusion criteria by adding the comparison: 'Any intervention compared with any other intervention for the treatment of tardive dyskinesia';
-
rename and update list of important outcomes following consultation with consumers;
-
prioritise comparisons for 'Summary of findings' tables: 'Summary of findings' tables were created only for those comparisons that: 1) included more than 60 participants, or 2) included more than one trial;
-
we analysed outcomes using risk ratios (see Methods) ‐ rather than odds ratios.
The previous methods are reproduced in Appendix 1; Appendix 2, and Appendix 3.
Keywords
MeSH
Medical Subject Headings (MeSH) Keywords
- Adrenergic Uptake Inhibitors [therapeutic use];
- Anti‐Anxiety Agents [therapeutic use];
- Antipsychotic Agents [adverse effects];
- Dihydroergotoxine [therapeutic use];
- Dyskinesia, Drug‐Induced [etiology, *therapy];
- Ginkgo biloba;
- Hypnosis;
- Plant Extracts;
- Randomized Controlled Trials as Topic;
- Relaxation Therapy;
- Tetrabenazine [analogs & derivatives, therapeutic use];
- Valine [analogs & derivatives, therapeutic use];
Medical Subject Headings Check Words
Adult; Humans;
PICO
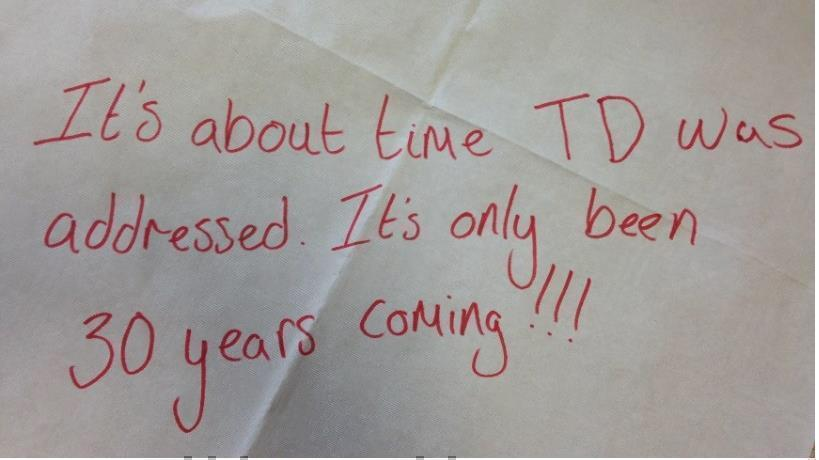
Message from one of the participants of the Public and patient involvement consultation of service user perspectives on tardive dyskinesia research.
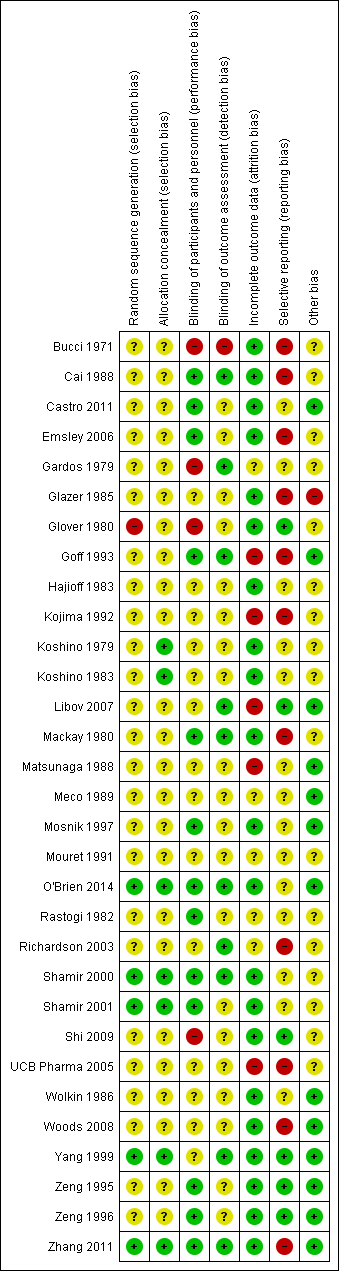
Methodological quality summary: review authors' judgements about each methodological quality item for each included study.
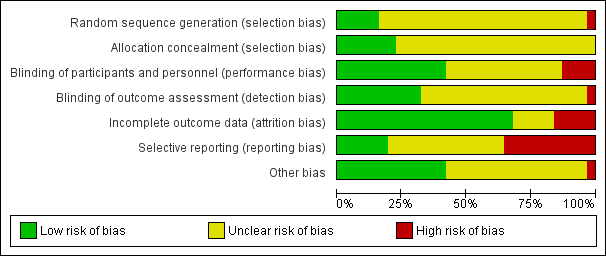
'Risk of bias' graph: review authors' judgements about each risk of bias item presented as percentages across all included studies.

Study flow diagram for 2015 and 2017 searches.

Comparison 1 ALKALOID ‐ DIHYDROGENATED ERGOT ALKALOIDS versus PLACEBO, Outcome 1 Tardive dyskinesia: 1. No clinically important improvement ‐ medium term.
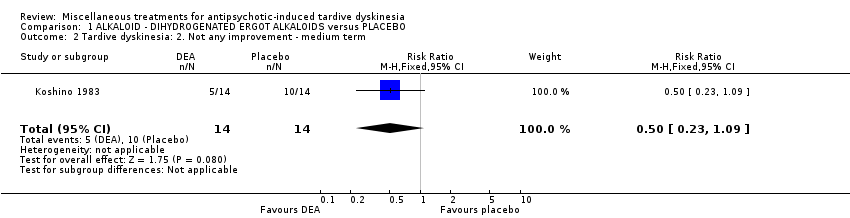
Comparison 1 ALKALOID ‐ DIHYDROGENATED ERGOT ALKALOIDS versus PLACEBO, Outcome 2 Tardive dyskinesia: 2. Not any improvement ‐ medium term.
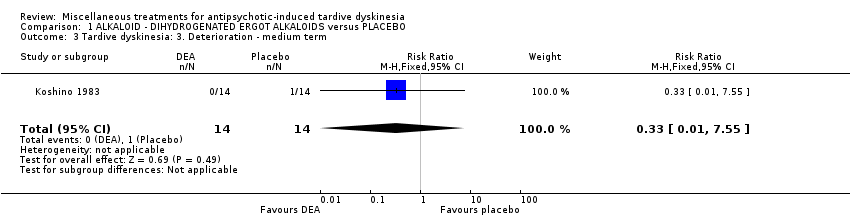
Comparison 1 ALKALOID ‐ DIHYDROGENATED ERGOT ALKALOIDS versus PLACEBO, Outcome 3 Tardive dyskinesia: 3. Deterioration ‐ medium term.

Comparison 1 ALKALOID ‐ DIHYDROGENATED ERGOT ALKALOIDS versus PLACEBO, Outcome 4 Tardive dyskinesia: 3. Average endpoint scale score (Simpson scale, high=poor) ‐ medium term.
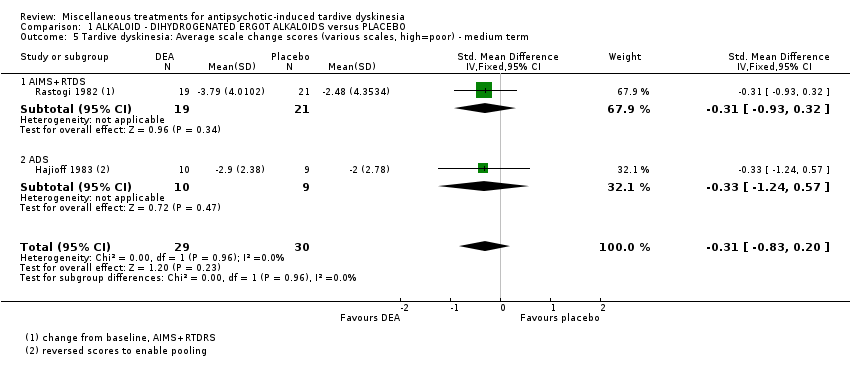
Comparison 1 ALKALOID ‐ DIHYDROGENATED ERGOT ALKALOIDS versus PLACEBO, Outcome 5 Tardive dyskinesia: Average scale change scores (various scales, high=poor) ‐ medium term.

Comparison 1 ALKALOID ‐ DIHYDROGENATED ERGOT ALKALOIDS versus PLACEBO, Outcome 6 Mental state: Deterioration ‐ medium term.
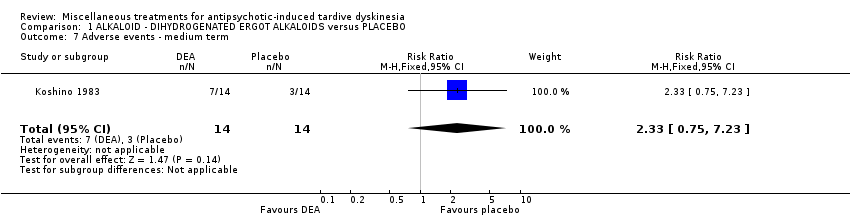
Comparison 1 ALKALOID ‐ DIHYDROGENATED ERGOT ALKALOIDS versus PLACEBO, Outcome 7 Adverse events ‐ medium term.
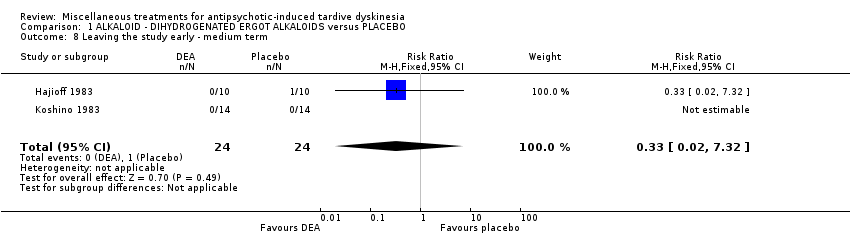
Comparison 1 ALKALOID ‐ DIHYDROGENATED ERGOT ALKALOIDS versus PLACEBO, Outcome 8 Leaving the study early ‐ medium term.

Comparison 2 ALKALOID ‐ L‐STEPHOLIDINE (SPD) versus PLACEBO, Outcome 1 Tardive dyskinesia: 1. No clinically important improvement ‐ medium term.

Comparison 2 ALKALOID ‐ L‐STEPHOLIDINE (SPD) versus PLACEBO, Outcome 2 Mental state: 1. Average endpoint scale score (BPRS, high=poor) ‐ medium term.

Comparison 2 ALKALOID ‐ L‐STEPHOLIDINE (SPD) versus PLACEBO, Outcome 3 Adverse events: any adverse events ‐ medium term.
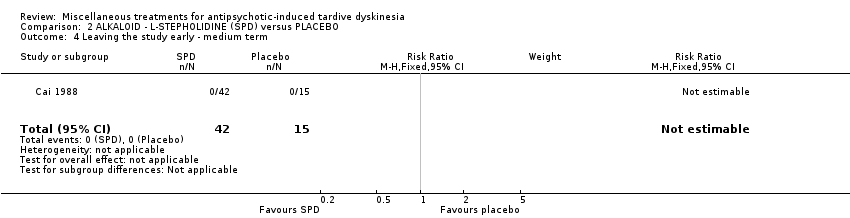
Comparison 2 ALKALOID ‐ L‐STEPHOLIDINE (SPD) versus PLACEBO, Outcome 4 Leaving the study early ‐ medium term.

Comparison 3 ALKALOID ‐ PAPAVERINE versus PLACEBO, Outcome 1 Tardive dyskinesia: 3. Average scale score (AIMS, high=poor) ‐ medium term.

Comparison 4 AMINO ACID ‐ BRANCHED‐CHAIN AMINO ACID (BCAA) versus PLACEBO, Outcome 1 Tardive dyskinesia: 1. No clinically important improvement ‐ short term.
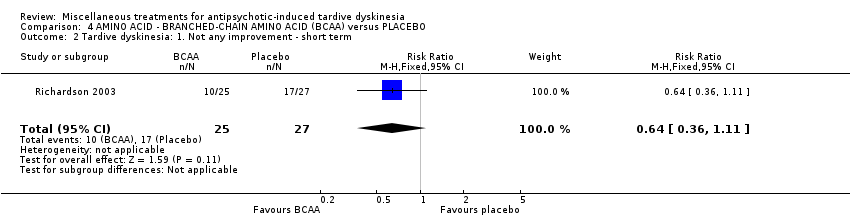
Comparison 4 AMINO ACID ‐ BRANCHED‐CHAIN AMINO ACID (BCAA) versus PLACEBO, Outcome 2 Tardive dyskinesia: 1. Not any improvement ‐ short term.

Comparison 4 AMINO ACID ‐ BRANCHED‐CHAIN AMINO ACID (BCAA) versus PLACEBO, Outcome 3 Tardive dyskinesia: 2. Deterioration ‐ short term.

Comparison 4 AMINO ACID ‐ BRANCHED‐CHAIN AMINO ACID (BCAA) versus PLACEBO, Outcome 4 Tardive dyskinesia: Average endpoint score (Simpson scale, high=poor) ‐ short term.
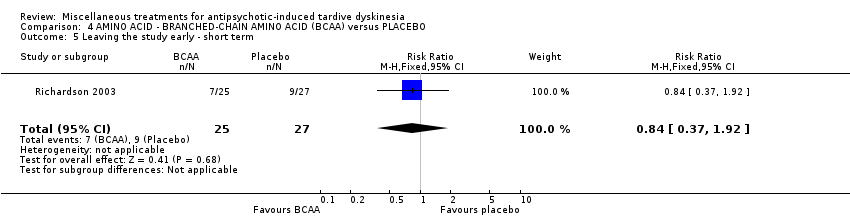
Comparison 4 AMINO ACID ‐ BRANCHED‐CHAIN AMINO ACID (BCAA) versus PLACEBO, Outcome 5 Leaving the study early ‐ short term.
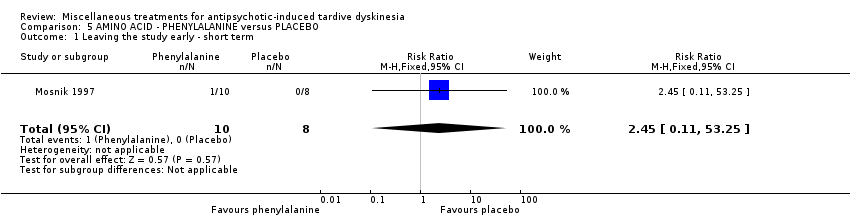
Comparison 5 AMINO ACID ‐ PHENYLALANINE versus PLACEBO, Outcome 1 Leaving the study early ‐ short term.

Comparison 6 ANTIDEPRESSANT (MAO‐B inhibitor) ‐ SELEGILINE versus PLACEBO, Outcome 1 Tardive dyskinesia: 1. No clinically important improvement ‐ medium term.
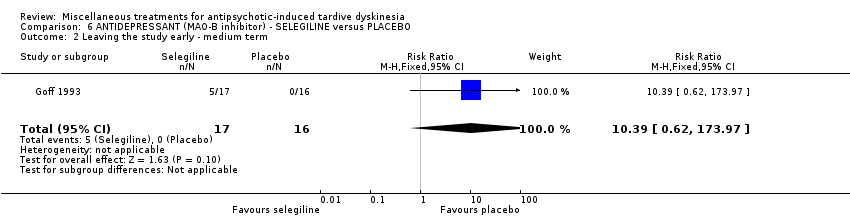
Comparison 6 ANTIDEPRESSANT (MAO‐B inhibitor) ‐ SELEGILINE versus PLACEBO, Outcome 2 Leaving the study early ‐ medium term.

Comparison 7 ANTIDEPRESSANT (MAOI) ISOCARBOXAZID versus PROCYCLIDINE, Outcome 1 Tardive dyskinesia: 1. No clinically important improvement ‐ long term.
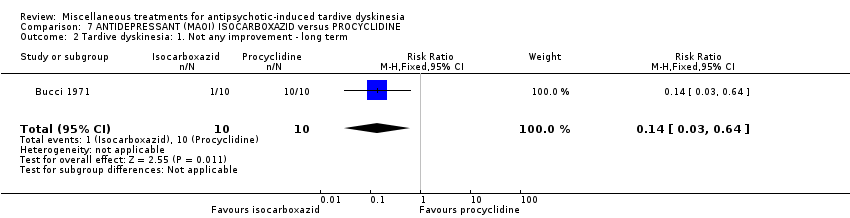
Comparison 7 ANTIDEPRESSANT (MAOI) ISOCARBOXAZID versus PROCYCLIDINE, Outcome 2 Tardive dyskinesia: 1. Not any improvement ‐ long term.
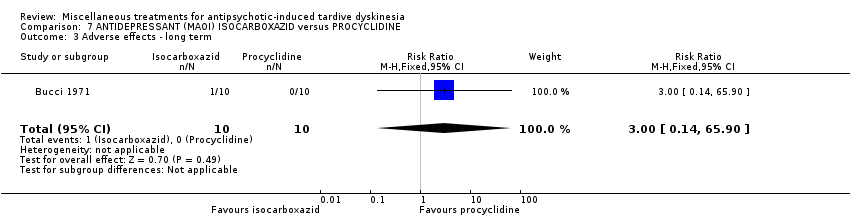
Comparison 7 ANTIDEPRESSANT (MAOI) ISOCARBOXAZID versus PROCYCLIDINE, Outcome 3 Adverse effects ‐ long term.

Comparison 7 ANTIDEPRESSANT (MAOI) ISOCARBOXAZID versus PROCYCLIDINE, Outcome 4 Leaving the study early ‐ long term.

Comparison 8 ANTIDEPRESSANT (SSRI) ‐ RITANSERIN vs PLACEBO, Outcome 1 Tardive dyskinesia: No clinically important improvement (short term).
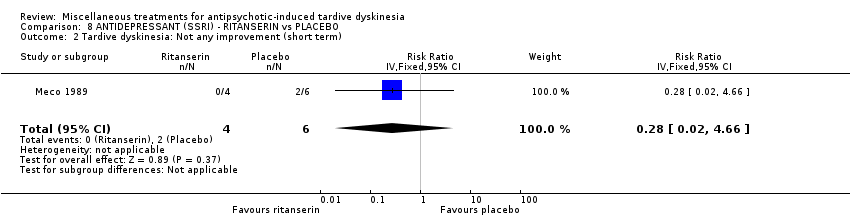
Comparison 8 ANTIDEPRESSANT (SSRI) ‐ RITANSERIN vs PLACEBO, Outcome 2 Tardive dyskinesia: Not any improvement (short term).
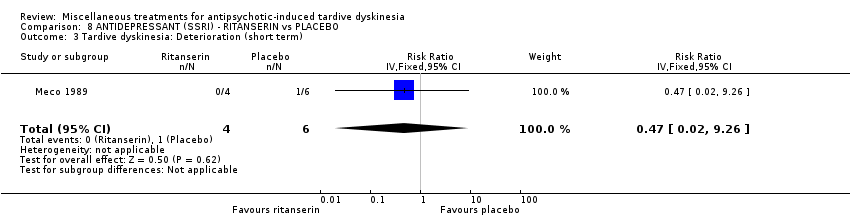
Comparison 8 ANTIDEPRESSANT (SSRI) ‐ RITANSERIN vs PLACEBO, Outcome 3 Tardive dyskinesia: Deterioration (short term).

Comparison 8 ANTIDEPRESSANT (SSRI) ‐ RITANSERIN vs PLACEBO, Outcome 4 Tardive dyskinesia: Average change score (AIMS, high=poor) (short term).

Comparison 8 ANTIDEPRESSANT (SSRI) ‐ RITANSERIN vs PLACEBO, Outcome 5 General mental state: Deterioration (short term).
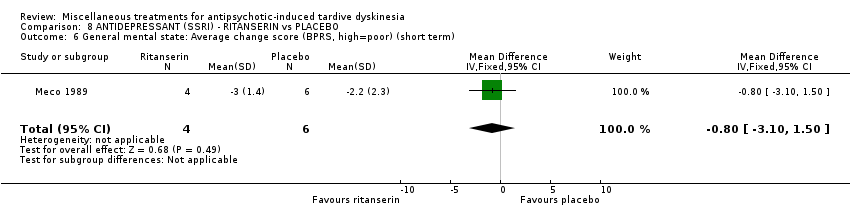
Comparison 8 ANTIDEPRESSANT (SSRI) ‐ RITANSERIN vs PLACEBO, Outcome 6 General mental state: Average change score (BPRS, high=poor) (short term).

Comparison 9 ANTIEPILEPTIC ‐ LEVETIRACETAM versus PLACEBO, Outcome 1 Tardive dyskinesia: 1. Average endpoint score (AIMS, high=poor) ‐ medium term.
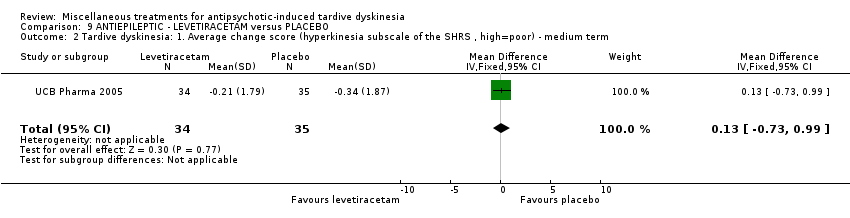
Comparison 9 ANTIEPILEPTIC ‐ LEVETIRACETAM versus PLACEBO, Outcome 2 Tardive dyskinesia: 1. Average change score (hyperkinesia subscale of the SHRS , high=poor) ‐ medium term.
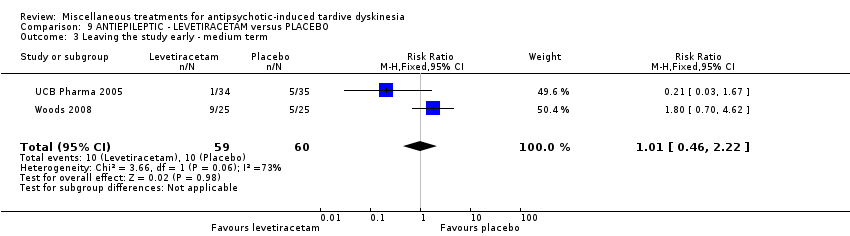
Comparison 9 ANTIEPILEPTIC ‐ LEVETIRACETAM versus PLACEBO, Outcome 3 Leaving the study early ‐ medium term.

Comparison 9 ANTIEPILEPTIC ‐ LEVETIRACETAM versus PLACEBO, Outcome 4 Adverse effects ‐ medium term.
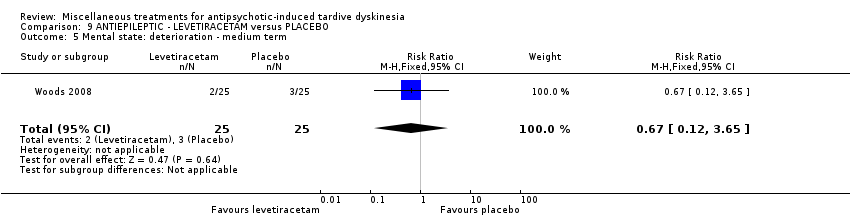
Comparison 9 ANTIEPILEPTIC ‐ LEVETIRACETAM versus PLACEBO, Outcome 5 Mental state: deterioration ‐ medium term.

Comparison 10 ANTIHISTAMINE ‐ CYPROHEPTADINE versus PLACEBO, Outcome 1 Tardive dyskinesia: 2. Not any improvement ‐ short term.
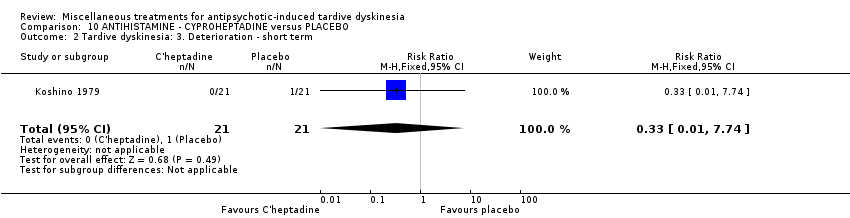
Comparison 10 ANTIHISTAMINE ‐ CYPROHEPTADINE versus PLACEBO, Outcome 2 Tardive dyskinesia: 3. Deterioration ‐ short term.

Comparison 10 ANTIHISTAMINE ‐ CYPROHEPTADINE versus PLACEBO, Outcome 3 Adverse events ‐ short term.

Comparison 10 ANTIHISTAMINE ‐ CYPROHEPTADINE versus PLACEBO, Outcome 4 Leaving the study early ‐ short term.
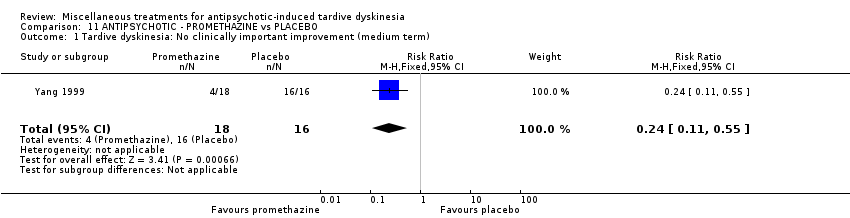
Comparison 11 ANTIPSYCHOTIC ‐ PROMETHAZINE vs PLACEBO, Outcome 1 Tardive dyskinesia: No clinically important improvement (medium term).

Comparison 11 ANTIPSYCHOTIC ‐ PROMETHAZINE vs PLACEBO, Outcome 2 Tardive dyskinesia: Not any improvement (medium term).

Comparison 11 ANTIPSYCHOTIC ‐ PROMETHAZINE vs PLACEBO, Outcome 3 Tardive dyskinesia: Average endpoint score (AIMS, high=poor) (medium term).
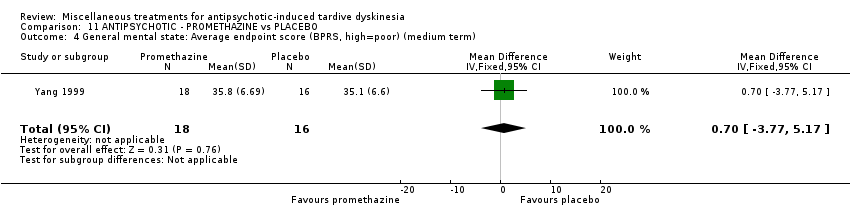
Comparison 11 ANTIPSYCHOTIC ‐ PROMETHAZINE vs PLACEBO, Outcome 4 General mental state: Average endpoint score (BPRS, high=poor) (medium term).
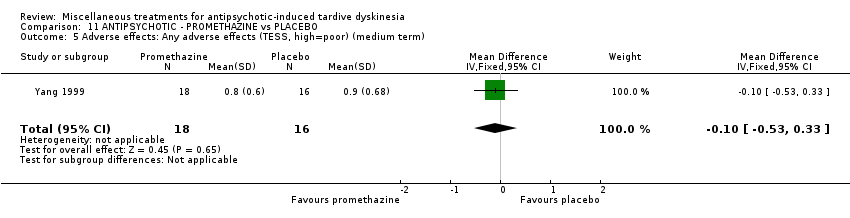
Comparison 11 ANTIPSYCHOTIC ‐ PROMETHAZINE vs PLACEBO, Outcome 5 Adverse effects: Any adverse effects (TESS, high=poor) (medium term).
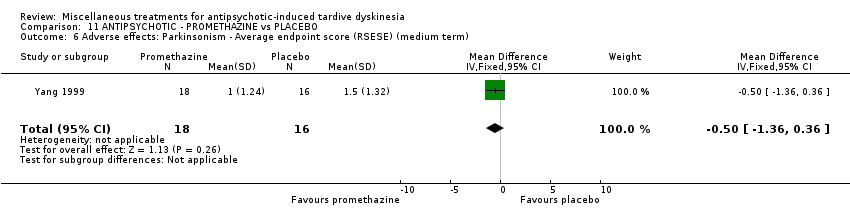
Comparison 11 ANTIPSYCHOTIC ‐ PROMETHAZINE vs PLACEBO, Outcome 6 Adverse effects: Parkinsonism ‐ Average endpoint score (RSESE) (medium term).
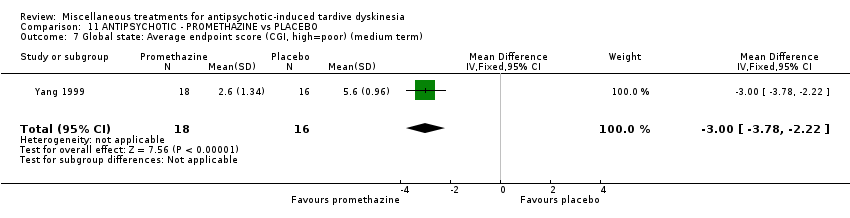
Comparison 11 ANTIPSYCHOTIC ‐ PROMETHAZINE vs PLACEBO, Outcome 7 Global state: Average endpoint score (CGI, high=poor) (medium term).

Comparison 12 ANXIOLYTIC ‐ BUSPIRONE versus PLACEBO, Outcome 1 Tardive dyskinesia: 1. No clinically important improvement ‐ medium term.

Comparison 12 ANXIOLYTIC ‐ BUSPIRONE versus PLACEBO, Outcome 2 Tardive dyskinesia: 2. Not any improvement ‐ medium term.

Comparison 12 ANXIOLYTIC ‐ BUSPIRONE versus PLACEBO, Outcome 3 Tardive dyskinesia: 3. Average scale score (AIMS, high=poor) ‐ medium term.
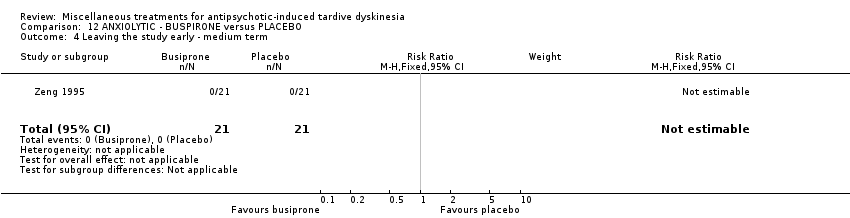
Comparison 12 ANXIOLYTIC ‐ BUSPIRONE versus PLACEBO, Outcome 4 Leaving the study early ‐ medium term.
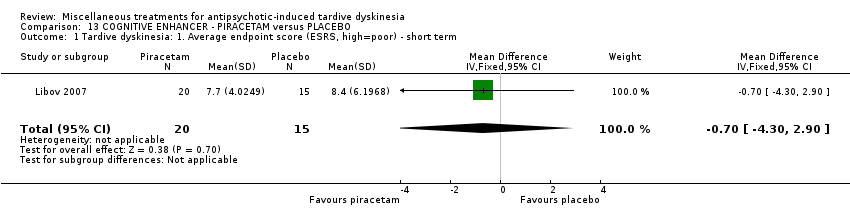
Comparison 13 COGNITIVE ENHANCER ‐ PIRACETAM versus PLACEBO, Outcome 1 Tardive dyskinesia: 1. Average endpoint score (ESRS, high=poor) ‐ short term.

Comparison 13 COGNITIVE ENHANCER ‐ PIRACETAM versus PLACEBO, Outcome 2 Parkinsonism: 1. Average endpoint score (ESRS, high=poor) ‐ short term.
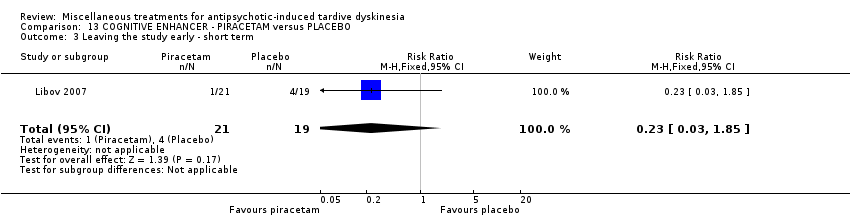
Comparison 13 COGNITIVE ENHANCER ‐ PIRACETAM versus PLACEBO, Outcome 3 Leaving the study early ‐ short term.
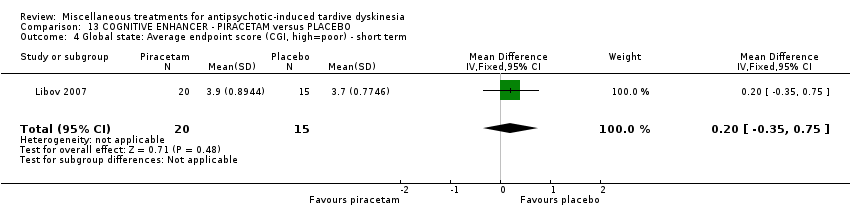
Comparison 13 COGNITIVE ENHANCER ‐ PIRACETAM versus PLACEBO, Outcome 4 Global state: Average endpoint score (CGI, high=poor) ‐ short term.

Comparison 14 COGNITIVE ENHANCER/STIMULANT ‐ PEMOLINE versus PLACEBO, Outcome 1 Tardive dyskinesia: 1. No clinically important improvement ‐ medium term.
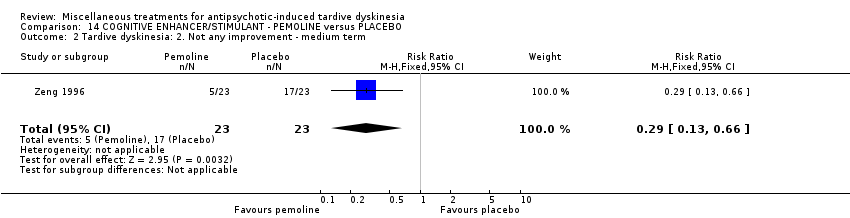
Comparison 14 COGNITIVE ENHANCER/STIMULANT ‐ PEMOLINE versus PLACEBO, Outcome 2 Tardive dyskinesia: 2. Not any improvement ‐ medium term.

Comparison 14 COGNITIVE ENHANCER/STIMULANT ‐ PEMOLINE versus PLACEBO, Outcome 3 Tardive dyskinesia: 3. Average scale score (AIMS, high=poor) ‐ medium term.

Comparison 14 COGNITIVE ENHANCER/STIMULANT ‐ PEMOLINE versus PLACEBO, Outcome 4 Leaving the study early ‐ medium term.
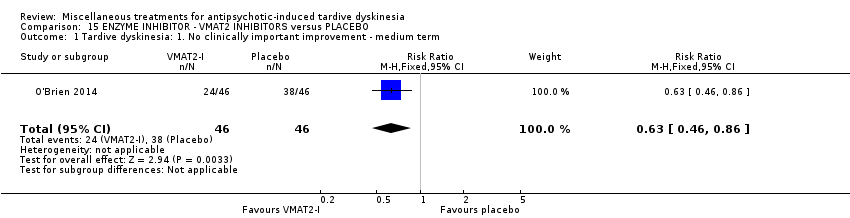
Comparison 15 ENZYME INHIBITOR ‐ VMAT2 INHIBITORS versus PLACEBO, Outcome 1 Tardive dyskinesia: 1. No clinically important improvement ‐ medium term.

Comparison 15 ENZYME INHIBITOR ‐ VMAT2 INHIBITORS versus PLACEBO, Outcome 2 Tardive dyskinesia: 3. Average change score (AIMS, high=poor) ‐ medium term.

Comparison 15 ENZYME INHIBITOR ‐ VMAT2 INHIBITORS versus PLACEBO, Outcome 3 Adverse events ‐ medium term.

Comparison 15 ENZYME INHIBITOR ‐ VMAT2 INHIBITORS versus PLACEBO, Outcome 4 Leaving the study early ‐ medium term.
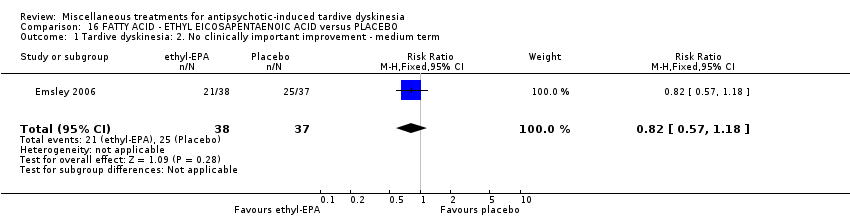
Comparison 16 FATTY ACID ‐ ETHYL EICOSAPENTAENOIC ACID versus PLACEBO, Outcome 1 Tardive dyskinesia: 2. No clinically important improvement ‐ medium term.

Comparison 16 FATTY ACID ‐ ETHYL EICOSAPENTAENOIC ACID versus PLACEBO, Outcome 2 Mental state: deterioration ‐ medium term.

Comparison 16 FATTY ACID ‐ ETHYL EICOSAPENTAENOIC ACID versus PLACEBO, Outcome 3 Adverse events: Parkinsonism ‐ Average change in scale score (ESRS, low=better) ‐ medium term.

Comparison 16 FATTY ACID ‐ ETHYL EICOSAPENTAENOIC ACID versus PLACEBO, Outcome 4 Adverse events: Dystonia ‐ Average change in scale score (ESRS, low=better) ‐ medium term.

Comparison 16 FATTY ACID ‐ ETHYL EICOSAPENTAENOIC ACID versus PLACEBO, Outcome 5 Adverse events: Akathisia ‐ Average change in scale score (ESRS, low=better) ‐ medium term.

Comparison 16 FATTY ACID ‐ ETHYL EICOSAPENTAENOIC ACID versus PLACEBO, Outcome 6 Leaving the study early ‐ medium term.

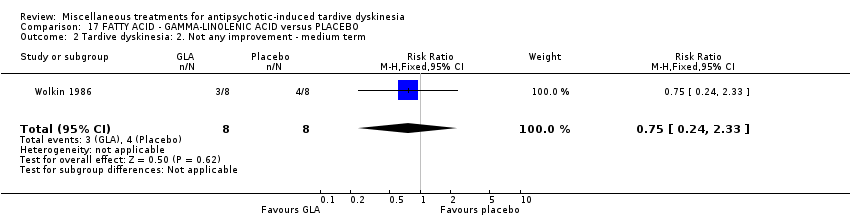
Comparison 17 FATTY ACID ‐ GAMMA‐LINOLENIC ACID versus PLACEBO, Outcome 1 Tardive dyskinesia: 1. No clinically important improvement ‐ medium term.
Comparison 17 FATTY ACID ‐ GAMMA‐LINOLENIC ACID versus PLACEBO, Outcome 2 Tardive dyskinesia: 2. Not any improvement ‐ medium term.

Comparison 17 FATTY ACID ‐ GAMMA‐LINOLENIC ACID versus PLACEBO, Outcome 3 Tardive dyskinesia: 3. Deterioration ‐ medium term.
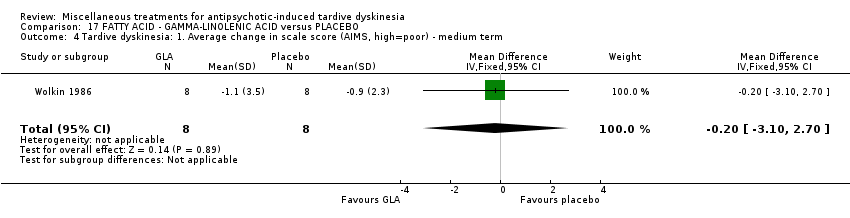
Comparison 17 FATTY ACID ‐ GAMMA‐LINOLENIC ACID versus PLACEBO, Outcome 4 Tardive dyskinesia: 1. Average change in scale score (AIMS, high=poor) ‐ medium term.
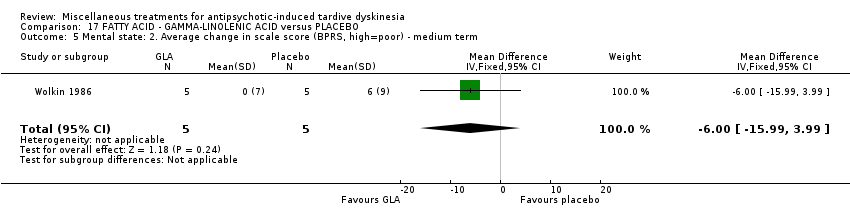
Comparison 17 FATTY ACID ‐ GAMMA‐LINOLENIC ACID versus PLACEBO, Outcome 5 Mental state: 2. Average change in scale score (BPRS, high=poor) ‐ medium term.

Comparison 17 FATTY ACID ‐ GAMMA‐LINOLENIC ACID versus PLACEBO, Outcome 6 Leaving the study early ‐ medium term.

Comparison 18 HERB ‐ GINKGO BILOBA versus PLACEBO, Outcome 1 Tardive dyskinesia: 1. No clinically important improvement ‐ medium term.
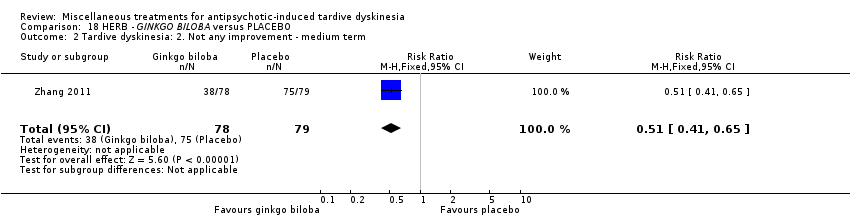
Comparison 18 HERB ‐ GINKGO BILOBA versus PLACEBO, Outcome 2 Tardive dyskinesia: 2. Not any improvement ‐ medium term.

Comparison 18 HERB ‐ GINKGO BILOBA versus PLACEBO, Outcome 3 Tardive dyskinesia: 3. Average scale score (AIMS, high=poor) ‐ medium term.

Comparison 18 HERB ‐ GINKGO BILOBA versus PLACEBO, Outcome 4 Leaving the study early ‐ medium term.

Comparison 18 HERB ‐ GINKGO BILOBA versus PLACEBO, Outcome 5 Mental state: deterioration ‐ medium term.
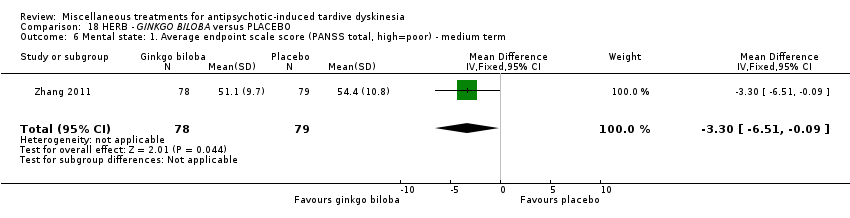
Comparison 18 HERB ‐ GINKGO BILOBA versus PLACEBO, Outcome 6 Mental state: 1. Average endpoint scale score (PANSS total, high=poor) ‐ medium term.

Comparison 18 HERB ‐ GINKGO BILOBA versus PLACEBO, Outcome 7 Cognitive function: CPT‐37 ‐ proportion correct responses (high=better) ‐ medium term.

Comparison 19 HORMONE ‐ OESTROGEN versus PLACEBO, Outcome 1 Tardive dyskinesia: 1. No clinically important improvement ‐ short term.
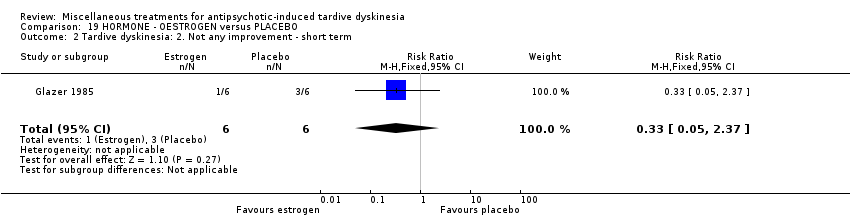
Comparison 19 HORMONE ‐ OESTROGEN versus PLACEBO, Outcome 2 Tardive dyskinesia: 2. Not any improvement ‐ short term.
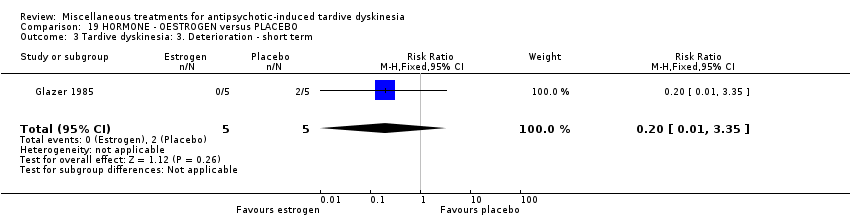
Comparison 19 HORMONE ‐ OESTROGEN versus PLACEBO, Outcome 3 Tardive dyskinesia: 3. Deterioration ‐ short term.

Comparison 19 HORMONE ‐ OESTROGEN versus PLACEBO, Outcome 4 Tardive dyskinesia: 4. Average scale score (AIMS, high=poor) ‐ short term.

Comparison 19 HORMONE ‐ OESTROGEN versus PLACEBO, Outcome 5 Adverse effects ‐ short term.
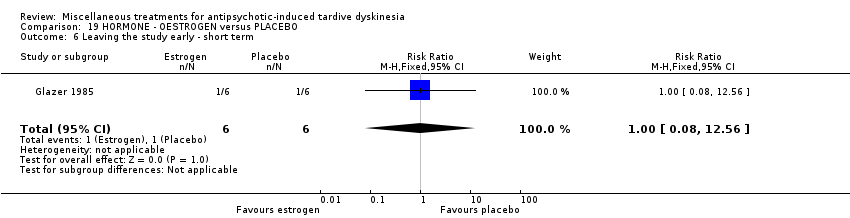
Comparison 19 HORMONE ‐ OESTROGEN versus PLACEBO, Outcome 6 Leaving the study early ‐ short term.
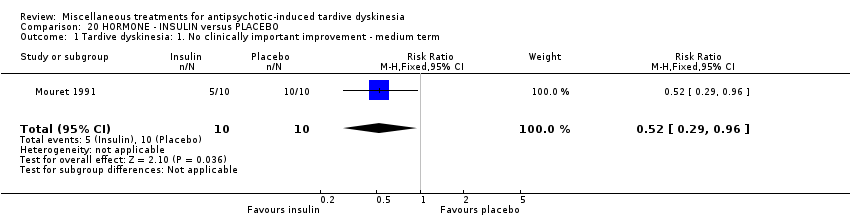
Comparison 20 HORMONE ‐ INSULIN versus PLACEBO, Outcome 1 Tardive dyskinesia: 1. No clinically important improvement ‐ medium term.

Comparison 20 HORMONE ‐ INSULIN versus PLACEBO, Outcome 2 Tardive dyskinesia: 2. Not any improvement ‐ medium term.

Comparison 20 HORMONE ‐ INSULIN versus PLACEBO, Outcome 3 Tardive dyskinesia: 3. Deterioration ‐ medium term.

Comparison 20 HORMONE ‐ INSULIN versus PLACEBO, Outcome 4 Tardive dyskinesia: 3. Average scale score (AIMS, high=poor) ‐ medium term.

Comparison 20 HORMONE ‐ INSULIN versus PLACEBO, Outcome 5 Leaving the study early ‐ medium term.

Comparison 21 HORMONE ‐ MELATONIN versus PLACEBO OR NO TREATMENT, Outcome 1 Tardive dyskinesia: 1. No clinically important improvement.
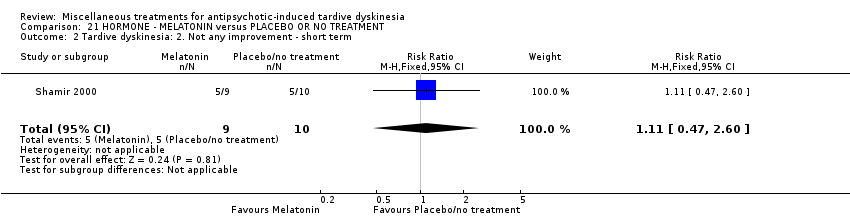
Comparison 21 HORMONE ‐ MELATONIN versus PLACEBO OR NO TREATMENT, Outcome 2 Tardive dyskinesia: 2. Not any improvement ‐ short term.
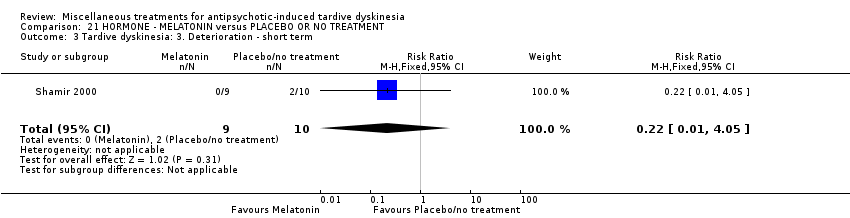
Comparison 21 HORMONE ‐ MELATONIN versus PLACEBO OR NO TREATMENT, Outcome 3 Tardive dyskinesia: 3. Deterioration ‐ short term.

Comparison 21 HORMONE ‐ MELATONIN versus PLACEBO OR NO TREATMENT, Outcome 4 Tardive dyskinesia: 3. Average scale score (AIMS, high=poor) ‐ medium term.
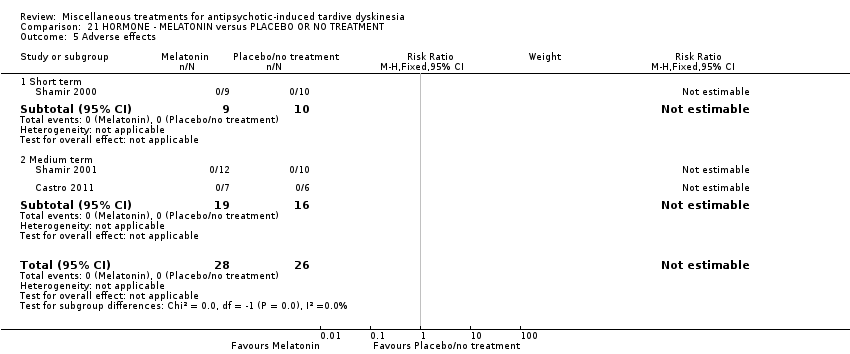
Comparison 21 HORMONE ‐ MELATONIN versus PLACEBO OR NO TREATMENT, Outcome 5 Adverse effects.

Comparison 21 HORMONE ‐ MELATONIN versus PLACEBO OR NO TREATMENT, Outcome 6 Leaving the study early.

Comparison 21 HORMONE ‐ MELATONIN versus PLACEBO OR NO TREATMENT, Outcome 7 Cognitive function: Average scale score ‐ medium term.
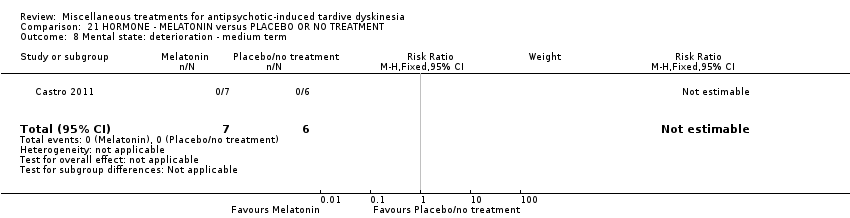
Comparison 21 HORMONE ‐ MELATONIN versus PLACEBO OR NO TREATMENT, Outcome 8 Mental state: deterioration ‐ medium term.
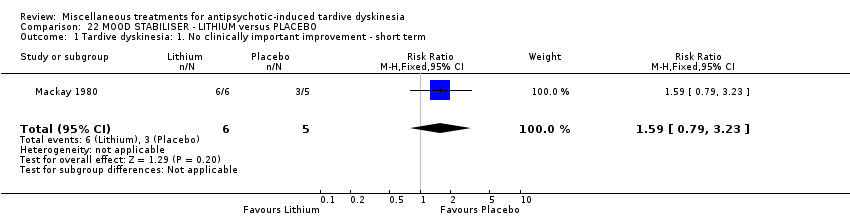
Comparison 22 MOOD STABILISER ‐ LITHIUM versus PLACEBO, Outcome 1 Tardive dyskinesia: 1. No clinically important improvement ‐ short term.

Comparison 22 MOOD STABILISER ‐ LITHIUM versus PLACEBO, Outcome 2 Tardive dyskinesia: 2. Not any improvement ‐ short term.

Comparison 22 MOOD STABILISER ‐ LITHIUM versus PLACEBO, Outcome 3 Tardive dyskinesia: 3. Deterioration ‐ short term.

Comparison 22 MOOD STABILISER ‐ LITHIUM versus PLACEBO, Outcome 4 Tardive dyskinesia: 3. Average scale score (AIMS, high=poor) ‐ short term.

Comparison 22 MOOD STABILISER ‐ LITHIUM versus PLACEBO, Outcome 5 Adverse events ‐ short term.
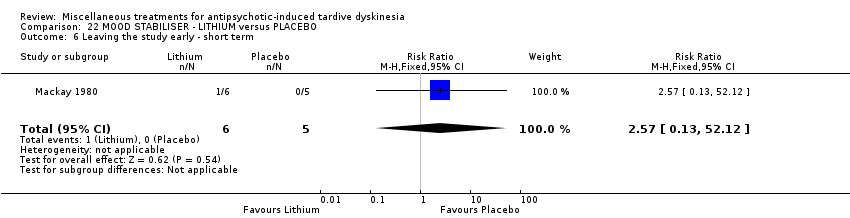
Comparison 22 MOOD STABILISER ‐ LITHIUM versus PLACEBO, Outcome 6 Leaving the study early ‐ short term.

Comparison 23 POLYPEPTIDE ‐ CERULETIDE versus PLACEBO, Outcome 1 Tardive dyskinesia: 1. Not any improvement.
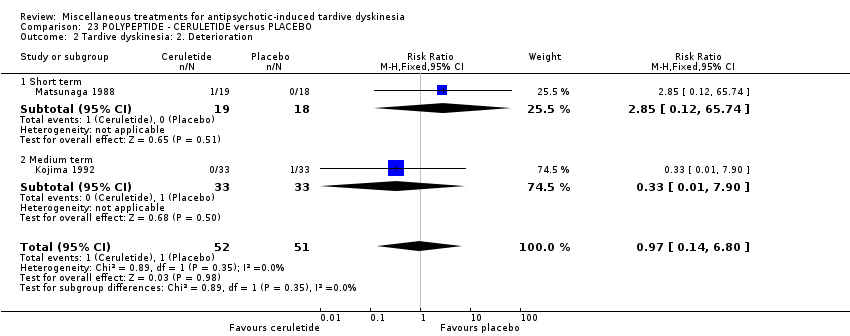
Comparison 23 POLYPEPTIDE ‐ CERULETIDE versus PLACEBO, Outcome 2 Tardive dyskinesia: 2. Deterioration.

Comparison 23 POLYPEPTIDE ‐ CERULETIDE versus PLACEBO, Outcome 3 Adverse effects.

Comparison 23 POLYPEPTIDE ‐ CERULETIDE versus PLACEBO, Outcome 4 Leaving the study early ‐ medium term.

Comparison 24 HYPNOSIS OR RELAXATION versus TREATMENT AS USUAL, Outcome 1 Tardive dyskinesia: 1. No clinically important improvement ‐ medium term.
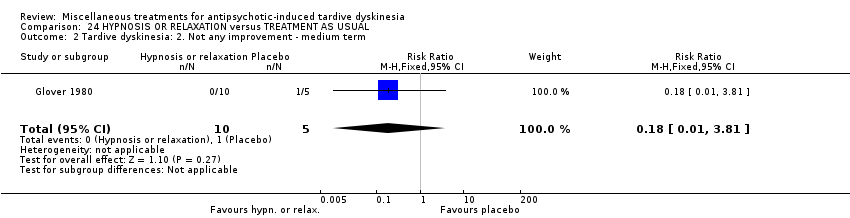
Comparison 24 HYPNOSIS OR RELAXATION versus TREATMENT AS USUAL, Outcome 2 Tardive dyskinesia: 2. Not any improvement ‐ medium term.
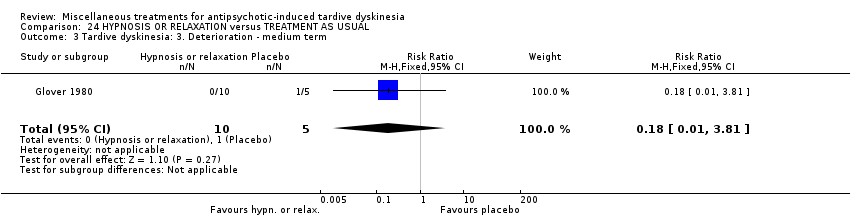
Comparison 24 HYPNOSIS OR RELAXATION versus TREATMENT AS USUAL, Outcome 3 Tardive dyskinesia: 3. Deterioration ‐ medium term.

Comparison 24 HYPNOSIS OR RELAXATION versus TREATMENT AS USUAL, Outcome 4 Leaving the study early ‐ medium term.
| Methods | Allocation: randomised, with sequence generation and concealment of allocation clearly described. |
| Participants | People with antipsychotic‐induced tardive dyskinesia.* |
| Interventions | 1. Active intervention. N = 150. |
| Outcomes | Tardive dyskinesia: any clinically important improvement in TD, any improvement, deterioration.*** |
| Notes | * This could be diagnosed by clinical decision. If funds were permitting all participants could be screened using operational criteria, otherwise a random sample should suffice. ** Size of study with sufficient power to highlight about a 10% difference between groups for primary outcome. |
| DIHYDROGENATED ERGOT ALKALOIDS versus PLACEBO for antipsychotic‐induced tardive dyskinesia | ||||||
| Patient or population: female and male 59‐80 (mean) years old patients with antipsychotic‐induced tardive dyskinesia | ||||||
| Outcomes | Illustrative comparative risks* (95% CI) | Relative effect | No of Participants | Quality of the evidence | Comments | |
| Assumed risk | Corresponding risk | |||||
| Placebo | DIHYDROGENATED ERGOT ALKALOIDS | |||||
| Tardive dyskinesia: No clinically important improvement | 786 per 1000 | 354 per 1000 | RR 0.45 | 28 | ⊕⊕⊝⊝ | |
| Tardive dyskinesia: Deterioration of symptoms follow‐up: 6 weeks | 71 per 1000 | 24 per 1000 | RR 0.33 | 28 | ⊕⊝⊝⊝ | |
| Adverse effects ‐ any adverse effect follow‐up: 6 weeks | 214 per 1000 | 499 per 1000 | RR 2.33 | 28 | ⊕⊝⊝⊝ | |
| Acceptability of treatment (measured by participants leaving the study early) follow‐up: 6 weeks | 42 per 1000 | 14 per 1000 | RR 0.33 | 48 | ⊕⊝⊝⊝ | |
| Social confidence, social inclusion, social networks, or personalised quality of life ‐ not reported | This outcome was not reported. | |||||
| *The risk in the intervention group (and its 95% confidence interval) is based on the assumed risk in the comparison group and the relative effect of the intervention (and its 95% CI). | ||||||
| GRADE Working Group grades of evidence | ||||||
| 1 Downgraded one step for risk of bias: randomisation procedure and allocation concealment were not adequately described. | ||||||
| LEVETIRACETAM versus PLACEBO for antipsychotic‐induced tardive dyskinesia | ||||||
| Patient or population: female and male 47‐54 years old (mean) patients with various psychiatric conditions and antipsychotic‐induced tardive dyskinesia | ||||||
| Outcomes | Illustrative comparative risks* (95% CI) | Relative effect | No of Participants | Quality of the evidence | Comments | |
| Assumed risk | Corresponding risk | |||||
| Placebo | LEVETIRACETAM | |||||
| Tardive dyskinesia: No clinically important improvement ‐ not reported | This outcome was not reported. | |||||
| Tardive dyskinesia: Deterioration of symptoms ‐ not reported | This outcome was not reported. | |||||
| Adverse effects ‐ any adverse effect follow‐up: 8 weeks | 457 per 1000 | 233 per 1000 | RR 0.51 | 69 | ⊕⊕⊝⊝ | |
| Acceptability of treatment (measured by participants leaving the study early) | 167 per 1000 | 168 per 1000 | RR 1.01 | 119 | ⊕⊝⊝⊝ | |
| Social confidence, social inclusion, social networks, or personalised quality of life ‐ not reported | This outcome was not reported. | |||||
| *The risk in the intervention group (and its 95% confidence interval) is based on the assumed risk in the comparison group and the relative effect of the intervention (and its 95% CI). | ||||||
| GRADE Working Group grades of evidence | ||||||
| 1 Downgraded one step for risk of bias: randomisation procedure, allocation concealment and blinding were not adequately described. | ||||||
| BUSPIRONE versus PLACEBO for antipsychotic‐induced tardive dyskinesia | ||||||
| Patient or population: female and male 33‐year old (mean) patients with schizophrenia and antipsychotic‐induced tardive dyskinesia | ||||||
| Outcomes | Anticipated absolute effects* (95% CI) | Relative effect | № of participants | Quality of the evidence | Comments | |
| Risk with placebo | Risk with buspirone | |||||
| Tardive dyskinesia: No clinically important improvement | 905 per 1,000 | 480 per 1,000 | RR 0.53 | 42 | ⊕⊕⊝⊝ | |
| Tardive dyskinesia: Deterioration of symptoms ‐ not reported | This outcome was not reported. | |||||
| Adverse effects ‐ not reported | This outcome was not reported. | |||||
| Acceptability of treatment (measured by participants leaving the study early) | not estimable | not estimable | RR not estimable | 42 | ⊕⊝⊝⊝ | No events were reported. |
| Social confidence, social inclusion, social networks, or personalised quality of life ‐ not reported | This outcome was not reported. | |||||
| *The risk in the intervention group (and its 95% confidence interval) is based on the assumed risk in the comparison group and the relative effect of the intervention (and its 95% CI). | ||||||
| GRADE Working Group grades of evidence | ||||||
| 1 Downgraded one step for risk of bias: randomisation procedure, allocation concealment and blinding were not adequately described. 2 Downgraded one step for imprecision: very small sample size and few events reported. 3 Downgraded two steps for imprecision: effect could not be estimated due to very small sample size with no events reported. | ||||||
| VMAT2‐inhibitor compared to placebo for antipsychotic‐induced tardive dyskinesia | ||||||
| Patient or population: 18 to 85 year‐old patients with schizophrenia, schizoaffective disorder, mood disorder, or gastrointestinal disorder + antipsychotic‐induced tardive dyskinesia | ||||||
| Outcomes | Illustrative comparative risks* (95% CI) | Relative effect | No of Participants | Quality of the evidence | Comments | |
| Assumed risk | Corresponding risk | |||||
| Placebo | VMAT2‐inhibitor | |||||
| Tardive dyskinesia: 1. No clinically important improvement | 826 per 1000 | 520 per 1000 | RR 0.63 | 92 | ⊕⊕⊕⊝ | |
| Adverse effects ‐ any adverse effect | 327 per 1000 | 490 per 1000 | RR 1.50 | 100 | ⊕⊕⊝⊝ | |
| Leaving the study early | 98 per 1000 | 98 per 1000 | RR 1.00 | 102 | ⊕⊝⊝⊝ | |
| *The basis for the assumed risk (e.g. the median control group risk across studies) is provided in footnotes. The corresponding risk (and its 95% confidence interval) is based on the assumed risk in the comparison group and the relative effect of the intervention (and its 95% CI). | ||||||
| GRADE Working Group grades of evidence | ||||||
| 1 Downgraded one step for imprecision: small sample size and few events reported | ||||||
| ETHYL‐EPA versus PLACEBO for antipsychotic‐induced tardive dyskinesia | ||||||
| Patient or population: female and male 42 (mean) years old patients with schizophrenia or schizoaffective disorder and antipsychotic‐induced tardive dyskinesia | ||||||
| Outcomes | Illustrative comparative risks* (95% CI) | Relative effect | No of Participants | Quality of the evidence | Comments | |
| Assumed risk | Corresponding risk | |||||
| Placebo | ETHYL‐EPA | |||||
| Tardive dyskinesia: No clinically important improvement ‐ not reported | This outcome was not reported. | |||||
| Tardive dyskinesia: Deterioration of symptoms ‐ not reported | This outcome was not reported. | |||||
| Adverse effects: EPS: parkinsonism measured by average ESRS change scores follow‐up: 12 weeks | mean: ‐1.1 (3.3) | The mean change in ESRS: parkinsonism scale score in the ethyl‐EPA group was | MD 0.30 (‐1.17 to 1.77) | 75 (1 RCT) | ⊕⊕⊝⊝ | |
| Adverse effects: EPS: dystonia measured by average ESRS change scores follow‐up: 12 weeks | mean: 0.4 (0.5) | The mean change in ESRS: dystonia scale score in the ethyl‐EPA group was | MD ‐0.35 (‐0.58 to ‐0.12) | 75 (1 RCT) | ⊕⊕⊝⊝ | |
| Adverse effects: EPS: akathisia measured by average ESRS change scores follow‐up: 12 weeks | mean: ‐0.06 (0.7) | The mean change in ESRS: akathisia scale score in the ethyl‐EPA group was | MD ‐0.04 (‐0.30 to 0.22) | 75 (1 RCT) | ⊕⊝⊝⊝ | |
| Acceptability of treatment (measured by participants leaving the study early) follow‐up: 12 weeks | 548 per 1000 | 214 per 1000 | RR 0. 57 | 84 | ⊕⊝⊝⊝ | |
| Social confidence, social inclusion, social networks, or personalised quality of life ‐ not reported | This outcome was not reported. | |||||
| *The risk in the intervention group (and its 95% confidence interval) is based on the assumed risk in the comparison group and the relative effect of the intervention (and its 95% CI). | ||||||
| GRADE Working Group grades of evidence | ||||||
| 1 Downgraded one step for risk of bias: randomisation procedure, allocation concealment and blinding were not adequately described. | ||||||
| GINKGO BILOBA versus PLACEBO for antipsychotic‐induced tardive dyskinesia | ||||||
| Patient or population: male 45.2 (mean) years old patients with schizophrenia and antipsychotic‐induced tardive dyskinesia | ||||||
| Outcomes | Illustrative comparative risks* (95% CI) | Relative effect | No of Participants | Quality of the evidence | Comments | |
| Assumed risk | Corresponding risk | |||||
| Placebo | GINKGO BILOBA | |||||
| Tardive dyskinesia: No clinically important improvement | 987 per 1000 | 869 per 1000 | RR 0.88 | 157 | ⊕⊕⊕⊝ | |
| Tardive dyskinesia: Deterioration of symptoms ‐ not reported | This outcome was not reported. | |||||
| Adverse effects ‐ not reported | This outcome was not reported. | |||||
| Acceptability of treatment (measured by participants leaving the study early) | 51 per 1000 | 13 per 1000 | RR 0.25 | 157 | ⊕⊝⊝⊝ | |
| Social confidence, social inclusion, social networks, or personalised quality of life ‐ not reported | This outcome was not reported. | |||||
| *The risk in the intervention group (and its 95% confidence interval) is based on the assumed risk in the comparison group and the relative effect of the intervention (and its 95% CI). | ||||||
| GRADE Working Group grades of evidence | ||||||
| 1 Downgraded one step for imprecision: small sample size and few events reported. | ||||||
| MELATONIN versus PLACEBO OR NO TREATMENT for antipsychotic‐induced tardive dyskinesia | ||||||
| Patient or population: female and male 28 to 91 years old patients with antipsychotic‐induced tardive dyskinesia | ||||||
| Outcomes | Illustrative comparative risks* (95% CI) | Relative effect | No of Participants | Quality of the evidence | Comments | |
| Assumed risk | Corresponding risk | |||||
| Placebo/no treatment | MELATONIN | |||||
| Tardive dyskinesia: No clinically important improvement | 1000 per 1000 | 890 per 1000 | RR 0.89 | 32 | ⊕⊕⊝⊝ | |
| Tardive dyskinesia: Deterioration of symptoms follow‐up: 3 weeks | 200 per 1000 | 44 per 1000 | RR 0.22 | 19 | ⊕⊕⊝⊝ | |
| Adverse effects follow‐up: 3‐12 weeks | See comment | See comment | Not estimable | 54 | ⊕⊕⊝⊝ | No events were reported. |
| Acceptability of treatment (measured by participants leaving the study early) | See comment | See comment | Not estimable | 54 | ⊕⊝⊝⊝ | No events were reported. |
| Social confidence, social inclusion, social networks, or personalised quality of life ‐ not reported | This outcome was not reported. | |||||
| *The risk in the intervention group (and its 95% confidence interval) is based on the assumed risk in the comparison group and the relative effect of the intervention (and its 95% CI). | ||||||
| GRADE Working Group grades of evidence | ||||||
| 1 Downgraded one step for inconsistency: substantial heterogeneity (I2 = 46%). | ||||||
| CERULETIDE versus PLACEBO for antipsychotic‐induced tardive dyskinesia | ||||||
| Patient or population: female and male 55‐59 year old (mean) patients with various psychiatric conditions and antipsychotic‐induced tardive dyskinesia | ||||||
| Outcomes | Illustrative comparative risks* (95% CI) | Relative effect | No of Participants | Quality of the evidence | Comments | |
| Assumed risk | Corresponding risk | |||||
| Placebo | CERULETIDE | |||||
| Tardive dyskinesia: No clinically important improvement ‐ not reported | This outcome was not reported. | |||||
| Tardive dyskinesia: Deterioration of symptoms follow‐up: 4‐8 weeks | 20 per 1000 | 19 per 1000 | RR 0.97 | 103 | ⊕⊕⊝⊝ | |
| Adverse effects ‐ any adverse effect follow‐up: 4‐8 weeks | 233 per 1000 | 308 per 1000 | RR 1.32 | 122 | ⊕⊕⊝⊝ | |
| Acceptability of treatment (measured by participants leaving the study early) follow‐up: 8 weeks | 214 per 1000 | 234 per 1000 | RR 1.09 | 85 | ⊕⊝⊝⊝ | |
| Social confidence, social inclusion, social networks, or personalised quality of life ‐ not reported | This outcome was not reported. | |||||
| *The risk in the intervention group (and its 95% confidence interval) is based on the assumed risk in the comparison group and the relative effect of the intervention (and its 95% CI). | ||||||
| GRADE Working Group grades of evidence | ||||||
| 1 Downgraded one step for risk of bias: unclear methods of randomisation, blinding not assessed, and potential introduction of detection bias due to subjective nature of outcome assessments. 3 Downgraded one step for indirectness: leaving the study early can give an indication, but is not a direct measurement, of treatment acceptability. | ||||||
| HYPNOSIS OR RELAXATION versus TAU for antipsychotic‐induced tardive dyskinesia | ||||||
| Patients or population: female and male 35 (mean) years old patients with schizophrenia and tardive dyskinesia, acute extrapyramidal symptoms, and/or pseudoparkinsonism | ||||||
| Outcomes | Anticipated absolute effects* (95% CI) | Relative effect | № of participants | Quality of the evidence | Comments | |
| Risk with TAU | Risk with hypnosis or relaxation | |||||
| Tardive dyskinesia: No clinically important improvement | 1,000 per 1,000 | 450 per 1,000 | RR 0.45 | 15 | ⊕⊝⊝⊝ | |
| Tardive dyskinesia: Deterioration of symptoms | 200 per 1,000 | 36 per 1,000 | RR 0.18 | 15 | ⊕⊝⊝⊝ | |
| Adverse effects ‐ not reported | This outcome was not reported. | |||||
| Acceptability of treatment (measured by participants leaving the study early) | 0 per 1,000 | 0 per 1,000 | not estimable | 15 | ⊕⊝⊝⊝ | No events were reported. |
| Social confidence, social inclusion, social networks, or personalised quality of life ‐ not reported | This outcome was not reported. | |||||
| *The risk in the intervention group (and its 95% confidence interval) is based on the assumed risk in the comparison group and the relative effect of the intervention (and its 95% CI). | ||||||
| GRADE Working Group grades of evidence | ||||||
| 1 Downgraded two steps for risk of bias: fully randomised sequence generation and blinding was not achieved. | ||||||
| Review | Citation |
| Anticholinergics | |
| Benzodiazepines | |
| Calcium‐channel blockers | |
| Cholinergics | |
| GABAergic compounds | |
| Neuroleptic medications (including dose reduction and cessation) | |
| Non‐neuroleptic compounds that impact on the dopamine and noradrenaline systems (catecholaminergics) | |
| Vitamin E | |
| This review, Miscellaneous treatments |
| Study | N and setting | Condition | Sex and age | Intervention and duration | Comparison | Outcomes |
| 20 outpatients in the USA | schizophrenia + TD | F+M | Isocarboxazid + AP | Procyclidine + AP | TD symptoms, AEs | |
| 57 participants, setting not reported | TD | F+M | L‐stepholidine + AP | Placebo + AP | TD symptoms, AEs, mental state | |
| 13 in‐ and outpatients in Venezuela | various psychiatric conditions + TD | F+M | Melatonin + AP | Placebo + AP | TD symptoms, AEs, mental state | |
| 84 in‐ and outpatients in South Africa | schizophrenia or schizoaffective disorder + TD | F+M | Omega‐3 fatty acid + AP | Placebo + AP | TD symptoms, AEs, mental state | |
| 22 inpatients in the USA | schizophrenia, dementia + TD | F+M | Papaverine + AP | TAU + AP | TD symptoms | |
| 12 outpatients in the USA | various psychiatric conditions + TD | F | Oestrogen + AP | Placebo + AP | TD symptoms, AEs | |
| Glover 1982 | 15 outpatients in the USA | schizophrenia + TD or EPS | F+M | Hypnosis or relaxation + AP | TAU + AP | TD symptoms |
| 33 outpatients in the USA | TD | F+M | Selengiline + AP | Placebo + AP | TD symptoms | |
| 20 inpatients in the UK | various psychiatric conditions + TD | F+M | Ergoloid mesylates + AP | Placebo + AP | TD symptoms | |
| 85 in‐ and outpatients in Japan | schizophrenia + TD | F+M | Ceruletide + AP | Placebo + AP | TD symptoms, AEs | |
| 42 inpatients in Japan | various psychiatric conditions + TD | F+M | Cyproheptadine + AP | Placebo + AP | TD symptoms, AEs | |
| 28 inpatients in Japan | schizophrenia + TD | F+M | Ergoloid mesylates + AP | Placebo + AP | TD symptoms, AEs, mental state | |
| 40 inpatients in Israel | schizophrenia or schizoaffective disorder + TD | F+M | Piracetam + AP | Placebo + AP | TD symptoms, AEs, global state | |
| 11 inpatients in the UK | various psychiatric conditions + TD | NR | Lithium + AP | Placebo + AP | TD symptoms, AEs | |
| 37 inpatients in Japan | various psychiatric conditions + TD | F+M | Ceruletide + AP | Placebo + AP | TD symptoms, AEs | |
| 10 inpatients in Italy | schizophrenia + TD | F+M | Ritanserin + AP | Placebo + AP | TD symptoms, AEs, mental state | |
| 18 in‐ and outpatients in the USA | schizophrenia + TD | M | Phenylalanine + AP | Placebo + AP | Leaving the study early | |
| 20 inpatients in Morocco | schizophrenia + TD | F+M | Insulin + AP | Placebo + AP | TD symptoms | |
| 88 in‐ and outpatients in the USA | various psychiatric conditions + TD | NR | NBI‐98854 (VMAT2 inhibitor valbenazine) + AP | Placebo + AP | TD symptoms, AEs | |
| 40 inpatients in the UK | various psychiatric conditions + TD | F+M | Ergoloid mesylates + AP | Placebo + AP | TD symptoms | |
| 52 in‐ and outpatients in the USA | various psychiatric conditions + TD | M | Branched‐chain amino acids + AP | Placebo + AP | TD symptoms | |
| 19 inpatients in Israel | schizophrenia + TD | F+M | Melatonin + AP | Placebo + AP | TD symptoms, AEs | |
| 22 inpatients in Israel | schizophrenia + TD | F+M | Melatonin + AP | Placebo + AP | AEs | |
| 76 inpatients in China | TD | F+M | Melatonin + AP | TAU + AP | Cognitive function | |
| 69 inpatients in Belgium and Bulgaria | TD | F+M | Levetiracetam + AP | Placebo + AP | TD symptoms, AEs | |
| 16 in‐ and outpatients in the USA | schizophrenia + TD | M | Evening primrose oil + AP | Placebo + AP | TD symptoms, mental state | |
| 50 outpatients in the USA | various psychiatric conditions + TD | F+M | Levetiracetam + AP | Placebo + AP | TD symptoms, mental state | |
| 34 inpatients in China | schizophrenia + TD | F+M | Promethazine + AP | Placebo + AP | TD symptoms, AEs, mental state, global state | |
| 42 inpatients in China | schizophrenia + TD | F+M | Buspirone + AP | Placebo + AP | TD symptoms | |
| 46 inpatients in China | schizophrenia + TD | F+M | Pemoline + AP | Placebo + AP | TD symptoms | |
| 157 inpatients in China | schizophrenia + TD | M | Ginkgo biloba + AP | Placebo + AP | TD symptoms, mental state, cognitive function | |
| AE = adverse effects, AP = antipsychotics, EPS = extrapyramidal symptoms, F = female, M = male, m = mean, N = number, TAU = treatment as usual, TD = tardive dyskinesia | ||||||
| Outcome or subgroup title | No. of studies | No. of participants | Statistical method | Effect size |
| 1 Tardive dyskinesia: 1. No clinically important improvement ‐ medium term Show forest plot | 1 | 28 | Risk Ratio (M‐H, Fixed, 95% CI) | 0.45 [0.21, 0.97] |
| 2 Tardive dyskinesia: 2. Not any improvement ‐ medium term Show forest plot | 1 | 28 | Risk Ratio (M‐H, Fixed, 95% CI) | 0.5 [0.23, 1.09] |
| 3 Tardive dyskinesia: 3. Deterioration ‐ medium term Show forest plot | 1 | 28 | Risk Ratio (M‐H, Fixed, 95% CI) | 0.33 [0.01, 7.55] |
| 4 Tardive dyskinesia: 3. Average endpoint scale score (Simpson scale, high=poor) ‐ medium term Show forest plot | 1 | 28 | Mean Difference (IV, Fixed, 95% CI) | ‐2.80 [‐12.25, 6.65] |
| 5 Tardive dyskinesia: Average scale change scores (various scales, high=poor) ‐ medium term Show forest plot | 2 | 59 | Std. Mean Difference (IV, Fixed, 95% CI) | ‐0.31 [‐0.83, 0.20] |
| 5.1 AIMS+RTDS | 1 | 40 | Std. Mean Difference (IV, Fixed, 95% CI) | ‐0.31 [‐0.93, 0.32] |
| 5.2 ADS | 1 | 19 | Std. Mean Difference (IV, Fixed, 95% CI) | ‐0.33 [‐1.24, 0.57] |
| 6 Mental state: Deterioration ‐ medium term Show forest plot | 1 | 28 | Risk Ratio (M‐H, Fixed, 95% CI) | 0.5 [0.05, 4.90] |
| 7 Adverse events ‐ medium term Show forest plot | 1 | 28 | Risk Ratio (M‐H, Fixed, 95% CI) | 2.33 [0.75, 7.23] |
| 8 Leaving the study early ‐ medium term Show forest plot | 2 | 48 | Risk Ratio (M‐H, Fixed, 95% CI) | 0.33 [0.02, 7.32] |
| Outcome or subgroup title | No. of studies | No. of participants | Statistical method | Effect size |
| 1 Tardive dyskinesia: 1. No clinically important improvement ‐ medium term Show forest plot | 1 | 57 | Risk Ratio (M‐H, Fixed, 95% CI) | 0.54 [0.35, 0.82] |
| 2 Mental state: 1. Average endpoint scale score (BPRS, high=poor) ‐ medium term Show forest plot | 1 | 20 | Mean Difference (IV, Fixed, 95% CI) | ‐4.5 [‐7.60, ‐1.40] |
| 3 Adverse events: any adverse events ‐ medium term Show forest plot | 1 | 57 | Risk Ratio (M‐H, Fixed, 95% CI) | 0.0 [0.0, 0.0] |
| 4 Leaving the study early ‐ medium term Show forest plot | 1 | 57 | Risk Ratio (M‐H, Fixed, 95% CI) | 0.0 [0.0, 0.0] |
| Outcome or subgroup title | No. of studies | No. of participants | Statistical method | Effect size |
| 1 Tardive dyskinesia: 3. Average scale score (AIMS, high=poor) ‐ medium term Show forest plot | 1 | 22 | Mean Difference (IV, Fixed, 95% CI) | 0.51 [‐1.18, 2.20] |
| Outcome or subgroup title | No. of studies | No. of participants | Statistical method | Effect size |
| 1 Tardive dyskinesia: 1. No clinically important improvement ‐ short term Show forest plot | 1 | 52 | Risk Ratio (M‐H, Fixed, 95% CI) | 0.79 [0.63, 1.00] |
| 2 Tardive dyskinesia: 1. Not any improvement ‐ short term Show forest plot | 1 | 52 | Risk Ratio (M‐H, Fixed, 95% CI) | 0.64 [0.36, 1.11] |
| 3 Tardive dyskinesia: 2. Deterioration ‐ short term Show forest plot | 1 | 36 | Risk Ratio (M‐H, Fixed, 95% CI) | 0.29 [0.07, 1.19] |
| 4 Tardive dyskinesia: Average endpoint score (Simpson scale, high=poor) ‐ short term Show forest plot | 1 | 41 | Mean Difference (IV, Fixed, 95% CI) | ‐92.9 [‐167.57, ‐18.23] |
| 5 Leaving the study early ‐ short term Show forest plot | 1 | 52 | Risk Ratio (M‐H, Fixed, 95% CI) | 0.84 [0.37, 1.92] |
| Outcome or subgroup title | No. of studies | No. of participants | Statistical method | Effect size |
| 1 Leaving the study early ‐ short term Show forest plot | 1 | 18 | Risk Ratio (M‐H, Fixed, 95% CI) | 2.45 [0.11, 53.25] |
| Outcome or subgroup title | No. of studies | No. of participants | Statistical method | Effect size |
| 1 Tardive dyskinesia: 1. No clinically important improvement ‐ medium term Show forest plot | 1 | 33 | Risk Ratio (M‐H, Fixed, 95% CI) | 1.37 [0.96, 1.94] |
| 2 Leaving the study early ‐ medium term Show forest plot | 1 | 33 | Risk Ratio (M‐H, Fixed, 95% CI) | 10.39 [0.62, 173.97] |
| Outcome or subgroup title | No. of studies | No. of participants | Statistical method | Effect size |
| 1 Tardive dyskinesia: 1. No clinically important improvement ‐ long term Show forest plot | 1 | 20 | Risk Ratio (M‐H, Fixed, 95% CI) | 0.24 [0.08, 0.71] |
| 2 Tardive dyskinesia: 1. Not any improvement ‐ long term Show forest plot | 1 | 20 | Risk Ratio (M‐H, Fixed, 95% CI) | 0.14 [0.03, 0.64] |
| 3 Adverse effects ‐ long term Show forest plot | 1 | 20 | Risk Ratio (M‐H, Fixed, 95% CI) | 3.0 [0.14, 65.90] |
| 4 Leaving the study early ‐ long term Show forest plot | 1 | 20 | Risk Ratio (M‐H, Fixed, 95% CI) | 3.0 [0.14, 65.90] |
| Outcome or subgroup title | No. of studies | No. of participants | Statistical method | Effect size |
| 1 Tardive dyskinesia: No clinically important improvement (short term) Show forest plot | 1 | 10 | Risk Ratio (M‐H, Fixed, 95% CI) | 1.0 [0.70, 1.43] |
| 2 Tardive dyskinesia: Not any improvement (short term) Show forest plot | 1 | 10 | Risk Ratio (IV, Fixed, 95% CI) | 0.28 [0.02, 4.66] |
| 3 Tardive dyskinesia: Deterioration (short term) Show forest plot | 1 | 10 | Risk Ratio (IV, Fixed, 95% CI) | 0.47 [0.02, 9.26] |
| 4 Tardive dyskinesia: Average change score (AIMS, high=poor) (short term) Show forest plot | 1 | 10 | Mean Difference (IV, Fixed, 95% CI) | ‐2.0 [‐5.93, 1.93] |
| 5 General mental state: Deterioration (short term) Show forest plot | 1 | 10 | Risk Ratio (IV, Fixed, 95% CI) | 0.47 [0.02, 9.26] |
| 6 General mental state: Average change score (BPRS, high=poor) (short term) Show forest plot | 1 | 10 | Mean Difference (IV, Fixed, 95% CI) | ‐0.80 [‐3.10, 1.50] |
| Outcome or subgroup title | No. of studies | No. of participants | Statistical method | Effect size |
| 1 Tardive dyskinesia: 1. Average endpoint score (AIMS, high=poor) ‐ medium term Show forest plot | 1 | 50 | Mean Difference (IV, Fixed, 95% CI) | ‐2.18 [‐3.65, ‐0.71] |
| 2 Tardive dyskinesia: 1. Average change score (hyperkinesia subscale of the SHRS , high=poor) ‐ medium term Show forest plot | 1 | 69 | Mean Difference (IV, Fixed, 95% CI) | 0.13 [‐0.73, 0.99] |
| 3 Leaving the study early ‐ medium term Show forest plot | 2 | 119 | Risk Ratio (M‐H, Fixed, 95% CI) | 1.01 [0.46, 2.22] |
| 4 Adverse effects ‐ medium term Show forest plot | 1 | 69 | Risk Ratio (M‐H, Fixed, 95% CI) | 0.51 [0.25, 1.04] |
| 5 Mental state: deterioration ‐ medium term Show forest plot | 1 | 50 | Risk Ratio (M‐H, Fixed, 95% CI) | 0.67 [0.12, 3.65] |
| Outcome or subgroup title | No. of studies | No. of participants | Statistical method | Effect size |
| 1 Tardive dyskinesia: 2. Not any improvement ‐ short term Show forest plot | 1 | 42 | Risk Ratio (M‐H, Fixed, 95% CI) | 0.54 [0.27, 1.08] |
| 2 Tardive dyskinesia: 3. Deterioration ‐ short term Show forest plot | 1 | 42 | Risk Ratio (M‐H, Fixed, 95% CI) | 0.33 [0.01, 7.74] |
| 3 Adverse events ‐ short term Show forest plot | 1 | 42 | Risk Ratio (M‐H, Fixed, 95% CI) | 0.33 [0.04, 2.95] |
| 4 Leaving the study early ‐ short term Show forest plot | 1 | 42 | Risk Ratio (M‐H, Fixed, 95% CI) | 0.33 [0.01, 7.74] |
| Outcome or subgroup title | No. of studies | No. of participants | Statistical method | Effect size |
| 1 Tardive dyskinesia: No clinically important improvement (medium term) Show forest plot | 1 | 34 | Risk Ratio (M‐H, Fixed, 95% CI) | 0.24 [0.11, 0.55] |
| 2 Tardive dyskinesia: Not any improvement (medium term) Show forest plot | 1 | 34 | Risk Ratio (IV, Fixed, 95% CI) | 0.06 [0.01, 0.43] |
| 3 Tardive dyskinesia: Average endpoint score (AIMS, high=poor) (medium term) Show forest plot | 1 | 34 | Mean Difference (IV, Fixed, 95% CI) | ‐7.10 [‐9.53, ‐4.67] |
| 4 General mental state: Average endpoint score (BPRS, high=poor) (medium term) Show forest plot | 1 | 34 | Mean Difference (IV, Fixed, 95% CI) | 0.70 [‐3.77, 5.17] |
| 5 Adverse effects: Any adverse effects (TESS, high=poor) (medium term) Show forest plot | 1 | 34 | Mean Difference (IV, Fixed, 95% CI) | ‐0.10 [‐0.53, 0.33] |
| 6 Adverse effects: Parkinsonism ‐ Average endpoint score (RSESE) (medium term) Show forest plot | 1 | 34 | Mean Difference (IV, Fixed, 95% CI) | ‐0.5 [‐1.36, 0.36] |
| 7 Global state: Average endpoint score (CGI, high=poor) (medium term) Show forest plot | 1 | 34 | Mean Difference (IV, Fixed, 95% CI) | ‐1.00 [‐3.78, ‐2.22] |
| Outcome or subgroup title | No. of studies | No. of participants | Statistical method | Effect size |
| 1 Tardive dyskinesia: 1. No clinically important improvement ‐ medium term Show forest plot | 1 | 42 | Risk Ratio (M‐H, Fixed, 95% CI) | 0.53 [0.33, 0.84] |
| 2 Tardive dyskinesia: 2. Not any improvement ‐ medium term Show forest plot | 1 | 42 | Risk Ratio (M‐H, Fixed, 95% CI) | 0.33 [0.15, 0.75] |
| 3 Tardive dyskinesia: 3. Average scale score (AIMS, high=poor) ‐ medium term Show forest plot | 1 | 42 | Mean Difference (IV, Fixed, 95% CI) | 0.0 [‐1.45, 1.45] |
| 4 Leaving the study early ‐ medium term Show forest plot | 1 | 42 | Risk Ratio (M‐H, Fixed, 95% CI) | 0.0 [0.0, 0.0] |
| Outcome or subgroup title | No. of studies | No. of participants | Statistical method | Effect size |
| 1 Tardive dyskinesia: 1. Average endpoint score (ESRS, high=poor) ‐ short term Show forest plot | 1 | 35 | Mean Difference (IV, Fixed, 95% CI) | ‐0.70 [‐4.30, 2.90] |
| 2 Parkinsonism: 1. Average endpoint score (ESRS, high=poor) ‐ short term Show forest plot | 1 | 35 | Mean Difference (IV, Fixed, 95% CI) | 2.5 [‐4.73, 9.73] |
| 3 Leaving the study early ‐ short term Show forest plot | 1 | 40 | Risk Ratio (M‐H, Fixed, 95% CI) | 0.23 [0.03, 1.85] |
| 4 Global state: Average endpoint score (CGI, high=poor) ‐ short term Show forest plot | 1 | 35 | Mean Difference (IV, Fixed, 95% CI) | 0.20 [‐0.35, 0.75] |
| Outcome or subgroup title | No. of studies | No. of participants | Statistical method | Effect size |
| 1 Tardive dyskinesia: 1. No clinically important improvement ‐ medium term Show forest plot | 1 | 46 | Risk Ratio (M‐H, Fixed, 95% CI) | 0.48 [0.29, 0.77] |
| 2 Tardive dyskinesia: 2. Not any improvement ‐ medium term Show forest plot | 1 | 46 | Risk Ratio (M‐H, Fixed, 95% CI) | 0.29 [0.13, 0.66] |
| 3 Tardive dyskinesia: 3. Average scale score (AIMS, high=poor) ‐ medium term Show forest plot | 1 | 46 | Mean Difference (IV, Fixed, 95% CI) | ‐3.90 [‐5.47, ‐2.33] |
| 4 Leaving the study early ‐ medium term Show forest plot | 1 | 46 | Risk Ratio (M‐H, Fixed, 95% CI) | 0.0 [0.0, 0.0] |
| Outcome or subgroup title | No. of studies | No. of participants | Statistical method | Effect size |
| 1 Tardive dyskinesia: 1. No clinically important improvement ‐ medium term Show forest plot | 1 | 92 | Risk Ratio (M‐H, Fixed, 95% CI) | 0.63 [0.46, 0.86] |
| 2 Tardive dyskinesia: 3. Average change score (AIMS, high=poor) ‐ medium term Show forest plot | 1 | 89 | Mean Difference (IV, Fixed, 95% CI) | ‐2.5 [‐2.00, ‐1.00] |
| 3 Adverse events ‐ medium term Show forest plot | 1 | 100 | Risk Ratio (M‐H, Fixed, 95% CI) | 1.50 [0.92, 2.45] |
| 4 Leaving the study early ‐ medium term Show forest plot | 1 | 102 | Risk Ratio (M‐H, Fixed, 95% CI) | 1.0 [0.31, 3.25] |
| Outcome or subgroup title | No. of studies | No. of participants | Statistical method | Effect size |
| 1 Tardive dyskinesia: 2. No clinically important improvement ‐ medium term Show forest plot | 1 | 75 | Risk Ratio (M‐H, Fixed, 95% CI) | 0.82 [0.57, 1.18] |
| 2 Mental state: deterioration ‐ medium term Show forest plot | 1 | 75 | Risk Ratio (M‐H, Fixed, 95% CI) | 0.49 [0.05, 5.14] |
| 3 Adverse events: Parkinsonism ‐ Average change in scale score (ESRS, low=better) ‐ medium term Show forest plot | 1 | 75 | Mean Difference (IV, Fixed, 95% CI) | 0.30 [‐1.17, 1.77] |
| 4 Adverse events: Dystonia ‐ Average change in scale score (ESRS, low=better) ‐ medium term Show forest plot | 1 | 75 | Mean Difference (IV, Fixed, 95% CI) | ‐0.35 [‐0.58, ‐0.12] |
| 5 Adverse events: Akathisia ‐ Average change in scale score (ESRS, low=better) ‐ medium term Show forest plot | 1 | 75 | Mean Difference (IV, Fixed, 95% CI) | ‐0.04 [‐0.30, 0.22] |
| 6 Leaving the study early ‐ medium term Show forest plot | 1 | 84 | Risk Ratio (M‐H, Fixed, 95% CI) | 0.57 [0.27, 1.22] |
| Outcome or subgroup title | No. of studies | No. of participants | Statistical method | Effect size |
| 1 Tardive dyskinesia: 1. No clinically important improvement ‐ medium term Show forest plot | 1 | 16 | Risk Ratio (M‐H, Fixed, 95% CI) | 1.0 [0.69, 1.45] |
| 2 Tardive dyskinesia: 2. Not any improvement ‐ medium term Show forest plot | 1 | 16 | Risk Ratio (M‐H, Fixed, 95% CI) | 0.75 [0.24, 2.33] |
| 3 Tardive dyskinesia: 3. Deterioration ‐ medium term Show forest plot | 1 | 16 | Risk Ratio (M‐H, Fixed, 95% CI) | 1.5 [0.34, 6.70] |
| 4 Tardive dyskinesia: 1. Average change in scale score (AIMS, high=poor) ‐ medium term Show forest plot | 1 | 16 | Mean Difference (IV, Fixed, 95% CI) | ‐0.20 [‐3.10, 2.70] |
| 5 Mental state: 2. Average change in scale score (BPRS, high=poor) ‐ medium term Show forest plot | 1 | 10 | Mean Difference (IV, Fixed, 95% CI) | ‐6.0 [‐15.99, 3.99] |
| 6 Leaving the study early ‐ medium term Show forest plot | 1 | 16 | Risk Ratio (M‐H, Fixed, 95% CI) | 0.0 [0.0, 0.0] |
| Outcome or subgroup title | No. of studies | No. of participants | Statistical method | Effect size |
| 1 Tardive dyskinesia: 1. No clinically important improvement ‐ medium term Show forest plot | 1 | 157 | Risk Ratio (M‐H, Fixed, 95% CI) | 0.88 [0.81, 0.96] |
| 2 Tardive dyskinesia: 2. Not any improvement ‐ medium term Show forest plot | 1 | 157 | Risk Ratio (M‐H, Fixed, 95% CI) | 0.51 [0.41, 0.65] |
| 3 Tardive dyskinesia: 3. Average scale score (AIMS, high=poor) ‐ medium term Show forest plot | 1 | 157 | Mean Difference (IV, Fixed, 95% CI) | ‐2.06 [‐2.94, ‐1.18] |
| 4 Leaving the study early ‐ medium term Show forest plot | 1 | 157 | Risk Ratio (M‐H, Fixed, 95% CI) | 0.25 [0.03, 2.22] |
| 5 Mental state: deterioration ‐ medium term Show forest plot | 1 | 157 | Risk Ratio (M‐H, Fixed, 95% CI) | 0.34 [0.01, 8.16] |
| 6 Mental state: 1. Average endpoint scale score (PANSS total, high=poor) ‐ medium term Show forest plot | 1 | 157 | Mean Difference (IV, Fixed, 95% CI) | ‐3.30 [‐6.51, ‐0.09] |
| 7 Cognitive function: CPT‐37 ‐ proportion correct responses (high=better) ‐ medium term Show forest plot | 1 | 119 | Mean Difference (IV, Fixed, 95% CI) | ‐0.02 [‐0.10, 0.06] |
| Outcome or subgroup title | No. of studies | No. of participants | Statistical method | Effect size |
| 1 Tardive dyskinesia: 1. No clinically important improvement ‐ short term Show forest plot | 1 | 12 | Risk Ratio (M‐H, Fixed, 95% CI) | 1.18 [0.76, 1.83] |
| 2 Tardive dyskinesia: 2. Not any improvement ‐ short term Show forest plot | 1 | 12 | Risk Ratio (M‐H, Fixed, 95% CI) | 0.33 [0.05, 2.37] |
| 3 Tardive dyskinesia: 3. Deterioration ‐ short term Show forest plot | 1 | 10 | Risk Ratio (M‐H, Fixed, 95% CI) | 0.2 [0.01, 3.35] |
| 4 Tardive dyskinesia: 4. Average scale score (AIMS, high=poor) ‐ short term Show forest plot | 1 | 10 | Mean Difference (IV, Fixed, 95% CI) | ‐1.2 [‐4.18, 1.78] |
| 5 Adverse effects ‐ short term Show forest plot | 1 | 12 | Risk Ratio (M‐H, Fixed, 95% CI) | 0.33 [0.02, 6.86] |
| 6 Leaving the study early ‐ short term Show forest plot | 1 | 12 | Risk Ratio (M‐H, Fixed, 95% CI) | 1.0 [0.08, 12.56] |
| Outcome or subgroup title | No. of studies | No. of participants | Statistical method | Effect size |
| 1 Tardive dyskinesia: 1. No clinically important improvement ‐ medium term Show forest plot | 1 | 20 | Risk Ratio (M‐H, Fixed, 95% CI) | 0.52 [0.29, 0.96] |
| 2 Tardive dyskinesia: 2. Not any improvement ‐ medium term Show forest plot | 1 | 20 | Risk Ratio (M‐H, Fixed, 95% CI) | 0.06 [0.00, 0.90] |
| 3 Tardive dyskinesia: 3. Deterioration ‐ medium term Show forest plot | 1 | 20 | Risk Ratio (M‐H, Fixed, 95% CI) | 0.14 [0.01, 2.45] |
| 4 Tardive dyskinesia: 3. Average scale score (AIMS, high=poor) ‐ medium term Show forest plot | 1 | 20 | Mean Difference (IV, Fixed, 95% CI) | ‐6.20 [‐10.53, ‐1.87] |
| 5 Leaving the study early ‐ medium term Show forest plot | 1 | 20 | Risk Ratio (M‐H, Fixed, 95% CI) | 0.0 [0.0, 0.0] |
| Outcome or subgroup title | No. of studies | No. of participants | Statistical method | Effect size |
| 1 Tardive dyskinesia: 1. No clinically important improvement Show forest plot | 2 | 32 | Risk Ratio (M‐H, Fixed, 95% CI) | 0.89 [0.71, 1.12] |
| 1.1 Short term | 1 | 19 | Risk Ratio (M‐H, Fixed, 95% CI) | 1.0 [0.83, 1.21] |
| 1.2 Medium term | 1 | 13 | Risk Ratio (M‐H, Fixed, 95% CI) | 0.74 [0.44, 1.23] |
| 2 Tardive dyskinesia: 2. Not any improvement ‐ short term Show forest plot | 1 | 19 | Risk Ratio (M‐H, Fixed, 95% CI) | 1.11 [0.47, 2.60] |
| 3 Tardive dyskinesia: 3. Deterioration ‐ short term Show forest plot | 1 | 19 | Risk Ratio (M‐H, Fixed, 95% CI) | 0.22 [0.01, 4.05] |
| 4 Tardive dyskinesia: 3. Average scale score (AIMS, high=poor) ‐ medium term Show forest plot | 1 | 13 | Mean Difference (IV, Fixed, 95% CI) | ‐2.38 [‐6.58, 1.82] |
| 5 Adverse effects Show forest plot | 3 | 54 | Risk Ratio (M‐H, Fixed, 95% CI) | 0.0 [0.0, 0.0] |
| 5.1 Short term | 1 | 19 | Risk Ratio (M‐H, Fixed, 95% CI) | 0.0 [0.0, 0.0] |
| 5.2 Medium term | 2 | 35 | Risk Ratio (M‐H, Fixed, 95% CI) | 0.0 [0.0, 0.0] |
| 6 Leaving the study early Show forest plot | 3 | 54 | Risk Ratio (M‐H, Fixed, 95% CI) | 0.0 [0.0, 0.0] |
| 6.1 Short term | 1 | 19 | Risk Ratio (M‐H, Fixed, 95% CI) | 0.0 [0.0, 0.0] |
| 6.2 Medium term | 2 | 35 | Risk Ratio (M‐H, Fixed, 95% CI) | 0.0 [0.0, 0.0] |
| 7 Cognitive function: Average scale score ‐ medium term Show forest plot | 1 | Mean Difference (IV, Fixed, 95% CI) | Subtotals only | |
| 7.1 WAIS | 1 | 76 | Mean Difference (IV, Fixed, 95% CI) | 15.83 [4.61, 27.05] |
| 7.2 WMS | 1 | 76 | Mean Difference (IV, Fixed, 95% CI) | 3.77 [‐8.21, 15.75] |
| 8 Mental state: deterioration ‐ medium term Show forest plot | 1 | 13 | Risk Ratio (M‐H, Fixed, 95% CI) | 0.0 [0.0, 0.0] |
| Outcome or subgroup title | No. of studies | No. of participants | Statistical method | Effect size |
| 1 Tardive dyskinesia: 1. No clinically important improvement ‐ short term Show forest plot | 1 | 11 | Risk Ratio (M‐H, Fixed, 95% CI) | 1.59 [0.79, 3.23] |
| 2 Tardive dyskinesia: 2. Not any improvement ‐ short term Show forest plot | 1 | 11 | Risk Ratio (M‐H, Fixed, 95% CI) | 4.29 [0.25, 72.90] |
| 3 Tardive dyskinesia: 3. Deterioration ‐ short term Show forest plot | 1 | 11 | Risk Ratio (M‐H, Fixed, 95% CI) | 4.29 [0.25, 72.90] |
| 4 Tardive dyskinesia: 3. Average scale score (AIMS, high=poor) ‐ short term Show forest plot | 1 | 11 | Mean Difference (IV, Fixed, 95% CI) | 0.63 [‐5.23, 6.49] |
| 5 Adverse events ‐ short term Show forest plot | 1 | 11 | Risk Ratio (M‐H, Fixed, 95% CI) | 6.0 [0.38, 94.35] |
| 6 Leaving the study early ‐ short term Show forest plot | 1 | 11 | Risk Ratio (M‐H, Fixed, 95% CI) | 2.57 [0.13, 52.12] |
| Outcome or subgroup title | No. of studies | No. of participants | Statistical method | Effect size |
| 1 Tardive dyskinesia: 1. Not any improvement Show forest plot | 2 | 132 | Risk Ratio (M‐H, Fixed, 95% CI) | 0.83 [0.65, 1.07] |
| 1.1 Short term | 1 | 47 | Risk Ratio (M‐H, Fixed, 95% CI) | 0.73 [0.50, 1.06] |
| 1.2 Medium term | 1 | 85 | Risk Ratio (M‐H, Fixed, 95% CI) | 0.90 [0.64, 1.27] |
| 2 Tardive dyskinesia: 2. Deterioration Show forest plot | 2 | 103 | Risk Ratio (M‐H, Fixed, 95% CI) | 0.97 [0.14, 6.80] |
| 2.1 Short term | 1 | 37 | Risk Ratio (M‐H, Fixed, 95% CI) | 2.85 [0.12, 65.74] |
| 2.2 Medium term | 1 | 66 | Risk Ratio (M‐H, Fixed, 95% CI) | 0.33 [0.01, 7.90] |
| 3 Adverse effects Show forest plot | 2 | 122 | Risk Ratio (M‐H, Fixed, 95% CI) | 1.32 [0.74, 2.36] |
| 3.1 Short term | 1 | 37 | Risk Ratio (M‐H, Fixed, 95% CI) | 3.79 [0.47, 30.77] |
| 3.2 Medium term | 1 | 85 | Risk Ratio (M‐H, Fixed, 95% CI) | 1.13 [0.61, 2.07] |
| 4 Leaving the study early ‐ medium term Show forest plot | 1 | 85 | Risk Ratio (M‐H, Fixed, 95% CI) | 1.09 [0.49, 2.40] |
| Outcome or subgroup title | No. of studies | No. of participants | Statistical method | Effect size |
| 1 Tardive dyskinesia: 1. No clinically important improvement ‐ medium term Show forest plot | 1 | 15 | Risk Ratio (M‐H, Fixed, 95% CI) | 0.45 [0.21, 0.94] |
| 2 Tardive dyskinesia: 2. Not any improvement ‐ medium term Show forest plot | 1 | 15 | Risk Ratio (M‐H, Fixed, 95% CI) | 0.18 [0.01, 3.81] |
| 3 Tardive dyskinesia: 3. Deterioration ‐ medium term Show forest plot | 1 | 15 | Risk Ratio (M‐H, Fixed, 95% CI) | 0.18 [0.01, 3.81] |
| 4 Leaving the study early ‐ medium term Show forest plot | 1 | 15 | Risk Ratio (M‐H, Fixed, 95% CI) | 0.0 [0.0, 0.0] |
| 4.1 Short term | 1 | 15 | Risk Ratio (M‐H, Fixed, 95% CI) | 0.0 [0.0, 0.0] |