抗精神病药引起的迟发性运动障碍的杂症治疗
摘要
研究背景
抗精神病药物(神经安定剂)广泛用于治疗慢性精神病患者。然而,使用它会产生不良反应,包括运动障碍,如迟发性运动障碍(tardive dyskinesia, TD)——通常被视为口腔和面部周围重复不自主运动的问题。本综述是研究TD治疗的系列综述之一,涵盖了其他地方未涵盖的杂症治疗。
研究目的
确定其他关于TD治疗、手术干预、电休克疗法、身心疗法的Cochrane系统综述中未涵盖的药物、激素、膳食或中草药补充剂对抗精神病药物诱发的TD患者是否有效、安全。
检索策略
在2015年7月16日和2017年4月26日,我们检索了Cochrane精神分裂症组基于研究的试验注册库(Cochrane Schizophrenia Group's Study‐Based Register of Trials)(包括试验登记册),筛选了所有已确定研究的参考文献以进行进一步试验,并联系试验作者以获取更多信息。
纳入排除标准
我们纳入了治疗抗精神病药物诱发的TD和精神分裂症或其他慢性精神疾病患者的随机对照试验报告,这些患者仍服用抗精神病药物,并被随机分配到上述干预组与安慰剂组、不干预组或任何其他干预组。
资料收集与分析
我们独立地从这些试验中提取资料,评价其风险比(RR)或均差(MD)及其95%置信区间(CI)。我们假设提前退出的受试者情况没有得到改善。我们使用GRADE评价了偏倚风险并创建了“结果概要”表。
主要结果
我们纳入了31项RCT,共24项干预措施,涉及1278名受试者;其中22项试验被新纳入2017年的更新中。五项试验正在等待分类,七项试验正在进行中。所有受试者都是患有慢性精神疾病的成年人,主要是精神分裂症和抗精神病药物引起的TD。研究主要持续时间短(3至6周),样本量小(10至157名受试者),大多数(61%)发表于20多年前。这些研究中的总体偏倚风险尚不清楚,主要是由于分配方案隐藏、序列生成和盲法的报告质量较差。
纳入的31项研究中有19项报告了主要结局“TD症状没有临床上重要的改善”。两项研究发现,与安慰剂相比,干预措施有获益的中等质量证据:分别是缬苯那嗪(RR=0.63,95%CI [0.46, 0.86],1项RCT,n=92)和银杏叶提取物(RR=0.88,95%CI [0.81, 0.96], 1项RCT, n=157)。然而,由于样本量小,我们无法确定这些影响。
我们认为其余干预措施的结果尚无定论:发现了以下有获益的低质量至极低质量证据:丁螺环酮(RR=0.53, 95%CI [0.33, 0.84], 1项RCT,n=42)、二氢化麦角生物碱(RR=0.45,95%CI [0.21, 0.97],1项RCT, n=28)、催眠或放松(RR=0.45,95%CI [0.21, 0.94],1项研究,n=15)、匹莫林(RR=0.48, 95%CI [0.29, 0.77], 1项RCT, n=46)、异丙嗪(RR=0.24, 95%CI [0.11, 0.55], 1项RCT,n=34)、胰岛素(RR=0.52, 95%CI [0.29, 0.96], 1项RCT,n=20)、支链氨基酸(RR=0.79, 95%CI [0.63, 1.00], 1项RCT,n=52)和异卡巴肼(RR=0.24, 95%CI [0.08, 0.71], 1项RCT,n=20)。有低至极低质量证据表明干预与安慰剂或与以下干预不治疗组之间没有差异:褪黑激素(RR=0.89,95%CI [0.71, 1.12],2项 RCT,n=32),锂(RR=1.59,95%CI [0.79, 3.23],1项RCT,n=11),利坦色林(RR=1.00,95%CI [0.70, 1.43],1项RCT,n=10),司来吉兰(RR=1.37,95%CI [0.96, 1.94],1项 RCT,n=33)、雌激素 (RR=1.18, 95%CI [0.76, 1.83], 1项RCT, n=12) 和γ‐亚麻酸 (RR=1.00, 95%CI [0.69, 1.45], 1项RCT, n=16)。
纳入的研究均未报告其他主要结局,即“无临床显著的锥体外系不良反应”。
作者结论
本综述发现使用缬苯那嗪或银杏叶提取物可能能够有效缓解迟发性运动障碍的症状。然而,由于只有一项RCT研究了这些化合物中的每一种,我们正在等待正在进行的试验的结果来确认这些结果。本综述中涵盖的其余干预措施的结果必须被认为是不确定的,这些化合物可能只能在设计良好的评价性研究的情况下使用。
PICO
简语概要
抗精神病药引起的迟发性运动障碍的杂症治疗
本系统综述的目的是什么?
本Cochrane系统综述的目的是了解其他迟发性运动障碍的Cochrane系统综述中未涵盖的药物、补充剂、手术干预、电休克疗法或身心疗法是否可以改善迟发性运动障碍。我们收集并分析了所有相关的随机对照试验来回答这个问题。
关键信息
药物缬苯那嗪和银杏叶提取物可能会改善迟发性运动障碍的症状。但我们仍然需要更多高质量的研究来证实这些发现,这些发现每次干预仅来自一项研究。
本系统综述研究了什么?
抗精神病药物通过控制例如异常感知(幻觉)、思维混乱和固定的错误信念(妄想)来治疗精神分裂症等慢性精神疾病。迟发性运动障碍是一种异常、重复和不自主运动的毁容和致残性障碍,通常由抗精神病药物引起。超过20%依赖抗精神病药物来控制精神疾病的人出现迟发性运动障碍。已经研究了许多不同的干预措施来缓解迟发性运动障碍的症状。几项Cochrane系统综述总结了用于管理这些不自主运动的许多治疗方法的效果。本综述侧重于“杂症”,一组其他不相关的干预措施,没有涵盖在其他Cochrane关于迟发性运动障碍的综述中。
本系统综述的主要研究结果是什么?
我们发现31项研究报告了24种不同的干预措施,以改善1278名因慢性精神疾病而服用抗精神病药物的人的迟发性运动障碍。不幸的是,大多数研究对受试者的随访时间很短(大多数是3到6周),而且纳入的受试者很少(每项研究的平均受试者人数为41人)。
• 与安慰剂相比,缬苯那嗪可能在临床上显著减轻迟发性运动障碍的症状(中等质量证据)。然而,这一证据仅基于美国一项涉及92名受试者的研究;我们正在等待最近完成和正在进行的试验的结果,以确认这些结果。
• 与安慰剂相比,缬苯那嗪可能在临床上显著减轻迟发性运动障碍的症状(中等质量证据)。然而,这一证据仅基于在中国进行的一项涉及157名受试者的研究;我们正在等待最近完成和正在进行的试验的结果,以确认这些结果。
• 其余干预措施的证据质量为低质量到极低质量,我们认为这些关于其他干预措施的结果是不确定的。
本综述的时效性如何?
我们检索了截至2017年4月26日发表的研究。
Authors' conclusions
Summary of findings
| DIHYDROGENATED ERGOT ALKALOIDS versus PLACEBO for antipsychotic‐induced tardive dyskinesia | ||||||
| Patient or population: female and male 59‐80 (mean) years old patients with antipsychotic‐induced tardive dyskinesia | ||||||
| Outcomes | Illustrative comparative risks* (95% CI) | Relative effect | No of Participants | Quality of the evidence | Comments | |
| Assumed risk | Corresponding risk | |||||
| Placebo | DIHYDROGENATED ERGOT ALKALOIDS | |||||
| Tardive dyskinesia: No clinically important improvement | 786 per 1000 | 354 per 1000 | RR 0.45 | 28 | ⊕⊕⊝⊝ | |
| Tardive dyskinesia: Deterioration of symptoms follow‐up: 6 weeks | 71 per 1000 | 24 per 1000 | RR 0.33 | 28 | ⊕⊝⊝⊝ | |
| Adverse effects ‐ any adverse effect follow‐up: 6 weeks | 214 per 1000 | 499 per 1000 | RR 2.33 | 28 | ⊕⊝⊝⊝ | |
| Acceptability of treatment (measured by participants leaving the study early) follow‐up: 6 weeks | 42 per 1000 | 14 per 1000 | RR 0.33 | 48 | ⊕⊝⊝⊝ | |
| Social confidence, social inclusion, social networks, or personalised quality of life ‐ not reported | This outcome was not reported. | |||||
| *The risk in the intervention group (and its 95% confidence interval) is based on the assumed risk in the comparison group and the relative effect of the intervention (and its 95% CI). | ||||||
| GRADE Working Group grades of evidence | ||||||
| 1 Downgraded one step for risk of bias: randomisation procedure and allocation concealment were not adequately described. | ||||||
| LEVETIRACETAM versus PLACEBO for antipsychotic‐induced tardive dyskinesia | ||||||
| Patient or population: female and male 47‐54 years old (mean) patients with various psychiatric conditions and antipsychotic‐induced tardive dyskinesia | ||||||
| Outcomes | Illustrative comparative risks* (95% CI) | Relative effect | No of Participants | Quality of the evidence | Comments | |
| Assumed risk | Corresponding risk | |||||
| Placebo | LEVETIRACETAM | |||||
| Tardive dyskinesia: No clinically important improvement ‐ not reported | This outcome was not reported. | |||||
| Tardive dyskinesia: Deterioration of symptoms ‐ not reported | This outcome was not reported. | |||||
| Adverse effects ‐ any adverse effect follow‐up: 8 weeks | 457 per 1000 | 233 per 1000 | RR 0.51 | 69 | ⊕⊕⊝⊝ | |
| Acceptability of treatment (measured by participants leaving the study early) | 167 per 1000 | 168 per 1000 | RR 1.01 | 119 | ⊕⊝⊝⊝ | |
| Social confidence, social inclusion, social networks, or personalised quality of life ‐ not reported | This outcome was not reported. | |||||
| *The risk in the intervention group (and its 95% confidence interval) is based on the assumed risk in the comparison group and the relative effect of the intervention (and its 95% CI). | ||||||
| GRADE Working Group grades of evidence | ||||||
| 1 Downgraded one step for risk of bias: randomisation procedure, allocation concealment and blinding were not adequately described. | ||||||
| BUSPIRONE versus PLACEBO for antipsychotic‐induced tardive dyskinesia | ||||||
| Patient or population: female and male 33‐year old (mean) patients with schizophrenia and antipsychotic‐induced tardive dyskinesia | ||||||
| Outcomes | Anticipated absolute effects* (95% CI) | Relative effect | № of participants | Quality of the evidence | Comments | |
| Risk with placebo | Risk with buspirone | |||||
| Tardive dyskinesia: No clinically important improvement | 905 per 1,000 | 480 per 1,000 | RR 0.53 | 42 | ⊕⊕⊝⊝ | |
| Tardive dyskinesia: Deterioration of symptoms ‐ not reported | This outcome was not reported. | |||||
| Adverse effects ‐ not reported | This outcome was not reported. | |||||
| Acceptability of treatment (measured by participants leaving the study early) | not estimable | not estimable | RR not estimable | 42 | ⊕⊝⊝⊝ | No events were reported. |
| Social confidence, social inclusion, social networks, or personalised quality of life ‐ not reported | This outcome was not reported. | |||||
| *The risk in the intervention group (and its 95% confidence interval) is based on the assumed risk in the comparison group and the relative effect of the intervention (and its 95% CI). | ||||||
| GRADE Working Group grades of evidence | ||||||
| 1 Downgraded one step for risk of bias: randomisation procedure, allocation concealment and blinding were not adequately described. 2 Downgraded one step for imprecision: very small sample size and few events reported. 3 Downgraded two steps for imprecision: effect could not be estimated due to very small sample size with no events reported. | ||||||
| VMAT2‐inhibitor compared to placebo for antipsychotic‐induced tardive dyskinesia | ||||||
| Patient or population: 18 to 85 year‐old patients with schizophrenia, schizoaffective disorder, mood disorder, or gastrointestinal disorder + antipsychotic‐induced tardive dyskinesia | ||||||
| Outcomes | Illustrative comparative risks* (95% CI) | Relative effect | No of Participants | Quality of the evidence | Comments | |
| Assumed risk | Corresponding risk | |||||
| Placebo | VMAT2‐inhibitor | |||||
| Tardive dyskinesia: 1. No clinically important improvement | 826 per 1000 | 520 per 1000 | RR 0.63 | 92 | ⊕⊕⊕⊝ | |
| Adverse effects ‐ any adverse effect | 327 per 1000 | 490 per 1000 | RR 1.50 | 100 | ⊕⊕⊝⊝ | |
| Leaving the study early | 98 per 1000 | 98 per 1000 | RR 1.00 | 102 | ⊕⊝⊝⊝ | |
| *The basis for the assumed risk (e.g. the median control group risk across studies) is provided in footnotes. The corresponding risk (and its 95% confidence interval) is based on the assumed risk in the comparison group and the relative effect of the intervention (and its 95% CI). | ||||||
| GRADE Working Group grades of evidence | ||||||
| 1 Downgraded one step for imprecision: small sample size and few events reported | ||||||
| ETHYL‐EPA versus PLACEBO for antipsychotic‐induced tardive dyskinesia | ||||||
| Patient or population: female and male 42 (mean) years old patients with schizophrenia or schizoaffective disorder and antipsychotic‐induced tardive dyskinesia | ||||||
| Outcomes | Illustrative comparative risks* (95% CI) | Relative effect | No of Participants | Quality of the evidence | Comments | |
| Assumed risk | Corresponding risk | |||||
| Placebo | ETHYL‐EPA | |||||
| Tardive dyskinesia: No clinically important improvement ‐ not reported | This outcome was not reported. | |||||
| Tardive dyskinesia: Deterioration of symptoms ‐ not reported | This outcome was not reported. | |||||
| Adverse effects: EPS: parkinsonism measured by average ESRS change scores follow‐up: 12 weeks | mean: ‐1.1 (3.3) | The mean change in ESRS: parkinsonism scale score in the ethyl‐EPA group was | MD 0.30 (‐1.17 to 1.77) | 75 (1 RCT) | ⊕⊕⊝⊝ | |
| Adverse effects: EPS: dystonia measured by average ESRS change scores follow‐up: 12 weeks | mean: 0.4 (0.5) | The mean change in ESRS: dystonia scale score in the ethyl‐EPA group was | MD ‐0.35 (‐0.58 to ‐0.12) | 75 (1 RCT) | ⊕⊕⊝⊝ | |
| Adverse effects: EPS: akathisia measured by average ESRS change scores follow‐up: 12 weeks | mean: ‐0.06 (0.7) | The mean change in ESRS: akathisia scale score in the ethyl‐EPA group was | MD ‐0.04 (‐0.30 to 0.22) | 75 (1 RCT) | ⊕⊝⊝⊝ | |
| Acceptability of treatment (measured by participants leaving the study early) follow‐up: 12 weeks | 548 per 1000 | 214 per 1000 | RR 0. 57 | 84 | ⊕⊝⊝⊝ | |
| Social confidence, social inclusion, social networks, or personalised quality of life ‐ not reported | This outcome was not reported. | |||||
| *The risk in the intervention group (and its 95% confidence interval) is based on the assumed risk in the comparison group and the relative effect of the intervention (and its 95% CI). | ||||||
| GRADE Working Group grades of evidence | ||||||
| 1 Downgraded one step for risk of bias: randomisation procedure, allocation concealment and blinding were not adequately described. | ||||||
| GINKGO BILOBA versus PLACEBO for antipsychotic‐induced tardive dyskinesia | ||||||
| Patient or population: male 45.2 (mean) years old patients with schizophrenia and antipsychotic‐induced tardive dyskinesia | ||||||
| Outcomes | Illustrative comparative risks* (95% CI) | Relative effect | No of Participants | Quality of the evidence | Comments | |
| Assumed risk | Corresponding risk | |||||
| Placebo | GINKGO BILOBA | |||||
| Tardive dyskinesia: No clinically important improvement | 987 per 1000 | 869 per 1000 | RR 0.88 | 157 | ⊕⊕⊕⊝ | |
| Tardive dyskinesia: Deterioration of symptoms ‐ not reported | This outcome was not reported. | |||||
| Adverse effects ‐ not reported | This outcome was not reported. | |||||
| Acceptability of treatment (measured by participants leaving the study early) | 51 per 1000 | 13 per 1000 | RR 0.25 | 157 | ⊕⊝⊝⊝ | |
| Social confidence, social inclusion, social networks, or personalised quality of life ‐ not reported | This outcome was not reported. | |||||
| *The risk in the intervention group (and its 95% confidence interval) is based on the assumed risk in the comparison group and the relative effect of the intervention (and its 95% CI). | ||||||
| GRADE Working Group grades of evidence | ||||||
| 1 Downgraded one step for imprecision: small sample size and few events reported. | ||||||
| MELATONIN versus PLACEBO OR NO TREATMENT for antipsychotic‐induced tardive dyskinesia | ||||||
| Patient or population: female and male 28 to 91 years old patients with antipsychotic‐induced tardive dyskinesia | ||||||
| Outcomes | Illustrative comparative risks* (95% CI) | Relative effect | No of Participants | Quality of the evidence | Comments | |
| Assumed risk | Corresponding risk | |||||
| Placebo/no treatment | MELATONIN | |||||
| Tardive dyskinesia: No clinically important improvement | 1000 per 1000 | 890 per 1000 | RR 0.89 | 32 | ⊕⊕⊝⊝ | |
| Tardive dyskinesia: Deterioration of symptoms follow‐up: 3 weeks | 200 per 1000 | 44 per 1000 | RR 0.22 | 19 | ⊕⊕⊝⊝ | |
| Adverse effects follow‐up: 3‐12 weeks | See comment | See comment | Not estimable | 54 | ⊕⊕⊝⊝ | No events were reported. |
| Acceptability of treatment (measured by participants leaving the study early) | See comment | See comment | Not estimable | 54 | ⊕⊝⊝⊝ | No events were reported. |
| Social confidence, social inclusion, social networks, or personalised quality of life ‐ not reported | This outcome was not reported. | |||||
| *The risk in the intervention group (and its 95% confidence interval) is based on the assumed risk in the comparison group and the relative effect of the intervention (and its 95% CI). | ||||||
| GRADE Working Group grades of evidence | ||||||
| 1 Downgraded one step for inconsistency: substantial heterogeneity (I2 = 46%). | ||||||
| CERULETIDE versus PLACEBO for antipsychotic‐induced tardive dyskinesia | ||||||
| Patient or population: female and male 55‐59 year old (mean) patients with various psychiatric conditions and antipsychotic‐induced tardive dyskinesia | ||||||
| Outcomes | Illustrative comparative risks* (95% CI) | Relative effect | No of Participants | Quality of the evidence | Comments | |
| Assumed risk | Corresponding risk | |||||
| Placebo | CERULETIDE | |||||
| Tardive dyskinesia: No clinically important improvement ‐ not reported | This outcome was not reported. | |||||
| Tardive dyskinesia: Deterioration of symptoms follow‐up: 4‐8 weeks | 20 per 1000 | 19 per 1000 | RR 0.97 | 103 | ⊕⊕⊝⊝ | |
| Adverse effects ‐ any adverse effect follow‐up: 4‐8 weeks | 233 per 1000 | 308 per 1000 | RR 1.32 | 122 | ⊕⊕⊝⊝ | |
| Acceptability of treatment (measured by participants leaving the study early) follow‐up: 8 weeks | 214 per 1000 | 234 per 1000 | RR 1.09 | 85 | ⊕⊝⊝⊝ | |
| Social confidence, social inclusion, social networks, or personalised quality of life ‐ not reported | This outcome was not reported. | |||||
| *The risk in the intervention group (and its 95% confidence interval) is based on the assumed risk in the comparison group and the relative effect of the intervention (and its 95% CI). | ||||||
| GRADE Working Group grades of evidence | ||||||
| 1 Downgraded one step for risk of bias: unclear methods of randomisation, blinding not assessed, and potential introduction of detection bias due to subjective nature of outcome assessments. 3 Downgraded one step for indirectness: leaving the study early can give an indication, but is not a direct measurement, of treatment acceptability. | ||||||
| HYPNOSIS OR RELAXATION versus TAU for antipsychotic‐induced tardive dyskinesia | ||||||
| Patients or population: female and male 35 (mean) years old patients with schizophrenia and tardive dyskinesia, acute extrapyramidal symptoms, and/or pseudoparkinsonism | ||||||
| Outcomes | Anticipated absolute effects* (95% CI) | Relative effect | № of participants | Quality of the evidence | Comments | |
| Risk with TAU | Risk with hypnosis or relaxation | |||||
| Tardive dyskinesia: No clinically important improvement | 1,000 per 1,000 | 450 per 1,000 | RR 0.45 | 15 | ⊕⊝⊝⊝ | |
| Tardive dyskinesia: Deterioration of symptoms | 200 per 1,000 | 36 per 1,000 | RR 0.18 | 15 | ⊕⊝⊝⊝ | |
| Adverse effects ‐ not reported | This outcome was not reported. | |||||
| Acceptability of treatment (measured by participants leaving the study early) | 0 per 1,000 | 0 per 1,000 | not estimable | 15 | ⊕⊝⊝⊝ | No events were reported. |
| Social confidence, social inclusion, social networks, or personalised quality of life ‐ not reported | This outcome was not reported. | |||||
| *The risk in the intervention group (and its 95% confidence interval) is based on the assumed risk in the comparison group and the relative effect of the intervention (and its 95% CI). | ||||||
| GRADE Working Group grades of evidence | ||||||
| 1 Downgraded two steps for risk of bias: fully randomised sequence generation and blinding was not achieved. | ||||||
Background
Description of the condition
Since the 1950's antipsychotic (neuroleptic) medication has been extensively used to treat people with chronic mental illnesses such as schizophrenia. These drugs can effectively control symptoms such as abnormal perceptions (hallucinations), disordered thinking and fixed false beliefs (delusions). In addition, maintenance therapy with neuroleptics is associated with a reduced risk of relapse (Schooler 1993).
Antipsychotic medication, however, has also been associated with a wide range of adverse effects, including movement disorders. The appearance of these movement disorders can contribute to poor compliance with antipsychotic treatment (Barnes 1993), and hence relapse.
Tardive dyskinesia (TD) is one such movement disorder and is characterised by abnormal, repetitive and involuntary movements (APA 1992). The clinical features include tongue protrusion, side‐to‐side or rotatory movement of the jaw, lip smacking, puckering and pursing, and rapid eye blinking (Casey 1994). In some people rapid movements of the arms, legs, and trunk may also occur. TD is a chronic condition of insidious onset, the severity of which spontaneously fluctuates (APA 1992). Studies on the natural history of TD have reported widely variable remission rates (1% to 62%) depending on patient age, psychiatric diagnosis, course of the psychiatric disorder, and duration of therapy (Bergen 1989; Fernandez 2001; Glazer 1990).
Although the most frequent cause of TD is the use of antipsychotic medication, it is clinically striking that dose reduction can lead to a temporary exacerbation in symptoms. Conversely, increasing the dose is often associated with a temporary remission (Cavallaro 1993; Smith 1980). The exact mechanisms of the pathophysiology of TD are unknown. Antipsychotic drugs block certain chemical receptor sites in the brain ‐ one of these is specific for dopamine (Casey 1994). One hypothesis explaining the cause of antipsychotic‐induced TD is that chronic blockade of dopamine receptors in specific cells of the brain (neurones from the nigrostriatum) causes an overgrowth of these receptors (Casey 1994). There is also a suggestion that the chronic use of antipsychotics may also cause an abnormal production of highly active atoms and chemical groups (cytotoxic free radicals), which may damage specific cells in the brain. This, in turn, could be responsible for the appearance of TD (Cadet 1989; Sachdev 2000).
TD occurs in more than 20% of those using antipsychotic medication continually for longer than three months (Glazer 2000; Kane 1982; Tarsy 2011). Every year 4% to 5% of adults and 25% to 30% of elderly persons who continually use these drugs begin to show signs of TD (APA 1992; Correll 2004). Advancing age is a risk factor for both TD's prevalence and severity, with those who are < 60 years of age being three times more likely to spontaneously remit (Jeste 2000; Smith 1980).
The prevalence of TD is often thought to be decreasing based on the use of atypical antipsychotics in place of typical antipsychotics (Cloud 2014). A systematic review found that the incidence of TD associated with atypical antipsychotics (2% to 4%) was significantly lower than that for typical antipsychotics (5% to 8%) (Correll 2008). Despite this, the widespread use of atypical antipsychotics in clinical settings, increased off‐label use, and an ageing population may still result in an overall increase in the number of cases of TD (Cloud 2014; Glazer 2000; Maher 2012). The problem will be considerably greater for people in countries where use of newer drugs is less prevalent (Ballesteros 2000; Martins 2011).
Description of the intervention
Various types of interventions have been evaluated as potential treatments for TD. There is now a series of Cochrane reviews relevant to the care of people with TD (Table 1).This review summarises any trial‐based evidence for the effects of any other treatments that were not summarised in any of the other reviews evaluating interventions for TD. Please see Included studies,6. Interventions for the 24 interventions included in this review.
| Review | Citation |
| Anticholinergics | |
| Benzodiazepines | |
| Calcium‐channel blockers | |
| Cholinergics | |
| GABAergic compounds | |
| Neuroleptic medications (including dose reduction and cessation) | |
| Non‐neuroleptic compounds that impact on the dopamine and noradrenaline systems (catecholaminergics) | |
| Vitamin E | |
| This review, Miscellaneous treatments |
How the intervention might work
Use of treatments such as botulin, endorphin, oestrogen, essential fatty acid, EX11582A, ganglioside, lithium, naloxone, periactin, phenylalanine, piracetam, stepholidine, and tryptophan is based on their possible beneficial effects in other movement disorders. Also, interventions using neurosurgery or electroconvulsive therapy have been used for managing the distressing signs and symptoms of TD.
Why it is important to do this review
Several atypical antipsychotic drugs have been produced in the last decades that claim to cause less or no TD (Lieberman 1996). These claims may or may not be true, and certainly evidence does point to the fact that thoughtful use of older generation drugs is not associated with any more problems of TD than with newer treatments (Chouinard 2008). However, in a global context, it is likely that the less expensive and more familiar drugs ‐ such as chlorpromazine or haloperidol ‐ will continue to be the mainstay of treatment of people with schizophrenia (WHO Essential List 2010). Use of drugs such as these is associated with emergence of TD and, therefore, this condition will remain a problem for years to come.
TD can result in considerable social and physical disability (Barnes 1993) and symptoms are often irreversible (Bergen 1989; Fernandez 2001; Glazer 1990). Additionally, TD is frequently associated with lower quality of life (Ascher‐Svanum 2008) and a greater mortality rate (Chong 2009). Given the high incidence and prevalence of TD among people taking antipsychotic medication, the need for prevention or treatment is clear. Unfortunately, there has been sparse evidence to guide clinicians (NICE 2014; Taylor 2009). Although many treatments have been tested, no one intervention has been shown clearly to be effective. Cessation or reduction of the dose of antipsychotic medication would be the ideal management for TD. In clinical practice this is not always possible, not least because in many individuals such a reduction would lead to relapse. This review focuses on whether the addition of different types of miscellaneous medications to those already receiving antipsychotic medication is likely to help TD.
This review is one in a series of nine Cochrane reviews (see Table 1) evaluating treatments for antipsychotic‐induced TD, and is an update of a Cochrane review first published in 2000 (McGrath 2000).
Objectives
1. To determine the effects of any of the following drugs or supplements for antipsychotic‐induced TD in people with schizophrenia or other chronic mental illnesses: botulin toxin, branched‐chain amino acids, buspirone, ceruletide, cyproheptadine, dihydrogenated ergot alkaloids, dimethylaminoethanol, eicosapentaenoic acid, endorphin, oestrogen, essential fatty acid, EX 11‐582A, gamma‐linolenic acid, ganglioside GM1, Ginkgo biloba, insulin, isocarboxazid, levetiracetam, lithium, melatonin, methylphenidate, naloxone, naltrexone, papaverine, pemoline, periactin, phenylalanine, piracetam, procyclidine, promethazine, ritanserin, selegiline, stepholidine and tryptophan, VMAT‐2 inhibitors.
2. To determine the effects of surgical interventions or electroconvulsive therapy (ECT) for antipsychotic‐induced TD in people with schizophrenia or other chronic mental illnesses.
3. To determine the effects of body therapies such as yoga, hypnosis, or relaxation for antipsychotic‐induced TD in people with schizophrenia or other chronic mental illnesses.
Methods
Criteria for considering studies for this review
Types of studies
We included randomised controlled trials. Where a trial was described as 'double‐blind', but it was only implied that the study was randomised, we included these trials in a sensitivity analysis. If there was no substantive difference within primary outcomes (see Types of outcome measures) when these 'implied randomisation' studies were added, then we included these in the final analysis. If there was a substantive difference, we only used clearly randomised trials and described the results of the sensitivity analysis in the text. We excluded quasi‐randomised studies, such as those allocating by using alternate days of the week.
Types of participants
We included people with schizophrenia and other types of schizophrenia‐like psychosis (e.g. schizophreniform and schizoaffective disorders), irrespective of the diagnostic criteria used, who: i. required the use of antipsychotics for more than three months; ii. developed TD (diagnosed by any criteria) during antipsychotic treatment; and iii. for whom the dose of antipsychotic medication had been stable for one month or more before the trial (the same applies for those free of antipsychotics). There is no clear evidence that the schizophrenia‐like psychoses are caused by fundamentally different disease processes or require different treatment approaches (Carpenter 1994).
Types of interventions
1. Compounds
Including drugs, hormone‐, dietary‐, or herb‐supplements such as botulin toxin, buspirone, ceruletide, dihydrogenated ergot alkaloids, dimethylaminoethanol, endorphin, oestrogen, essential and omega fatty acids, EX 11‐582A, Ginkgo biloba, ganglioside GM1, insulin, levetiracetam, lithium, melatonin, methylphenidate, naloxone, naltrexone, pemoline, periactin, phenylalanine, piracetam, stepholidine, tryptophan, VMAT‐2 inhibitors. Any doses, frequencies or means of administration were acceptable.
2. Surgical intervention of any sort
3. Electroconvulsive therapy (ECT)
4. Mind‐body therapies, such as relaxation techniques or hypnotherapy
Compared with:
1. Placebo, no treatment or standard care; or
2. Any other intervention for the treatment of tardive dyskinesia
Types of outcome measures
We have defined clinical efficacy as an improvement in the symptoms of TD of more than 50%, on any scale. We grouped outcomes into short term (less than six weeks), medium term (between six weeks and six months) and long term (more than six months).
Primary outcomes
1. Tardive dyskinesia
No clinically important improvement in the symptoms of individuals, defined as more than 50% improvement on any TD scale ‐ any time period.
2. Adverse effects
No clinically important extrapyramidal adverse effects ‐ any time period.
Secondary outcomes
1. Tardive dyskinesia (TD)
1.1 Any improvement in the symptoms of individuals on any TD scale, as opposed to no improvement.
1.2 Deterioration in the symptoms of individuals, defined as any deleterious change on any TD scale.
1.3 Average change in severity of TD during the trial period.
1.4 Average difference in severity of TD at the end of the trial.
2. General mental state changes
2.1 Deterioration in general psychiatric symptoms (such as delusions and hallucinations) defined as any deleterious change on any scale.
2.2 Average difference in severity of psychiatric symptoms at the end of the trial.
3. Acceptability of treatment
3.1 Acceptability of the intervention to the participant group as measured by numbers of people leaving the study early.
4. Adverse effects
4.1 Use of any anti‐parkinsonism drugs.
4.2 Average score/change in extrapyramidal adverse effects.
4.3 Acute dystonia.
5. Other adverse effects, general and specific
6. Hospital and service utilisation outcomes
6.1 Hospital admission.
6.2 Average change in number of days in hospital.
6.3 Improvement in hospital status (for example: change from formal to informal admission status, use of seclusion, level of observation).
7. Economic outcomes
7.1 Average change in total cost of medical and mental health care.
7.2 Total indirect and direct costs.
8. Social confidence, social inclusion, social networks, or personalised quality of life measures
8.1. Clinically important change in social confidence, social inclusion, social networks, or personalised quality of life measures.
8.2 Average score/change in social confidence, social inclusion, social networks, or personalised quality of life measures.
9. Behaviour
9.1 Clinically important agitation.
9.2 Use of adjunctive medication for sedation.
9.3 Aggression to self or others.
10. Cognitive state
10.1 Clinically important change.
10.2 Any change, general and specific.
'Summary of findings' tables
We used the GRADE (Grading of Recommendations Assessment, Development and Evaluation) approach to interpret findings (Schünemann 2011) and used GRADEpro GDT to export data from this review to create 'Summary of findings' tables. These tables provide outcome‐specific information concerning the overall quality of evidence from each included study in the comparison, the magnitude of effects of interventions examined and the sum of available data on all outcomes rated as important to patient care and decision making. We selected the following main outcomes for inclusion in the 'Summary of findings' tables.
1. Tardive dyskinesia
1.1 No clinically important improvement
1.2 Deterioration of symptoms
2. Adverse effects
2.1 Clinically important extrapyramidal adverse effects
2.2 Any adverse effect
3. Acceptability of treatment
3.1 Leaving the study early
4. Social confidence, social inclusion, social networks, or personalised quality of life measures*
4.1 Clinically important change in social confidence, social inclusion, social networks, or personalised quality of life measures for either recipients of care or caregivers.
* Outcome designated important to patients. We wished to add perspectives from people’s personal experience with TD to the research agenda. A consultation with service users was planned where the previously published version of another review in the tardive dyskinesia series (Soares‐Weiser 2011; Table 1) and a lay overview of that review gave the foundation for the discussions. The session was planned to provide time to reflect on current research on TD and consider gaps in knowledge. The report is published in the Health Technology Assessment (HTA) report for the UK National Institute of Health Research (Bergman 2017). We have added one figure from the report showing service user expression of frustration concerning this neglected area of research (Figure 1). Informed by the results of the consultation, for this review, we updated outcomes for the 'Summary of findings' tables.

Message from one of the participants of the Public and patient involvement consultation of service user perspectives on tardive dyskinesia research.
Prioritising interventions for 'Summary of findings' tables
Twenty‐four different interventions were included in this review (see Table 2), and many of the studies were very small (< 60 participants) pilot studies testing out new interventions to treat TD. Due to the vast number of included interventions and to the small sample size and experimental nature of many of the studies, as a post hoc change to methods, we decided to prioritise interventions and create 'Summary of findings' tables only for those comparisons that: 1) included more than 60 participants, or 2) included more than one trial, or 3) was selected as an intervention of special interest for the UK National Health Service in the prioritisation process for the recently published HTA report (Bergman 2017).
| Study | N and setting | Condition | Sex and age | Intervention and duration | Comparison | Outcomes |
| 20 outpatients in the USA | schizophrenia + TD | F+M | Isocarboxazid + AP | Procyclidine + AP | TD symptoms, AEs | |
| 57 participants, setting not reported | TD | F+M | L‐stepholidine + AP | Placebo + AP | TD symptoms, AEs, mental state | |
| 13 in‐ and outpatients in Venezuela | various psychiatric conditions + TD | F+M | Melatonin + AP | Placebo + AP | TD symptoms, AEs, mental state | |
| 84 in‐ and outpatients in South Africa | schizophrenia or schizoaffective disorder + TD | F+M | Omega‐3 fatty acid + AP | Placebo + AP | TD symptoms, AEs, mental state | |
| 22 inpatients in the USA | schizophrenia, dementia + TD | F+M | Papaverine + AP | TAU + AP | TD symptoms | |
| 12 outpatients in the USA | various psychiatric conditions + TD | F | Oestrogen + AP | Placebo + AP | TD symptoms, AEs | |
| Glover 1982 | 15 outpatients in the USA | schizophrenia + TD or EPS | F+M | Hypnosis or relaxation + AP | TAU + AP | TD symptoms |
| 33 outpatients in the USA | TD | F+M | Selengiline + AP | Placebo + AP | TD symptoms | |
| 20 inpatients in the UK | various psychiatric conditions + TD | F+M | Ergoloid mesylates + AP | Placebo + AP | TD symptoms | |
| 85 in‐ and outpatients in Japan | schizophrenia + TD | F+M | Ceruletide + AP | Placebo + AP | TD symptoms, AEs | |
| 42 inpatients in Japan | various psychiatric conditions + TD | F+M | Cyproheptadine + AP | Placebo + AP | TD symptoms, AEs | |
| 28 inpatients in Japan | schizophrenia + TD | F+M | Ergoloid mesylates + AP | Placebo + AP | TD symptoms, AEs, mental state | |
| 40 inpatients in Israel | schizophrenia or schizoaffective disorder + TD | F+M | Piracetam + AP | Placebo + AP | TD symptoms, AEs, global state | |
| 11 inpatients in the UK | various psychiatric conditions + TD | NR | Lithium + AP | Placebo + AP | TD symptoms, AEs | |
| 37 inpatients in Japan | various psychiatric conditions + TD | F+M | Ceruletide + AP | Placebo + AP | TD symptoms, AEs | |
| 10 inpatients in Italy | schizophrenia + TD | F+M | Ritanserin + AP | Placebo + AP | TD symptoms, AEs, mental state | |
| 18 in‐ and outpatients in the USA | schizophrenia + TD | M | Phenylalanine + AP | Placebo + AP | Leaving the study early | |
| 20 inpatients in Morocco | schizophrenia + TD | F+M | Insulin + AP | Placebo + AP | TD symptoms | |
| 88 in‐ and outpatients in the USA | various psychiatric conditions + TD | NR | NBI‐98854 (VMAT2 inhibitor valbenazine) + AP | Placebo + AP | TD symptoms, AEs | |
| 40 inpatients in the UK | various psychiatric conditions + TD | F+M | Ergoloid mesylates + AP | Placebo + AP | TD symptoms | |
| 52 in‐ and outpatients in the USA | various psychiatric conditions + TD | M | Branched‐chain amino acids + AP | Placebo + AP | TD symptoms | |
| 19 inpatients in Israel | schizophrenia + TD | F+M | Melatonin + AP | Placebo + AP | TD symptoms, AEs | |
| 22 inpatients in Israel | schizophrenia + TD | F+M | Melatonin + AP | Placebo + AP | AEs | |
| 76 inpatients in China | TD | F+M | Melatonin + AP | TAU + AP | Cognitive function | |
| 69 inpatients in Belgium and Bulgaria | TD | F+M | Levetiracetam + AP | Placebo + AP | TD symptoms, AEs | |
| 16 in‐ and outpatients in the USA | schizophrenia + TD | M | Evening primrose oil + AP | Placebo + AP | TD symptoms, mental state | |
| 50 outpatients in the USA | various psychiatric conditions + TD | F+M | Levetiracetam + AP | Placebo + AP | TD symptoms, mental state | |
| 34 inpatients in China | schizophrenia + TD | F+M | Promethazine + AP | Placebo + AP | TD symptoms, AEs, mental state, global state | |
| 42 inpatients in China | schizophrenia + TD | F+M | Buspirone + AP | Placebo + AP | TD symptoms | |
| 46 inpatients in China | schizophrenia + TD | F+M | Pemoline + AP | Placebo + AP | TD symptoms | |
| 157 inpatients in China | schizophrenia + TD | M | Ginkgo biloba + AP | Placebo + AP | TD symptoms, mental state, cognitive function |
AE = adverse effects, AP = antipsychotics, EPS = extrapyramidal symptoms, F = female, M = male, m = mean, N = number, TAU = treatment as usual, TD = tardive dyskinesia
Search methods for identification of studies
Electronic searches
The 2017 review update was carried out in parallel with updating eight other TD reviews, see Table 1 for details. The search covered all nine TD reviews.
Cochrane Schizophrenia Group's Study‐Based Register of Trials
On 16 July 2015 and 26 April 2017, the information specialist searched the register using the following search strategy:
*Tardive Dyskinesia* in Health Care Condition Field of STUDY
In such a study‐based register, searching the major concept retrieves all the synonyms and relevant studies because all the studies have already been organised based on their interventions and linked to the relevant topics (Shokraneh 2017).
This register is compiled by systematic searches of major resources (AMED, BIOSIS, CINAHL, ClinicalTrials.Gov, Embase, MEDLINE, PsycINFO, PubMed, WHO ICTRP) and their monthly updates, ProQuest Dissertations and Theses A&I and its quarterly update, Chinese databases (CBM, CNKI, and Wanfang) and their annual updates, handsearches, grey literature, and conference proceedings (see Group's Module). There is no language, date, document type, or publication status limitations for inclusion of records into the register.
For previous searches, please see Appendix 1
Searching other resources
1. Reference searching
We inspected references of all identified studies for further relevant studies.
2. Personal contact
We contacted the first author of each included study for information regarding unpublished trials.
Data collection and analysis
For previous data collection and analysis please see Appendix 2
Selection of studies
For the 2017 update, Rosie Asher (RA and Antonio Grande (AG) (see Acknowledgements) inspected all abstracts of studies identified as above and selected potentially relevant reports. We resolved disagreement by discussion, or where there was still doubt, we acquired the full‐text article for further inspection. We acquired the full‐text articles of relevant reports/abstracts meeting initial criteria for re‐assessment and carefully inspected for a final decision on inclusion (see Criteria for considering studies for this review). RA and AG were not blinded to the names of the authors, institutions or journal of publication. Where difficulties or disputes arose, we asked review author Hanna Bergman (HB) for help and where it was impossible to decide, or if adequate information was not available to make a decision, we added these studies to those awaiting classification and contacted the authors of the papers for clarification.
Data extraction and management
1. Extraction
For the 2017 update, RA and HB independently extracted data from all included studies. Jun Xia (JX) and Sai Zhao (SZ) (see Acknowledgements) extracted data from studies in Chinese. For any problems, review author Karla Soares‐Weiser (KSW) helped clarify issues and we documented these final decisions. We extracted data presented only in graphs and figures whenever possible, but included only if two review authors independently had the same result. We attempted to contact authors through an open‐ended request in order to obtain missing information or for clarification whenever necessary. If studies were multi‐centre, where possible, we extracted data relevant to each component centre separately.
2. Management
2.1 Forms
For the 2017 update we extracted data online in Covidence. Extracted data are available here with a link to the original source PDF for each item.
2.2 Scale‐derived data
We included continuous data from rating scales only if:
a) the psychometric properties of the measuring instrument have been described in a peer‐reviewed journal (Marshall 2000); and
b) the measuring instrument has not been written or modified by one of the trialists for that particular trial.
Ideally, the measuring instrument should either be i. a self‐report or ii. completed by an independent rater or relative (not the therapist). We realise that this is not often reported clearly, we noted in Description of studies if this was the case or not.
2.3 Endpoint versus change data
There are advantages of both endpoint and change data. Change data can remove a component of between‐person variability from the analysis. On the other hand, calculation of change needs two assessments (baseline and endpoint), which can be difficult in unstable and difficult to measure conditions such as schizophrenia. We decided primarily to use endpoint data, and only use change data if the former were not available. We combined endpoint and change data in the analysis as we preferred to use mean differences (MD) rather than standardised mean differences (SMD) throughout (Higgins 2011).
2.4 Skewed data
Continuous data on clinical and social outcomes are often not normally distributed. To avoid the pitfall of applying parametric tests to non‐parametric data, we applied the following standards to relevant data before inclusion.
Please note, we planned to enter data from studies of at least 200 participants in the analysis, because skewed data pose less of a problem in large studies. We entered all relevant change data as when continuous data are presented on a scale that includes a possibility of negative values (such as change data), it is difficult to tell whether data are skewed or not.
For endpoint data from studies < 200 participants:
(a) when a scale starts from the finite number zero, we subtracted the lowest possible value from the mean, and divided this by the standard deviation (SD). If this value was lower than 1, it strongly suggests a skew and we excluded these data. If this ratio was higher than one but below 2, there is suggestion of skew. We entered these data and tested whether their inclusion or exclusion changed the results substantially. Finally, if the ratio was larger than 2 we included these data, because skew is less likely (Altman 1996; Higgins 2011).
(b) if a scale starts from a positive value (such as the Positive and Negative Syndrome Scale (PANSS), (Kay 1986), which can have values from 30 to 210), we modified the calculation described above to take the scale starting point into account. In these cases skew is present if 2 SD > (S‐S min), where S is the mean score and 'S min' is the minimum score.
2.5 Common measure
Where relevant, to facilitate comparison between trials, we converted variables that can be reported in different metrics, such as days in hospital (mean days per year, per week or per month) to a common metric (e.g. mean days per month).
2.6 Conversion of continuous to binary
Where possible, we converted continuous outcome measures to dichotomous data. This can be done by identifying cut‐off points on rating scales and dividing participants accordingly into 'clinically improved' or 'not clinically improved'. It is generally assumed that if there is a 50% reduction in a scale‐derived score such as the Brief Psychiatric Rating Scale (BPRS, Overall 1962) or the Positive and Negative Syndrome Scale (PANSS, Kay 1986), this can be considered as a clinically significant response (Leucht 2005a; Leucht 2005b). If data based on these thresholds were not available, we used the primary cut‐off presented by the original authors.
2.7 Direction of graphs
Where possible, we entered data in such a way that the area to the left of the line of no effect indicated a favourable outcome for the active intervention. Where keeping to this made it impossible to avoid outcome titles with clumsy double‐negatives (e.g. 'Not un‐improved'), we presented data where the left of the line indicates an unfavourable outcome and noted this in the relevant graphs.
Assessment of risk of bias in included studies
RA and HB independently assessed risk of bias within the included studies by using criteria described in the Cochrane Handbook for Systematic Reviews of Interventions to assess trial quality (Higgins 2011). This set of criteria is based on evidence of associations between overestimate of effect and high risk of bias of the article such as sequence generation, allocation concealment, blinding, incomplete outcome data and selective reporting.
If the raters disagreed, we made the final rating by consensus, with the involvement of another member of the review group. Where inadequate details of randomisation and other characteristics of trials were provided, we contacted authors of the studies contacted in order to obtain further information. If non‐concurrence occurred, we reported this.
We noted the level of risk of bias in the text of the review and in Figure 2, Figure 3 and summary of findings Table 8.

Methodological quality summary: review authors' judgements about each methodological quality item for each included study.
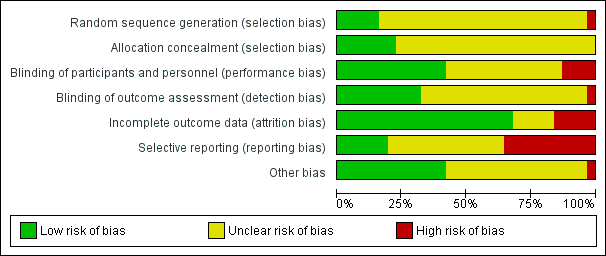
'Risk of bias' graph: review authors' judgements about each risk of bias item presented as percentages across all included studies.
Measures of treatment effect
1. Binary data
For binary outcomes we calculated a standard estimation of the risk ratio (RR) and its 95% confidence interval (CI). It has been shown that RR is more intuitive (Boissel 1999) than odds ratios as odds ratios tend to be interpreted as RR by clinicians (Deeks 2000).
2. Continuous data
For continuous outcomes we estimated mean difference (MD) between groups. We preferred not to calculate effect size measures (standardised mean difference (SMD)). However, if scales of very considerable similarity were used, we presumed there was a small difference in measurement, and calculated effect size and transformed the effect back to the units of one or more of the specific instruments.
Unit of analysis issues
1. Cluster trials
Studies increasingly employ 'cluster randomisation' (such as randomisation by clinician or practice) but analysis and pooling of clustered data poses problems. Firstly, authors often fail to account for intra‐class correlation in clustered studies, leading to a 'unit of analysis' error (Divine 1992) whereby P values are spuriously low, confidence intervals unduly narrow and statistical significance overestimated. This causes type I errors (Bland 1997; Gulliford 1999).
Had cluster trials been included and clustering had not been accounted for in primary studies, we would have presented such data in a table, with a (*) symbol to indicate the presence of a probable unit of analysis error. In subsequent versions of this review, if cluster‐randomised trials are included, we will seek to contact first authors of studies to obtain intra‐class correlation coefficients ICCs) for their clustered data and adjust for this by using accepted methods (Gulliford 1999). Where clustering has been incorporated into the analysis of primary studies, we will present these data as if from a non‐cluster randomised study, but adjust for the clustering effect.
We have sought statistical advice and have been advised that the binary data as presented in a report should be divided by a 'design effect'. This is calculated using the mean number of participants per cluster (m) and the ICC [Design effect=1+(m‐1)*ICC] (Donner 2002). If the ICC is not reported it will be assumed to be 0.1 (Ukoumunne 1999).
If cluster studies have been appropriately analysed taking into account ICCs and relevant data documented in the report, synthesis with other studies would be possible using the generic inverse variance technique.
2. Cross‐over trials
A major concern of cross‐over trials is the carry‐over effect. It occurs if an effect (e.g. pharmacological, physiological or psychological) of the treatment in the first phase is carried over to the second phase. As a consequence, on entry to the second phase the participants can differ systematically from their initial state despite a wash‐out phase. For the same reason cross‐over trials are not appropriate if the condition of interest is unstable (Elbourne 2002). As both effects are very likely in severe mental illness, we only used data of the first phase of cross‐over studies.
3. Studies with multiple treatment groups
Where a study involved more than two treatment arms, if relevant, we presented the additional treatment arms in comparisons. If data were binary we simply added and combined within the two‐by‐two table. If data were continuous, we combined data following the formula in section 7.7.3.8 (Combining groups) of the Cochrane Handbook for Systematic Reviews of Interventions (Higgins 2011). We did not use data where the additional treatment arms were not relevant.
Dealing with missing data
1. Overall loss of credibility
At some degree of loss of follow‐up, data must lose credibility (Xia 2009). We chose that, for any particular outcome, should more than 50% of data be unaccounted for, we would not reproduce these data or use them within analyses. If, however, more than 50% of those in one arm of a study were lost, but the total loss was less than 50%, we addressed this within the 'Summary of findings' table/s by down‐rating quality. We also downgraded quality within the 'Summary of findings' table/s should loss be 25% to 50% in total.
2. Binary
In the case where attrition for a binary outcome was between 0% and 50% and where these data were not clearly described, we presented data on a 'once‐randomised‐always‐analyse' basis (an intention‐to‐treat (ITT) analysis). We assumed all those leaving the study early to have no improvement. We undertook a sensitivity analysis to test how prone the primary outcomes were to change by comparing data only from people who completed the study to that point to the ITT analysis using the above assumptions.
3. Continuous
3.1 Attrition
We reported and used data where attrition for a continuous outcome was between 0% and 50%, and data only from people who completed the study to that point were reported.
3.2 Standard deviations
If standard deviations (SDs) were not reported, we first tried to obtain the missing values from the authors. If not available, where there were missing measures of variance for continuous data, but an exact standard error (SE) and confidence intervals available for group means, and either the P value or t value available for differences in mean, we calculated them according to the rules described in the Cochrane Handbook for Systematic reviews of Interventions (Higgins 2011). When only the SE is reported, SDs are calculated by the formula SD=SE * square root (n). Chapters 7.7.3 and 16.1.3 of the Cochrane Handbook for Systematic reviews of Interventions (Higgins 2011) present detailed formulae for estimating SDs from P values, t or F values, confidence intervals, ranges or other statistics. If these formulae did not apply, we calculated the SDs according to a validated imputation method which is based on the SDs of the other included studies (Furukawa 2006). Although some of these imputation strategies can introduce error, the alternative would be to exclude a given study’s outcome and thus to lose information. We nevertheless examined the validity of the imputations in a sensitivity analysis excluding imputed values.
3.3 Assumptions about participants who left the trials early or were lost to follow‐up
Various methods are available to account for participants who left the trials early or were lost to follow‐up. Some trials just present the results of study completers, others use the method of last observation carried forward (LOCF), while more recently methods such as multiple imputation or mixed‐effects models for repeated measurements (MMRM) have become more of a standard. While the latter methods seem to be somewhat better than LOCF (Leon 2006), we feel that the high percentage of participants leaving the studies early and differences in the reasons for leaving the studies early between groups is often the core problem in randomised schizophrenia trials. We therefore did not exclude studies based on the statistical approach used. However, we prefered to use the more sophisticated approaches. (e.g. MMRM or multiple‐imputation) and only presented completer analyses if some kind of ITT data were not available at all. Moreover, we addressed this issue in the item "incomplete outcome data" of the 'Risk of bias' tool.
Assessment of heterogeneity
1. Clinical heterogeneity
We considered all included studies initially, without seeing comparison data, to judge clinical heterogeneity. We simply inspected all studies for clearly outlying people or situations which we had not predicted would arise and discussed these in the text if they arose.
2. Methodological heterogeneity
We considered all included studies initially, without seeing comparison data, to judge methodological heterogeneity. We simply inspected all studies for clearly outlying methods which we had not predicted would arise and discussed these in the text if they arose.
3. Statistical heterogeneity
3.1 Visual inspection
We visually inspected graphs to investigate the possibility of statistical heterogeneity.
3.2 Employing the I2 statistic
We investigated heterogeneity between studies by considering the I2 method alongside the Chi2 P value. The I2 provides an estimate of the percentage of inconsistency thought to be due to chance (Higgins 2003). The importance of the observed value of I2 depends on i. magnitude and direction of effects and ii. strength of evidence for heterogeneity (e.g. P value from Chi2 test, or a confidence interval for I2). An I2 estimate greater than or equal to around 50% accompanied by a statistically significant Chi2 statistic, can be interpreted as evidence of substantial levels of heterogeneity (Section 9.5.2 Cochrane Handbook for Systematic Reviews of InterventionsHiggins 2011). We explored and discussed in the text potential reasons for substantial levels of heterogeneity (Subgroup analysis and investigation of heterogeneity).
Assessment of reporting biases
Reporting biases arise when the dissemination of research findings is influenced by the nature and direction of results (Egger 1997). These are described in Section 10 of the Cochrane Handbook for Systematic Reviews of Interventions (Higgins 2011). We are aware that funnel plots may be useful in investigating reporting biases but are of limited power to detect small‐study effects. We did not use funnel plots for outcomes where there were 10or fewer studies, or where all studies were of similar sizes. In future versions of this review, if funnel plots are possible, we will seek statistical advice in their interpretation.
Data synthesis
We understand that there is no closed argument for preference for use of fixed‐effect or random‐effects models. The random‐effects method incorporates an assumption that the different studies are estimating different, yet related, intervention effects. This often seems to be true to us and the random‐effects model takes into account differences between studies even if there is no statistically significant heterogeneity. There is, however, a disadvantage to the random‐effects model. It puts added weight onto small studies, which often are the most biased ones. Depending on the direction of effect these studies can either inflate or deflate the effect size. We chose the fixed‐effect model for all analyses.
Subgroup analysis and investigation of heterogeneity
1. Subgroup analyses
With this wide range of miscellaneous treatments of mainly experimental interventions, we did not expect many studies or participants per intervention that would enable us to carry out subgroup analyses. We proposed to undertake this review and provide an overview of the effects of this group of miscellaneous treatments for people with schizophrenia in general. In addition, however, we tried to report data on subgroups of people in the same clinical state, stage and with similar problems.
2. Investigation of heterogeneity
We reported when inconsistency was high. First, we investigated whether data were entered correctly. Second, if data were correct, we visually inspected the graph and successively removed outlying studies to see if homogeneity is restored. For this review we decided that should this occur with data contributing to the summary finding of no more than around 10% of the total weighting, we would present data. If not, we did not pool such data and discussed issues. We know of no supporting research for this 10% cut‐off but are investigating use of prediction intervals as an alternative to this unsatisfactory state.
When unanticipated clinical or methodological heterogeneity were obvious, we simply discussed the issues. We did not undertake sensitivity analyses relating to these.
Sensitivity analysis
1. Implication of randomisation
If trials were described in some way as to imply randomisation, we planned to undertake a sensitivity analyses for the primary outcomes. We would have included these studies in the analyses and if there was no substantive difference when the implied randomised studies were added to those with better description of randomisation, then we would have used relevant data from these studies.
2. Assumptions for lost binary data
Where assumptions had to be made regarding people lost to follow‐up (see Dealing with missing data), we compared the findings of the primary outcomes when we used our assumption compared with completer data only. If there was a substantial difference, we reported and discussed these results but continued to employ our assumption.
Where assumptions have to be made regarding missing SDs data (see Dealing with missing data), we compared the findings on primary outcomes when we used our assumption compared with completer data only. We undertook a sensitivity analysis to test how prone results were to change when 'completer' data only were compared to the imputed data using the above assumption. If there was a substantial difference, we reported and discussed these results but continued to employ our assumption.
3. Risk of bias
We analysed the effects of excluding trials that we judged to be at high risk of bias across one or more of the domains of randomisation Risk of bias in included studies for the meta‐analysis of the primary outcomes. If the exclusion of trials at high risk of bias did not substantially alter the direction of effect or the precision of the effect estimates, we included data from these trials in the analysis.
4. Imputed values
Had we included cluster‐randomised trials, we planned to undertake a sensitivity analysis to assess the effects of including data from trials where we used imputed values for ICC in calculating the design effect in cluster‐randomised trials.
5. Fixed and random effects
We synthesised data using a fixed‐effect model, however, we also synthesised data for the primary outcomes using a random‐effects model to evaluate whether this altered the significance of the results.
If we found substantial differences in the direction or precision of effect estimates in any of the sensitivity analyses listed above, we did not pool data from the excluded trials with the other trials contributing to the outcome, but presented them separately.
Results
Description of studies
Please see Characteristics of included studies; Characteristics of excluded studies; Characteristics of studies awaiting classification, and Characteristics of ongoing studies.
Results of the search
The updated searches carries out in 2015 and 2017 were part of an update of nine Cochrane reviews, see Table 1.
The 2015 search retrieved 704 references for 344 studies, see Figure 4 for study flow diagram. We also screened the full texts of 10 additional records that were identified through screening reference lists of Cochrane reviews on tardive dyskinesia (TD). From these records we identified 60 new potentially relevant records for this review and screened the full texts. Agreement about which studies may have been randomised was 100%.
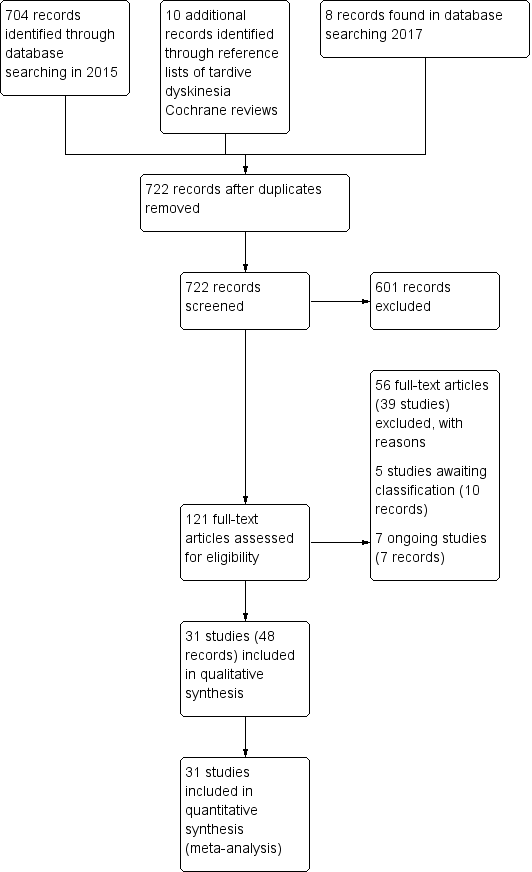
Study flow diagram for 2015 and 2017 searches.
Twenty‐six of these 60 new records are records for the 21 new included studies in this update (Bucci 1971; Castro 2011; Gardos 1979; Glover 1980; Goff 1993; Hajioff 1983; Koshino 1979; Koshino 1983; Meco 1989; O'Brien 2014; Rastogi 1982; Richardson 2003; Shamir 2000; Shamir 2001; Shi 2009; UCB Pharma 2005; Woods 2008; Yang 1999; Zeng 1995; Zeng 1996; Zhang 2011). Three of the records are new companion papers to two previously included studies (Libov 2007; Mosnik 1997). Twenty of the new records were excluded (11 new unique excluded studies: Chaplin 2002; Fann 1973; Goetz 2013; Huang 1981; Kabes 1985; Lieberman 1987; Lieberman 1994; Moore 1980; Shah 2012; Tamminga 1983; Vaddadi 2002), and three of which were companions to previously excluded studies (Casey 1981; Kabes 1982; Vaddadi 1989). Four of the 60 records are in awaiting classification under three of the studies (Fernandez 2016; Hauser 2016; NCT01393600 2011) and seven are ongoing studies (Garcia 1992; ISRCTN14688109 2015; NCT00621634 2008; NCT01391390 2011; NCT01688037 2012; NCT01804920 2013; NCT02291861 2014).
The 2017 search found eight records (five studies). The editorial base of Cochrane Schizophrenia screened these records and six records (four studies) have been put into awaiting classification (Fernandez 2016; Hauser 2016; Pattojoshi 2016; Xu 2012), see Characteristics of studies awaiting classification. The two remaining records are companion papers to an included study identified in the 2015 search (O'Brien 2014).
In addition, one previously excluded study could be included (Cai 1988), two studies that were in awaiting classification in the previous version of the review could be excluded (Bockenheimer 1976; Koller 1982), and one study that was in awaiting classification in the previous review was in fact a companion to the included study Libov 2007.
Included studies
This review now includes 31 studies of 24 interventions with 1278 participants, published between 1971 and 2014. See Table 2 for an overview of characteristics of the included studies.
1. Methods
All studies were stated to be randomised and most were double‐blind. For further details please see sections below on allocation and blinding.
2. Design
All included studies presented a parallel longitudinal design. Seven of the 31 studies used a cross‐over design with two periods (Gardos 1979; Libov 2007; Mackay 1980; Meco 1989; Mosnik 1997; Shamir 2000; Shamir 2001). We had considered this as likely when embarking on the review and have used only the data from before the first cross‐over for the reasons outlined above (Unit of analysis issues).
3. Duration
Most studies were of short duration (less than nine weeks) and only one had a follow‐up period longer than three months (Bucci 1971).
4. Participants
Participants, now totalling 1278 people, were mostly men in their 50s, with diagnoses of various chronic psychiatric disorders, but mainly schizophrenia. All had antipsychotic‐induced TD though only eight trials explicitly described the use of criteria for the diagnosis of TD. The number of participants ranged from 10 to 157 (median 34).
5. Setting
Most trials were conducted in hospital, seven included both in‐ and outpatients (Castro 2011; Emsley 2006; Kojima 1992; Mosnik 1997; O'Brien 2014; Richardson 2003; Wolkin 1986), and five included only outpatients (Bucci 1971; Glazer 1985; Glover 1980; Goff 1993; Woods 2008). The studies themselves were from around the world, with 10 conducted in the USA (Bucci 1971; Gardos 1979; Glazer 1985; Glover 1980; Goff 1993; Mosnik 1997; O'Brien 2014; Richardson 2003; Wolkin 1986; Woods 2008), six in China (Cai 1988; Shi 2009; Yang 1999; Zeng 1995; Zeng 1996; Zhang 2011), four in Japan (Kojima 1992; Koshino 1979; Koshino 1983; Matsunaga 1988), three in Israel (Libov 2007; Shamir 2000; Shamir 2001), three in the UK (Hajioff 1983; Mackay 1980; Rastogi 1982), and one each in Italy (Meco 1989), Venezuela (Castro 2011), South Africa (Emsley 2006), Morocco (Mouret 1991), and Belgium/Bulgaria (UCB Pharma 2005).
6. Interventions
6.1 Miscellaneous drugs
6.1.1 Alkaloids
a. Co‐dergocrine mesylate (Hydergine)
Co‐dergocrine mesylate (Hydergine; dihydrogenated ergot alkaloids) is an ergot alkaloid used to treat patients with dementia. Hajioff 1983 and Rastogi 1982 both used co‐dergocrine mesylate in a dose of 4.5 mg/day. Koshino 1983 used dihydrogenated ergot alkaloids in a dose of 6 mg/day.
b. L‐stepholidine
Stepholidine is a naturally occurring chemical compound found in the herb Stephania intermedia.Cai 1988 used L‐stepholidine in a dose of two tablets, three times per day (no exact dosage provided).
c. Papaverine
Papaverine is a vasodilating agent. Gardos 1979 used papaverine in a dose ranging from 300 mg/day to 600 mg/day.
6.1.2 Amino acids
a. Branched‐chain amino acids (BCAAs)
BCAAs are essential amino acids. Richardson 2003 used branched‐chain amino acids in a dose ranging from 56 mg/kg to 222 mg/kg body weight.
b. Phenylalanine
Phenylalanine is an essential amino acid. Mosnik 1997 used phenylalanine in a dose of 100 mg/kg body weight for one day.
6.1.3 Antidepressant
a. MAO‐B inhibitor ‐ Selegeline
Goff 1993 used selegeline, a drug that is mainly used to reduce symptoms of Parkinson's.
b. Monoamine oxidase inhibitor (MAOI) ‐ Isocarboxazid
Isocarboxazid is a MAOI) Bucci 1971 used isocarboxazid in a dose ranging from 20 mg/day to 100 mg/day.
c. SSRI ‐ Ritanserin
Ritanserin is an experimental serotonin receptor antagonist and was used in Meco 1989.
6.1.4 Antiepileptics
a. Levetiracetam
Levetiracetam is a medication used to treat epilepsy. It was used by two studies (UCB Pharma 2005; Woods 2008) in a maximum dose of 3000 mg/day.
6.1.5 Antihistamines
a. Cyproheptadine
Cyproheptadine is a first‐generation antihistamine with additional anticholinergic, antiserotonergic, and local anaesthetic properties. Koshino 1979 used cyproheptadine in a dose ranging from 12 mg/day to 24 mg/day.
6.1.6 Antipsychotics
a. Promethazine
Yang 1999 used promethazine, a drug mainly used for sedation and to treat nausea.
6.1.7 Anxiolytics
a. Buspirone
Buspirone is an anxiolytic psychotropic drug used to treat general anxiety disorder. It was used by one study (Zeng 1995) in a dose of 6 to 12 capsules per day (exact dose not provided).
6.1.8 Cognitive enhancer
a. Pemoline
Pemoline is a stimulant drug of the 4‐oxazolidinone class. It was used by Zeng 1996 in a dose of two capsules per day (exact dose not provided).
b. Piracetam
Piracetam is a cyclic derivative of GABA. Libov 2007 used piracetam in a dose of 4800 mg/day.
6.1.9 Enzyme inhibitor
a. Valbenazine (NBI‐98854)
Valbenazine is a vesicular monoamine transporter type 2 (VMAT2) inhibitor. O'Brien 2014 used NBI‐98854 in a dose ranging from 25 mg/day to 75 mg/day.
6.1.10 Fatty acid
a. Ethyl‐EPA
Ethyl‐EPA is a derivative of eicosapentaenoic acid (EPA), an omega‐3 fatty acid. Emsley 2006 used ethyl‐EPA in a dose of 2 g/day.
b. Gamma‐linolenic acid
Gamma‐linolenic acid was first isolated form the seed oil of evening primrose. It was used by one study (Wolkin 1986) in a dose of 600 mg/day.
6.1.11 Herb
a. EGb‐761
EGb‐761 is the standardised extract of Ginkgo biloba leaves that has antioxidant properties as a free radical scavenger. It was used by Zhang 2011 in a dose of 240 mg/day.
6.1.12 Hormone
a. Oestrogen
Oestrogen is the primary female sex hormone. Glazer 1985 used oestrogen in a dose of 1.25 mg/day.
b. Insulin
Insulin is a peptide hormone produced by the pancreas. Mouret 1991 used insulin in a dose of 10 units per day (exact dose not provided).
c. Melatonin
Melatonin is a naturally occurring hormone. Four studies (Castro 2011; Shamir 2000; Shamir 2001; Shi 2009) used melatonin in doses ranging from 2 mg/day to 20 mg/day.
6.1.13 Mood stabiliser
a. Lithium
Lithium is primary used for bipolar disorder. Mackay 1980 used lithium in an unspecified dose.
6.1.14 Polypeptide
a. Ceruletide
Ceruletide is a 10 amino acid oligopeptide that stimulates smooth muscle and increases digestive secretions. Kojima 1992 and Matsunaga 1988 both used ceruletide in a dose of 0.8 microgram/kg/week.
6.2 Other miscellaneous treatments
6.2.1 Hypnosis or relaxation
Glover 1980 used eight sessions of hypnosis or relaxation.
6.3 Comparison groups
In most of the studies a placebo was used as a comparison group, with few further details given. In one study the comparison group was given procyclidine (Bucci 1971), which is an anticholinergic drug (see also Bergman 2018a). Three studies (Gardos 1979; Glover 1980; Shi 2009) compared active intervention against standard treatment.
Participants remained on schizophrenia treatment antipsychotic medication during the trials.
7. Outcomes
7.1 General
Some outcomes were presented in graphs, inexact P values of differences, or a statement of significant or non‐significant difference. This made it impossible to acquire raw data for synthesis. Some continuous outcomes could not be extracted due to missing number of participants or missing means, standard deviations, or standard errors. All included studies used the last observation carried forward (LOCF) strategy for the intention‐to‐treat (ITT) analysis of dichotomous data.
7.2 Scales used to measure the TD symptoms
We have shown details of the scales that provided usable data below. We have provided reasons for exclusions of data under 'Outcomes' in the Characteristics of included studies table.
7.2.1 Abnormal Involuntary Movement Scale (AIMS)
The AIMS (Guy 1976) is a 12‐item scale consisting of a standardised examination followed by questions rating the orofacial, extremity and trunk movements, as well as three global measurements. Each of these 10 items can be scored from zero (none) to four (severe). Two additional items assess the dental status. The AIMS ranges from zero to 40, with higher scores indicating greater severity.
7.2.2 Abbreviated Dyskinesia Rating Scale ‐ Simpson Rating Scale (SRS)
This 15‐item scale measures the movements around the orofacial region, neck, trunk and extremities (Simpson 1979). Each of these items can be scored from one (absent) to six (severe). This scale ranges from 10 to 102 with higher scores indicating greater severity.
7.2.3 Rockland Tardive Dyskinesia Rating Scale‐ Rockland TD
The Rockland TD (Simpson 1970) is a 34‐item scale consisting of measurement of the movements around the orofacial region, neck, trunk and extremities. Each of these items can be scored from zero (absent) to five (severe). This scale ranges from 10 to 102, with higher scores indicating greater severity.
7.2.4 Extrapyramidal symptom rating scale (ESRS)
The ESRS was developed to assess four types of drug‐induced movement disorders (DIMD): parkinsonism, akathisia, dystonia, and TD (Chouinard 2005). The score for TD, ranging from zero to 42, is based on the sum of all seven items in the TD objective examination.
7.2.5 St. Hans Rating Scale (SHRS) for extrapyramidal syndromes
The SHRS is a multidimensional rating scale for the evaluation of antipsychotic‐induced hyperkinesia, parkinsonism, akathisia and dystonia (Gerlach 1993). Each item is rated from zero (not present) to six (present to an extreme degree). This gives a total score from zero to 48 for hyperkinesia and parkinsonism.
7.3 Scales used to measure global‐ and mental state and behaviour
7.3.1 Brief Psychiatric Rating Scale (BPRS)
The BPRS is an 18‐item scale measuring positive symptoms, general psychopathology and affective symptoms (Overall 1962). The original scale has 16 items, although a revised 18‐item scale is commonly used. Total scores can range from zero to 126. Each item is rated on a seven‐point scale, with high scores indicating more severe symptoms.
7.3.2 Wechsler Adult Intelligence Scale (WAIS
The WAIS is an IQ test designed to measure intelligence and cognitive ability in adults and older adolescents (Wechsler 1958).
7.3.3 Wechsler Memory Scale (WMS)
The WMS is a neuropsychological test designed to measure different memory functions in a person (Wechsler 1945).
7.3.4 Positive and Negative Syndrome Scale (PANSS)
The PANSS is a medical scale used for measuring symptom severity of patients with schizophrenia (Kay 1987). The patient is rated from one to seven on 30 different symptoms based on the interview as well as reports of family members or primary care hospital workers.
7.3.5 Continuous performance test (CPT)
The CPT is a neurophysiological test that measures a person's sustained and selective attention (Rosvold 1956).
7.3.6 Clinical Global Impression Scale (CGI)
The CGI assesses both severity of illness and clinical improvement by comparing conditions of the person standardised against other people with the same diagnosis (Guy 1976).
7.4 Scales used to measure adverse events
7.4.1 Treatment Emergent Symptom Scale (TESS)
The TESS is a checklist that assesses a variety of characteristics for each adverse event (Guy 1976).
Excluded studies
There are 39 excluded studies. Sixteen studies (Bjorndal 1980; Blum 1984; Bowers 1979: Casey 1981; Gardos 1978; Jus 1974; Korsgaard 1981; Moore 1980; Prange 1973; Reda 1974; Reker 1982; Simpson 1976 a; Simpson 1976 b; Villeneuve 1970; Villeneuve 1980; Volavka 1986) were not randomised and we have therefore excluded them. Eight studies (Apseloff 2000; Chaplin 2002; Emsley 2002; Goetz 2013; Lieberman 1987; Lieberman 1994; Shah 2012; Vaddadi 2002) were excluded because participants had schizophrenia or other disorders but not TD. After unfruitful attempts to contact authors for further details, we have also excluded a further 14f randomised studies which reported no usable data (Fann 1973; Fudge 1991; Gerlach 1975; Jus 1978; Kabes 1982; Kabes 1985; Koller 1982; Lindenmayer 1988; Nasrallah 1986; Peselow 1989; Tamminga 1983; Vaddadi 1989; Wonodi 2004). One study that was excluded in the previous version of this review (Huang 1981), and Bockenheimer 1976 that was previously in awaiting classification, have now been included in other intervention reviews for TD and were excluded from this review.
Awaiting classification
There are currently five studies awaiting classification.
-
Fernandez 2016 investigated the VMAT‐2 inhibitor deutetrabenazine (SD‐809) compared to placebo in participants with TD in the USA and three European countries. We could only identify a conference abstract with limited details for this study. We are awaiting more detailed data to add to the review.
-
Hauser 2016 investigated the VMAT‐2 inhibitor valbenazine (NBI‐98854) compared to placebo in participants with TD in Canada, Puerto Rico, and the USA. We could only identify two conference abstracts, a poster, and an online trial registry record with limited details for this study. We are awaiting more detailed data to add to the review.
-
NCT01393600 2011 investigated the VMAT‐2 inhibitor valbenazine (NBI‐98854) compared to placebo in participants with TD in the USA. This online cross‐over trial record reported outcome results for combined groups only. We are awaiting separate results for the period before cross‐over.
-
Pattojoshi 2016 investigated right dorsolateral prefrontal cortex‐repetitive transcranial magnetic stimulation (rTMS) versus sham rTMS in participants with TD. We could only identify a conference abstract with limited details for this study. We are awaiting more detailed data to add to the review.
-
Xu 2012 investigated Ginkgo biloba extract versus standard treatment in participants with TD in China. We are awaiting translation of this article in Chinese.
Ongoing studies
We identified seven ongoing studies.
-
Garcia 1992 investigates buspirone compared with placebo in participants with TD in the USA.
-
ISRCTN14688109 2015 investigates cannabidiol extract compared to vitamin E in participants with TD in Nigeria.
-
NCT00621634 2008 investigates omega‐3 fish oil capsules (including docosahexaenoic acid) compared to placebo in participants with TD in Canada.
-
NCT01391390 2011 investigates melatonin compared to placebo in participants with TD in China.
-
(NCT01688037 2012 investigates the VMAT‐2 inhibitor valbenazine (NBI‐98854) compared to placebo in participants with TD in the USA and Puerto Rico.
-
NCT01804920 2013 investigates d‐serine compared to placebo in participants with TD in Israel.
-
NCT02291861 2014 investigates the VMAT‐2 inhibitor deutetrabenazine (SD‐809) compared to placebo in participants with TD in the USA and five European countries.
Risk of bias in included studies
Please refer to Figure 2 and Figure 3 for graphical overviews of the risk of bias in the included studies.
Allocation
Only four studies (Shamir 2000; Shamir 2001; Yang 1999; Zhang 2011) were rated at low risk of selection bias. These studies were randomised centrally and described concealed allocation to groups. Most other studies were not explicit about how allocation was achieved or how a randomised sequence was generated other than using the word "randomized".
Blinding
Although most studies were stated to be conducted on a double‐blind basis, only five studies (Cai 1988; Goff 1993; Mackay 1980; Shamir 2000; Zhang 2011) explicitly described how blinding of the participants, personnel, and outcome assessors was performed. No study reported testing the blindness of raters, clinicians and trial participants. Many of the other studies gave no further details other than stating that they were double‐blinded.
Incomplete outcome data
Most studies reported that either all participants completed the study, or analysed outcomes for all randomised participants. Five studies (Goff 1993; Kojima 1992; Libov 2007; Matsunaga 1988; UCB Pharma 2005) were rated as having a high risk of attrition bias, due to high rate of participants who dropped out and a lack of ITT analyses.
Selective reporting
The majority of data in this review originates from published reports. Expected outcomes (impact on TD symptoms) were reported for most of the trials. Five studies reported results of all outcomes listed in the methods section fully (Glover 1980; Libov 2007; Shi 2009; Yang 1999; Zeng 1995; Zeng 1996). We rated risk of reporting bias for many of the other studies as unclear because we have had no opportunity to see protocols of these trials to compare the outcomes reported in the full‐text publications with what was measured during the conduct of the trial. Eleven studies did not fully report outcomes that were measured during the study and were rated at high risk of reporting bias. Attempts to contact authors of trials for additional data were unsuccessful.
Other potential sources of bias
All studies had small or very small sample sizes, which increases the likelihood of treatment effects going undetected. Seven of the studies used a cross‐over design (Gardos 1979; Libov 2007; Mackay 1980; Meco 1989; Mosnik 1997; Shamir 2000; Shamir 2001). One study (Glazer 1985) was rated at high risk of bias as they described unequal groups at baseline with regard to duration of TD symptoms and medication use.
Effects of interventions
See: Summary of findings for the main comparison ALKALOID ‐ DIHYDROGENATED ERGOT ALKALOIDS versus PLACEBO for antipsychotic‐induced tardive dyskinesia; Summary of findings 2 ANTIEPILEPTIC ‐ LEVETIRACETAM versus PLACEBO for antipsychotic‐induced tardive dyskinesia; Summary of findings 3 ANXIOLYTIC ‐ BUSPIRONE versus PLACEBO for antipsychotic‐induced tardive dyskinesia; Summary of findings 4 ENZYME INHIBITOR ‐ VMAT2‐INHIBITOR (valbenazine) versus PLACEBO for antipsychotic‐induced tardive dyskinesia; Summary of findings 5 FATTY ACID ‐ ETHYL‐EPA versus PLACEBO for antipsychotic‐induced tardive dyskinesia; Summary of findings 6 HERB ‐ GINKGO BILOBA versus PLACEBO for antipsychotic‐induced tardive dyskinesia; Summary of findings 7 HORMONE ‐ MELATONIN versus PLACEBO OR NO TREATMENT for antipsychotic‐induced tardive dyskinesia; Summary of findings 8 POLYPEPTIDE ‐ CERULETIDE versus PLACEBO for antipsychotic‐induced tardive dyskinesia; Summary of findings 9 HYPNOSIS or RELAXATION versus TAU for antipsychotic‐induced tardive dyskinesia
1. Comparison 1. Alkaloid ‐ Dihydrogenated ergot alkaloids (DEA) versus placebo
Three trials (Hajioff 1983; Koshino 1983; Rastogi 1982) carried out in Japan and the UK that included 88 inpatients with antipsychotic‐induced TD were included for this comparison.
1.1 TD symptoms
1.1.1 No clinically important improvement
The overall results for 'clinically relevant improvement' found a benefit in favour of DEA against placebo (low‐quality evidence, 1 trial, 28 people, risk ratio (RR) 0.45, 95% confidence interval (CI) 0.21 to 0.97, Analysis 1.1).
1.1.2 Not any improvement
For the outcome of 'any improvement in TD symptoms', we found no benefit of DEA against placebo (1 trial, 28 people, RR 0.50, 95% CI 0.23 to 1.09, Analysis 1.2).
1.1.3 Deterioration of symptoms
There was no difference on deterioration of symptoms between DEA and placebo (very low‐quality evidence, 1 trial, 28 people, RR 0.33, 95% CI 0.01 to 7.55, Analysis 1.3).
1.1.4 Average endpoint scores
TD symptoms were also measured on the continuous Simpson scale (see above). No benefit was found when DEA is compared to placebo (1 trial, 28 people, mean difference (MD) ‐2.80, 95% CI ‐12.25 to 6.65, Analysis 1.4).
1.1.4 Average change scores
TD symptoms were also measured on the continuous Abnormal Involuntary Movement Scale (AIMS), Rockland Tardive Dyskinesia Rating Scale (RTDS), and Abbreviated Dyskinesia Scale (ADS) scales (see above). No benefit was found when pooling changes scores of these scales for DEA compared to placebo (2 trials, 59 people, standardised mean difference (SMD) ‐0.31, 95% CI ‐0.83 to 0.20, Analysis 1.5).
1.2 Mental state
For the outcome of mental state deterioration, no benefit was found for DEA when compared to placebo (1 trial, 28 people, MD 0.50, 95% CI 0.05 to 4.90, Analysis 1.6).
1.3 Adverse effects
There was no difference in the incidence of ‘any adverse effect’ between DEA and placebo (very low‐quality evidence, 1 trial, 28 people, RR 2.33 95% CI 0.75 to 7.23, Analysis 1.7).
1.4 Leaving the study early
Using DEA did not significantly increase the chances of a person leaving the study early (very low‐quality evidence, 2 trials, 48 people, RR 0.33, 95% CI 0.02 to 7.32, Analysis 1.8).
2. Comparison 2. Alkaloid ‐ L‐Stepholidine (SPD) versus placebo
One trial (Cai 1988) that included 57 patients with antipsychotic‐induced TD was included for this comparison.
2.1 TD symptoms
2.1.1 No clinically important improvement
The overall results for 'clinically relevant improvement' found a benefit in favour of SPD against placebo (1 trial, 57 people, RR 0.54, 95% CI 0.35 to 0.82, Analysis 2.1).
2.2 Mental state
General mental state was measured using the continuous BPRS scale (see above). A benefit was found in favour of SPD when compared to placebo (1 trial, 20 people, MD ‐4.50, 95% CI ‐7.60 to ‐1.40, Analysis 2.2).
2.3 Adverse effects
No adverse effects were reported.
2.4 Leaving the study early
No participants left the included study early.
3. Comparison 3. Alkaloid ‐ Papaverine versus placebo
One trial (Gardos 1979) carried out in the USA that included 22 inpatients with antipsychotic‐induced TD was included for this comparison.
3.1 TD symptoms
TD symptoms were measured on the continuous AIMS scale (see above). No difference was found when papaverine was compared to placebo (1 trial, 22 people, MD 0.51, 95% CI ‐1.18 to 2.20, Analysis 3.1).
4. Comparison 4. Amino acid ‐ Branched‐chain amino acids (BCAA) versus placebo
One trial (Richardson 2003) carried out in the USA that included 52 in‐ and out‐patients with antipsychotic‐induced TD was included for this comparison.
4.1 TD symptoms
4.1.1 No clinically important improvement
The overall results for 'clinically relevant improvement' found no benefit of BCAA against placebo (1 trial, 52 people, RR 0.79, 95% CI 0.63 to 1.00, Analysis 4.1).
4.1.2 Not any improvement
For the outcome of 'any improvement in TD symptoms', we again found no benefit of BCAA against placebo (1 trial, 52 people, RR 0.64, 95% CI 0.36 to 1.11, Analysis 4.2).
4.1.3 Deterioration of symptoms
There was no difference on deterioration of symptoms between BCAA and placebo (1 trial, 36 people, RR 0.29, 95% CI 0.07 to 1.19, Analysis 4.3).
4.1.4 Average endpoint scores
TD symptoms were also measured on the continuous Simpson scale (see above). A benefit was found in favour of BCAA when compared to placebo (1 trial, 41 people, MD ‐92.90, 95% CI ‐167.57 to ‐18.23, Analysis 4.4).
4.2 Leaving the study early
Using BCAA did not significantly increase the chances of a person leaving the study early when compared to placebo (1 trial, 52 people, RR 0.84, 95% CI 0.37 to 1.92, Analysis 4.5).
5. Comparison 5. Amino acid ‐ Phenylalanine versus placebo
One trial (Mosnik 1997) carried out in the USA that included 18 in‐ and out‐patients with antipsychotic‐induced TD was included for this comparison.
5.1 Leaving the study early
Using phenylalanine did not significantly increase the chances of a person leaving the study early when compared to placebo (1 trial, 18 people, RR 2.45, 95% CI 0.11 to 53.25, Analysis 5.1).
6. Comparison 6. Antidepressant (MAO‐B inhibitor) ‐ Selegiline versus placebo
One trial (Goff 1993) carried out in the USA that included 33 outpatients with antipsychotic‐induced TD was included for this comparison.
6.1 TD symptoms
6.1.1 No clinically important improvement
The overall results for 'clinically relevant improvement' found no benefit of selegiline against placebo (1 trial, 33 people, RR 1.37, 95% CI 0.96 to 1.94; Analysis 6.1).
6.2 Leaving the study early
Using selegiline did not significantly increase the chances of a person leaving the study early (1 trial, 33 people, RR 10.39, 95% CI 0.62 to 173.97; Analysis 6.2).
7. Comparison 7. Antidepressant (MAOI) ‐ Isocarboxazid versus procyclidine
One trial (Bucci 1971) carried out in the USA that included 20 outpatients with antipsychotic‐induced TD was included for this comparison.
7.1 TD symptoms
7.1.1 No clinically important improvement
The overall results for 'clinically relevant improvement' found a benefit in favour of isocarboxazid against procyclidine (1 trial, 20 people, RR 0.24, 95% CI 0.08 to 0.71, Analysis 7.1).
7.1.2 Not any improvement
For the outcome of 'any improvement in TD symptoms', we again found a benefit in favour of isocarboxazid against procyclidine (1 trial, 20 people, RR 0.14, 95% CI 0.03 to 0.64, Analysis 7.2).
7.2 Adverse effects
There was no difference in the incidence of ‘any adverse effect’ between isocarboxazid and procyclidine (1 trial, 20 people, RR 3.00, 95% CI 0.14 to 65.90, Analysis 7.3).
7.3 Leaving the study early
Using isocarboxazid did not significantly increase the chances of a person leaving the study early compared with procyclidine (1 trial, 20 people, RR 3.00, 95% CI 0.14 to 65.90, Analysis 7.4).
8. Comparison 8. Antidepressant (SSRI) ‐ Ritanserin versus placebo
One trial (Meco 1989) carried out in Italy that included 10 inpatients with antipsychotic‐induced TD was included for this comparison.
8.1 TD symptoms
8.1.1 No clinically important improvement
For the outcome of 'any improvement in TD symptoms', we found no benefit of ritanserin against placebo (1 trial, 10 people, RR 1.00, 95% CI 0.70 to 1.43; Analysis 8.1).
8.1.2 Not any improvement
For the outcome of 'any improvement in TD symptoms', we again found no benefit of ritanserin against placebo (1 trial, 10 people, RR 0.28, 95% CI 0.02 to 4.66; Analysis 8.2).
8.1.3 Deterioration of symptoms
There was no difference on deterioration of TD symptoms between ritanserin and placebo (1 trial, 10 people, RR 0.47, 95% CI 0.02 to 9.26; Analysis 8.3).
8.1.4 Average change scores
TD symptoms were measured on the continuous AIMS scale (see above). No difference was found when ritanserin was compared to placebo (1 trial, 10 people, MD ‐2.00, 95% CI ‐5.93 to 1.93; Analysis 8.4).
8.2 Mental state
8.2.1 Deterioration of symptoms
There was no difference on deterioration of mental state symptoms between ritanserin and placebo (1 trial, 10 people, RR 0.47, 95% CI 0.02 to 9.26; Analysis 8.5).
8.2.2 Average change scores
General mental state was measured using the continuous BPRS scale (see above). No benefit was found for ritanserin when compared to placebo (1 trial, 10 people, MD ‐0.80, 95% CI ‐3.10 to 1.50; Analysis 8.6).
9. Comparison 9. Antiepileptic ‐ Levetiracetam versus placebo
Two trials (UCB Pharma 2005; Woods 2008) carried out in Belgium, Bulgaria, and the USA that included 119 in‐ or out‐patients with antipsychotic‐induced TD were included for this comparison.
9.1 TD symptoms
9.1.1 Average endpoint scores
TD symptoms were measured on the continuous AIMS scale (see above). A benefit was found in favour of levetiracetam compared to placebo (1 trial, 50 people, MD ‐2.18, 95% CI ‐3.65 to ‐0.71, Analysis 9.1).
9.1.1 Average change scores
TD symptoms were also measured on the continuous St Hans rating scale (see above). There was no difference in change scores between levetiracetam and placebo (1 trial, 69 people, MD 0.13, 95% CI ‐0.73 to 0.99, Analysis 9.2).
9.2 Leaving the study early
Using levetiracetam did not significantly increase the chances of a person leaving the study early (very low‐quality evidence, 2 trials, 119 people, RR 1.01, 95% CI 0.46 to 2.22, Analysis 9.3).
9.3 Adverse effects
There was no difference in the incidence of ‘any adverse effect’ between levetiracetam and placebo (low‐quality evidence, 1 trial, 69 people, RR 0.51,95% CI 0.25 to 1.04, Analysis 9.4).
9.4 Mental state
We found no difference between levetiracetam and placebo for deterioration of mental state (1 trial, 50 people, RR 0.67, 95% CI 0.12 to 3.65, Analysis 9.5).
10. Comparison 10. Antihistamine ‐ Cyproheptadine versus placebo
One trial (Koshino 1979) carried out in Japan that included 42 inpatients with schizophrenia and TD was included for this comparison.
10.1 TD symptoms
10.1.1 Not any improvement
For the outcome of 'any improvement in TD symptoms', we found no benefit of cyproheptadine against placebo (1 trial, 42 people, RR 0.54, 95% CI 0.27 to 1.08, Analysis 10.1).
10.1.2 Deterioration of symptoms
There was no difference on deterioration of symptoms between cyproheptadine and placebo (1 trial, 42 people, RR 0.33, 95% CI 0.01 to 7.74, Analysis 10.2).
10.2 Adverse effects
There was no difference in the incidence of ‘any adverse effect’ between cyproheptadine and placebo (1 trial, 42 people, RR 0.33, 95% CI 0.04 to 2.95, Analysis 10.3).
10.3 Leaving the study early
Using cyproheptadine did not significantly increase the chances of a person leaving the study early (1 trial, 42 people, RR 0.33, 95% CI 0.01 to 7.74, Analysis 10.4).
11. Comparison 11. Antipsychotic ‐ Promethazine versus placebo
One trial (Yang 1999) carried out in China that included 34 inpatients with antipsychotic‐induced TD was included for this comparison.
11.1 TD symptoms
11.1.1 No clinically important improvement
The overall results for 'clinically relevant improvement' found a benefit in favour of promethazine against placebo (1 trial, 34 people, RR 0.24, 95% CI 0.11 to 0.55, Analysis 11.1).
11.1.2 Not any improvement
For the outcome of 'any improvement in TD symptoms', we again found a benefit in favour of promethazine against placebo (1 trial, 34 people, RR 0.06, 95% CI 0.01 to 0.43; Analysis 11.2).
11.1.3 Average endpoint scores
A benefit in favour of promethazine against placebo was also found for reduction of TD symptoms on the AIMS scale (1 trial, 34 people, MD ‐7.10, 95% CI ‐9.53 to ‐4.67; Analysis 11.3).
11.2 Mental state
11.2.1 Average endpoint scores
General mental state was measured using the continuous BPRS scale (see above). No benefit was found for promethazine when compared to placebo (1 trial, 34 people, MD 0.70, 95% CI ‐3.77 to 5.17; Analysis 11.4).
11.3 Adverse effects
11.3.1 Any adverse effects
No difference was found for any adverse events measured on the TESS scale (see above) between promethazine and placebo (1 trial, 34 people, MD ‐0.10, 95% CI ‐0.53 to 0.33; Analysis 11.5).
11.3.2 Parkinsonism: average endpoint scores
No difference was found for parkinsonism adverse events measured on the RSESE scale (see above) between promethazine and placebo (1 trial, 34 people, MD ‐0.50, 95% CI ‐1.36 to 0.36; Analysis 11.6).
11.4 Global state
11.4.1 Average endpoint scores
Global state was measured using the continuous Clinical Global Impression (CGI) scale (see above). A benefit in global state was found for promethazine when compared to placebo (1 trial, 34 people, MD ‐3.00, 95% CI ‐3.78 to ‐2.22; Analysis 11.7).
12. Comparison 12. Anxiolytic ‐ Buspirone versus placebo
One study (Zeng 1995) carried out in China that included 42 inpatients with schizophrenia and TD was included for this comparison.
12.1 TD symptoms
We had chosen 'any improvement in TD symptoms of more than 50% on any TD scale ‐ any time period' as a primary outcome. Although the data we found in trials did not fit this exactly we feel that the outcome 'clinically relevant improvement' fits best with what we had hoped to find.
12.1.1 No clinically important improvement
The overall results for 'clinically relevant improvement' found a benefit in favour of buspirone against placebo (low‐quality evidence, 1 trial, 42 people, RR 0.53, 95% CI 0.33 to 0.84, Analysis 12.1).
12.1.2 Not any improvement
For the outcome of 'any improvement in TD symptoms', we found a benefit of buspirone against placebo (1 trial, 42 people, RR 0.33, 95% CI 0.15 to 0.75, Analysis 12.2).
12.1.3 Average endpoint scores
TD symptoms were also measured on the continuous AIMS scale (see above). No difference was found when buspirone was compared to placebo (1 trial, 42 people, MD 0.00, 95% CI ‐1.45 to 1.45, Analysis 12.3).
12.2 Leaving the study early
No participants left the included study early.
13. Comparison 13. Cognitive enhancer ‐ Piracetam versus placebo
One trial (Libov 2007) carried out in Israel that included 40 inpatients with antipsychotic‐induced TD was included for this comparison.
13.1 TD symptoms
13.1.1 Average endpoint scores
TD symptoms were measured on the continuous Extrapyramidal System Rating Scale (ESRS) scale (see above). No difference was found between piracetam and placebo (1 trial, 35 people, MD ‐0.70, 95% CI ‐4.30 to 2.90, Analysis 13.1).
13.2 Adverse effects
Symptoms of parkinsonism were also measured on the continuous ESRS scale (see above). No difference was found between piracetam and placebo (1 trial, 35 people, MD 2.50, 95% CI ‐4.73 to 9.73, Analysis 13.2).
13.3 Leaving the study early
Using piracetam did not significantly increase the chances of a person leaving the study early (1 trial, 40 people, RR 0.23, 95% CI 0.03 to 1.85, Analysis 13.3).
13.4 Global state
We found no difference in global state measured by the CGI (see above) between piracetam and placebo (1 trial, 35 people, MD 0.20, 95% CI ‐0.35 to 0.75, Analysis 13.4).
14. Comparison 14. Cognitive enhancer/stimulant ‐ Pemoline versus placebo
One trial (Zeng 1996) carried out in China that included 46 inpatients with antipsychotic‐induced TD was included for this comparison.
14.1 TD symptoms
14.1.1 No clinically important improvement
The overall results for 'clinically relevant improvement' found a benefit in favour of pemoline against placebo (1 trial, 46 people, RR 0.48, 95% CI 0.29 to 0.77, Analysis 14.1).
14.1.2 Not any improvement
For the outcome of 'any improvement in TD symptoms', we again found a benefit in favour of pemoline against placebo (1 trial, 46 people, RR 0.29, 95% CI 0.13 to 0.66, Analysis 14.2).
14.1.3 Average endpoint scores
TD symptoms were also measured on the continuous AIMS scale (see above). A difference in favour of pemoline was found when compared to placebo (1 trial, 46 people, MD ‐3.90, 95% CI ‐5.47 to ‐2.33, Analysis 14.3).
14.2 Leaving the study early
No participants left the included study early.
15. Comparison 15. Enzyme inhibitor ‐ VMAT2 inhibitors versus placebo
15.1 TD symptoms
15.1.1 No clinically important improvement
The overall results for 'clinically relevant improvement' found a benefit in favour of valbenazine (NBI‐98854) against placebo (moderate‐quality evidence, 1 trial, 92 people, RR 0.63, 95% CI 0.46 to 0.86, Analysis 15.1).
15.1.2 Average change scores
TD symptoms were measured on the continuous AIMS scale (see above). A benefit in favour of valbenazine was found against placebo (1 trial, 89 people, MD ‐2.50, 95% CI ‐4.00 to ‐1.00; Analysis 15.2)
15.2 Adverse effects
The incidence of overall adverse events such as fatigue, headache, decreased appetite, nausea and somnolence was higher in the valbenazine group compared to placebo (low‐quality evidence, 1 trial, 100 people, RR 1.50, 95% CI 0.92 to 2.45; Analysis 15.3), but the difference was not significant.
15.3 Leaving the study early
Using VMAT2‐I did not significantly increase the chances of a person leaving the study early (very low‐quality evidence, 1 trial, 102 people, RR 1.00, 95% CI 0.31 to 3.25, Analysis 15.4).
16. Comparison 16. Fatty acid ‐ Ethyl‐eicosapentaenoic acid (ethyl‐EPA) versus placebo
One trial (Emsley 2006) carried out in South Africa that included 84 in‐ and out‐patients with antipsychotic‐induced TD was included for this comparison.
16.1 TD symptoms
16.1.1 Not any improvement
For the outcome of 'any improvement in TD symptoms', there was no benefit of ethyl‐EPA against placebo (1 trial, 75 people, RR 0.82, 95% CI 0.57 to 1.18, Analysis 16.1).
16.2 Mental state
There was no difference on deterioration of mental state between ethyl‐EPA and placebo (1 trial, 75 people, RR 0.49, 95% CI 0.05 to 5.14, Analysis 16.2).
16.3 Adverse effects
16.3.1 Extrapyramidal symptoms: parkinsonism
Symptoms of parkinsonism were measured on the continuous ESRS scale (see above). No difference was found between ethyl‐EPA and placebo (low‐quality evidence, 1 trial, 75 people, MD 0.30, 95% CI ‐1.17 to 1.77, Analysis 16.3).
16.3.2 Extrapyramidal symptoms: dystonia
Symptoms of dystonia were measured on the continuous ESRS scale (see above). A benefit was found in favour of ethyl‐EPA when compared to placebo (low‐quality evidence, 1 trial, 75 people, MD ‐0.35, 95% CI ‐0.58 to ‐0.12, Analysis 16.4).
16.3.3 Extrapyramidal symptoms: akathisia
Symptoms of akathisia were measured on the continuous ESRS scale (see above). No difference was found between ethyl‐EPA and placebo (very low‐quality evidence, 1 trial, 75 people, MD ‐0.04 CI ‐0.30 to 0.22, Analysis 16.5).
16.4 Leaving the study early
Using ethyl‐EPA did not significantly increase the chances of a person leaving the study early (very low‐quality evidence, 1 trial, 84 people, RR 0.57, 95% CI 0.27 to 1.22, Analysis 16.6).
17. Comparison 17. Fatty acid ‐ Gamma‐linolenic acid versus placebo
One trial (Wolkin 1986) carried out in the USA that included 16 in‐ and out‐patients with antipsychotic‐induced TD was included for this comparison.
17.1 TD symptoms
17.1.1 No clinically important improvement
The overall results for 'clinically relevant improvement', added across all time points, found no benefit of gamma‐linolenic acid against placebo (1 trial, 16 people, RR 1.00, 95% CI 0.69 to 1.45, Analysis 17.1).
17.1.2 Not any improvement
For the outcome of 'any improvement in TD symptoms', we again found no benefit of gamma‐linolenic acid against placebo (1 trial, 16 people, RR 0.75, 95% CI 0.24 to 2.33, Analysis 17.2).
17.1.3 Deterioration of symptoms
There was no difference on deterioration of symptoms between gamma‐linolenic acid and placebo (1 trial, 16 people, RR 1.50, 95% CI 0.34 to 6.70, Analysis 17.3).
17.1.4 Average change scores
TD symptoms were also measured on the continuous AIMS scale (see above). No benefit was found for gamma‐linolenic acid when compared to placebo (1 trial, 16 people, MD ‐0.20, 95% CI ‐3.10 to 2.70, Analysis 17.4).
17.2 Mental state
General mental state was measured using the continuous Brief Psychiatric Rating Scale (BPRS) (see above). No benefit was found for gamma‐linolenic acid when compared to placebo (1 trial, 10 people, MD ‐6.00, 95% CI ‐15.99 to 3.99, Analysis 17.5).
17.3 Leaving the study early
No participants left the included study early.
18. Comparison 18. Herb ‐ Ginkgo biloba versus placebo
One trial (Zhang 2011) carried out in China that included 157 inpatients with antipsychotic‐induced TD was included for this comparison.
18.1 TD symptoms
18.1.1 No clinically important improvement
The overall results for 'clinically relevant improvement' found a benefit in favour of G inkgo biloba when compared to placebo (moderate‐quality evidence, 1 trial, 157 people, RR 0.88, 95% CI 0.81 to 0.96, Analysis 18.1).
18.1.2 Not any improvement
For the outcome of 'any improvement in TD symptoms', we again found a benefit of G inkgo biloba when compared to placebo (1 trial, 157 people, RR 0.51, 95% CI 0.41 to 0.65, Analysis 18.2).
18.1.3 Average endpoint scores
TD symptoms were also measured on the continuous AIMS scale (see above). A benefit was found in favour of G inkgo biloba compared to placebo (1 trial, 157 people, MD ‐2.06, 95% CI ‐2.94 to ‐1.18, Analysis 18.3).
18.2 Leaving the study early
Using G inkgo biloba did not significantly increase the chances of a person leaving the study early (very low‐quality evidence, 1 trial, 157 people, RR 0.25, 95% CI 0.03 to 2.22, Analysis 18.4).
18.3 Mental state
18.3.1 Deterioration of mental state
There was no difference in deterioration of mental state between G inkgo biloba and placebo (1 trial, 157 people, RR 0.34, 95% CI 0.01 to 8.16, Analysis 18.5).
18.3.2 Average endpoint scores
Mental state was also measured using the continuous Positive and Negative Syndrome Scale (PANSS) (see above). A benefit was found in favour of G inkgo biloba when compared to placebo (1 trial, 157 people, MD ‐3.30, 95% CI ‐6.51 to ‐0.09, Analysis 18.6).
18.4 Cognitive function
Cognitive function was measured using the continuous CPT‐37 scale (see above). No difference was found between G inkgo biloba and placebo on this outcome (1 trial, 119 people, MD ‐0.02, 95% CI ‐0.10 to 0.06, Analysis 18.7).
19. Comparison 19. Hormone ‐ Oestrogen versus placebo
One trial (Glazer 1985) carried out in the USA that included 12 outpatients with antipsychotic‐induced TD was included for this comparison.
19.1 TD symptoms
19.1.1 No clinically important improvement
The overall results for 'clinically relevant improvement' found no benefit of oestrogen against placebo (1 trial, 12 people, RR 1.18, 95% CI 0.76 to 1.83, Analysis 19.1).
19.1.2 Not any improvement
For the outcome of 'any improvement in TD symptoms', we again found no benefit of oestrogen against placebo (1 trial, 12 people, RR 0.33, 95% CI 0.05 to 2.37, Analysis 19.2).
19.1.3 Deterioration of symptoms
There was no difference on deterioration of symptoms between oestrogen and placebo (1 trial, 10 people, RR 0.20, 95% CI 0.01 to 3.35, Analysis 19.3).
19.1.4 Average endpoint scores
TD symptoms were also measured on the continuous AIMS scale (see above). No difference was found between oestrogen and placebo (1 trial, 10 people, MD ‐1.20, 95% CI ‐4.18 to 1.78, Analysis 19.4).
19.2 Adverse effects
There was no difference in the incidence of ‘any adverse effect’ between oestrogen and placebo (1 trial, 12 people, RR 0.33, 95% CI 0.02 to 6.86, Analysis 19.5).
19.3 Leaving the study early
Using oestrogen did not significantly increase the chances of a person leaving the study early (1 trial, 12 people, RR 1.00, 95% CI 0.08 to 12.56, Analysis 19.6).
20. Comparison 20. Hormone ‐ Insulin versus placebo
One trial (Mouret 1991) carried out in Morocco that included 20 inpatients with antipsychotic‐induced TD was included for this comparison.
20.1 TD symptoms
20.1.1 No clinically important improvement
The overall results for 'clinically relevant improvement' found a benefit in favour of insulin against placebo (1 trial, 20 people, RR 0.52, 95% CI 0.29 to 0.96, Analysis 20.1).
20.1.2 Not any improvement
For the outcome of 'any improvement in TD symptoms', we again found a benefit in favour of insulin against placebo (1 trial, 20 people, RR 0.06, 95% CI 0.00 to 0.90, Analysis 20.2).
20.1.3 Deterioration of symptoms
There was no difference on deterioration of symptoms between insulin and placebo (1 trial, 20 people, RR 0.14, 95% CI 0.01 to 2.45, Analysis 20.3).
20.1.4 Average endpoint scores
TD symptoms were also measured on the continuous AIMS scale (see above). A benefit in favour of insulin was found when compared to placebo (1 trial, 20 people, MD ‐6.20, 95% CI ‐10.53 to ‐1.87, Analysis 20.4).
20.2 Leaving the study early
No participants left the included study early.
21. Comparison 21. Hormone ‐ Melatonin versus placebo or no treatment
Four trials (Castro 2011; Shamir 2000; Shamir 2001; Shi 2009) carried out in China, Israel, and Venezuela that included 132 in‐ and out‐patients with antipsychotic‐induced TD was included for this comparison.
21.1 TD symptoms
21.1.1 No clinically important improvement
The overall results for 'clinically relevant improvement', added across all time points, found no benefit of melatonin against placebo (low‐quality evidence, 2 trials, 32 people, RR 0.89, 95% CI 0.71 to 1.12, Analysis 21.1).
21.1.2 Not any improvement
For the outcome of 'any improvement in TD symptoms', we again found no benefit of melatonin against placebo (1 trial, 19 people, RR 1.11, 95% CI 0.47 to 2.60, Analysis 21.2).
21.1.3 Deterioration of symptoms
There was no difference on deterioration of symptoms between melatonin and placebo (low‐quality evidence, 1 trial, 19 people, RR 0.22, 95% CI 0.01 to 4.05, Analysis 21.3).
21.1.4 Average endpoint scores
TD symptoms were also measured on the continuous AIMS scale (see above). No benefit was found for melatonin when compared to placebo (1 trial, 13 people, MD ‐2.38, 95% CI ‐6.58 to 1.82, Analysis 21.4).
21.2 Adverse effects
No participants reported adverse effects.
21.3 Leaving the study early
No participants left the included studies early.
21.4 Cognitive function
Cognitive function was measured using the continuous Wechsler Adult Intelligence Scale (WAIS) and Wechsler Memory Scale (WMS) scales (see above). There was a benefit in favour of melatonin when compared to placebo on the WAIS (1 trial, 76 people, MD 15.83, 95% CI 4.61 to 27.05, Analysis 13.7), however this benefit was not seen on the WMS (1 trial, 76 people, MD 3.77, 95% CI ‐8.21 to 15.75, Analysis 21.7).
21.5 Mental state
No participants reported deterioration of mental state.
22. Comparison 22. Mood stabiliser ‐ Lithium versus placebo
One trial (Mackay 1980) carried out in the UK that included 11 inpatients with antipsychotic‐induced TD was included for this comparison.
22.1 TD symptoms
22.1.1 No clinically important improvement
The overall results for 'clinically relevant improvement' found no benefit of lithium against placebo (1 trial, 11 people, RR 1.59,, 95% CI 0.79 to 3.23, Analysis 22.1).
22.1.2 Not any improvement
For the outcome of 'any improvement in TD symptoms', we found no benefit of lithium against placebo (1 trial, 11 people, RR 4.29, 95% CI 0.25 to 72.90, Analysis 22.2).
22.1.3 Deterioration of symptoms
There was no difference on deterioration of symptoms between lithium and placebo (1 trial, 11 people, RR 4.29, 95% CI 0.25 to 72.90, Analysis 22.3).
22.1.4 Average endpoint scores
TD symptoms were also measured on the continuous AIMS scale (see above). No difference was found when lithium was compared to placebo (1 trial, 11 people, MD 0.63, 95% CI ‐5.23 to 6.49, Analysis 22.4).
22.2 Adverse effects
There was no difference in the incidence of ‘any adverse effect’ between lithium and placebo (1 trial, 11 people, RR 6.00, 95% CI 0.38 to 94.35, Analysis 22.5).
22.3 Leaving the study early
Using lithium did not significantly increase the chances of a person leaving the study early (1 trial, 11 people, RR 2.57, 95% CI 0.13 to 52.12, Analysis 22.6).
23. Comparison 23. Polypeptide ‐ Ceruletide versus placebo
Two trials (Kojima 1992; Matsunaga 1988) carried out in Japan that included 85 in‐ and out‐patients with schizophrenia and TD, or chronic psychosis and TD were included for this comparison.
23.1 TD symptoms
23.1.1 Not any improvement
For the outcome of 'any improvement in TD symptoms', we found no benefit of ceruletide against placebo (2 trials, 132 people, RR 0.83, 95% CI 0.65 to 1.07, Analysis 23.1).
23.1.2 Deterioration of symptoms
There was no difference on deterioration of symptoms between ceruletide and placebo (low‐quality evidence, 2 trials, 103 people, RR 0.97 CI 0.14 to 6.80, Analysis 23.2).
23.2 Adverse effects
There was no difference in the incidence of ‘any adverse effect’, across all time periods, between ceruletide and placebo (low‐quality evidence, 2 trials, 122 people, RR 1.32, 95% CI 0.74 to 2.36, Analysis 23.3).
23.3 Leaving the study early
Using ceruletide did not significantly increase the chances of a person leaving the study early (very low‐quality evidence, 1 trial, 85 people, RR 1.09, 95% CI 0.49 to 2.40, Analysis 23.4).
24. Comparison 24. Hypnosis or relaxation versus treatment as usual (TAU)
One trial (Glover 1980) carried out in the USA that included 15 outpatients with antipsychotic‐induced TD was included for this comparison.
24.1 TD symptoms
24.1.1 No clinically important improvement
The overall results for 'clinically relevant improvement' found a benefit in favour of hypnosis or relaxation when compared to TAU (very low‐quality evidence, 1 trial, 15 people, RR 0.45, 95% CI 0.21 to 0.94, Analysis 24.1). There was no difference, however, when hypnosis was compared to relaxation (1 trial, 10 people, RR 0.11, 95% CI 0.01 to 1.64, analysis not shown).
24.1.2 Not any improvement
For the outcome of 'any improvement in TD symptoms', we found no benefit of hypnosis or relaxation when compared to TAU (1 trial, 15 people, RR 0.18, 95% CI 0.01 to 3.81, Analysis 24.2).
24.1.3 Deterioration of symptoms
There was no difference on deterioration of symptoms between hypnosis or relaxation and TAU (very low‐quality evidence, 1 trial, 15 people, RR 0.18, 95% CI 0.01 to 3.81, Analysis 24.3).
24.2 Leaving the study early
No participants left the included study early.
25. Subgroup analyses
25.1 Clinical stage: Recent onset TD
It was not possible to evaluate whether those with recent onset TD responded differently to those with more established problems, since no trial reported data for groups with different durations of TD that could be extracted for separate analyses.
25.2 Duration of follow‐up
Any effects that the miscellaneous interventions described in this review may have did not clearly change in relation to duration of follow‐up.
26. Heterogeneity
For most comparisons only one study was included, consequently, for these comparisons subgroup‐ and sensitivity analyses could not be undertaken and there was no heterogeneity. For the four comparisons that included more than one study (ceruletide, levetiracetam, melatonin, and dehydrogenated ergot alkaloids), pooled data for leaving the study early for levetiracetam versus placebo were statistically heterogeneous (Analysis 9.3, I2=73%), but neither study (UCB Pharma 2005; Woods 2008, total N=119) found statistically significant results.
27. Sensitivity analyses
27.1 Implication of randomisation
We aimed to include trials in a sensitivity analysis if they were described in some way as to imply randomisation. As all studies were stated to be randomised, we did not undertake this sensitivity analysis.
27.2 Assumptions for lost binary data
We were unable to perform this sensitivity analysis because there were so few studies within each comparison in this review.
27.3 Risk of bias
We were unable to perform this sensitivity analysis because there were so few studies within each comparison in this review.
27.4 Imputed values
We would have undertaken a sensitivity analysis to assess the effects of including data from cluster‐randomised trials where we used imputed values for intra‐class correlation coefficients (ICCs) in calculating the design effect. No cluster‐randomised trials were included.
27.5 Fixed and random effects
We were unable to perform this sensitivity analysis because there were so few studies within each comparison in this review.
Discussion
Summary of main results
1. Searching
This review has identified mainly old studies published before the year 2000 (65%); only six studies were published in the past 10 years. These more recent studies assessed melatonin (Castro 2011; Shi 2009), piracetam (Libov 2007), valbenazine (NBI‐98854) (O'Brien 2014), levetiracetam (Woods 2008), and Ginkgo biloba (Zhang 2011).
2. Few data
Overall, data from 1278 people were included in this review, but few participants were included for each intervention. The number of participants per comparison ranged from 10 (experimental compound ritanserin) to 157 (Chinese herb Ginkgo biloba). It is possible that real, and important, effects have not been highlighted because of the necessarily wide confidence intervals of the findings. Many outcomes were not measured at all (see Overall completeness and applicability of evidence), including one of our pre‐stated outcome measures. We may have been overambitious in hoping for some of these outcomes in tardive dyskinesia (TD) trials but simple reporting of satisfaction with care or quality of life still does not seem too demanding and does remain of interest.
3. Alkaloid ‐ dihydrogenated ergot alkaloids (DEAs) versus placebo
3.1 TD symptoms
We found low‐quality evidence (downgraded due to risk of bias and small sample size) favouring DEAs compared with placebo for no clinically important improvement in TD symptoms after six weeks (RR 0.45, 95% CI 0.21 to 0.97, 1 study, 28 participants). Because the quality of evidence is low, we have limited confidence in the effect estimates and CIs; the true effects may be substantially different. We also found very low‐quality evidence (downgraded due to risk of bias and small sample size) of little or no difference in deterioration of TD symptoms at six‐week follow‐up (RR 0.33, 95% CI 0.01 to 7.55, 1 study, 28 participants). Because the quality of evidence is very low, we are very uncertain about the estimate.
3.2 Adverse events
More participants in the DEAs group experienced adverse events compared with placebo (50% and 21%, respectively), however, the difference was not significant (very low‐quality evidence, RR 2.33, 95% CI 0.75 to 7.23, 1 study, 28 participants). Because the quality of evidence is very low, we are very uncertain about the estimate.
3.3 Acceptability of treatment (measured through participants leaving the study early)
We found very low‐quality evidence (downgraded due to risk of bias, indirectness of measurement, and small sample size) of little to no difference in acceptability of treatment (RR 0.33, 95% CI 0.02 to 7.32, 2 studies, 48 participants). Because the quality of evidence is very low, we are very uncertain about the estimate.
The included study did not report on 'social confidence, social inclusion, social networks, or personalised quality of life' ‐ outcomes assessed by patients and review authors as particularly important (see Types of outcome measures). Please see summary of findings Table for the main comparison for GRADE ratings.
4. Anxiolytic ‐ buspirone versus placebo
4.1 TD symptoms
We found low‐quality evidence (downgraded due to risk of bias and small sample size) favouring buspirone compared with placebo for no clinically important improvement in TD symptoms after 6 weeks (RR 0.53, 95% CI 0.33 to 0.84, 1 study, 42 participants). Because the quality of evidence is low, we have limited confidence in the effect estimates and CIs; the true effects may be substantially different.
4.2 Acceptability of treatment (measured through participants leaving the study early)
It is always unclear what leaving the study early means. It could be to do with the participant not accepting treatment for a series of reasons, or of participants finding the trial intolerable. It also could be a function of a trial design in which willing participants are still asked to leave because of some degree of protocol violation. In any event, all randomised participants completed the trial and there were no dropouts among 42 participants in one trial with a duration of six weeks.
The included study did not report on 'adverse events' or 'social confidence, social inclusion, social networks, or personalised quality of life' ‐ outcomes assessed by patients and review authors as particularly important (see Types of outcome measures). Please see summary of findings Table 3 for GRADE ratings.
5. Antiepileptic ‐ levetiracetam versus placebo
5.1 TD symptoms
No studies reported on the TD symptoms outcomes chosen for our 'Summary of findings' tables ('no clinically important improvement in TD symptoms' and 'deterioration of TD symptoms').
5.2 Adverse events
We found low‐quality evidence (downgraded due to risk of bias and small sample size) that more participants experienced adverse events with placebo (46%) compared with levetiracetam (23.5%) at eight‐week follow‐up, however, the difference was not significant (RR 0.51, 95% CI 0.25 to 1.04, 69 participants, 1 study). Because the quality of evidence is low, we have limited confidence in the effect estimates and CIs; the true effects may be substantially different.
5.3 Acceptability of treatment (measured through participants leaving the study early)
We found very low‐quality evidence (downgraded due to risk of bias, inconsistency (I2= 73%), and small sample size) that 17% of participants left the study early, and there was little to no difference between levetiracetam and placebo (RR 1.01, 95% CI 0.46 to 2.22, 119 participants, 2 studies). Because the quality of evidence is very low, we are very uncertain about the estimate.
The included studies did not report on 'social confidence, social inclusion, social networks, or personalised quality of life' ‐ outcomes assessed by patients and review authors as particularly important (see Types of outcome measures). Please see summary of findings Table 2 for GRADE ratings.
6. Enzyme inhibitor ‐ VMAT2‐inhibitors versus placebo
6.1 TD symptoms
We found moderate‐quality evidence (downgraded due to small sample size) favouring valbenazine (NBI‐98854) compared with placebo for no clinically important improvement in TD symptoms after six weeks (RR 0.63, 95% CI 0.46 to 0.86, 1 study, 92 participants). Because the quality of evidence is moderate, further research is likely to have an important impact on our confidence in the estimate of effect and may change the estimate.
6.2 Adverse events
More participants in the valbenazine group experienced adverse events compared with placebo (49% and 33%, respectively), however, the difference was not significant (low‐quality evidence, (RR 1.50, 95% CI 0.92 to 2.45, 1 study, 100 participants). Because the quality of evidence is low (downgraded due to small sample size and very few events reported), we have limited confidence in the effect estimates and CIs; the true effects may be substantially different.
6.3 Acceptability of treatment (measured through participants leaving the study early)
We found very low‐quality evidence (downgraded due to small sample size and very few events reported, and indirectness of measurement) that 10% of participants left the study early, and there was little to no difference between the valbenazine group and the placebo group (RR 1.00, 95% CI 0.31 to 3.25, 102 participants, 1 study). Because the quality of evidence is very low, we are very uncertain about the estimate.
The included study did not report on 'social confidence, social inclusion, social networks, or personalised quality of life' ‐ outcomes assessed by patients and review authors as particularly important (see Types of outcome measures). Please see summary of findings Table 4 for GRADE ratings.
7. Fatty acid ‐ ethyl‐EPA versus placebo
7.1 TD symptoms
No studies reported on the TD symptoms outcomes chosen for our 'Summary of findings' tables ('no clinically important improvement in TD symptoms' and 'deterioration of TD symptoms').
7.2 Adverse events
We found low‐quality evidence (downgraded due to risk of bias and small sample size) of little to no difference between ethyl‐EPA and placebo in parkinsonism extrapyramidal symptoms (EPSs) measured on the Extrapyramidal System Rating Scale (ESRS) (MD 0.30, 95% CI ‐1.17 to 1.77, 1 trial, 75 participants), and of a benefit to ethyl‐EPA compared with placebo in dystonia EPSs measured on the ESRS (MD ‐0.35, 95% CI ‐0.58 to ‐0.12) 1 trial, 75 participants). Because the quality of evidence is low, further research is likely to have an important impact on our confidence in the estimates of effect and may change the estimates. Further, we found very low‐quality evidence (downgraded due to risk of bias and small sample size with very wide CIs) of little to no difference between ethyl‐EPA and placebo in akathisia EPSs measured on the ESRS (MD ‐0.04, 95% CI ‐0.30 to 0.22, 1 trial, 75 participants). Because the quality of evidence is very low, we are very uncertain about the estimate.
7.3 Acceptability of treatment (measured through participants leaving the study early)
More participants in the placebo group left the study early than in the ethyl‐EPA group (33% and 19%, respectively), however, the difference was not significant (very low‐quality evidence, (RR 0.57, 95% CI 0.27 to 1.22, 1 study, 84 participants). Because the quality of evidence is very low, we are very uncertain about the estimate.
The included study did not report on 'social confidence, social inclusion, social networks, or personalised quality of life' ‐ outcomes assessed by patients and review authors as particularly important (see Types of outcome measures). Please see summary of findings Table 5 for GRADE ratings.
8. Herb ‐ Ginkgo biloba versus placebo
8.1 TD symptoms
We found moderate‐quality evidence (downgraded due to small sample size) favouring G inkgo biloba compared with placebo for no clinically important improvement in TD symptoms after 12 weeks (RR 0.88, 95% CI 0.81 to 0.96, 1 trial, 157 participants). Because the quality of evidence is moderate, further research is likely to have an important impact on our confidence in the estimate of effect and may change the estimate.
8.3 Acceptability of treatment (measured through participants leaving the study early)
More participants left the study early in the placebo group compared to the G inkgo biloba group (5% and 1.3%, respectively), however the difference was not significant (very low‐quality evidence, RR 0.25, 95% CI 0.03 to 2.22, 1 trial, 157 participants). Because the quality of evidence is very low (downgraded due to small sample size with very few events reported and indirectness of measurement), we are very uncertain about the estimate.
The included study did not report on 'adverse events' or 'social confidence, social inclusion, social networks, or personalised quality of life' ‐ outcomes assessed by patients and review authors as particularly important (see Types of outcome measures). Please see summary of findings Table 6 for GRADE ratings.
9. Hormone ‐ melatonin versus placebo
9.1 TD symptoms
We found low‐quality evidence (downgraded due to inconsistency (I2 = 46%) and small sample size) of little or no difference for no clinically important improvement in TD symptoms for melatonin compared with placebo after three to 12 weeks (RR 0.89, 95% CI 0.71 to 1.12, 2 studies, 32 participants). Again, we found low‐quality evidence (downgraded due to very small sample size) of little or no difference in deterioration of TD symptoms at three‐week follow‐up (RR 0.22, 95% CI 0.01 to 4.05, 1 study, 19 participants). Because the quality of evidence is low for these outcomes, we have limited confidence in the effect estimates and CIs; the true effects may be substantially different.
9.2 Adverse events
No events were reported for this outcome among 54 participants in three studies with a duration of three to 12 weeks.
9.3 Acceptability of treatment (measured through participants leaving the study early)
All randomised participants completed the trial and there were no dropouts among 54 participants in three studies with a duration of three to 12 weeks.
The included studies did not report on 'social confidence, social inclusion, social networks, or personalised quality of life' ‐ outcomes assessed by patients and review authors as particularly important (see Types of outcome measures). Please see summary of findings Table 7 for GRADE ratings.
10. Polypeptide ‐ ceruletide versus placebo
10.1 TD symptoms
We found low‐quality evidence (downgraded due to risk of bias and small sample size) of little or no difference in deterioration of TD symptoms at four to eight weeks follow‐up (RR 0.97, 95% CI 0.14 to 6.80, 2 studies, 103 participants). Because the quality of evidence is low, we have limited confidence in the effect estimates and CIs; the true effects may be substantially different.
10.2 Adverse events
We found low‐quality evidence (downgraded due to risk of bias and small sample size) that more participants experienced adverse events with ceruletide (31%) compared with placebo (23%) at four to eight weeks follow‐up, however, the difference was not significant (RR 1.32, 95% CI 0.74 to 2.36, 122 participants, 2 studies). Because the quality of evidence is low, we have limited confidence in the effect estimates and CIs; the true effects may be substantially different.
10.3 Acceptability of treatment (measured through participants leaving the study early)
We found very low‐quality evidence (downgraded due to risk of bias, indirectness of measurement, and small sample size) that around 20% of participants left the study early, and there was little to no difference between ceruletide and placebo (RR 1.09, 95% CI 0.49 to 2.40, 85 participants, 1 study). Because the quality of evidence is very low, we are very uncertain about the estimate.
The included studies did not report on 'social confidence, social inclusion, social networks, or personalised quality of life' ‐ outcomes assessed by patients and review authors as particularly important (see Types of outcome measures). Please see summary of findings Table 8 for GRADE ratings.
11. HYPNOSIS OR RELAXATION versus TAU
11.1 TD symptoms
We found very low‐quality evidence favouring hypnosis or relaxation compared with placebo for 'no clinically important improvement in TD symptoms' after 8 sessions (RR 0.45, 95% CI 0.21 to 0.94, 1 study, 15 participants). We also found very low quality evidence of little or no difference in deterioration of TD symptoms between hypnosis or relaxation and placebo after 8 sessions (RR 0.18, 95% CI 0.01 to 3.81, 1 study, 15 participants). Because the quality of evidence is very low (downgraded due to serious risk of bias and very small sample size), we are very uncertain about these estimates.
11.3 Acceptability of treatment (measured through participants leaving the study early)
All randomised participants completed the study and there were no dropouts among 15 participants in one study of eight sessions (exact duration was not reported).
The included study did not report on 'adverse events' and 'social confidence, social inclusion, social networks, or personalised quality of life' ‐ outcomes assessed by patients and review authors as particularly important (see Types of outcome measures). Please see summary of findings Table 9 for GRADE ratings.
12. OTHER COMPARISONS
The remaining 15 comparisons (cyproheptadine, lithium, papaverine, pemoline, piracetam, promethazine, ritanserin, selegiline, isocarboxazid, oestrogen, insulin, gamma‐linolenic acid, branched‐chain amino acids, phenylalanine, and stepholidine) included less than 60 participants each (10 to 57 participants per intervention with a median of 22 participants) and were not prioritised in the selection process for the NIHR HTA systematic review (Bergman 2017). Consequently, we did not create 'Summary of findings' tables for these interventions (see Prioritising interventions for 'Summary of findings' tables, Types of outcome measures). We summarise the results from these trials narratively below. We would like to point out that due to the small sample sizes per comparison, potential treatment effects could have gone undetected.
12.1 TD symptoms
A benefit for the intervention compared with placebo was found for pemoline, promethazine, insulin, and branched‐chain amino acids, and for isocarboxazid compared with procyclidine (one trial per comparison, average number of participants: 38, follow‐up duration: three to 40 weeks (median: 12 weeks)). However, due to the small sample sizes and risk of biases for most of these trials, we are very uncertain about these results. For lithium, ritanserin, selegiline, oestrogen, and gamma‐linolenic acid compared to placebo, results showed no significant difference between groups on 'no clinically important improvement in TD symptoms' (one trial per comparison, average number of participants: 16, follow‐up duration: three to six weeks). Due to the small sample sizes, short study duration, and risk of biases for most of these trials, we are very uncertain about these results. Studies assessing cyproheptadine, papaverine, piracetam, and phenylalanine did not report on 'no clinically important improvement in TD symptoms'.
For cyproheptadine, lithium, ritanserin, oestrogen, and gamma‐linolenic acid compared to placebo, results showed no significant difference between groups on 'deterioration of TD symptoms' (one trial per comparison, average number of participants: 18, follow‐up duration: three to six weeks). Due to the small sample sizes, short study duration, and risk of biases for most of these trials, we are very uncertain about these results. Studies assessing papaverine, pemoline, piracetam, promethazine, selegiline, isocarboxazid, insulin, branched‐chain amino acids, phenylalanine, and stepholidine did not report on 'deterioration of TD symptoms'.
12.2 Adverse events
Only seven of the 15 other comparisons reported on adverse events. Studies evaluating cyproheptadine, lithium, piracetam, promethazine, and oestrogen found no significant difference between intervention and placebo (one trial per comparison, average number of participants: 28, follow‐up duration: three to 12 weeks (median: four weeks)), the study evaluating isocarboxazid versus procyclidine also found no significant difference between groups (one trial, 20 participants, follow‐up duration: 40 weeks), and the study assessing stepholidine versus placebo reported that no adverse events occurred (57 participants, follow‐up duration: eight weeks). Due to the small sample sizes, short study duration, and risk of biases for most of these trials, we are very uncertain about these results. Studies assessing papaverine, pemoline, ritanserin, selegiline, insulin, gamma‐linolenic acid, branched‐chain amino acids, and phenylalanine did not report on adverse events.
12.3 Acceptability of treatment (measured through participants leaving the study early)
Studies assessing cyproheptadine, lithium, pemoline, piracetam, promethazine, selegiline, isocarboxazid, oestrogen, insulin, gamma‐linolenic acid, branched‐chain amino acids, phenylalanine, and stepholidine reported no significant differences in participants leaving the studies early compared to placebo groups (one trial per comparison, average number of participants: 31, follow‐up duration: one day to 40 weeks (median: six weeks)). Again, due to the small sample sizes, short study duration, and risk of biases for most of these trials, we are very uncertain about these results. Studies assessing papaverine and ritanserin did not clearly report on number of randomised participants and were consequently not analysed for this outcome.
12.4 Social confidence, social inclusion, social networks, or personalised quality of life
Again, none of the other included studies assessed this group of outcomes that were prioritised by patients as particularly important (see Types of outcome measures).
Overall completeness and applicability of evidence
1. Completeness
No outcomes in this review involved large numbers of people. Many of the included studies were no more than pilot studies, and due to their small size, they cannot really be expected to fully answer any questions about the effects of this miscellaneous group of interventions for people with TD.
Some outcomes are general measures and more subtle findings are not recorded. For example, we identified few data on the outcome of ‘any adverse effect’ but none on the binary outcomes ‘use of any anti‐parkinsonism drugs’ or ‘no clinically significant extrapyramidal adverse effects ‐ any time period’‐ the latter being one of our pre‐stated primary outcomes. There were no data on the patient‐designated important outcomes of social confidence, social inclusion, social networks, or personalised quality of life for either recipients of care or caregivers, nor were there data on hospital and service utilisation outcomes, or economic outcomes.
Deutetrabenazine and valbenazine, both recently approved by the FDA for TD (Brooks 2017; FDA 2017), are VMAT‐2 inhibitors that were assessed in included study O'Brien 2014 (valbenazine), in awaiting classification studies Fernandez 2016, Hauser 2016 and NCT01393600 2011, and in ongoing studies NCT01688037 2012 and NCT02291861 2014. We look forward to including results from these new and ongoing trials in a future update of this review.
2. Applicability
Trials were a mixture of hospital‐based and outpatient, and were on people who would be recognisable in everyday care, however, mostly on men in their 50s with schizophrenia in hospital and mostly in high‐income countries. Overall, sample sizes in relevant studies were particularly small. In light of the lack of power available to examine the compounds of interest, the results should be interpreted as inconclusive rather than negative at this stage. The majority of studies had a duration of six weeks or less whilst only seven had a duration of at least 12 weeks. Whether the effects of the interventions were maintained at longer periods of follow‐up may therefore be under‐reported in short‐term studies.
Quality of the evidence
Overall, the quality of the evidence is low to very low. This means that we have limited to very little confidence in the effect estimates, and the true effect may be, or is likely to be, substantially different from the estimate of the effect. The main reasons for our low confidence in the evidence include the following.
-
Poor study methodology and reporting of methods resulting in downgrading evidence for risk of bias. Allocation concealment was not described, generation of the sequence was not explicit, studies were not clearly blinded, we are unsure if data are incomplete or selectively reported or if other biases were operating.
-
Very small sample sizes resulting in downgrading evidence for imprecision. The median sample size in this review was only 34 people. A trial of this size is unable to detect subtle, yet important differences due to an intervention with any confidence. In order to detect a 20% difference between groups, probably about 150 people are needed in each arm of the study (alpha 0.05, beta 0.8).
-
Wide CIs (often due to low event rates) that included appreciable benefit or harm for the intervention as well as no effect, resulting in downgrading evidence for imprecision.
Please see Additional tables, 'Summary of findings' tables 1‐9 for full details.
The small trial sizes, along with the poor reporting of trials, would be associated with an exaggeration of effect of the experimental treatment (Jűni 2001) when an effect was detected.
Potential biases in the review process
1. Missing studies
Every effort was made to identify relevant trials. However, these studies are all small and it is likely that we have failed to identify other studies of limited power. It is likely that such studies would also not be in favour of the intervention group. If they had been so, it is more likely that they would have been published in accessible literature. We do not, however, think it likely that we have failed to identify large relevant studies.
2. Missing data
We excluded 12 studies published between 1973 and 2004 that did not provide any usable data, see Excluded studies. We contacted authors and two replied to confirm no usable data are available. Authors of eight studies did not reply, and we could not find up‐to‐date contact details for authors of two studies (both over 30 years old). We find it very unlikely we would receive a reply from authors regarding research conducted so many years ago; therefore, these studies were also excluded.
3. Introducing bias
This review has now been updated several times. We have tried to be balanced in our appraisal of the evidence but could have inadvertently introduced bias. We welcome comments or criticisms. New methods and innovations now make it possible to report data where, in the past, we could not report data at all or had to report data in a different way. We believe the 'Summary of findings' tables are a valuable innovation – but problematic to those not ‘blind’ to the outcome data. It is possible to ‘cherry pick’ significant findings for presentation in this table. We have tried to decrease the chance of doing this by asking a new review author (HB) to select outcomes relevant for these tables before becoming familiar with the data.
Agreements and disagreements with other studies or reviews
This review substantially updates earlier versions. The previous version of this review contained assessments of eight interventions (ceruletide, gammalinolenic acid, insulin, lithium, oestrogen, phenylalanine, piracetam, and ethyl‐EPA) and the conclusions on those interventions has not changed with this update. In addition, we have updated this review with evidence from another 16 interventions. Bergman 2017 reports on interventions in all nine Cochrane reviews on TD in this series (see Table 1) and is in agreement with the findings and conclusions of this review.
Other systematic reviews have covered melatonin (Nelson 2003), extract of Ginkgo biloba (Zheng 2016), and any treatment for TD (Alimi 2013). We are in agreement with both Nelson 2003, that "There are inadequate data at the present time to support the use of melatonin in patients with TD", and with Zheng 2016, that Ginkgo biloba appears to be safe and effective for improving TD symptoms and that better randomised controlled trials are needed to confirm this evidence.
Alimi 2013 found that three of the interventions included in this review may help to improve TD symptoms: BCAAs, Ginkgo biloba, and piracetam. Our review included the same studies for these three interventions and also found that BCAAs and Ginkgo biloba appear to reduce TD symptoms. However, for BCAAs, we also conclude that due to the small sample size (n = 68), short follow‐up (three weeks), and risk of bias, we are very uncertain about this result, and for Ginkgo biloba, we also conclude that further research is likely to have an important impact on our confidence in the estimate of effect and may change the estimate because evidence was of moderate quality (due to small sample size, n = 157). Libov 2007, the study that evaluated piracetam, is a cross‐over study and we extracted data only from the first phase because of risk of carry‐over effect despite a wash‐out period and because TD is an unstable condition (see Implications for research, 2.1 Use of cross‐over design). This may be why our results differed from Alimi 2013 on piracetam; we found no benefit.

Message from one of the participants of the Public and patient involvement consultation of service user perspectives on tardive dyskinesia research.
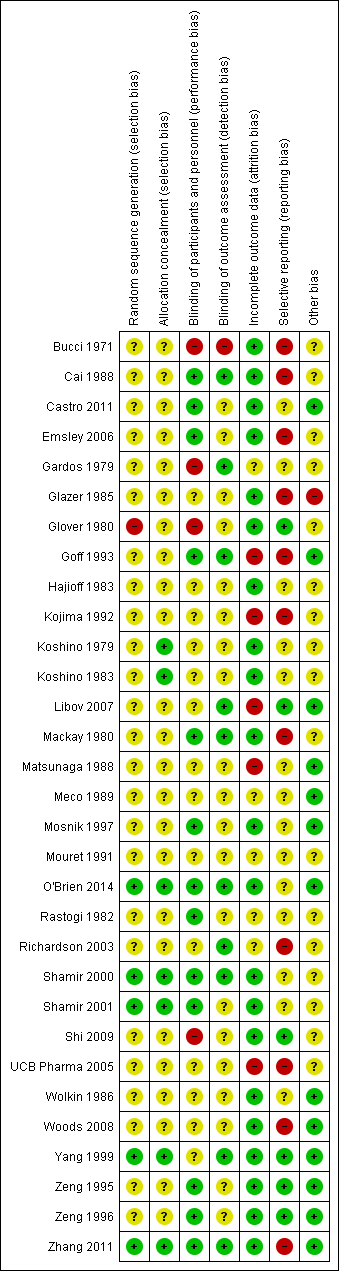
Methodological quality summary: review authors' judgements about each methodological quality item for each included study.

'Risk of bias' graph: review authors' judgements about each risk of bias item presented as percentages across all included studies.

Study flow diagram for 2015 and 2017 searches.

Comparison 1 ALKALOID ‐ DIHYDROGENATED ERGOT ALKALOIDS versus PLACEBO, Outcome 1 Tardive dyskinesia: 1. No clinically important improvement ‐ medium term.
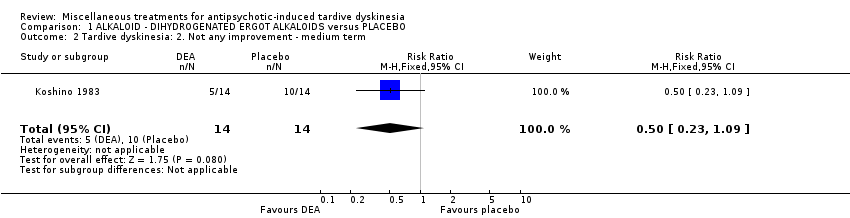
Comparison 1 ALKALOID ‐ DIHYDROGENATED ERGOT ALKALOIDS versus PLACEBO, Outcome 2 Tardive dyskinesia: 2. Not any improvement ‐ medium term.
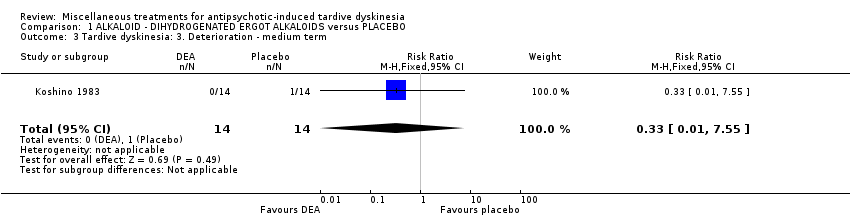
Comparison 1 ALKALOID ‐ DIHYDROGENATED ERGOT ALKALOIDS versus PLACEBO, Outcome 3 Tardive dyskinesia: 3. Deterioration ‐ medium term.

Comparison 1 ALKALOID ‐ DIHYDROGENATED ERGOT ALKALOIDS versus PLACEBO, Outcome 4 Tardive dyskinesia: 3. Average endpoint scale score (Simpson scale, high=poor) ‐ medium term.
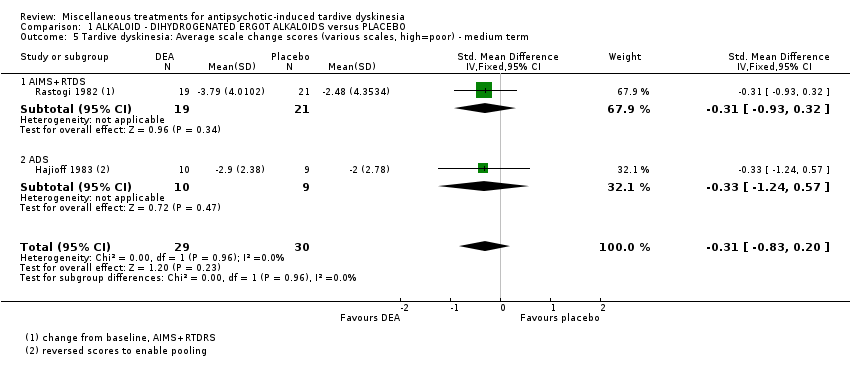
Comparison 1 ALKALOID ‐ DIHYDROGENATED ERGOT ALKALOIDS versus PLACEBO, Outcome 5 Tardive dyskinesia: Average scale change scores (various scales, high=poor) ‐ medium term.

Comparison 1 ALKALOID ‐ DIHYDROGENATED ERGOT ALKALOIDS versus PLACEBO, Outcome 6 Mental state: Deterioration ‐ medium term.
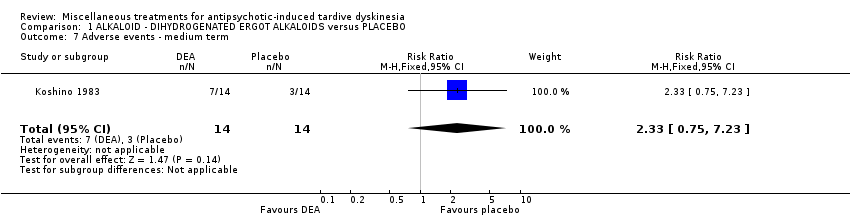
Comparison 1 ALKALOID ‐ DIHYDROGENATED ERGOT ALKALOIDS versus PLACEBO, Outcome 7 Adverse events ‐ medium term.
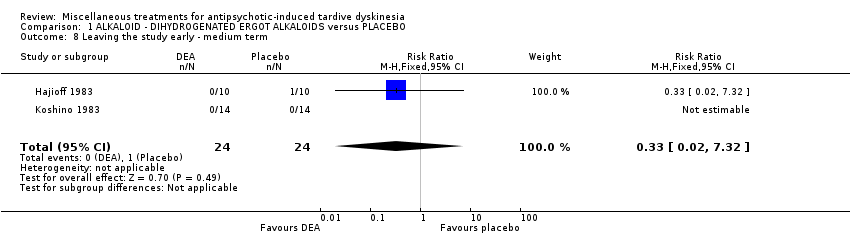
Comparison 1 ALKALOID ‐ DIHYDROGENATED ERGOT ALKALOIDS versus PLACEBO, Outcome 8 Leaving the study early ‐ medium term.

Comparison 2 ALKALOID ‐ L‐STEPHOLIDINE (SPD) versus PLACEBO, Outcome 1 Tardive dyskinesia: 1. No clinically important improvement ‐ medium term.

Comparison 2 ALKALOID ‐ L‐STEPHOLIDINE (SPD) versus PLACEBO, Outcome 2 Mental state: 1. Average endpoint scale score (BPRS, high=poor) ‐ medium term.

Comparison 2 ALKALOID ‐ L‐STEPHOLIDINE (SPD) versus PLACEBO, Outcome 3 Adverse events: any adverse events ‐ medium term.
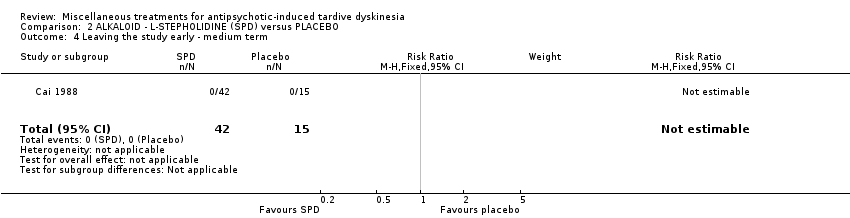
Comparison 2 ALKALOID ‐ L‐STEPHOLIDINE (SPD) versus PLACEBO, Outcome 4 Leaving the study early ‐ medium term.

Comparison 3 ALKALOID ‐ PAPAVERINE versus PLACEBO, Outcome 1 Tardive dyskinesia: 3. Average scale score (AIMS, high=poor) ‐ medium term.

Comparison 4 AMINO ACID ‐ BRANCHED‐CHAIN AMINO ACID (BCAA) versus PLACEBO, Outcome 1 Tardive dyskinesia: 1. No clinically important improvement ‐ short term.
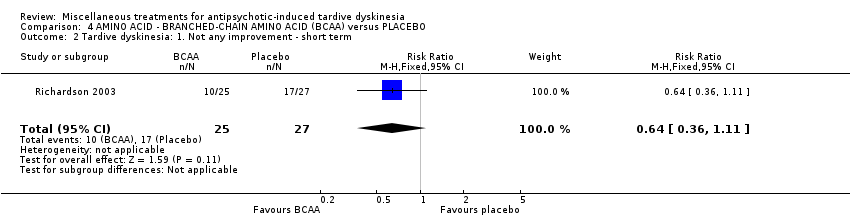
Comparison 4 AMINO ACID ‐ BRANCHED‐CHAIN AMINO ACID (BCAA) versus PLACEBO, Outcome 2 Tardive dyskinesia: 1. Not any improvement ‐ short term.

Comparison 4 AMINO ACID ‐ BRANCHED‐CHAIN AMINO ACID (BCAA) versus PLACEBO, Outcome 3 Tardive dyskinesia: 2. Deterioration ‐ short term.

Comparison 4 AMINO ACID ‐ BRANCHED‐CHAIN AMINO ACID (BCAA) versus PLACEBO, Outcome 4 Tardive dyskinesia: Average endpoint score (Simpson scale, high=poor) ‐ short term.
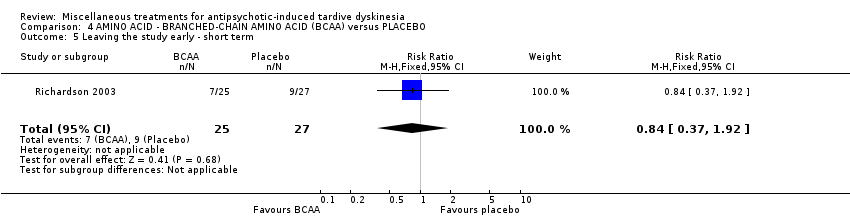
Comparison 4 AMINO ACID ‐ BRANCHED‐CHAIN AMINO ACID (BCAA) versus PLACEBO, Outcome 5 Leaving the study early ‐ short term.
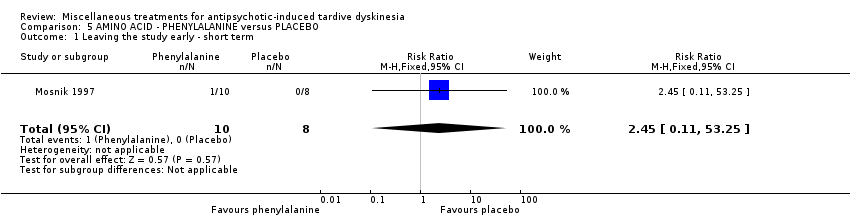
Comparison 5 AMINO ACID ‐ PHENYLALANINE versus PLACEBO, Outcome 1 Leaving the study early ‐ short term.

Comparison 6 ANTIDEPRESSANT (MAO‐B inhibitor) ‐ SELEGILINE versus PLACEBO, Outcome 1 Tardive dyskinesia: 1. No clinically important improvement ‐ medium term.
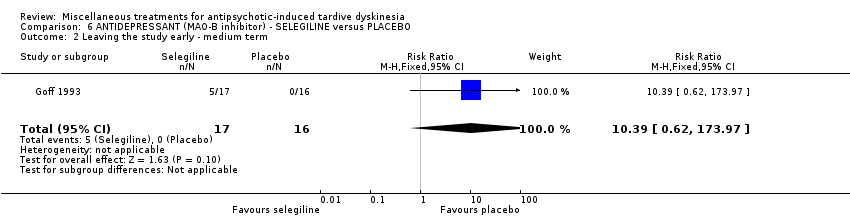
Comparison 6 ANTIDEPRESSANT (MAO‐B inhibitor) ‐ SELEGILINE versus PLACEBO, Outcome 2 Leaving the study early ‐ medium term.

Comparison 7 ANTIDEPRESSANT (MAOI) ISOCARBOXAZID versus PROCYCLIDINE, Outcome 1 Tardive dyskinesia: 1. No clinically important improvement ‐ long term.
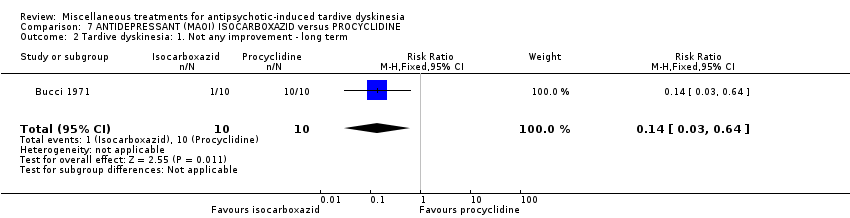
Comparison 7 ANTIDEPRESSANT (MAOI) ISOCARBOXAZID versus PROCYCLIDINE, Outcome 2 Tardive dyskinesia: 1. Not any improvement ‐ long term.
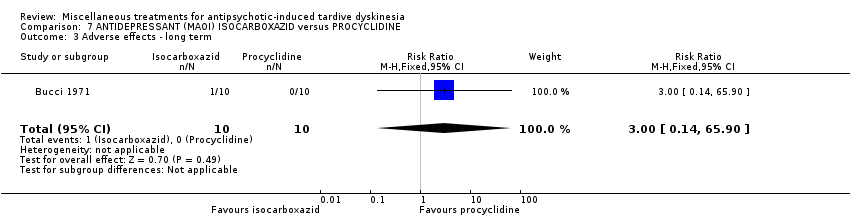
Comparison 7 ANTIDEPRESSANT (MAOI) ISOCARBOXAZID versus PROCYCLIDINE, Outcome 3 Adverse effects ‐ long term.

Comparison 7 ANTIDEPRESSANT (MAOI) ISOCARBOXAZID versus PROCYCLIDINE, Outcome 4 Leaving the study early ‐ long term.

Comparison 8 ANTIDEPRESSANT (SSRI) ‐ RITANSERIN vs PLACEBO, Outcome 1 Tardive dyskinesia: No clinically important improvement (short term).
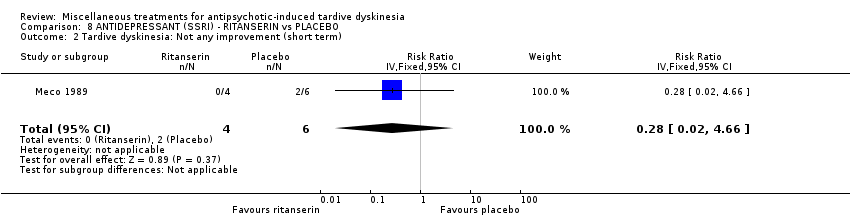
Comparison 8 ANTIDEPRESSANT (SSRI) ‐ RITANSERIN vs PLACEBO, Outcome 2 Tardive dyskinesia: Not any improvement (short term).
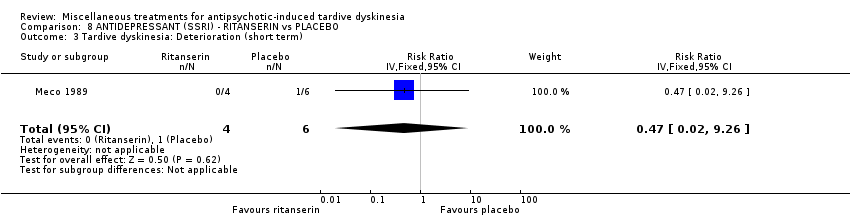
Comparison 8 ANTIDEPRESSANT (SSRI) ‐ RITANSERIN vs PLACEBO, Outcome 3 Tardive dyskinesia: Deterioration (short term).

Comparison 8 ANTIDEPRESSANT (SSRI) ‐ RITANSERIN vs PLACEBO, Outcome 4 Tardive dyskinesia: Average change score (AIMS, high=poor) (short term).

Comparison 8 ANTIDEPRESSANT (SSRI) ‐ RITANSERIN vs PLACEBO, Outcome 5 General mental state: Deterioration (short term).
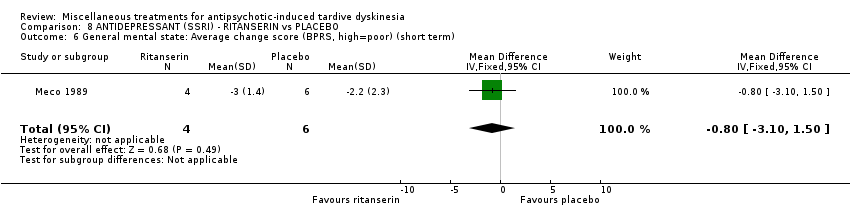
Comparison 8 ANTIDEPRESSANT (SSRI) ‐ RITANSERIN vs PLACEBO, Outcome 6 General mental state: Average change score (BPRS, high=poor) (short term).

Comparison 9 ANTIEPILEPTIC ‐ LEVETIRACETAM versus PLACEBO, Outcome 1 Tardive dyskinesia: 1. Average endpoint score (AIMS, high=poor) ‐ medium term.
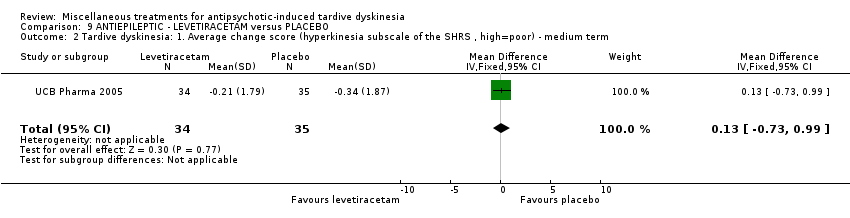
Comparison 9 ANTIEPILEPTIC ‐ LEVETIRACETAM versus PLACEBO, Outcome 2 Tardive dyskinesia: 1. Average change score (hyperkinesia subscale of the SHRS , high=poor) ‐ medium term.
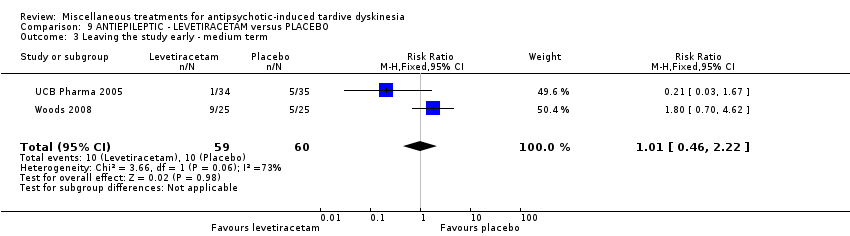
Comparison 9 ANTIEPILEPTIC ‐ LEVETIRACETAM versus PLACEBO, Outcome 3 Leaving the study early ‐ medium term.

Comparison 9 ANTIEPILEPTIC ‐ LEVETIRACETAM versus PLACEBO, Outcome 4 Adverse effects ‐ medium term.
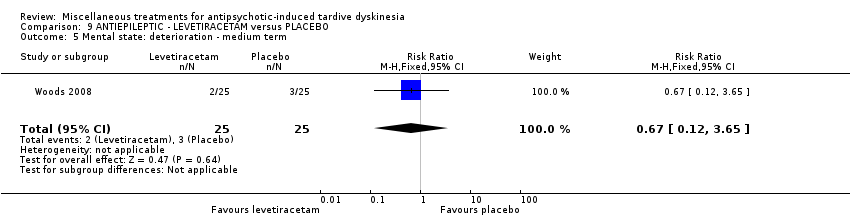
Comparison 9 ANTIEPILEPTIC ‐ LEVETIRACETAM versus PLACEBO, Outcome 5 Mental state: deterioration ‐ medium term.

Comparison 10 ANTIHISTAMINE ‐ CYPROHEPTADINE versus PLACEBO, Outcome 1 Tardive dyskinesia: 2. Not any improvement ‐ short term.
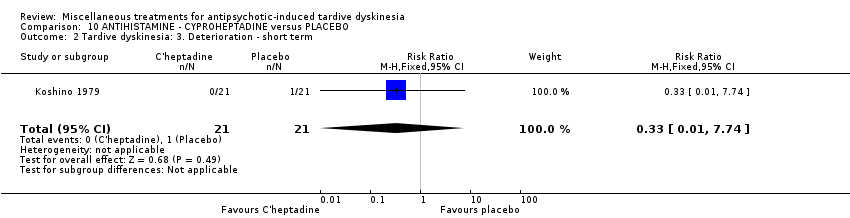
Comparison 10 ANTIHISTAMINE ‐ CYPROHEPTADINE versus PLACEBO, Outcome 2 Tardive dyskinesia: 3. Deterioration ‐ short term.

Comparison 10 ANTIHISTAMINE ‐ CYPROHEPTADINE versus PLACEBO, Outcome 3 Adverse events ‐ short term.

Comparison 10 ANTIHISTAMINE ‐ CYPROHEPTADINE versus PLACEBO, Outcome 4 Leaving the study early ‐ short term.
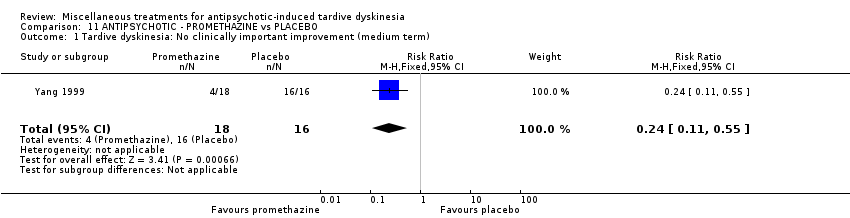
Comparison 11 ANTIPSYCHOTIC ‐ PROMETHAZINE vs PLACEBO, Outcome 1 Tardive dyskinesia: No clinically important improvement (medium term).

Comparison 11 ANTIPSYCHOTIC ‐ PROMETHAZINE vs PLACEBO, Outcome 2 Tardive dyskinesia: Not any improvement (medium term).

Comparison 11 ANTIPSYCHOTIC ‐ PROMETHAZINE vs PLACEBO, Outcome 3 Tardive dyskinesia: Average endpoint score (AIMS, high=poor) (medium term).
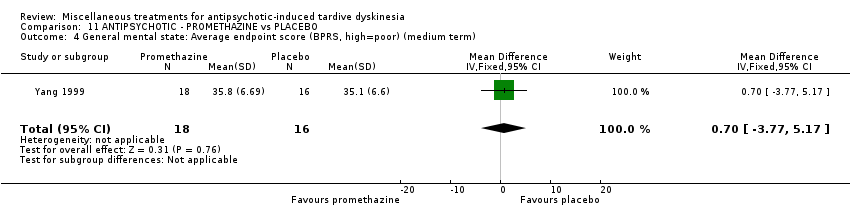
Comparison 11 ANTIPSYCHOTIC ‐ PROMETHAZINE vs PLACEBO, Outcome 4 General mental state: Average endpoint score (BPRS, high=poor) (medium term).
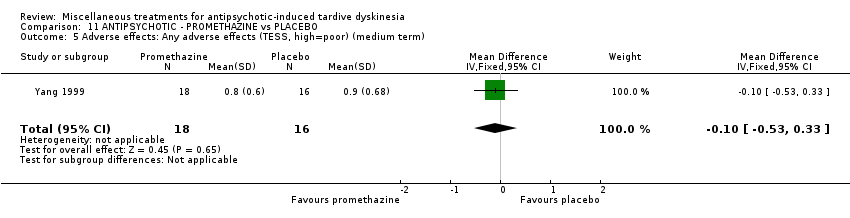
Comparison 11 ANTIPSYCHOTIC ‐ PROMETHAZINE vs PLACEBO, Outcome 5 Adverse effects: Any adverse effects (TESS, high=poor) (medium term).
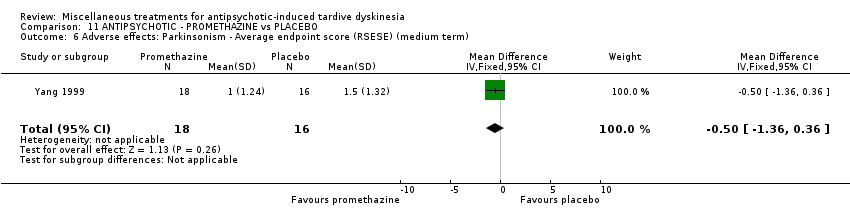
Comparison 11 ANTIPSYCHOTIC ‐ PROMETHAZINE vs PLACEBO, Outcome 6 Adverse effects: Parkinsonism ‐ Average endpoint score (RSESE) (medium term).
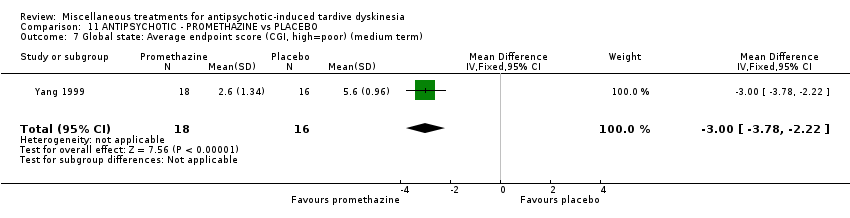
Comparison 11 ANTIPSYCHOTIC ‐ PROMETHAZINE vs PLACEBO, Outcome 7 Global state: Average endpoint score (CGI, high=poor) (medium term).

Comparison 12 ANXIOLYTIC ‐ BUSPIRONE versus PLACEBO, Outcome 1 Tardive dyskinesia: 1. No clinically important improvement ‐ medium term.

Comparison 12 ANXIOLYTIC ‐ BUSPIRONE versus PLACEBO, Outcome 2 Tardive dyskinesia: 2. Not any improvement ‐ medium term.

Comparison 12 ANXIOLYTIC ‐ BUSPIRONE versus PLACEBO, Outcome 3 Tardive dyskinesia: 3. Average scale score (AIMS, high=poor) ‐ medium term.
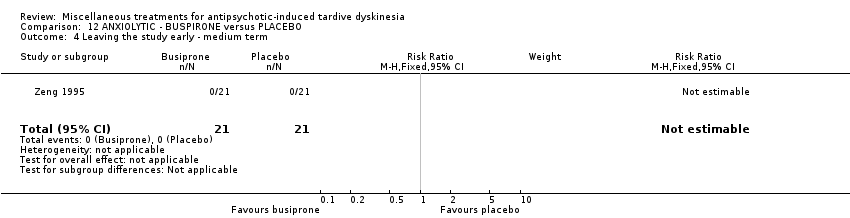
Comparison 12 ANXIOLYTIC ‐ BUSPIRONE versus PLACEBO, Outcome 4 Leaving the study early ‐ medium term.
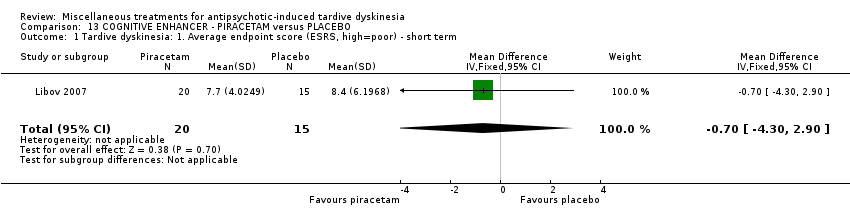
Comparison 13 COGNITIVE ENHANCER ‐ PIRACETAM versus PLACEBO, Outcome 1 Tardive dyskinesia: 1. Average endpoint score (ESRS, high=poor) ‐ short term.

Comparison 13 COGNITIVE ENHANCER ‐ PIRACETAM versus PLACEBO, Outcome 2 Parkinsonism: 1. Average endpoint score (ESRS, high=poor) ‐ short term.
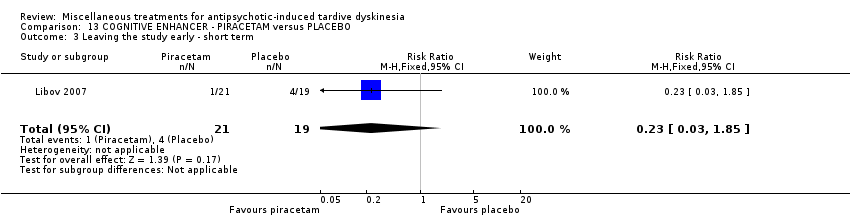
Comparison 13 COGNITIVE ENHANCER ‐ PIRACETAM versus PLACEBO, Outcome 3 Leaving the study early ‐ short term.
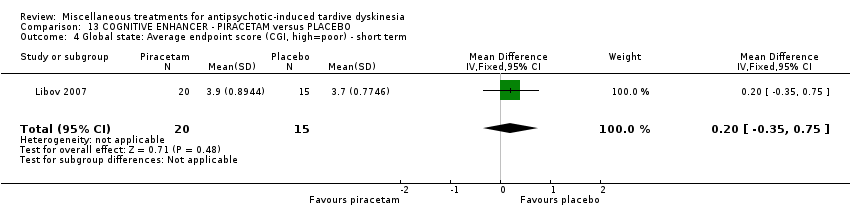
Comparison 13 COGNITIVE ENHANCER ‐ PIRACETAM versus PLACEBO, Outcome 4 Global state: Average endpoint score (CGI, high=poor) ‐ short term.

Comparison 14 COGNITIVE ENHANCER/STIMULANT ‐ PEMOLINE versus PLACEBO, Outcome 1 Tardive dyskinesia: 1. No clinically important improvement ‐ medium term.
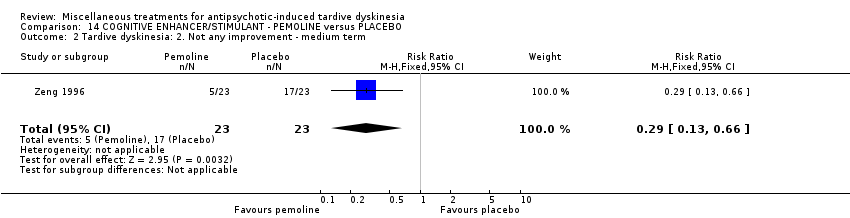
Comparison 14 COGNITIVE ENHANCER/STIMULANT ‐ PEMOLINE versus PLACEBO, Outcome 2 Tardive dyskinesia: 2. Not any improvement ‐ medium term.

Comparison 14 COGNITIVE ENHANCER/STIMULANT ‐ PEMOLINE versus PLACEBO, Outcome 3 Tardive dyskinesia: 3. Average scale score (AIMS, high=poor) ‐ medium term.

Comparison 14 COGNITIVE ENHANCER/STIMULANT ‐ PEMOLINE versus PLACEBO, Outcome 4 Leaving the study early ‐ medium term.
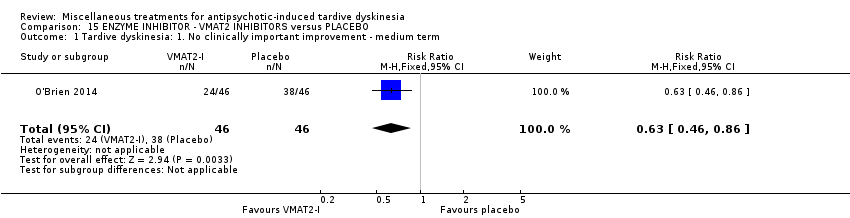
Comparison 15 ENZYME INHIBITOR ‐ VMAT2 INHIBITORS versus PLACEBO, Outcome 1 Tardive dyskinesia: 1. No clinically important improvement ‐ medium term.

Comparison 15 ENZYME INHIBITOR ‐ VMAT2 INHIBITORS versus PLACEBO, Outcome 2 Tardive dyskinesia: 3. Average change score (AIMS, high=poor) ‐ medium term.

Comparison 15 ENZYME INHIBITOR ‐ VMAT2 INHIBITORS versus PLACEBO, Outcome 3 Adverse events ‐ medium term.

Comparison 15 ENZYME INHIBITOR ‐ VMAT2 INHIBITORS versus PLACEBO, Outcome 4 Leaving the study early ‐ medium term.
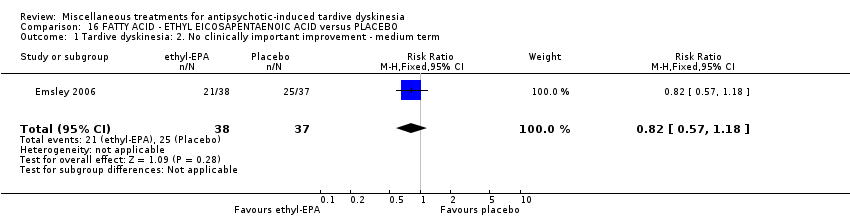
Comparison 16 FATTY ACID ‐ ETHYL EICOSAPENTAENOIC ACID versus PLACEBO, Outcome 1 Tardive dyskinesia: 2. No clinically important improvement ‐ medium term.

Comparison 16 FATTY ACID ‐ ETHYL EICOSAPENTAENOIC ACID versus PLACEBO, Outcome 2 Mental state: deterioration ‐ medium term.

Comparison 16 FATTY ACID ‐ ETHYL EICOSAPENTAENOIC ACID versus PLACEBO, Outcome 3 Adverse events: Parkinsonism ‐ Average change in scale score (ESRS, low=better) ‐ medium term.

Comparison 16 FATTY ACID ‐ ETHYL EICOSAPENTAENOIC ACID versus PLACEBO, Outcome 4 Adverse events: Dystonia ‐ Average change in scale score (ESRS, low=better) ‐ medium term.

Comparison 16 FATTY ACID ‐ ETHYL EICOSAPENTAENOIC ACID versus PLACEBO, Outcome 5 Adverse events: Akathisia ‐ Average change in scale score (ESRS, low=better) ‐ medium term.

Comparison 16 FATTY ACID ‐ ETHYL EICOSAPENTAENOIC ACID versus PLACEBO, Outcome 6 Leaving the study early ‐ medium term.

Comparison 17 FATTY ACID ‐ GAMMA‐LINOLENIC ACID versus PLACEBO, Outcome 1 Tardive dyskinesia: 1. No clinically important improvement ‐ medium term.
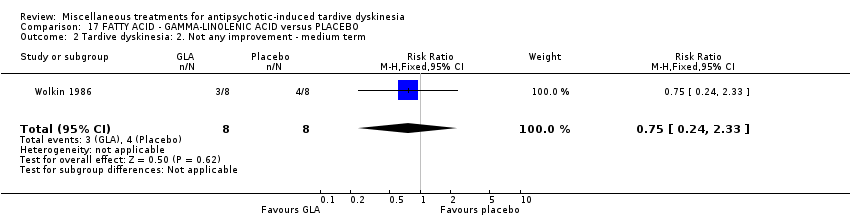
Comparison 17 FATTY ACID ‐ GAMMA‐LINOLENIC ACID versus PLACEBO, Outcome 2 Tardive dyskinesia: 2. Not any improvement ‐ medium term.

Comparison 17 FATTY ACID ‐ GAMMA‐LINOLENIC ACID versus PLACEBO, Outcome 3 Tardive dyskinesia: 3. Deterioration ‐ medium term.
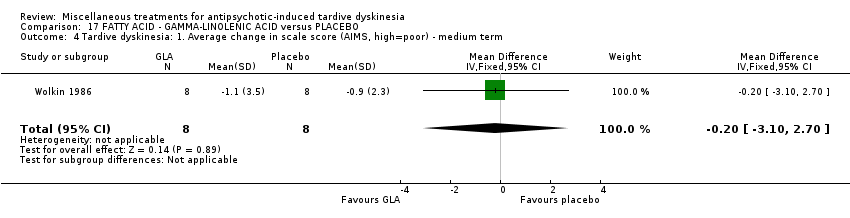
Comparison 17 FATTY ACID ‐ GAMMA‐LINOLENIC ACID versus PLACEBO, Outcome 4 Tardive dyskinesia: 1. Average change in scale score (AIMS, high=poor) ‐ medium term.
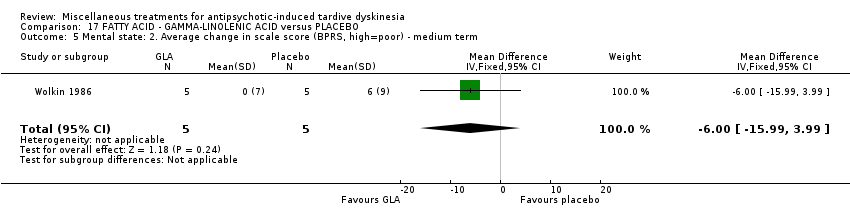
Comparison 17 FATTY ACID ‐ GAMMA‐LINOLENIC ACID versus PLACEBO, Outcome 5 Mental state: 2. Average change in scale score (BPRS, high=poor) ‐ medium term.

Comparison 17 FATTY ACID ‐ GAMMA‐LINOLENIC ACID versus PLACEBO, Outcome 6 Leaving the study early ‐ medium term.

Comparison 18 HERB ‐ GINKGO BILOBA versus PLACEBO, Outcome 1 Tardive dyskinesia: 1. No clinically important improvement ‐ medium term.
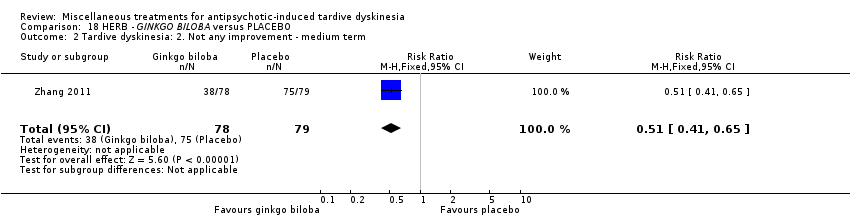
Comparison 18 HERB ‐ GINKGO BILOBA versus PLACEBO, Outcome 2 Tardive dyskinesia: 2. Not any improvement ‐ medium term.

Comparison 18 HERB ‐ GINKGO BILOBA versus PLACEBO, Outcome 3 Tardive dyskinesia: 3. Average scale score (AIMS, high=poor) ‐ medium term.

Comparison 18 HERB ‐ GINKGO BILOBA versus PLACEBO, Outcome 4 Leaving the study early ‐ medium term.

Comparison 18 HERB ‐ GINKGO BILOBA versus PLACEBO, Outcome 5 Mental state: deterioration ‐ medium term.
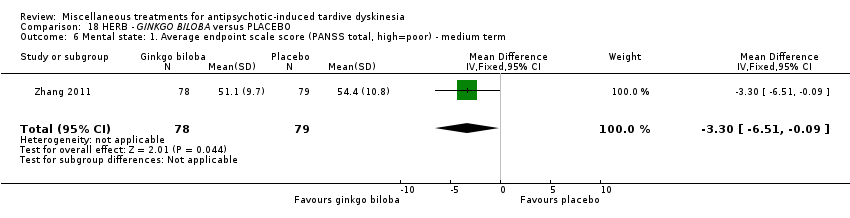
Comparison 18 HERB ‐ GINKGO BILOBA versus PLACEBO, Outcome 6 Mental state: 1. Average endpoint scale score (PANSS total, high=poor) ‐ medium term.

Comparison 18 HERB ‐ GINKGO BILOBA versus PLACEBO, Outcome 7 Cognitive function: CPT‐37 ‐ proportion correct responses (high=better) ‐ medium term.

Comparison 19 HORMONE ‐ OESTROGEN versus PLACEBO, Outcome 1 Tardive dyskinesia: 1. No clinically important improvement ‐ short term.
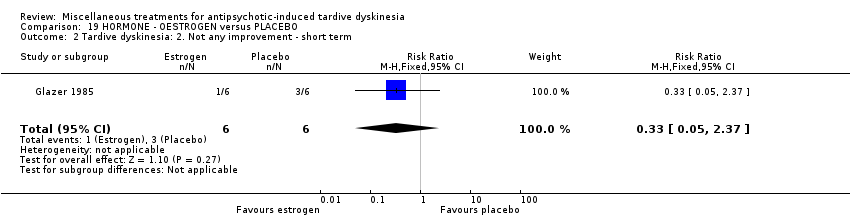
Comparison 19 HORMONE ‐ OESTROGEN versus PLACEBO, Outcome 2 Tardive dyskinesia: 2. Not any improvement ‐ short term.
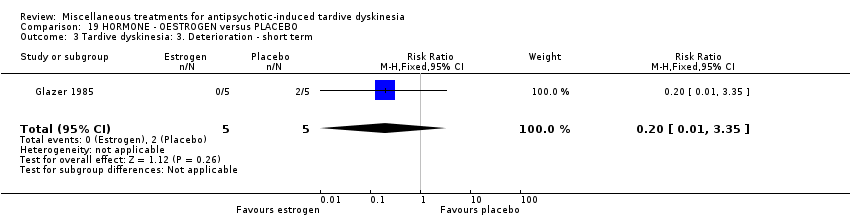
Comparison 19 HORMONE ‐ OESTROGEN versus PLACEBO, Outcome 3 Tardive dyskinesia: 3. Deterioration ‐ short term.

Comparison 19 HORMONE ‐ OESTROGEN versus PLACEBO, Outcome 4 Tardive dyskinesia: 4. Average scale score (AIMS, high=poor) ‐ short term.

Comparison 19 HORMONE ‐ OESTROGEN versus PLACEBO, Outcome 5 Adverse effects ‐ short term.
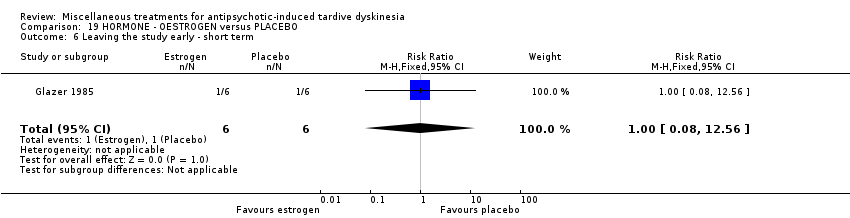
Comparison 19 HORMONE ‐ OESTROGEN versus PLACEBO, Outcome 6 Leaving the study early ‐ short term.
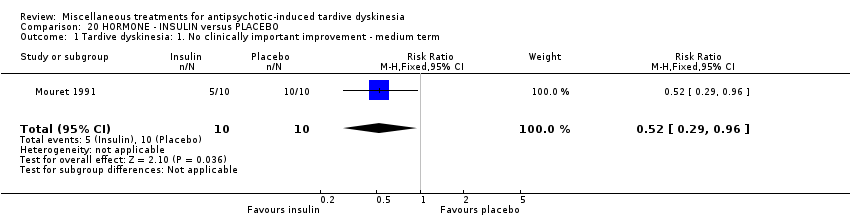
Comparison 20 HORMONE ‐ INSULIN versus PLACEBO, Outcome 1 Tardive dyskinesia: 1. No clinically important improvement ‐ medium term.

Comparison 20 HORMONE ‐ INSULIN versus PLACEBO, Outcome 2 Tardive dyskinesia: 2. Not any improvement ‐ medium term.

Comparison 20 HORMONE ‐ INSULIN versus PLACEBO, Outcome 3 Tardive dyskinesia: 3. Deterioration ‐ medium term.

Comparison 20 HORMONE ‐ INSULIN versus PLACEBO, Outcome 4 Tardive dyskinesia: 3. Average scale score (AIMS, high=poor) ‐ medium term.

Comparison 20 HORMONE ‐ INSULIN versus PLACEBO, Outcome 5 Leaving the study early ‐ medium term.

Comparison 21 HORMONE ‐ MELATONIN versus PLACEBO OR NO TREATMENT, Outcome 1 Tardive dyskinesia: 1. No clinically important improvement.
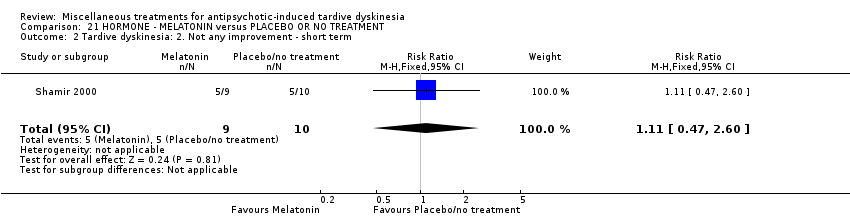
Comparison 21 HORMONE ‐ MELATONIN versus PLACEBO OR NO TREATMENT, Outcome 2 Tardive dyskinesia: 2. Not any improvement ‐ short term.
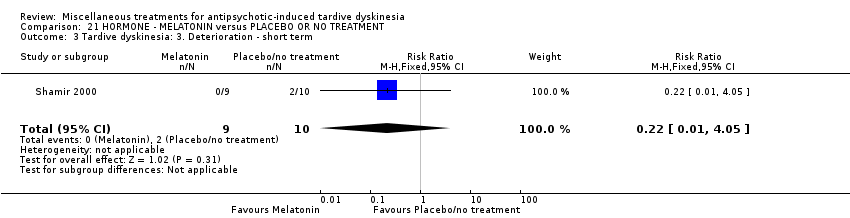
Comparison 21 HORMONE ‐ MELATONIN versus PLACEBO OR NO TREATMENT, Outcome 3 Tardive dyskinesia: 3. Deterioration ‐ short term.

Comparison 21 HORMONE ‐ MELATONIN versus PLACEBO OR NO TREATMENT, Outcome 4 Tardive dyskinesia: 3. Average scale score (AIMS, high=poor) ‐ medium term.
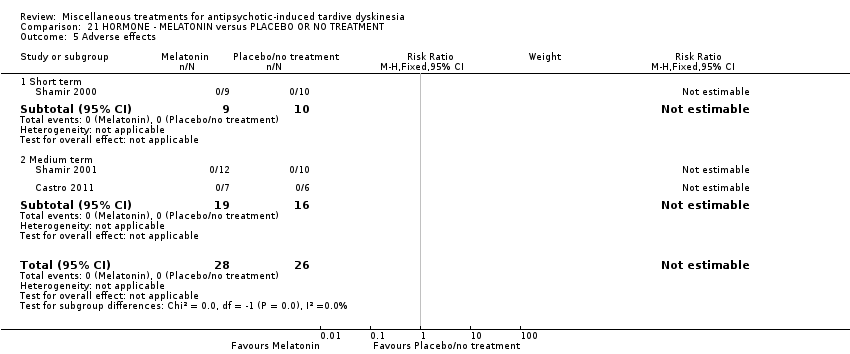
Comparison 21 HORMONE ‐ MELATONIN versus PLACEBO OR NO TREATMENT, Outcome 5 Adverse effects.

Comparison 21 HORMONE ‐ MELATONIN versus PLACEBO OR NO TREATMENT, Outcome 6 Leaving the study early.

Comparison 21 HORMONE ‐ MELATONIN versus PLACEBO OR NO TREATMENT, Outcome 7 Cognitive function: Average scale score ‐ medium term.
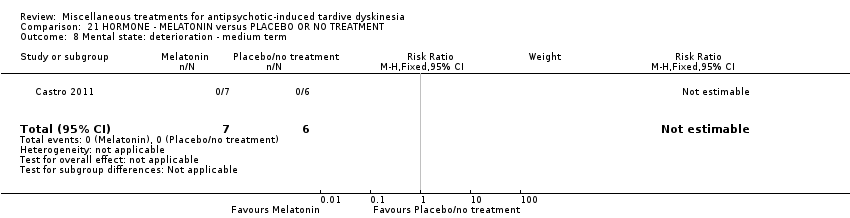
Comparison 21 HORMONE ‐ MELATONIN versus PLACEBO OR NO TREATMENT, Outcome 8 Mental state: deterioration ‐ medium term.
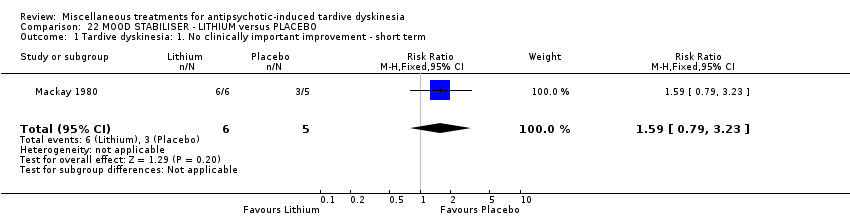
Comparison 22 MOOD STABILISER ‐ LITHIUM versus PLACEBO, Outcome 1 Tardive dyskinesia: 1. No clinically important improvement ‐ short term.

Comparison 22 MOOD STABILISER ‐ LITHIUM versus PLACEBO, Outcome 2 Tardive dyskinesia: 2. Not any improvement ‐ short term.

Comparison 22 MOOD STABILISER ‐ LITHIUM versus PLACEBO, Outcome 3 Tardive dyskinesia: 3. Deterioration ‐ short term.

Comparison 22 MOOD STABILISER ‐ LITHIUM versus PLACEBO, Outcome 4 Tardive dyskinesia: 3. Average scale score (AIMS, high=poor) ‐ short term.

Comparison 22 MOOD STABILISER ‐ LITHIUM versus PLACEBO, Outcome 5 Adverse events ‐ short term.
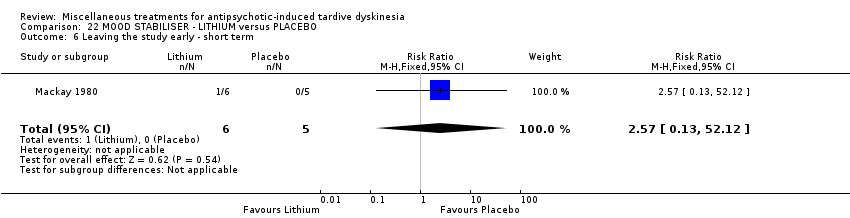
Comparison 22 MOOD STABILISER ‐ LITHIUM versus PLACEBO, Outcome 6 Leaving the study early ‐ short term.

Comparison 23 POLYPEPTIDE ‐ CERULETIDE versus PLACEBO, Outcome 1 Tardive dyskinesia: 1. Not any improvement.
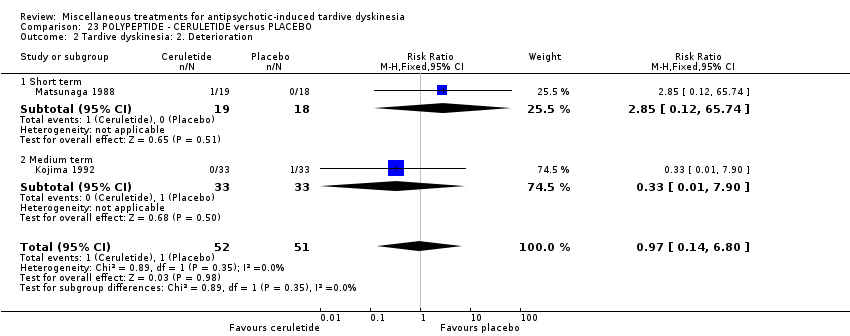
Comparison 23 POLYPEPTIDE ‐ CERULETIDE versus PLACEBO, Outcome 2 Tardive dyskinesia: 2. Deterioration.

Comparison 23 POLYPEPTIDE ‐ CERULETIDE versus PLACEBO, Outcome 3 Adverse effects.

Comparison 23 POLYPEPTIDE ‐ CERULETIDE versus PLACEBO, Outcome 4 Leaving the study early ‐ medium term.

Comparison 24 HYPNOSIS OR RELAXATION versus TREATMENT AS USUAL, Outcome 1 Tardive dyskinesia: 1. No clinically important improvement ‐ medium term.
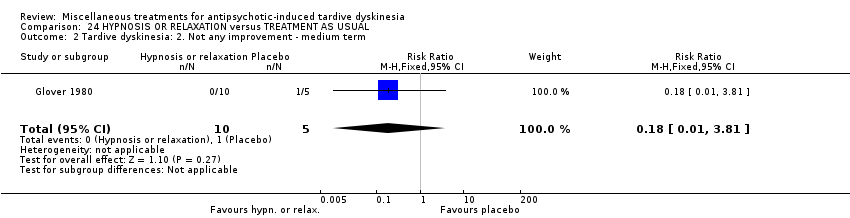
Comparison 24 HYPNOSIS OR RELAXATION versus TREATMENT AS USUAL, Outcome 2 Tardive dyskinesia: 2. Not any improvement ‐ medium term.
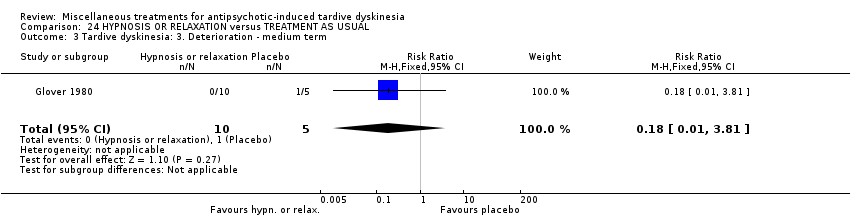
Comparison 24 HYPNOSIS OR RELAXATION versus TREATMENT AS USUAL, Outcome 3 Tardive dyskinesia: 3. Deterioration ‐ medium term.

Comparison 24 HYPNOSIS OR RELAXATION versus TREATMENT AS USUAL, Outcome 4 Leaving the study early ‐ medium term.
| Methods | Allocation: randomised, with sequence generation and concealment of allocation clearly described. |
| Participants | People with antipsychotic‐induced tardive dyskinesia.* |
| Interventions | 1. Active intervention. N = 150. |
| Outcomes | Tardive dyskinesia: any clinically important improvement in TD, any improvement, deterioration.*** |
| Notes | * This could be diagnosed by clinical decision. If funds were permitting all participants could be screened using operational criteria, otherwise a random sample should suffice. ** Size of study with sufficient power to highlight about a 10% difference between groups for primary outcome. |
| DIHYDROGENATED ERGOT ALKALOIDS versus PLACEBO for antipsychotic‐induced tardive dyskinesia | ||||||
| Patient or population: female and male 59‐80 (mean) years old patients with antipsychotic‐induced tardive dyskinesia | ||||||
| Outcomes | Illustrative comparative risks* (95% CI) | Relative effect | No of Participants | Quality of the evidence | Comments | |
| Assumed risk | Corresponding risk | |||||
| Placebo | DIHYDROGENATED ERGOT ALKALOIDS | |||||
| Tardive dyskinesia: No clinically important improvement | 786 per 1000 | 354 per 1000 | RR 0.45 | 28 | ⊕⊕⊝⊝ | |
| Tardive dyskinesia: Deterioration of symptoms follow‐up: 6 weeks | 71 per 1000 | 24 per 1000 | RR 0.33 | 28 | ⊕⊝⊝⊝ | |
| Adverse effects ‐ any adverse effect follow‐up: 6 weeks | 214 per 1000 | 499 per 1000 | RR 2.33 | 28 | ⊕⊝⊝⊝ | |
| Acceptability of treatment (measured by participants leaving the study early) follow‐up: 6 weeks | 42 per 1000 | 14 per 1000 | RR 0.33 | 48 | ⊕⊝⊝⊝ | |
| Social confidence, social inclusion, social networks, or personalised quality of life ‐ not reported | This outcome was not reported. | |||||
| *The risk in the intervention group (and its 95% confidence interval) is based on the assumed risk in the comparison group and the relative effect of the intervention (and its 95% CI). | ||||||
| GRADE Working Group grades of evidence | ||||||
| 1 Downgraded one step for risk of bias: randomisation procedure and allocation concealment were not adequately described. | ||||||
| LEVETIRACETAM versus PLACEBO for antipsychotic‐induced tardive dyskinesia | ||||||
| Patient or population: female and male 47‐54 years old (mean) patients with various psychiatric conditions and antipsychotic‐induced tardive dyskinesia | ||||||
| Outcomes | Illustrative comparative risks* (95% CI) | Relative effect | No of Participants | Quality of the evidence | Comments | |
| Assumed risk | Corresponding risk | |||||
| Placebo | LEVETIRACETAM | |||||
| Tardive dyskinesia: No clinically important improvement ‐ not reported | This outcome was not reported. | |||||
| Tardive dyskinesia: Deterioration of symptoms ‐ not reported | This outcome was not reported. | |||||
| Adverse effects ‐ any adverse effect follow‐up: 8 weeks | 457 per 1000 | 233 per 1000 | RR 0.51 | 69 | ⊕⊕⊝⊝ | |
| Acceptability of treatment (measured by participants leaving the study early) | 167 per 1000 | 168 per 1000 | RR 1.01 | 119 | ⊕⊝⊝⊝ | |
| Social confidence, social inclusion, social networks, or personalised quality of life ‐ not reported | This outcome was not reported. | |||||
| *The risk in the intervention group (and its 95% confidence interval) is based on the assumed risk in the comparison group and the relative effect of the intervention (and its 95% CI). | ||||||
| GRADE Working Group grades of evidence | ||||||
| 1 Downgraded one step for risk of bias: randomisation procedure, allocation concealment and blinding were not adequately described. | ||||||
| BUSPIRONE versus PLACEBO for antipsychotic‐induced tardive dyskinesia | ||||||
| Patient or population: female and male 33‐year old (mean) patients with schizophrenia and antipsychotic‐induced tardive dyskinesia | ||||||
| Outcomes | Anticipated absolute effects* (95% CI) | Relative effect | № of participants | Quality of the evidence | Comments | |
| Risk with placebo | Risk with buspirone | |||||
| Tardive dyskinesia: No clinically important improvement | 905 per 1,000 | 480 per 1,000 | RR 0.53 | 42 | ⊕⊕⊝⊝ | |
| Tardive dyskinesia: Deterioration of symptoms ‐ not reported | This outcome was not reported. | |||||
| Adverse effects ‐ not reported | This outcome was not reported. | |||||
| Acceptability of treatment (measured by participants leaving the study early) | not estimable | not estimable | RR not estimable | 42 | ⊕⊝⊝⊝ | No events were reported. |
| Social confidence, social inclusion, social networks, or personalised quality of life ‐ not reported | This outcome was not reported. | |||||
| *The risk in the intervention group (and its 95% confidence interval) is based on the assumed risk in the comparison group and the relative effect of the intervention (and its 95% CI). | ||||||
| GRADE Working Group grades of evidence | ||||||
| 1 Downgraded one step for risk of bias: randomisation procedure, allocation concealment and blinding were not adequately described. 2 Downgraded one step for imprecision: very small sample size and few events reported. 3 Downgraded two steps for imprecision: effect could not be estimated due to very small sample size with no events reported. | ||||||
| VMAT2‐inhibitor compared to placebo for antipsychotic‐induced tardive dyskinesia | ||||||
| Patient or population: 18 to 85 year‐old patients with schizophrenia, schizoaffective disorder, mood disorder, or gastrointestinal disorder + antipsychotic‐induced tardive dyskinesia | ||||||
| Outcomes | Illustrative comparative risks* (95% CI) | Relative effect | No of Participants | Quality of the evidence | Comments | |
| Assumed risk | Corresponding risk | |||||
| Placebo | VMAT2‐inhibitor | |||||
| Tardive dyskinesia: 1. No clinically important improvement | 826 per 1000 | 520 per 1000 | RR 0.63 | 92 | ⊕⊕⊕⊝ | |
| Adverse effects ‐ any adverse effect | 327 per 1000 | 490 per 1000 | RR 1.50 | 100 | ⊕⊕⊝⊝ | |
| Leaving the study early | 98 per 1000 | 98 per 1000 | RR 1.00 | 102 | ⊕⊝⊝⊝ | |
| *The basis for the assumed risk (e.g. the median control group risk across studies) is provided in footnotes. The corresponding risk (and its 95% confidence interval) is based on the assumed risk in the comparison group and the relative effect of the intervention (and its 95% CI). | ||||||
| GRADE Working Group grades of evidence | ||||||
| 1 Downgraded one step for imprecision: small sample size and few events reported | ||||||
| ETHYL‐EPA versus PLACEBO for antipsychotic‐induced tardive dyskinesia | ||||||
| Patient or population: female and male 42 (mean) years old patients with schizophrenia or schizoaffective disorder and antipsychotic‐induced tardive dyskinesia | ||||||
| Outcomes | Illustrative comparative risks* (95% CI) | Relative effect | No of Participants | Quality of the evidence | Comments | |
| Assumed risk | Corresponding risk | |||||
| Placebo | ETHYL‐EPA | |||||
| Tardive dyskinesia: No clinically important improvement ‐ not reported | This outcome was not reported. | |||||
| Tardive dyskinesia: Deterioration of symptoms ‐ not reported | This outcome was not reported. | |||||
| Adverse effects: EPS: parkinsonism measured by average ESRS change scores follow‐up: 12 weeks | mean: ‐1.1 (3.3) | The mean change in ESRS: parkinsonism scale score in the ethyl‐EPA group was | MD 0.30 (‐1.17 to 1.77) | 75 (1 RCT) | ⊕⊕⊝⊝ | |
| Adverse effects: EPS: dystonia measured by average ESRS change scores follow‐up: 12 weeks | mean: 0.4 (0.5) | The mean change in ESRS: dystonia scale score in the ethyl‐EPA group was | MD ‐0.35 (‐0.58 to ‐0.12) | 75 (1 RCT) | ⊕⊕⊝⊝ | |
| Adverse effects: EPS: akathisia measured by average ESRS change scores follow‐up: 12 weeks | mean: ‐0.06 (0.7) | The mean change in ESRS: akathisia scale score in the ethyl‐EPA group was | MD ‐0.04 (‐0.30 to 0.22) | 75 (1 RCT) | ⊕⊝⊝⊝ | |
| Acceptability of treatment (measured by participants leaving the study early) follow‐up: 12 weeks | 548 per 1000 | 214 per 1000 | RR 0. 57 | 84 | ⊕⊝⊝⊝ | |
| Social confidence, social inclusion, social networks, or personalised quality of life ‐ not reported | This outcome was not reported. | |||||
| *The risk in the intervention group (and its 95% confidence interval) is based on the assumed risk in the comparison group and the relative effect of the intervention (and its 95% CI). | ||||||
| GRADE Working Group grades of evidence | ||||||
| 1 Downgraded one step for risk of bias: randomisation procedure, allocation concealment and blinding were not adequately described. | ||||||
| GINKGO BILOBA versus PLACEBO for antipsychotic‐induced tardive dyskinesia | ||||||
| Patient or population: male 45.2 (mean) years old patients with schizophrenia and antipsychotic‐induced tardive dyskinesia | ||||||
| Outcomes | Illustrative comparative risks* (95% CI) | Relative effect | No of Participants | Quality of the evidence | Comments | |
| Assumed risk | Corresponding risk | |||||
| Placebo | GINKGO BILOBA | |||||
| Tardive dyskinesia: No clinically important improvement | 987 per 1000 | 869 per 1000 | RR 0.88 | 157 | ⊕⊕⊕⊝ | |
| Tardive dyskinesia: Deterioration of symptoms ‐ not reported | This outcome was not reported. | |||||
| Adverse effects ‐ not reported | This outcome was not reported. | |||||
| Acceptability of treatment (measured by participants leaving the study early) | 51 per 1000 | 13 per 1000 | RR 0.25 | 157 | ⊕⊝⊝⊝ | |
| Social confidence, social inclusion, social networks, or personalised quality of life ‐ not reported | This outcome was not reported. | |||||
| *The risk in the intervention group (and its 95% confidence interval) is based on the assumed risk in the comparison group and the relative effect of the intervention (and its 95% CI). | ||||||
| GRADE Working Group grades of evidence | ||||||
| 1 Downgraded one step for imprecision: small sample size and few events reported. | ||||||
| MELATONIN versus PLACEBO OR NO TREATMENT for antipsychotic‐induced tardive dyskinesia | ||||||
| Patient or population: female and male 28 to 91 years old patients with antipsychotic‐induced tardive dyskinesia | ||||||
| Outcomes | Illustrative comparative risks* (95% CI) | Relative effect | No of Participants | Quality of the evidence | Comments | |
| Assumed risk | Corresponding risk | |||||
| Placebo/no treatment | MELATONIN | |||||
| Tardive dyskinesia: No clinically important improvement | 1000 per 1000 | 890 per 1000 | RR 0.89 | 32 | ⊕⊕⊝⊝ | |
| Tardive dyskinesia: Deterioration of symptoms follow‐up: 3 weeks | 200 per 1000 | 44 per 1000 | RR 0.22 | 19 | ⊕⊕⊝⊝ | |
| Adverse effects follow‐up: 3‐12 weeks | See comment | See comment | Not estimable | 54 | ⊕⊕⊝⊝ | No events were reported. |
| Acceptability of treatment (measured by participants leaving the study early) | See comment | See comment | Not estimable | 54 | ⊕⊝⊝⊝ | No events were reported. |
| Social confidence, social inclusion, social networks, or personalised quality of life ‐ not reported | This outcome was not reported. | |||||
| *The risk in the intervention group (and its 95% confidence interval) is based on the assumed risk in the comparison group and the relative effect of the intervention (and its 95% CI). | ||||||
| GRADE Working Group grades of evidence | ||||||
| 1 Downgraded one step for inconsistency: substantial heterogeneity (I2 = 46%). | ||||||
| CERULETIDE versus PLACEBO for antipsychotic‐induced tardive dyskinesia | ||||||
| Patient or population: female and male 55‐59 year old (mean) patients with various psychiatric conditions and antipsychotic‐induced tardive dyskinesia | ||||||
| Outcomes | Illustrative comparative risks* (95% CI) | Relative effect | No of Participants | Quality of the evidence | Comments | |
| Assumed risk | Corresponding risk | |||||
| Placebo | CERULETIDE | |||||
| Tardive dyskinesia: No clinically important improvement ‐ not reported | This outcome was not reported. | |||||
| Tardive dyskinesia: Deterioration of symptoms follow‐up: 4‐8 weeks | 20 per 1000 | 19 per 1000 | RR 0.97 | 103 | ⊕⊕⊝⊝ | |
| Adverse effects ‐ any adverse effect follow‐up: 4‐8 weeks | 233 per 1000 | 308 per 1000 | RR 1.32 | 122 | ⊕⊕⊝⊝ | |
| Acceptability of treatment (measured by participants leaving the study early) follow‐up: 8 weeks | 214 per 1000 | 234 per 1000 | RR 1.09 | 85 | ⊕⊝⊝⊝ | |
| Social confidence, social inclusion, social networks, or personalised quality of life ‐ not reported | This outcome was not reported. | |||||
| *The risk in the intervention group (and its 95% confidence interval) is based on the assumed risk in the comparison group and the relative effect of the intervention (and its 95% CI). | ||||||
| GRADE Working Group grades of evidence | ||||||
| 1 Downgraded one step for risk of bias: unclear methods of randomisation, blinding not assessed, and potential introduction of detection bias due to subjective nature of outcome assessments. 3 Downgraded one step for indirectness: leaving the study early can give an indication, but is not a direct measurement, of treatment acceptability. | ||||||
| HYPNOSIS OR RELAXATION versus TAU for antipsychotic‐induced tardive dyskinesia | ||||||
| Patients or population: female and male 35 (mean) years old patients with schizophrenia and tardive dyskinesia, acute extrapyramidal symptoms, and/or pseudoparkinsonism | ||||||
| Outcomes | Anticipated absolute effects* (95% CI) | Relative effect | № of participants | Quality of the evidence | Comments | |
| Risk with TAU | Risk with hypnosis or relaxation | |||||
| Tardive dyskinesia: No clinically important improvement | 1,000 per 1,000 | 450 per 1,000 | RR 0.45 | 15 | ⊕⊝⊝⊝ | |
| Tardive dyskinesia: Deterioration of symptoms | 200 per 1,000 | 36 per 1,000 | RR 0.18 | 15 | ⊕⊝⊝⊝ | |
| Adverse effects ‐ not reported | This outcome was not reported. | |||||
| Acceptability of treatment (measured by participants leaving the study early) | 0 per 1,000 | 0 per 1,000 | not estimable | 15 | ⊕⊝⊝⊝ | No events were reported. |
| Social confidence, social inclusion, social networks, or personalised quality of life ‐ not reported | This outcome was not reported. | |||||
| *The risk in the intervention group (and its 95% confidence interval) is based on the assumed risk in the comparison group and the relative effect of the intervention (and its 95% CI). | ||||||
| GRADE Working Group grades of evidence | ||||||
| 1 Downgraded two steps for risk of bias: fully randomised sequence generation and blinding was not achieved. | ||||||
| Review | Citation |
| Anticholinergics | |
| Benzodiazepines | |
| Calcium‐channel blockers | |
| Cholinergics | |
| GABAergic compounds | |
| Neuroleptic medications (including dose reduction and cessation) | |
| Non‐neuroleptic compounds that impact on the dopamine and noradrenaline systems (catecholaminergics) | |
| Vitamin E | |
| This review, Miscellaneous treatments |
| Study | N and setting | Condition | Sex and age | Intervention and duration | Comparison | Outcomes |
| 20 outpatients in the USA | schizophrenia + TD | F+M | Isocarboxazid + AP | Procyclidine + AP | TD symptoms, AEs | |
| 57 participants, setting not reported | TD | F+M | L‐stepholidine + AP | Placebo + AP | TD symptoms, AEs, mental state | |
| 13 in‐ and outpatients in Venezuela | various psychiatric conditions + TD | F+M | Melatonin + AP | Placebo + AP | TD symptoms, AEs, mental state | |
| 84 in‐ and outpatients in South Africa | schizophrenia or schizoaffective disorder + TD | F+M | Omega‐3 fatty acid + AP | Placebo + AP | TD symptoms, AEs, mental state | |
| 22 inpatients in the USA | schizophrenia, dementia + TD | F+M | Papaverine + AP | TAU + AP | TD symptoms | |
| 12 outpatients in the USA | various psychiatric conditions + TD | F | Oestrogen + AP | Placebo + AP | TD symptoms, AEs | |
| Glover 1982 | 15 outpatients in the USA | schizophrenia + TD or EPS | F+M | Hypnosis or relaxation + AP | TAU + AP | TD symptoms |
| 33 outpatients in the USA | TD | F+M | Selengiline + AP | Placebo + AP | TD symptoms | |
| 20 inpatients in the UK | various psychiatric conditions + TD | F+M | Ergoloid mesylates + AP | Placebo + AP | TD symptoms | |
| 85 in‐ and outpatients in Japan | schizophrenia + TD | F+M | Ceruletide + AP | Placebo + AP | TD symptoms, AEs | |
| 42 inpatients in Japan | various psychiatric conditions + TD | F+M | Cyproheptadine + AP | Placebo + AP | TD symptoms, AEs | |
| 28 inpatients in Japan | schizophrenia + TD | F+M | Ergoloid mesylates + AP | Placebo + AP | TD symptoms, AEs, mental state | |
| 40 inpatients in Israel | schizophrenia or schizoaffective disorder + TD | F+M | Piracetam + AP | Placebo + AP | TD symptoms, AEs, global state | |
| 11 inpatients in the UK | various psychiatric conditions + TD | NR | Lithium + AP | Placebo + AP | TD symptoms, AEs | |
| 37 inpatients in Japan | various psychiatric conditions + TD | F+M | Ceruletide + AP | Placebo + AP | TD symptoms, AEs | |
| 10 inpatients in Italy | schizophrenia + TD | F+M | Ritanserin + AP | Placebo + AP | TD symptoms, AEs, mental state | |
| 18 in‐ and outpatients in the USA | schizophrenia + TD | M | Phenylalanine + AP | Placebo + AP | Leaving the study early | |
| 20 inpatients in Morocco | schizophrenia + TD | F+M | Insulin + AP | Placebo + AP | TD symptoms | |
| 88 in‐ and outpatients in the USA | various psychiatric conditions + TD | NR | NBI‐98854 (VMAT2 inhibitor valbenazine) + AP | Placebo + AP | TD symptoms, AEs | |
| 40 inpatients in the UK | various psychiatric conditions + TD | F+M | Ergoloid mesylates + AP | Placebo + AP | TD symptoms | |
| 52 in‐ and outpatients in the USA | various psychiatric conditions + TD | M | Branched‐chain amino acids + AP | Placebo + AP | TD symptoms | |
| 19 inpatients in Israel | schizophrenia + TD | F+M | Melatonin + AP | Placebo + AP | TD symptoms, AEs | |
| 22 inpatients in Israel | schizophrenia + TD | F+M | Melatonin + AP | Placebo + AP | AEs | |
| 76 inpatients in China | TD | F+M | Melatonin + AP | TAU + AP | Cognitive function | |
| 69 inpatients in Belgium and Bulgaria | TD | F+M | Levetiracetam + AP | Placebo + AP | TD symptoms, AEs | |
| 16 in‐ and outpatients in the USA | schizophrenia + TD | M | Evening primrose oil + AP | Placebo + AP | TD symptoms, mental state | |
| 50 outpatients in the USA | various psychiatric conditions + TD | F+M | Levetiracetam + AP | Placebo + AP | TD symptoms, mental state | |
| 34 inpatients in China | schizophrenia + TD | F+M | Promethazine + AP | Placebo + AP | TD symptoms, AEs, mental state, global state | |
| 42 inpatients in China | schizophrenia + TD | F+M | Buspirone + AP | Placebo + AP | TD symptoms | |
| 46 inpatients in China | schizophrenia + TD | F+M | Pemoline + AP | Placebo + AP | TD symptoms | |
| 157 inpatients in China | schizophrenia + TD | M | Ginkgo biloba + AP | Placebo + AP | TD symptoms, mental state, cognitive function | |
| AE = adverse effects, AP = antipsychotics, EPS = extrapyramidal symptoms, F = female, M = male, m = mean, N = number, TAU = treatment as usual, TD = tardive dyskinesia | ||||||
| Outcome or subgroup title | No. of studies | No. of participants | Statistical method | Effect size |
| 1 Tardive dyskinesia: 1. No clinically important improvement ‐ medium term Show forest plot | 1 | 28 | Risk Ratio (M‐H, Fixed, 95% CI) | 0.45 [0.21, 0.97] |
| 2 Tardive dyskinesia: 2. Not any improvement ‐ medium term Show forest plot | 1 | 28 | Risk Ratio (M‐H, Fixed, 95% CI) | 0.5 [0.23, 1.09] |
| 3 Tardive dyskinesia: 3. Deterioration ‐ medium term Show forest plot | 1 | 28 | Risk Ratio (M‐H, Fixed, 95% CI) | 0.33 [0.01, 7.55] |
| 4 Tardive dyskinesia: 3. Average endpoint scale score (Simpson scale, high=poor) ‐ medium term Show forest plot | 1 | 28 | Mean Difference (IV, Fixed, 95% CI) | ‐2.80 [‐12.25, 6.65] |
| 5 Tardive dyskinesia: Average scale change scores (various scales, high=poor) ‐ medium term Show forest plot | 2 | 59 | Std. Mean Difference (IV, Fixed, 95% CI) | ‐0.31 [‐0.83, 0.20] |
| 5.1 AIMS+RTDS | 1 | 40 | Std. Mean Difference (IV, Fixed, 95% CI) | ‐0.31 [‐0.93, 0.32] |
| 5.2 ADS | 1 | 19 | Std. Mean Difference (IV, Fixed, 95% CI) | ‐0.33 [‐1.24, 0.57] |
| 6 Mental state: Deterioration ‐ medium term Show forest plot | 1 | 28 | Risk Ratio (M‐H, Fixed, 95% CI) | 0.5 [0.05, 4.90] |
| 7 Adverse events ‐ medium term Show forest plot | 1 | 28 | Risk Ratio (M‐H, Fixed, 95% CI) | 2.33 [0.75, 7.23] |
| 8 Leaving the study early ‐ medium term Show forest plot | 2 | 48 | Risk Ratio (M‐H, Fixed, 95% CI) | 0.33 [0.02, 7.32] |
| Outcome or subgroup title | No. of studies | No. of participants | Statistical method | Effect size |
| 1 Tardive dyskinesia: 1. No clinically important improvement ‐ medium term Show forest plot | 1 | 57 | Risk Ratio (M‐H, Fixed, 95% CI) | 0.54 [0.35, 0.82] |
| 2 Mental state: 1. Average endpoint scale score (BPRS, high=poor) ‐ medium term Show forest plot | 1 | 20 | Mean Difference (IV, Fixed, 95% CI) | ‐4.5 [‐7.60, ‐1.40] |
| 3 Adverse events: any adverse events ‐ medium term Show forest plot | 1 | 57 | Risk Ratio (M‐H, Fixed, 95% CI) | 0.0 [0.0, 0.0] |
| 4 Leaving the study early ‐ medium term Show forest plot | 1 | 57 | Risk Ratio (M‐H, Fixed, 95% CI) | 0.0 [0.0, 0.0] |
| Outcome or subgroup title | No. of studies | No. of participants | Statistical method | Effect size |
| 1 Tardive dyskinesia: 3. Average scale score (AIMS, high=poor) ‐ medium term Show forest plot | 1 | 22 | Mean Difference (IV, Fixed, 95% CI) | 0.51 [‐1.18, 2.20] |
| Outcome or subgroup title | No. of studies | No. of participants | Statistical method | Effect size |
| 1 Tardive dyskinesia: 1. No clinically important improvement ‐ short term Show forest plot | 1 | 52 | Risk Ratio (M‐H, Fixed, 95% CI) | 0.79 [0.63, 1.00] |
| 2 Tardive dyskinesia: 1. Not any improvement ‐ short term Show forest plot | 1 | 52 | Risk Ratio (M‐H, Fixed, 95% CI) | 0.64 [0.36, 1.11] |
| 3 Tardive dyskinesia: 2. Deterioration ‐ short term Show forest plot | 1 | 36 | Risk Ratio (M‐H, Fixed, 95% CI) | 0.29 [0.07, 1.19] |
| 4 Tardive dyskinesia: Average endpoint score (Simpson scale, high=poor) ‐ short term Show forest plot | 1 | 41 | Mean Difference (IV, Fixed, 95% CI) | ‐92.9 [‐167.57, ‐18.23] |
| 5 Leaving the study early ‐ short term Show forest plot | 1 | 52 | Risk Ratio (M‐H, Fixed, 95% CI) | 0.84 [0.37, 1.92] |
| Outcome or subgroup title | No. of studies | No. of participants | Statistical method | Effect size |
| 1 Leaving the study early ‐ short term Show forest plot | 1 | 18 | Risk Ratio (M‐H, Fixed, 95% CI) | 2.45 [0.11, 53.25] |
| Outcome or subgroup title | No. of studies | No. of participants | Statistical method | Effect size |
| 1 Tardive dyskinesia: 1. No clinically important improvement ‐ medium term Show forest plot | 1 | 33 | Risk Ratio (M‐H, Fixed, 95% CI) | 1.37 [0.96, 1.94] |
| 2 Leaving the study early ‐ medium term Show forest plot | 1 | 33 | Risk Ratio (M‐H, Fixed, 95% CI) | 10.39 [0.62, 173.97] |
| Outcome or subgroup title | No. of studies | No. of participants | Statistical method | Effect size |
| 1 Tardive dyskinesia: 1. No clinically important improvement ‐ long term Show forest plot | 1 | 20 | Risk Ratio (M‐H, Fixed, 95% CI) | 0.24 [0.08, 0.71] |
| 2 Tardive dyskinesia: 1. Not any improvement ‐ long term Show forest plot | 1 | 20 | Risk Ratio (M‐H, Fixed, 95% CI) | 0.14 [0.03, 0.64] |
| 3 Adverse effects ‐ long term Show forest plot | 1 | 20 | Risk Ratio (M‐H, Fixed, 95% CI) | 3.0 [0.14, 65.90] |
| 4 Leaving the study early ‐ long term Show forest plot | 1 | 20 | Risk Ratio (M‐H, Fixed, 95% CI) | 3.0 [0.14, 65.90] |
| Outcome or subgroup title | No. of studies | No. of participants | Statistical method | Effect size |
| 1 Tardive dyskinesia: No clinically important improvement (short term) Show forest plot | 1 | 10 | Risk Ratio (M‐H, Fixed, 95% CI) | 1.0 [0.70, 1.43] |
| 2 Tardive dyskinesia: Not any improvement (short term) Show forest plot | 1 | 10 | Risk Ratio (IV, Fixed, 95% CI) | 0.28 [0.02, 4.66] |
| 3 Tardive dyskinesia: Deterioration (short term) Show forest plot | 1 | 10 | Risk Ratio (IV, Fixed, 95% CI) | 0.47 [0.02, 9.26] |
| 4 Tardive dyskinesia: Average change score (AIMS, high=poor) (short term) Show forest plot | 1 | 10 | Mean Difference (IV, Fixed, 95% CI) | ‐2.0 [‐5.93, 1.93] |
| 5 General mental state: Deterioration (short term) Show forest plot | 1 | 10 | Risk Ratio (IV, Fixed, 95% CI) | 0.47 [0.02, 9.26] |
| 6 General mental state: Average change score (BPRS, high=poor) (short term) Show forest plot | 1 | 10 | Mean Difference (IV, Fixed, 95% CI) | ‐0.80 [‐3.10, 1.50] |
| Outcome or subgroup title | No. of studies | No. of participants | Statistical method | Effect size |
| 1 Tardive dyskinesia: 1. Average endpoint score (AIMS, high=poor) ‐ medium term Show forest plot | 1 | 50 | Mean Difference (IV, Fixed, 95% CI) | ‐2.18 [‐3.65, ‐0.71] |
| 2 Tardive dyskinesia: 1. Average change score (hyperkinesia subscale of the SHRS , high=poor) ‐ medium term Show forest plot | 1 | 69 | Mean Difference (IV, Fixed, 95% CI) | 0.13 [‐0.73, 0.99] |
| 3 Leaving the study early ‐ medium term Show forest plot | 2 | 119 | Risk Ratio (M‐H, Fixed, 95% CI) | 1.01 [0.46, 2.22] |
| 4 Adverse effects ‐ medium term Show forest plot | 1 | 69 | Risk Ratio (M‐H, Fixed, 95% CI) | 0.51 [0.25, 1.04] |
| 5 Mental state: deterioration ‐ medium term Show forest plot | 1 | 50 | Risk Ratio (M‐H, Fixed, 95% CI) | 0.67 [0.12, 3.65] |
| Outcome or subgroup title | No. of studies | No. of participants | Statistical method | Effect size |
| 1 Tardive dyskinesia: 2. Not any improvement ‐ short term Show forest plot | 1 | 42 | Risk Ratio (M‐H, Fixed, 95% CI) | 0.54 [0.27, 1.08] |
| 2 Tardive dyskinesia: 3. Deterioration ‐ short term Show forest plot | 1 | 42 | Risk Ratio (M‐H, Fixed, 95% CI) | 0.33 [0.01, 7.74] |
| 3 Adverse events ‐ short term Show forest plot | 1 | 42 | Risk Ratio (M‐H, Fixed, 95% CI) | 0.33 [0.04, 2.95] |
| 4 Leaving the study early ‐ short term Show forest plot | 1 | 42 | Risk Ratio (M‐H, Fixed, 95% CI) | 0.33 [0.01, 7.74] |
| Outcome or subgroup title | No. of studies | No. of participants | Statistical method | Effect size |
| 1 Tardive dyskinesia: No clinically important improvement (medium term) Show forest plot | 1 | 34 | Risk Ratio (M‐H, Fixed, 95% CI) | 0.24 [0.11, 0.55] |
| 2 Tardive dyskinesia: Not any improvement (medium term) Show forest plot | 1 | 34 | Risk Ratio (IV, Fixed, 95% CI) | 0.06 [0.01, 0.43] |
| 3 Tardive dyskinesia: Average endpoint score (AIMS, high=poor) (medium term) Show forest plot | 1 | 34 | Mean Difference (IV, Fixed, 95% CI) | ‐7.10 [‐9.53, ‐4.67] |
| 4 General mental state: Average endpoint score (BPRS, high=poor) (medium term) Show forest plot | 1 | 34 | Mean Difference (IV, Fixed, 95% CI) | 0.70 [‐3.77, 5.17] |
| 5 Adverse effects: Any adverse effects (TESS, high=poor) (medium term) Show forest plot | 1 | 34 | Mean Difference (IV, Fixed, 95% CI) | ‐0.10 [‐0.53, 0.33] |
| 6 Adverse effects: Parkinsonism ‐ Average endpoint score (RSESE) (medium term) Show forest plot | 1 | 34 | Mean Difference (IV, Fixed, 95% CI) | ‐0.5 [‐1.36, 0.36] |
| 7 Global state: Average endpoint score (CGI, high=poor) (medium term) Show forest plot | 1 | 34 | Mean Difference (IV, Fixed, 95% CI) | ‐1.00 [‐3.78, ‐2.22] |
| Outcome or subgroup title | No. of studies | No. of participants | Statistical method | Effect size |
| 1 Tardive dyskinesia: 1. No clinically important improvement ‐ medium term Show forest plot | 1 | 42 | Risk Ratio (M‐H, Fixed, 95% CI) | 0.53 [0.33, 0.84] |
| 2 Tardive dyskinesia: 2. Not any improvement ‐ medium term Show forest plot | 1 | 42 | Risk Ratio (M‐H, Fixed, 95% CI) | 0.33 [0.15, 0.75] |
| 3 Tardive dyskinesia: 3. Average scale score (AIMS, high=poor) ‐ medium term Show forest plot | 1 | 42 | Mean Difference (IV, Fixed, 95% CI) | 0.0 [‐1.45, 1.45] |
| 4 Leaving the study early ‐ medium term Show forest plot | 1 | 42 | Risk Ratio (M‐H, Fixed, 95% CI) | 0.0 [0.0, 0.0] |
| Outcome or subgroup title | No. of studies | No. of participants | Statistical method | Effect size |
| 1 Tardive dyskinesia: 1. Average endpoint score (ESRS, high=poor) ‐ short term Show forest plot | 1 | 35 | Mean Difference (IV, Fixed, 95% CI) | ‐0.70 [‐4.30, 2.90] |
| 2 Parkinsonism: 1. Average endpoint score (ESRS, high=poor) ‐ short term Show forest plot | 1 | 35 | Mean Difference (IV, Fixed, 95% CI) | 2.5 [‐4.73, 9.73] |
| 3 Leaving the study early ‐ short term Show forest plot | 1 | 40 | Risk Ratio (M‐H, Fixed, 95% CI) | 0.23 [0.03, 1.85] |
| 4 Global state: Average endpoint score (CGI, high=poor) ‐ short term Show forest plot | 1 | 35 | Mean Difference (IV, Fixed, 95% CI) | 0.20 [‐0.35, 0.75] |
| Outcome or subgroup title | No. of studies | No. of participants | Statistical method | Effect size |
| 1 Tardive dyskinesia: 1. No clinically important improvement ‐ medium term Show forest plot | 1 | 46 | Risk Ratio (M‐H, Fixed, 95% CI) | 0.48 [0.29, 0.77] |
| 2 Tardive dyskinesia: 2. Not any improvement ‐ medium term Show forest plot | 1 | 46 | Risk Ratio (M‐H, Fixed, 95% CI) | 0.29 [0.13, 0.66] |
| 3 Tardive dyskinesia: 3. Average scale score (AIMS, high=poor) ‐ medium term Show forest plot | 1 | 46 | Mean Difference (IV, Fixed, 95% CI) | ‐3.90 [‐5.47, ‐2.33] |
| 4 Leaving the study early ‐ medium term Show forest plot | 1 | 46 | Risk Ratio (M‐H, Fixed, 95% CI) | 0.0 [0.0, 0.0] |
| Outcome or subgroup title | No. of studies | No. of participants | Statistical method | Effect size |
| 1 Tardive dyskinesia: 1. No clinically important improvement ‐ medium term Show forest plot | 1 | 92 | Risk Ratio (M‐H, Fixed, 95% CI) | 0.63 [0.46, 0.86] |
| 2 Tardive dyskinesia: 3. Average change score (AIMS, high=poor) ‐ medium term Show forest plot | 1 | 89 | Mean Difference (IV, Fixed, 95% CI) | ‐2.5 [‐2.00, ‐1.00] |
| 3 Adverse events ‐ medium term Show forest plot | 1 | 100 | Risk Ratio (M‐H, Fixed, 95% CI) | 1.50 [0.92, 2.45] |
| 4 Leaving the study early ‐ medium term Show forest plot | 1 | 102 | Risk Ratio (M‐H, Fixed, 95% CI) | 1.0 [0.31, 3.25] |
| Outcome or subgroup title | No. of studies | No. of participants | Statistical method | Effect size |
| 1 Tardive dyskinesia: 2. No clinically important improvement ‐ medium term Show forest plot | 1 | 75 | Risk Ratio (M‐H, Fixed, 95% CI) | 0.82 [0.57, 1.18] |
| 2 Mental state: deterioration ‐ medium term Show forest plot | 1 | 75 | Risk Ratio (M‐H, Fixed, 95% CI) | 0.49 [0.05, 5.14] |
| 3 Adverse events: Parkinsonism ‐ Average change in scale score (ESRS, low=better) ‐ medium term Show forest plot | 1 | 75 | Mean Difference (IV, Fixed, 95% CI) | 0.30 [‐1.17, 1.77] |
| 4 Adverse events: Dystonia ‐ Average change in scale score (ESRS, low=better) ‐ medium term Show forest plot | 1 | 75 | Mean Difference (IV, Fixed, 95% CI) | ‐0.35 [‐0.58, ‐0.12] |
| 5 Adverse events: Akathisia ‐ Average change in scale score (ESRS, low=better) ‐ medium term Show forest plot | 1 | 75 | Mean Difference (IV, Fixed, 95% CI) | ‐0.04 [‐0.30, 0.22] |
| 6 Leaving the study early ‐ medium term Show forest plot | 1 | 84 | Risk Ratio (M‐H, Fixed, 95% CI) | 0.57 [0.27, 1.22] |
| Outcome or subgroup title | No. of studies | No. of participants | Statistical method | Effect size |
| 1 Tardive dyskinesia: 1. No clinically important improvement ‐ medium term Show forest plot | 1 | 16 | Risk Ratio (M‐H, Fixed, 95% CI) | 1.0 [0.69, 1.45] |
| 2 Tardive dyskinesia: 2. Not any improvement ‐ medium term Show forest plot | 1 | 16 | Risk Ratio (M‐H, Fixed, 95% CI) | 0.75 [0.24, 2.33] |
| 3 Tardive dyskinesia: 3. Deterioration ‐ medium term Show forest plot | 1 | 16 | Risk Ratio (M‐H, Fixed, 95% CI) | 1.5 [0.34, 6.70] |
| 4 Tardive dyskinesia: 1. Average change in scale score (AIMS, high=poor) ‐ medium term Show forest plot | 1 | 16 | Mean Difference (IV, Fixed, 95% CI) | ‐0.20 [‐3.10, 2.70] |
| 5 Mental state: 2. Average change in scale score (BPRS, high=poor) ‐ medium term Show forest plot | 1 | 10 | Mean Difference (IV, Fixed, 95% CI) | ‐6.0 [‐15.99, 3.99] |
| 6 Leaving the study early ‐ medium term Show forest plot | 1 | 16 | Risk Ratio (M‐H, Fixed, 95% CI) | 0.0 [0.0, 0.0] |
| Outcome or subgroup title | No. of studies | No. of participants | Statistical method | Effect size |
| 1 Tardive dyskinesia: 1. No clinically important improvement ‐ medium term Show forest plot | 1 | 157 | Risk Ratio (M‐H, Fixed, 95% CI) | 0.88 [0.81, 0.96] |
| 2 Tardive dyskinesia: 2. Not any improvement ‐ medium term Show forest plot | 1 | 157 | Risk Ratio (M‐H, Fixed, 95% CI) | 0.51 [0.41, 0.65] |
| 3 Tardive dyskinesia: 3. Average scale score (AIMS, high=poor) ‐ medium term Show forest plot | 1 | 157 | Mean Difference (IV, Fixed, 95% CI) | ‐2.06 [‐2.94, ‐1.18] |
| 4 Leaving the study early ‐ medium term Show forest plot | 1 | 157 | Risk Ratio (M‐H, Fixed, 95% CI) | 0.25 [0.03, 2.22] |
| 5 Mental state: deterioration ‐ medium term Show forest plot | 1 | 157 | Risk Ratio (M‐H, Fixed, 95% CI) | 0.34 [0.01, 8.16] |
| 6 Mental state: 1. Average endpoint scale score (PANSS total, high=poor) ‐ medium term Show forest plot | 1 | 157 | Mean Difference (IV, Fixed, 95% CI) | ‐3.30 [‐6.51, ‐0.09] |
| 7 Cognitive function: CPT‐37 ‐ proportion correct responses (high=better) ‐ medium term Show forest plot | 1 | 119 | Mean Difference (IV, Fixed, 95% CI) | ‐0.02 [‐0.10, 0.06] |
| Outcome or subgroup title | No. of studies | No. of participants | Statistical method | Effect size |
| 1 Tardive dyskinesia: 1. No clinically important improvement ‐ short term Show forest plot | 1 | 12 | Risk Ratio (M‐H, Fixed, 95% CI) | 1.18 [0.76, 1.83] |
| 2 Tardive dyskinesia: 2. Not any improvement ‐ short term Show forest plot | 1 | 12 | Risk Ratio (M‐H, Fixed, 95% CI) | 0.33 [0.05, 2.37] |
| 3 Tardive dyskinesia: 3. Deterioration ‐ short term Show forest plot | 1 | 10 | Risk Ratio (M‐H, Fixed, 95% CI) | 0.2 [0.01, 3.35] |
| 4 Tardive dyskinesia: 4. Average scale score (AIMS, high=poor) ‐ short term Show forest plot | 1 | 10 | Mean Difference (IV, Fixed, 95% CI) | ‐1.2 [‐4.18, 1.78] |
| 5 Adverse effects ‐ short term Show forest plot | 1 | 12 | Risk Ratio (M‐H, Fixed, 95% CI) | 0.33 [0.02, 6.86] |
| 6 Leaving the study early ‐ short term Show forest plot | 1 | 12 | Risk Ratio (M‐H, Fixed, 95% CI) | 1.0 [0.08, 12.56] |
| Outcome or subgroup title | No. of studies | No. of participants | Statistical method | Effect size |
| 1 Tardive dyskinesia: 1. No clinically important improvement ‐ medium term Show forest plot | 1 | 20 | Risk Ratio (M‐H, Fixed, 95% CI) | 0.52 [0.29, 0.96] |
| 2 Tardive dyskinesia: 2. Not any improvement ‐ medium term Show forest plot | 1 | 20 | Risk Ratio (M‐H, Fixed, 95% CI) | 0.06 [0.00, 0.90] |
| 3 Tardive dyskinesia: 3. Deterioration ‐ medium term Show forest plot | 1 | 20 | Risk Ratio (M‐H, Fixed, 95% CI) | 0.14 [0.01, 2.45] |
| 4 Tardive dyskinesia: 3. Average scale score (AIMS, high=poor) ‐ medium term Show forest plot | 1 | 20 | Mean Difference (IV, Fixed, 95% CI) | ‐6.20 [‐10.53, ‐1.87] |
| 5 Leaving the study early ‐ medium term Show forest plot | 1 | 20 | Risk Ratio (M‐H, Fixed, 95% CI) | 0.0 [0.0, 0.0] |
| Outcome or subgroup title | No. of studies | No. of participants | Statistical method | Effect size |
| 1 Tardive dyskinesia: 1. No clinically important improvement Show forest plot | 2 | 32 | Risk Ratio (M‐H, Fixed, 95% CI) | 0.89 [0.71, 1.12] |
| 1.1 Short term | 1 | 19 | Risk Ratio (M‐H, Fixed, 95% CI) | 1.0 [0.83, 1.21] |
| 1.2 Medium term | 1 | 13 | Risk Ratio (M‐H, Fixed, 95% CI) | 0.74 [0.44, 1.23] |
| 2 Tardive dyskinesia: 2. Not any improvement ‐ short term Show forest plot | 1 | 19 | Risk Ratio (M‐H, Fixed, 95% CI) | 1.11 [0.47, 2.60] |
| 3 Tardive dyskinesia: 3. Deterioration ‐ short term Show forest plot | 1 | 19 | Risk Ratio (M‐H, Fixed, 95% CI) | 0.22 [0.01, 4.05] |
| 4 Tardive dyskinesia: 3. Average scale score (AIMS, high=poor) ‐ medium term Show forest plot | 1 | 13 | Mean Difference (IV, Fixed, 95% CI) | ‐2.38 [‐6.58, 1.82] |
| 5 Adverse effects Show forest plot | 3 | 54 | Risk Ratio (M‐H, Fixed, 95% CI) | 0.0 [0.0, 0.0] |
| 5.1 Short term | 1 | 19 | Risk Ratio (M‐H, Fixed, 95% CI) | 0.0 [0.0, 0.0] |
| 5.2 Medium term | 2 | 35 | Risk Ratio (M‐H, Fixed, 95% CI) | 0.0 [0.0, 0.0] |
| 6 Leaving the study early Show forest plot | 3 | 54 | Risk Ratio (M‐H, Fixed, 95% CI) | 0.0 [0.0, 0.0] |
| 6.1 Short term | 1 | 19 | Risk Ratio (M‐H, Fixed, 95% CI) | 0.0 [0.0, 0.0] |
| 6.2 Medium term | 2 | 35 | Risk Ratio (M‐H, Fixed, 95% CI) | 0.0 [0.0, 0.0] |
| 7 Cognitive function: Average scale score ‐ medium term Show forest plot | 1 | Mean Difference (IV, Fixed, 95% CI) | Subtotals only | |
| 7.1 WAIS | 1 | 76 | Mean Difference (IV, Fixed, 95% CI) | 15.83 [4.61, 27.05] |
| 7.2 WMS | 1 | 76 | Mean Difference (IV, Fixed, 95% CI) | 3.77 [‐8.21, 15.75] |
| 8 Mental state: deterioration ‐ medium term Show forest plot | 1 | 13 | Risk Ratio (M‐H, Fixed, 95% CI) | 0.0 [0.0, 0.0] |
| Outcome or subgroup title | No. of studies | No. of participants | Statistical method | Effect size |
| 1 Tardive dyskinesia: 1. No clinically important improvement ‐ short term Show forest plot | 1 | 11 | Risk Ratio (M‐H, Fixed, 95% CI) | 1.59 [0.79, 3.23] |
| 2 Tardive dyskinesia: 2. Not any improvement ‐ short term Show forest plot | 1 | 11 | Risk Ratio (M‐H, Fixed, 95% CI) | 4.29 [0.25, 72.90] |
| 3 Tardive dyskinesia: 3. Deterioration ‐ short term Show forest plot | 1 | 11 | Risk Ratio (M‐H, Fixed, 95% CI) | 4.29 [0.25, 72.90] |
| 4 Tardive dyskinesia: 3. Average scale score (AIMS, high=poor) ‐ short term Show forest plot | 1 | 11 | Mean Difference (IV, Fixed, 95% CI) | 0.63 [‐5.23, 6.49] |
| 5 Adverse events ‐ short term Show forest plot | 1 | 11 | Risk Ratio (M‐H, Fixed, 95% CI) | 6.0 [0.38, 94.35] |
| 6 Leaving the study early ‐ short term Show forest plot | 1 | 11 | Risk Ratio (M‐H, Fixed, 95% CI) | 2.57 [0.13, 52.12] |
| Outcome or subgroup title | No. of studies | No. of participants | Statistical method | Effect size |
| 1 Tardive dyskinesia: 1. Not any improvement Show forest plot | 2 | 132 | Risk Ratio (M‐H, Fixed, 95% CI) | 0.83 [0.65, 1.07] |
| 1.1 Short term | 1 | 47 | Risk Ratio (M‐H, Fixed, 95% CI) | 0.73 [0.50, 1.06] |
| 1.2 Medium term | 1 | 85 | Risk Ratio (M‐H, Fixed, 95% CI) | 0.90 [0.64, 1.27] |
| 2 Tardive dyskinesia: 2. Deterioration Show forest plot | 2 | 103 | Risk Ratio (M‐H, Fixed, 95% CI) | 0.97 [0.14, 6.80] |
| 2.1 Short term | 1 | 37 | Risk Ratio (M‐H, Fixed, 95% CI) | 2.85 [0.12, 65.74] |
| 2.2 Medium term | 1 | 66 | Risk Ratio (M‐H, Fixed, 95% CI) | 0.33 [0.01, 7.90] |
| 3 Adverse effects Show forest plot | 2 | 122 | Risk Ratio (M‐H, Fixed, 95% CI) | 1.32 [0.74, 2.36] |
| 3.1 Short term | 1 | 37 | Risk Ratio (M‐H, Fixed, 95% CI) | 3.79 [0.47, 30.77] |
| 3.2 Medium term | 1 | 85 | Risk Ratio (M‐H, Fixed, 95% CI) | 1.13 [0.61, 2.07] |
| 4 Leaving the study early ‐ medium term Show forest plot | 1 | 85 | Risk Ratio (M‐H, Fixed, 95% CI) | 1.09 [0.49, 2.40] |
| Outcome or subgroup title | No. of studies | No. of participants | Statistical method | Effect size |
| 1 Tardive dyskinesia: 1. No clinically important improvement ‐ medium term Show forest plot | 1 | 15 | Risk Ratio (M‐H, Fixed, 95% CI) | 0.45 [0.21, 0.94] |
| 2 Tardive dyskinesia: 2. Not any improvement ‐ medium term Show forest plot | 1 | 15 | Risk Ratio (M‐H, Fixed, 95% CI) | 0.18 [0.01, 3.81] |
| 3 Tardive dyskinesia: 3. Deterioration ‐ medium term Show forest plot | 1 | 15 | Risk Ratio (M‐H, Fixed, 95% CI) | 0.18 [0.01, 3.81] |
| 4 Leaving the study early ‐ medium term Show forest plot | 1 | 15 | Risk Ratio (M‐H, Fixed, 95% CI) | 0.0 [0.0, 0.0] |
| 4.1 Short term | 1 | 15 | Risk Ratio (M‐H, Fixed, 95% CI) | 0.0 [0.0, 0.0] |