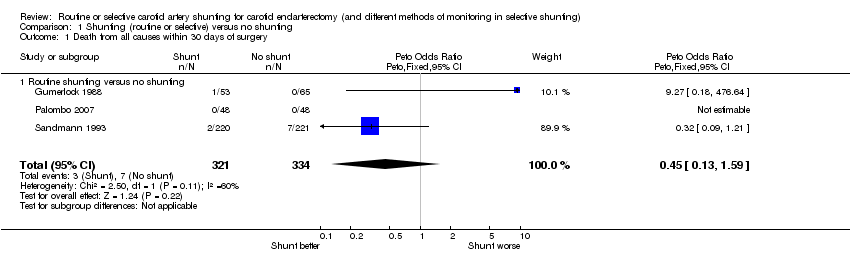
| 1 Death from all causes within 30 days of surgery Show forest plot | 3 | 655 | Peto Odds Ratio (Peto, Fixed, 95% CI) | 0.45 [0.13, 1.59] |
|
| 1.1 Routine shunting versus no shunting | 3 | 655 | Peto Odds Ratio (Peto, Fixed, 95% CI) | 0.45 [0.13, 1.59] |
| 2 Stroke‐related death within 30 days of surgery (best case) Show forest plot | 3 | 655 | Peto Odds Ratio (Peto, Fixed, 95% CI) | 0.13 [0.02, 0.96] |
|
| 2.1 Routine shunting versus no shunting | 3 | 655 | Peto Odds Ratio (Peto, Fixed, 95% CI) | 0.13 [0.02, 0.96] |
| 3 Stroke‐related death within 30 days of surgery (worst case) Show forest plot | 3 | 655 | Peto Odds Ratio (Peto, Fixed, 95% CI) | 0.37 [0.05, 2.62] |
|
| 3.1 Routine shunting versus no shunting | 3 | 655 | Peto Odds Ratio (Peto, Fixed, 95% CI) | 0.37 [0.05, 2.62] |
| 4 Any stroke during surgery (best case) Show forest plot | 3 | 655 | Peto Odds Ratio (Peto, Fixed, 95% CI) | 0.42 [0.16, 1.07] |
|
| 4.1 Routine shunting versus no shunting | 3 | 655 | Peto Odds Ratio (Peto, Fixed, 95% CI) | 0.42 [0.16, 1.07] |
| 5 Any stroke during surgery (worst case) Show forest plot | 3 | 655 | Peto Odds Ratio (Peto, Fixed, 95% CI) | 1.32 [0.52, 3.38] |
|
| 5.1 Routine shunting versus no shunting | 3 | 655 | Peto Odds Ratio (Peto, Fixed, 95% CI) | 1.32 [0.52, 3.38] |
| 6 Any stroke within 24 hours of surgery Show forest plot | 2 | 214 | Peto Odds Ratio (Peto, Fixed, 95% CI) | 0.15 [0.03, 0.78] |
|
| 6.1 Routine shunting versus no shunting | 2 | 214 | Peto Odds Ratio (Peto, Fixed, 95% CI) | 0.15 [0.03, 0.78] |
| 7 Any stroke within 30 days of surgery Show forest plot | 3 | 655 | Peto Odds Ratio (Peto, Fixed, 95% CI) | 0.77 [0.35, 1.69] |
|
| 7.1 Routine shunting versus no shunting | 3 | 655 | Peto Odds Ratio (Peto, Fixed, 95% CI) | 0.77 [0.35, 1.69] |
| 8 Ipsilateral stroke during surgery (best case) Show forest plot | 3 | 737 | Peto Odds Ratio (Peto, Fixed, 95% CI) | 0.42 [0.17, 1.08] |
|
| 8.1 Routine shunting versus no shunting | 3 | 737 | Peto Odds Ratio (Peto, Fixed, 95% CI) | 0.42 [0.17, 1.08] |
| 9 Ipsilateral stroke during surgery (worst case) Show forest plot | 3 | 737 | Peto Odds Ratio (Peto, Fixed, 95% CI) | 1.32 [0.52, 3.37] |
|
| 9.1 Routine shunting versus no shunting | 3 | 737 | Peto Odds Ratio (Peto, Fixed, 95% CI) | 1.32 [0.52, 3.37] |
| 10 Ipsilateral stroke within 30 days of surgery (best case) Show forest plot | 3 | 737 | Peto Odds Ratio (Peto, Fixed, 95% CI) | 0.41 [0.18, 0.97] |
|
| 10.1 Routine shunting versus no shunting | 3 | 737 | Peto Odds Ratio (Peto, Fixed, 95% CI) | 0.41 [0.18, 0.97] |
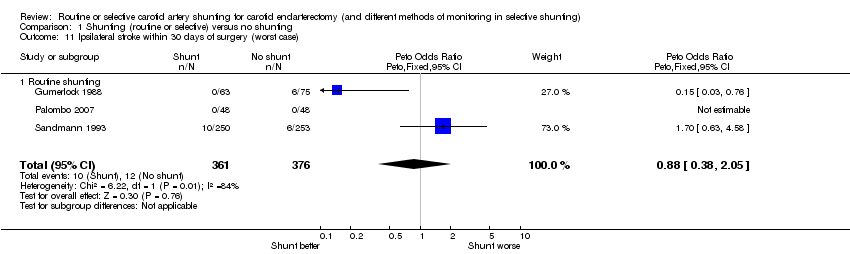
| 11 Ipsilateral stroke within 30 days of surgery (worst case) Show forest plot | 3 | 737 | Peto Odds Ratio (Peto, Fixed, 95% CI) | 0.88 [0.38, 2.05] |
|
| 11.1 Routine shunting | 3 | 737 | Peto Odds Ratio (Peto, Fixed, 95% CI) | 0.88 [0.38, 2.05] |
| 12 Stroke or death within 30 days of surgery (best case) Show forest plot | 3 | 655 | Peto Odds Ratio (Peto, Fixed, 95% CI) | 0.62 [0.31, 1.27] |
|
| 12.1 Routine shunting versus no shunting | 3 | 655 | Peto Odds Ratio (Peto, Fixed, 95% CI) | 0.62 [0.31, 1.27] |
| 13 Stroke or death within 30 days of surgery (worst case) Show forest plot | 3 | 655 | Peto Odds Ratio (Peto, Fixed, 95% CI) | 0.81 [0.40, 1.66] |
|
| 13.1 Routine shunting versus no shunting | 3 | 655 | Peto Odds Ratio (Peto, Fixed, 95% CI) | 0.81 [0.40, 1.66] |
| 14 Haemorrhage from operation site Show forest plot | 2 | 641 | Peto Odds Ratio (Peto, Fixed, 95% CI) | 1.19 [0.07, 19.47] |
|
| 14.1 Routine shunting versus no shunting | 2 | 641 | Peto Odds Ratio (Peto, Fixed, 95% CI) | 1.19 [0.07, 19.47] |
| 15 Infection of operation site Show forest plot | 2 | 641 | Peto Odds Ratio (Peto, Fixed, 95% CI) | 0.16 [0.00, 8.12] |
|
| 15.1 Routine shunting versus no shunting | 2 | 641 | Peto Odds Ratio (Peto, Fixed, 95% CI) | 0.16 [0.00, 8.12] |
| 16 Nerve palsy post‐operatively Show forest plot | 1 | 138 | Peto Odds Ratio (Peto, Fixed, 95% CI) | 1.81 [0.30, 10.82] |
|
| 16.1 Routine shunting versus no shunting | 1 | 138 | Peto Odds Ratio (Peto, Fixed, 95% CI) | 1.81 [0.30, 10.82] |