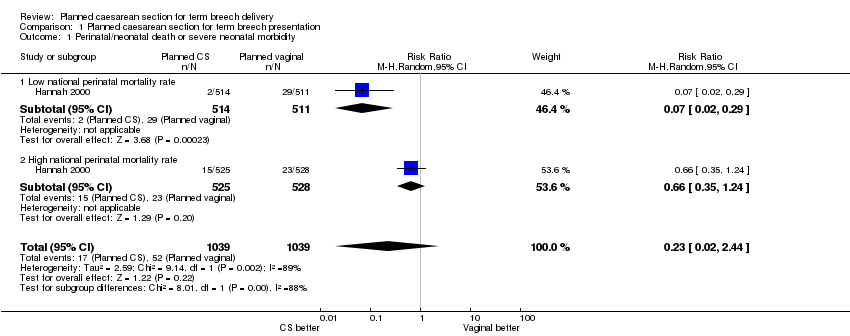
| 1 Perinatal/neonatal death or severe neonatal morbidity Show forest plot | 1 | 2078 | Risk Ratio (M‐H, Random, 95% CI) | 0.23 [0.02, 2.44] |
|
| 1.1 Low national perinatal mortality rate | 1 | 1025 | Risk Ratio (M‐H, Random, 95% CI) | 0.07 [0.02, 0.29] |
| 1.2 High national perinatal mortality rate | 1 | 1053 | Risk Ratio (M‐H, Random, 95% CI) | 0.66 [0.35, 1.24] |
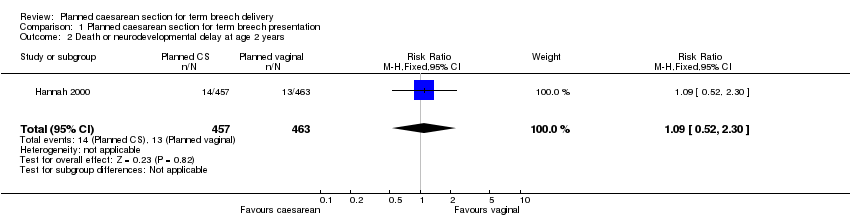
| 2 Death or neurodevelopmental delay at age 2 years Show forest plot | 1 | 920 | Risk Ratio (M‐H, Fixed, 95% CI) | 1.09 [0.52, 2.30] |
|
| 3 Perinatal/neonatal mortality (excluding fatal malformations) Show forest plot | 3 | 2388 | Risk Ratio (M‐H, Fixed, 95% CI) | 0.29 [0.10, 0.86] |
|
| 3.1 Low national perinatal mortality rate | 3 | 1335 | Risk Ratio (M‐H, Fixed, 95% CI) | 0.26 [0.03, 2.00] |
| 3.2 High national perinatal mortality rate | 1 | 1053 | Risk Ratio (M‐H, Fixed, 95% CI) | 0.30 [0.08, 1.09] |
| 4 5 minute Apgar < 7 Show forest plot | 3 | 2375 | Risk Ratio (M‐H, Random, 95% CI) | 0.43 [0.12, 1.47] |
|
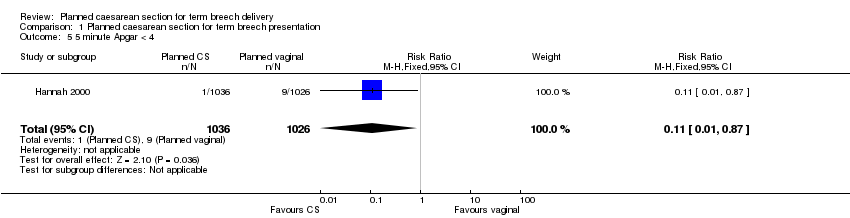
| 5 5 minute Apgar < 4 Show forest plot | 1 | 2062 | Risk Ratio (M‐H, Fixed, 95% CI) | 0.11 [0.01, 0.87] |
|
| 6 Cord blood pH < 7.0 Show forest plot | 1 | 1013 | Risk Ratio (M‐H, Fixed, 95% CI) | 0.15 [0.03, 0.67] |
|
| 7 Cord blood base deficit =/> 15 Show forest plot | 1 | 899 | Risk Ratio (M‐H, Fixed, 95% CI) | 0.30 [0.10, 0.92] |
|
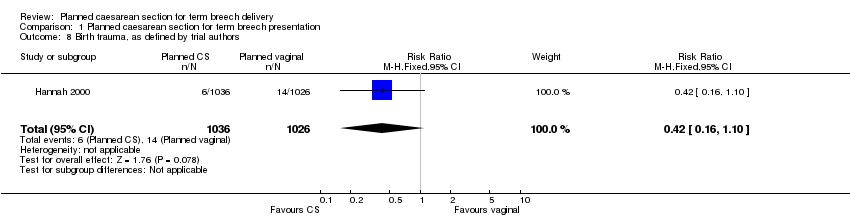
| 8 Birth trauma, as defined by trial authors Show forest plot | 1 | 2062 | Risk Ratio (M‐H, Fixed, 95% CI) | 0.42 [0.16, 1.10] |
|
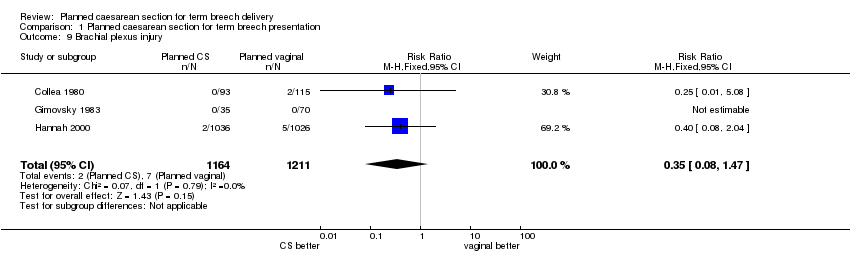
| 9 Brachial plexus injury Show forest plot | 3 | 2375 | Risk Ratio (M‐H, Fixed, 95% CI) | 0.35 [0.08, 1.47] |
|
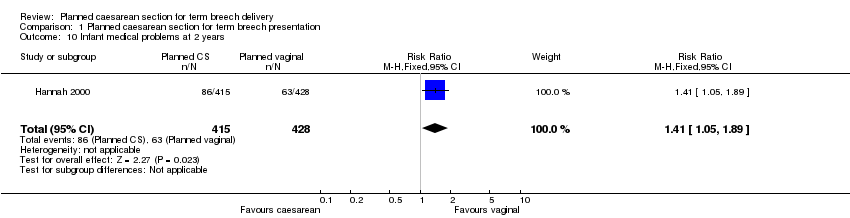
| 10 Infant medical problems at 2 years Show forest plot | 1 | 843 | Risk Ratio (M‐H, Fixed, 95% CI) | 1.41 [1.05, 1.89] |
|
| 11 Neurodevelopmental delay at age 2 years Show forest plot | 1 | 920 | Risk Ratio (M‐H, Fixed, 95% CI) | 1.74 [0.69, 4.37] |
|
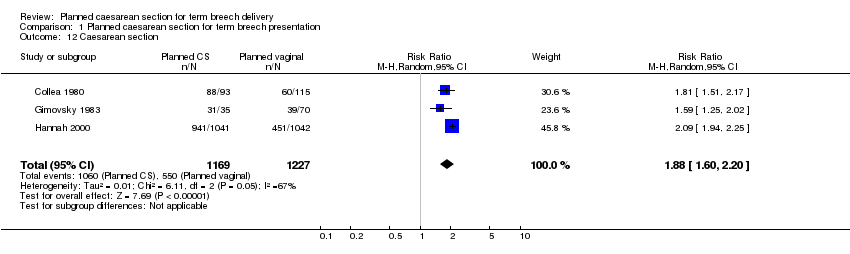
| 12 Caesarean section Show forest plot | 3 | 2396 | Risk Ratio (M‐H, Random, 95% CI) | 1.88 [1.60, 2.20] |
|
| 13 Short‐term maternal morbidity Show forest plot | 3 | 2396 | Risk Ratio (M‐H, Fixed, 95% CI) | 1.29 [1.03, 1.61] |
|
| 14 Woman not satisfied Show forest plot | 1 | 1596 | Risk Ratio (M‐H, Fixed, 95% CI) | 1.0 [0.64, 1.56] |
|
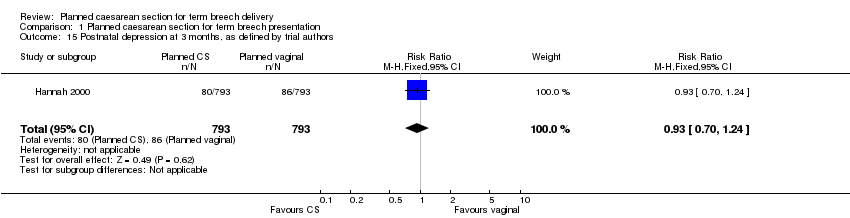
| 15 Postnatal depression at 3 months, as defined by trial authors Show forest plot | 1 | 1586 | Risk Ratio (M‐H, Fixed, 95% CI) | 0.93 [0.70, 1.24] |
|
| 16 Not breastfeeding at 3 months Show forest plot | 1 | 1557 | Risk Ratio (M‐H, Fixed, 95% CI) | 1.04 [0.90, 1.21] |
|
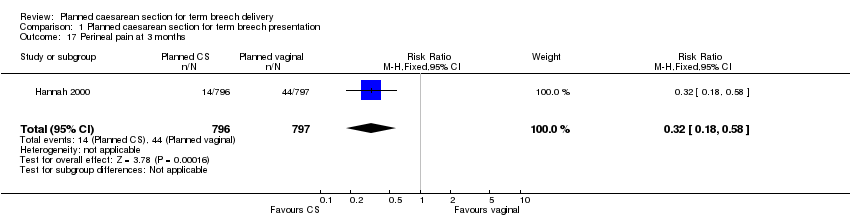
| 17 Perineal pain at 3 months Show forest plot | 1 | 1593 | Risk Ratio (M‐H, Fixed, 95% CI) | 0.32 [0.18, 0.58] |
|
| 18 Abdominal pain at 3 months Show forest plot | 1 | 1593 | Risk Ratio (M‐H, Fixed, 95% CI) | 1.89 [1.29, 2.79] |
|
| 19 Backache after at 3 months Show forest plot | 1 | 1593 | Risk Ratio (M‐H, Fixed, 95% CI) | 0.93 [0.71, 1.22] |
|
| 20 Any pain after at 3 months Show forest plot | 1 | 1593 | Risk Ratio (M‐H, Fixed, 95% CI) | 1.09 [0.93, 1.29] |
|
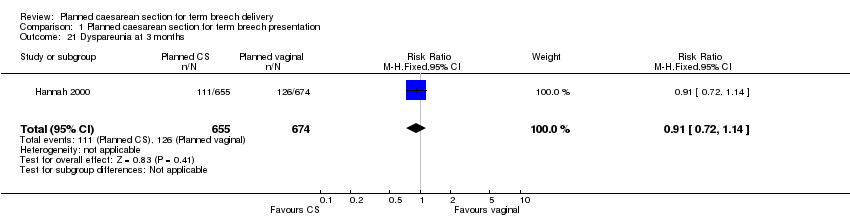
| 21 Dyspareunia at 3 months Show forest plot | 1 | 1329 | Risk Ratio (M‐H, Fixed, 95% CI) | 0.91 [0.72, 1.14] |
|
| 22 Urinary incontinence at 3 months Show forest plot | 1 | 1595 | Risk Ratio (M‐H, Fixed, 95% CI) | 0.62 [0.41, 0.93] |
|
| 23 Flatus incontinence at 3 months Show forest plot | 1 | 1222 | Risk Ratio (M‐H, Fixed, 95% CI) | 1.10 [0.79, 1.53] |
|
| 24 Faecal incontinence at 3 months Show forest plot | 1 | 1226 | Risk Ratio (M‐H, Fixed, 95% CI) | 0.54 [0.18, 1.62] |
|
| 25 Headache at 2 years Show forest plot | 1 | 917 | Risk Ratio (M‐H, Fixed, 95% CI) | 1.05 [0.88, 1.25] |
|
| 26 Perineal pain at 2 years Show forest plot | 1 | 917 | Risk Ratio (M‐H, Fixed, 95% CI) | 0.65 [0.36, 1.15] |
|
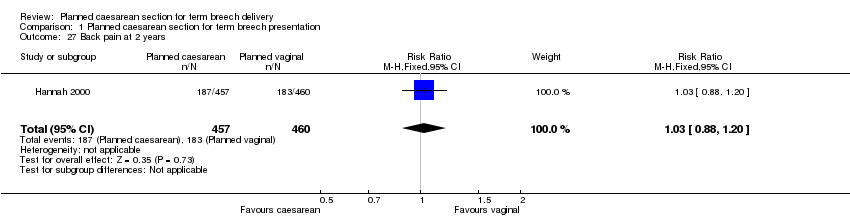
| 27 Back pain at 2 years Show forest plot | 1 | 917 | Risk Ratio (M‐H, Fixed, 95% CI) | 1.03 [0.88, 1.20] |
|
| 28 Sexual problems at 2 years Show forest plot | 1 | 917 | Risk Ratio (M‐H, Fixed, 95% CI) | 0.95 [0.62, 1.48] |
|
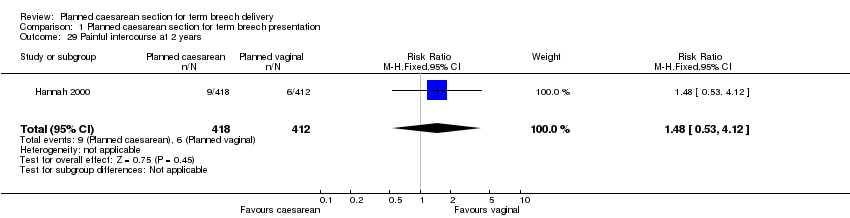
| 29 Painful intercourse at 2 years Show forest plot | 1 | 830 | Risk Ratio (M‐H, Fixed, 95% CI) | 1.48 [0.53, 4.12] |
|
| 30 Urinary incontinence at 2 years Show forest plot | 1 | 917 | Risk Ratio (M‐H, Fixed, 95% CI) | 0.82 [0.63, 1.06] |
|
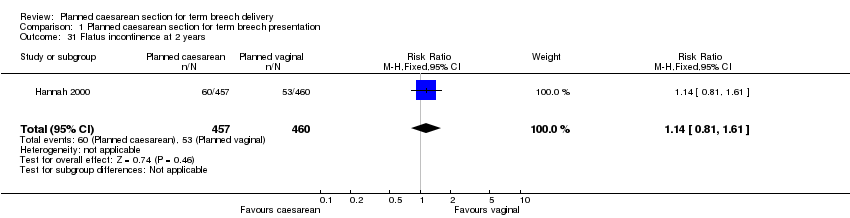
| 31 Flatus incontinence at 2 years Show forest plot | 1 | 917 | Risk Ratio (M‐H, Fixed, 95% CI) | 1.14 [0.81, 1.61] |
|
| 32 Faecal incontinence at 2 years Show forest plot | 1 | 917 | Risk Ratio (M‐H, Fixed, 95% CI) | 1.11 [0.47, 2.58] |
|
| 33 Constipation at 2 years Show forest plot | 1 | 917 | Risk Ratio (M‐H, Fixed, 95% CI) | 1.34 [1.06, 1.70] |
|
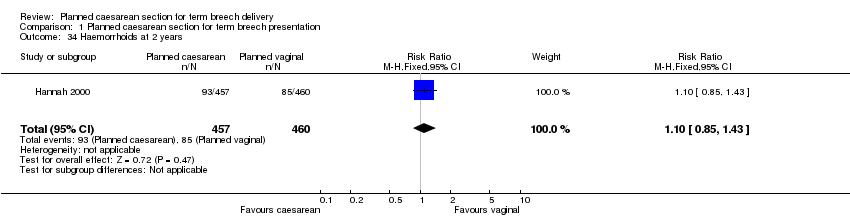
| 34 Haemorrhoids at 2 years Show forest plot | 1 | 917 | Risk Ratio (M‐H, Fixed, 95% CI) | 1.10 [0.85, 1.43] |
|
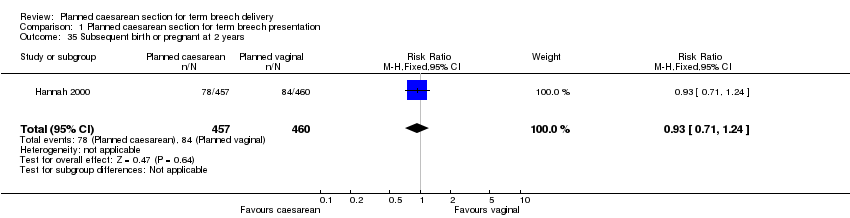
| 35 Subsequent birth or pregnant at 2 years Show forest plot | 1 | 917 | Risk Ratio (M‐H, Fixed, 95% CI) | 0.93 [0.71, 1.24] |
|
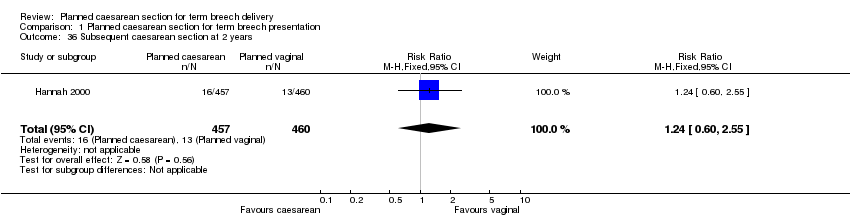
| 36 Subsequent caesarean section at 2 years Show forest plot | 1 | 917 | Risk Ratio (M‐H, Fixed, 95% CI) | 1.24 [0.60, 2.55] |
|
| 37 Painful menstrual periods at 2 years Show forest plot | 1 | 917 | Risk Ratio (M‐H, Fixed, 95% CI) | 0.90 [0.71, 1.15] |
|
| 38 Heavy menstrual periods at 2 years Show forest plot | 1 | 917 | Risk Ratio (M‐H, Fixed, 95% CI) | 1.09 [0.78, 1.52] |
|
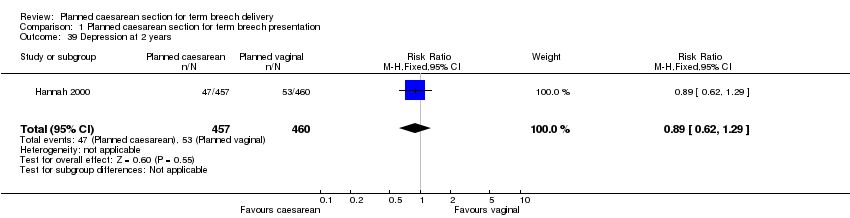
| 39 Depression at 2 years Show forest plot | 1 | 917 | Risk Ratio (M‐H, Fixed, 95% CI) | 0.89 [0.62, 1.29] |
|
| 40 Difficulty caring for child at 2 years Show forest plot | 1 | 873 | Risk Ratio (M‐H, Fixed, 95% CI) | 0.96 [0.72, 1.29] |
|
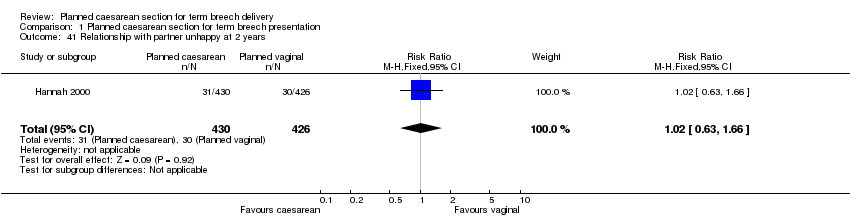
| 41 Relationship with partner unhappy at 2 years Show forest plot | 1 | 856 | Risk Ratio (M‐H, Fixed, 95% CI) | 1.02 [0.63, 1.66] |
|
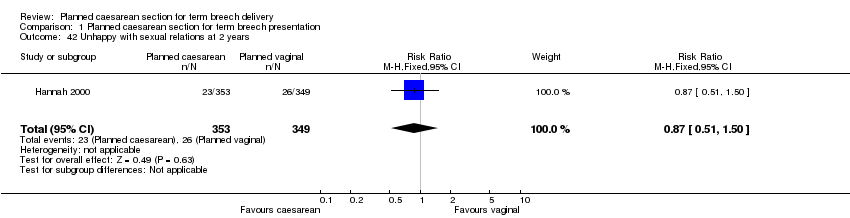
| 42 Unhappy with sexual relations at 2 years Show forest plot | 1 | 702 | Risk Ratio (M‐H, Fixed, 95% CI) | 0.87 [0.51, 1.50] |
|
| 43 Estimated cost of intervention (in Canadian dollars) Show forest plot | 1 | 1027 | Mean Difference (IV, Fixed, 95% CI) | ‐877.0 [‐894.89, ‐859.11] |
|
| 43.1 Low national perinatal mortality rate | 1 | 1027 | Mean Difference (IV, Fixed, 95% CI) | ‐877.0 [‐894.89, ‐859.11] |