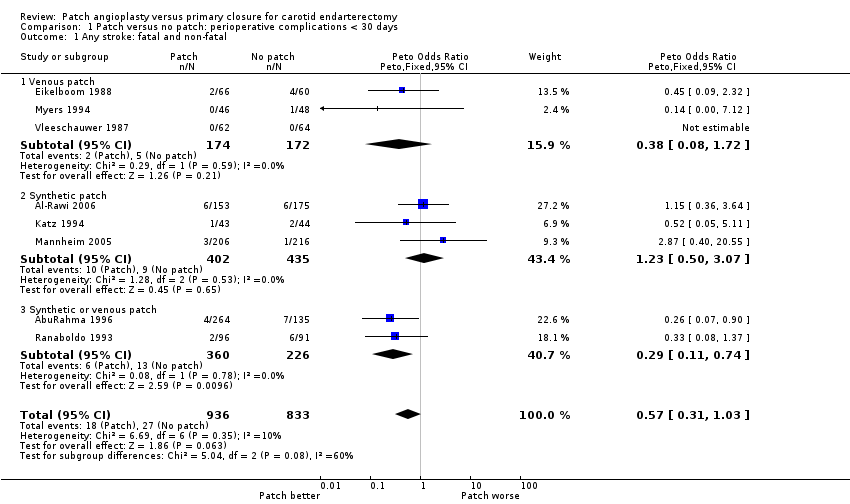
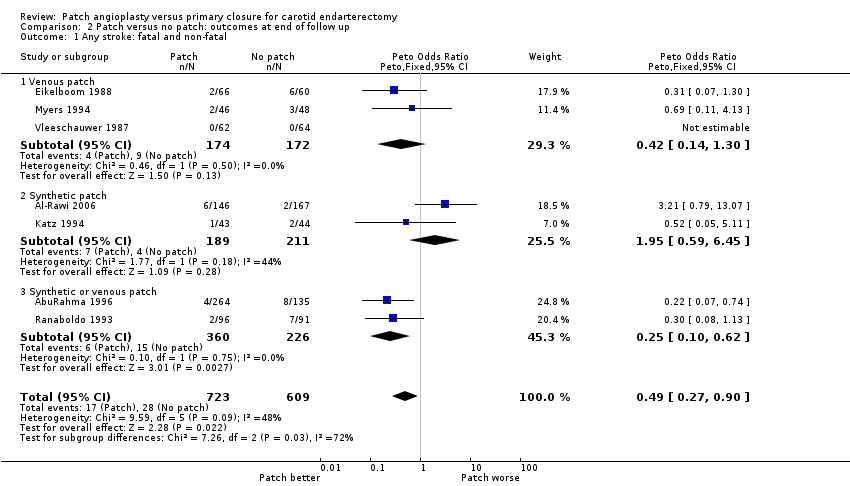
| 1 Any stroke: fatal and non‐fatal Show forest plot | 8 | 1769 | Peto Odds Ratio (Peto, Fixed, 95% CI) | 0.57 [0.31, 1.03] |
|
| 1.1 Venous patch | 3 | 346 | Peto Odds Ratio (Peto, Fixed, 95% CI) | 0.38 [0.08, 1.72] |
| 1.2 Synthetic patch | 3 | 837 | Peto Odds Ratio (Peto, Fixed, 95% CI) | 1.23 [0.50, 3.07] |
| 1.3 Synthetic or venous patch | 2 | 586 | Peto Odds Ratio (Peto, Fixed, 95% CI) | 0.29 [0.11, 0.74] |
| 2 Stroke‐related death Show forest plot | 7 | 1441 | Peto Odds Ratio (Peto, Fixed, 95% CI) | 0.47 [0.05, 4.56] |
|
| 2.1 Venous patch | 3 | 346 | Peto Odds Ratio (Peto, Fixed, 95% CI) | 0.91 [0.06, 14.73] |
| 2.2 Synthetic patch | 2 | 509 | Peto Odds Ratio (Peto, Fixed, 95% CI) | 0.0 [0.0, 0.0] |
| 2.3 Synthetic or venous patch | 2 | 586 | Peto Odds Ratio (Peto, Fixed, 95% CI) | 0.13 [0.00, 6.46] |
| 3 Stroke ipsilateral to endarterectomy site Show forest plot | 7 | 1201 | Peto Odds Ratio (Peto, Fixed, 95% CI) | 0.31 [0.15, 0.63] |
|
| 3.1 Venous patch | 3 | 349 | Peto Odds Ratio (Peto, Fixed, 95% CI) | 0.39 [0.09, 1.75] |
| 3.2 Synthetic patch | 1 | 100 | Peto Odds Ratio (Peto, Fixed, 95% CI) | 0.53 [0.05, 5.19] |
| 3.3 Synthetic or venous patch | 3 | 752 | Peto Odds Ratio (Peto, Fixed, 95% CI) | 0.27 [0.11, 0.62] |
| 4 Death from all causes Show forest plot | 9 | 1869 | Peto Odds Ratio (Peto, Fixed, 95% CI) | 0.62 [0.18, 2.09] |
|
| 4.1 Venous patch | 3 | 346 | Peto Odds Ratio (Peto, Fixed, 95% CI) | 1.79 [0.18, 17.57] |
| 4.2 Synthetic patch | 3 | 837 | Peto Odds Ratio (Peto, Fixed, 95% CI) | 0.14 [0.00, 7.15] |
| 4.3 Synthetic or venous patch | 3 | 686 | Peto Odds Ratio (Peto, Fixed, 95% CI) | 0.48 [0.10, 2.24] |
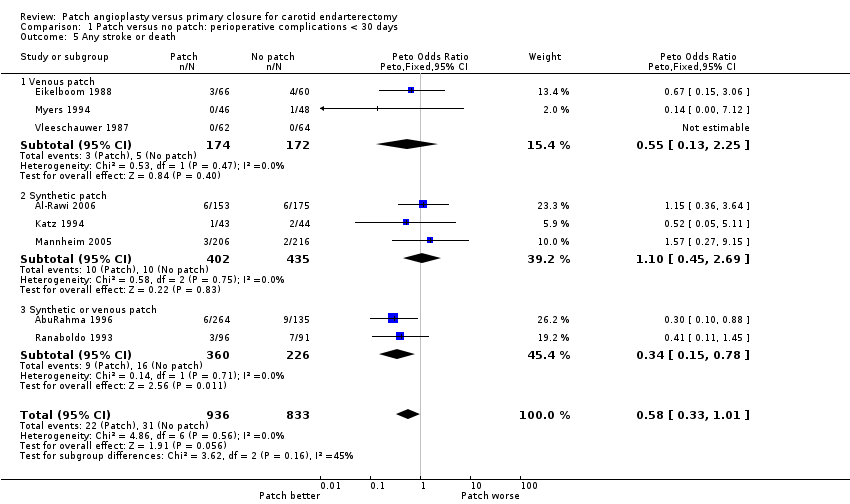
| 5 Any stroke or death Show forest plot | 8 | 1769 | Peto Odds Ratio (Peto, Fixed, 95% CI) | 0.58 [0.33, 1.01] |
|
| 5.1 Venous patch | 3 | 346 | Peto Odds Ratio (Peto, Fixed, 95% CI) | 0.55 [0.13, 2.25] |
| 5.2 Synthetic patch | 3 | 837 | Peto Odds Ratio (Peto, Fixed, 95% CI) | 1.10 [0.45, 2.69] |
| 5.3 Synthetic or venous patch | 2 | 586 | Peto Odds Ratio (Peto, Fixed, 95% CI) | 0.34 [0.15, 0.78] |
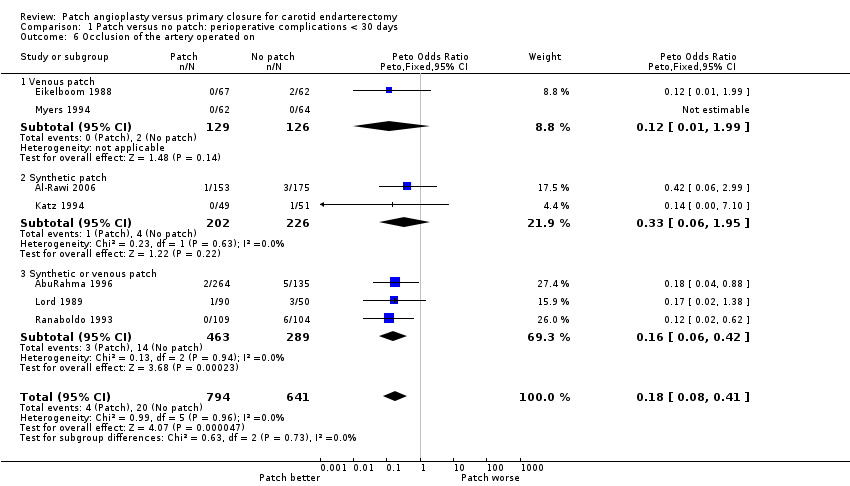
| 6 Occlusion of the artery operated on Show forest plot | 7 | 1435 | Peto Odds Ratio (Peto, Fixed, 95% CI) | 0.18 [0.08, 0.41] |
|
| 6.1 Venous patch | 2 | 255 | Peto Odds Ratio (Peto, Fixed, 95% CI) | 0.12 [0.01, 1.99] |
| 6.2 Synthetic patch | 2 | 428 | Peto Odds Ratio (Peto, Fixed, 95% CI) | 0.33 [0.06, 1.95] |
| 6.3 Synthetic or venous patch | 3 | 752 | Peto Odds Ratio (Peto, Fixed, 95% CI) | 0.16 [0.06, 0.42] |
| 7 Rupture/haemorrhage of endarterectomy site Show forest plot | 9 | 2031 | Peto Odds Ratio (Peto, Fixed, 95% CI) | 1.24 [0.61, 2.54] |
|
| 7.1 Venous patch | 3 | 429 | Peto Odds Ratio (Peto, Fixed, 95% CI) | 6.86 [0.14, 346.63] |
| 7.2 Synthetic patch | 3 | 850 | Peto Odds Ratio (Peto, Fixed, 95% CI) | 0.92 [0.39, 2.14] |
| 7.3 Synthetic or venous patch | 3 | 752 | Peto Odds Ratio (Peto, Fixed, 95% CI) | 2.32 [0.56, 9.57] |
| 8 Infection of the endarterectomy site Show forest plot | 7 | 1563 | Peto Odds Ratio (Peto, Fixed, 95% CI) | 0.38 [0.09, 1.54] |
|
| 8.1 Venous patch | 3 | 429 | Peto Odds Ratio (Peto, Fixed, 95% CI) | 0.0 [0.0, 0.0] |
| 8.2 Synthetic patch | 2 | 522 | Peto Odds Ratio (Peto, Fixed, 95% CI) | 0.38 [0.09, 1.54] |
| 8.3 Synthetic or venous patch | 2 | 612 | Peto Odds Ratio (Peto, Fixed, 95% CI) | 0.0 [0.0, 0.0] |
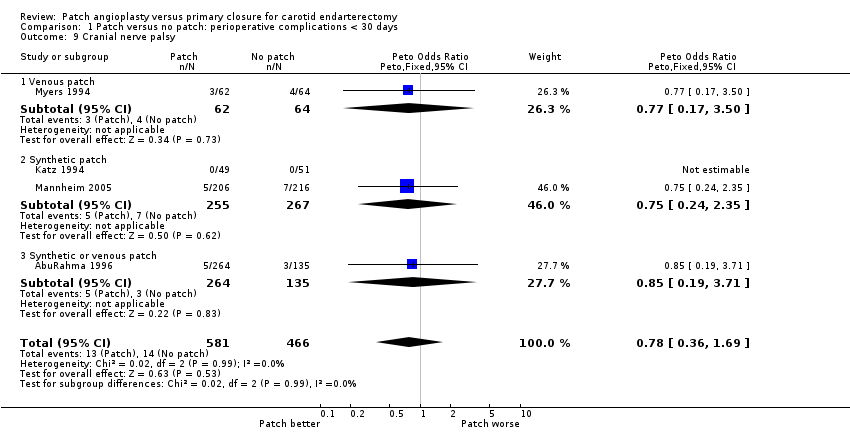
| 9 Cranial nerve palsy Show forest plot | 4 | 1047 | Peto Odds Ratio (Peto, Fixed, 95% CI) | 0.78 [0.36, 1.69] |
|
| 9.1 Venous patch | 1 | 126 | Peto Odds Ratio (Peto, Fixed, 95% CI) | 0.77 [0.17, 3.50] |
| 9.2 Synthetic patch | 2 | 522 | Peto Odds Ratio (Peto, Fixed, 95% CI) | 0.75 [0.24, 2.35] |
| 9.3 Synthetic or venous patch | 1 | 399 | Peto Odds Ratio (Peto, Fixed, 95% CI) | 0.85 [0.19, 3.71] |
| 10 Complication with return to theatre Show forest plot | 7 | 1281 | Peto Odds Ratio (Peto, Fixed, 95% CI) | 0.35 [0.16, 0.79] |
|
| 10.1 Venous patch | 3 | 429 | Peto Odds Ratio (Peto, Fixed, 95% CI) | 0.98 [0.06, 15.64] |
| 10.2 Synthetic patch | 1 | 100 | Peto Odds Ratio (Peto, Fixed, 95% CI) | 0.53 [0.05, 5.19] |
| 10.3 Synthetic or venous patch | 3 | 752 | Peto Odds Ratio (Peto, Fixed, 95% CI) | 0.29 [0.12, 0.73] |