| 1 Dead or dependent at the end of follow‐up | 0 | 0 | Odds Ratio (M‐H, Fixed, 95% CI) | 0.0 [0.0, 0.0] |
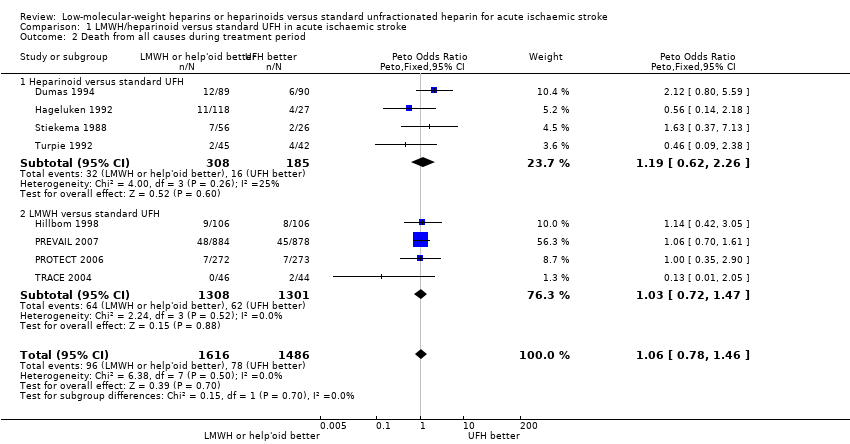
| 2 Death from all causes during treatment period Show forest plot | 8 | 3102 | Peto Odds Ratio (Peto, Fixed, 95% CI) | 1.06 [0.78, 1.46] |
|
| 2.1 Heparinoid versus standard UFH | 4 | 493 | Peto Odds Ratio (Peto, Fixed, 95% CI) | 1.19 [0.62, 2.26] |
| 2.2 LMWH versus standard UFH | 4 | 2609 | Peto Odds Ratio (Peto, Fixed, 95% CI) | 1.03 [0.72, 1.47] |
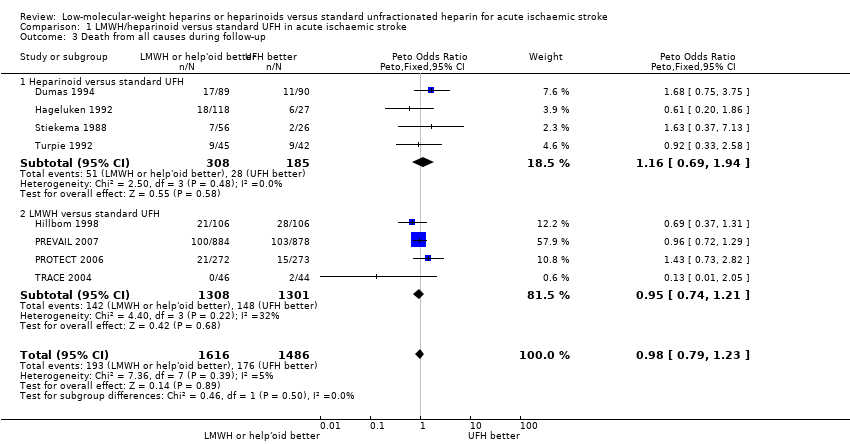
| 3 Death from all causes during follow‐up Show forest plot | 8 | 3102 | Peto Odds Ratio (Peto, Fixed, 95% CI) | 0.98 [0.79, 1.23] |
|
| 3.1 Heparinoid versus standard UFH | 4 | 493 | Peto Odds Ratio (Peto, Fixed, 95% CI) | 1.16 [0.69, 1.94] |
| 3.2 LMWH versus standard UFH | 4 | 2609 | Peto Odds Ratio (Peto, Fixed, 95% CI) | 0.95 [0.74, 1.21] |
| 4 Vascular death during follow‐up Show forest plot | 5 | 1038 | Peto Odds Ratio (Peto, Fixed, 95% CI) | 1.15 [0.72, 1.85] |
|
| 4.1 Heparinoid versus standard UFH | 4 | 493 | Peto Odds Ratio (Peto, Fixed, 95% CI) | 1.15 [0.68, 1.94] |
| 4.2 LMWH versus standard UFH | 1 | 545 | Peto Odds Ratio (Peto, Fixed, 95% CI) | 1.17 [0.39, 3.53] |
| 5 Deep venous thrombosis during treatment period Show forest plot | 7 | 2585 | Peto Odds Ratio (Peto, Fixed, 95% CI) | 0.55 [0.44, 0.70] |
|
| 5.1 Heparinoid versus standard UFH | 4 | 493 | Peto Odds Ratio (Peto, Fixed, 95% CI) | 0.52 [0.31, 0.86] |
| 5.2 LMWH versus standard UFH | 3 | 2092 | Peto Odds Ratio (Peto, Fixed, 95% CI) | 0.56 [0.44, 0.73] |
| 6 Pulmonary embolism during follow‐up Show forest plot | 6 | 1250 | Peto Odds Ratio (Peto, Fixed, 95% CI) | 0.57 [0.23, 1.41] |
|
| 6.1 Heparinoid versus standard UFH | 4 | 493 | Peto Odds Ratio (Peto, Fixed, 95% CI) | 0.64 [0.18, 2.21] |
| 6.2 LMWH versus standard UFH | 2 | 757 | Peto Odds Ratio (Peto, Fixed, 95% CI) | 0.51 [0.13, 1.90] |
| 7 Any intracranial haemorrhage/haemorrhagic transformation of the cerebral infarct during treatment period Show forest plot | 9 | 3137 | Peto Odds Ratio (Peto, Fixed, 95% CI) | 0.75 [0.46, 1.23] |
|
| 7.1 Heparinoid versus standard UFH | 4 | 493 | Peto Odds Ratio (Peto, Fixed, 95% CI) | 1.12 [0.43, 2.94] |
| 7.2 LMWH versus standard UFH | 5 | 2644 | Peto Odds Ratio (Peto, Fixed, 95% CI) | 0.66 [0.37, 1.15] |
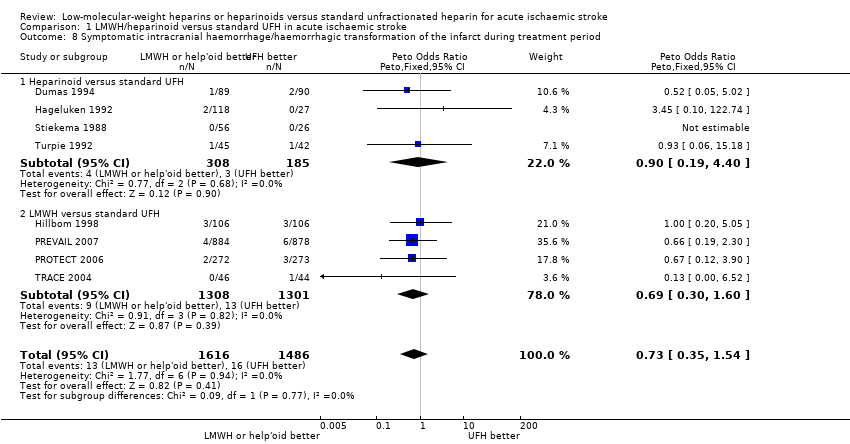
| 8 Symptomatic intracranial haemorrhage/haemorrhagic transformation of the infarct during treatment period Show forest plot | 8 | 3102 | Peto Odds Ratio (Peto, Fixed, 95% CI) | 0.73 [0.35, 1.54] |
|
| 8.1 Heparinoid versus standard UFH | 4 | 493 | Peto Odds Ratio (Peto, Fixed, 95% CI) | 0.90 [0.19, 4.40] |
| 8.2 LMWH versus standard UFH | 4 | 2609 | Peto Odds Ratio (Peto, Fixed, 95% CI) | 0.69 [0.30, 1.60] |
| 9 Extracranial haemorrhage during treatment period Show forest plot | 7 | | Peto Odds Ratio (Peto, Fixed, 95% CI) | Subtotals only |
|
| 9.1 Major extracranial haemorrhage | 7 | 3012 | Peto Odds Ratio (Peto, Fixed, 95% CI) | 3.79 [1.30, 11.06] |
| 9.2 Minor extracranial haemorrhage | 7 | 3012 | Peto Odds Ratio (Peto, Fixed, 95% CI) | 0.91 [0.67, 1.24] |
| 10 Effect of recurrent ischaemic stroke or recurrent stroke of unknown pathological type during treatment period Show forest plot | 2 | 1839 | Peto Odds Ratio (Peto, Fixed, 95% CI) | 1.94 [0.61, 6.11] |
|
| 10.1 LMWH versus UFH | 2 | 1839 | Peto Odds Ratio (Peto, Fixed, 95% CI) | 1.94 [0.61, 6.11] |
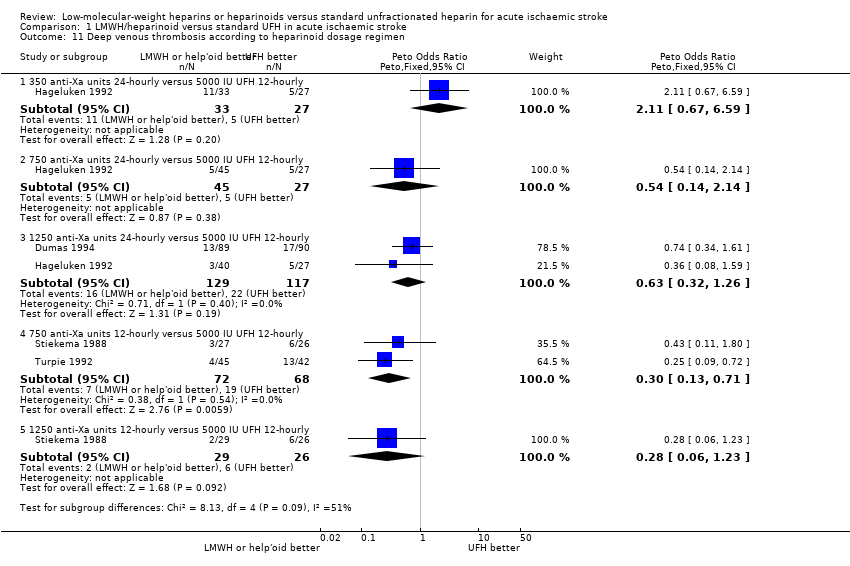
| 11 Deep venous thrombosis according to heparinoid dosage regimen Show forest plot | 4 | | Peto Odds Ratio (Peto, Fixed, 95% CI) | Subtotals only |
|
| 11.1 350 anti‐Xa units 24‐hourly versus 5000 IU UFH 12‐hourly | 1 | 60 | Peto Odds Ratio (Peto, Fixed, 95% CI) | 2.11 [0.67, 6.59] |
| 11.2 750 anti‐Xa units 24‐hourly versus 5000 IU UFH 12‐hourly | 1 | 72 | Peto Odds Ratio (Peto, Fixed, 95% CI) | 0.54 [0.14, 2.14] |
| 11.3 1250 anti‐Xa units 24‐hourly versus 5000 IU UFH 12‐hourly | 2 | 246 | Peto Odds Ratio (Peto, Fixed, 95% CI) | 0.63 [0.32, 1.26] |
| 11.4 750 anti‐Xa units 12‐hourly versus 5000 IU UFH 12‐hourly | 2 | 140 | Peto Odds Ratio (Peto, Fixed, 95% CI) | 0.30 [0.13, 0.71] |
| 11.5 1250 anti‐Xa units 12‐hourly versus 5000 IU UFH 12‐hourly | 1 | 55 | Peto Odds Ratio (Peto, Fixed, 95% CI) | 0.28 [0.06, 1.23] |
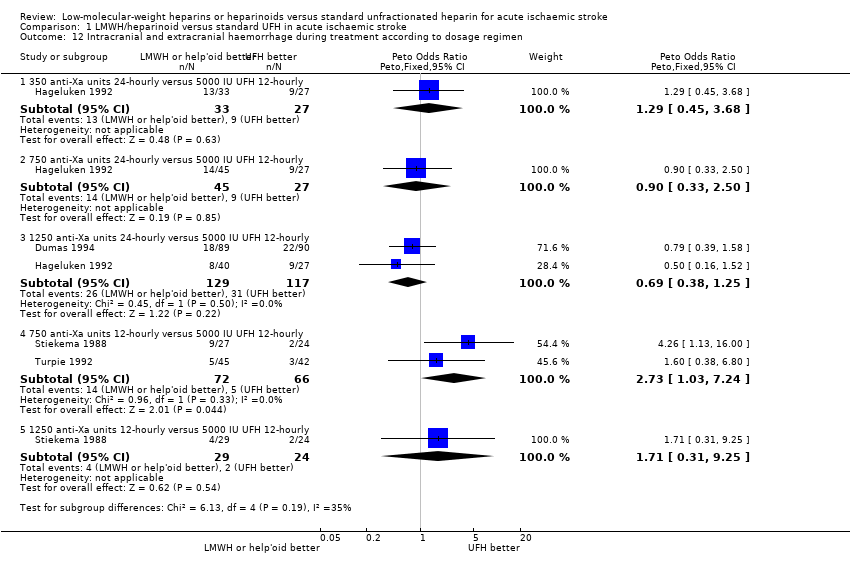
| 12 Intracranial and extracranial haemorrhage during treatment according to dosage regimen Show forest plot | 4 | | Peto Odds Ratio (Peto, Fixed, 95% CI) | Subtotals only |
|
| 12.1 350 anti‐Xa units 24‐hourly versus 5000 IU UFH 12‐hourly | 1 | 60 | Peto Odds Ratio (Peto, Fixed, 95% CI) | 1.29 [0.45, 3.68] |
| 12.2 750 anti‐Xa units 24‐hourly versus 5000 IU UFH 12‐hourly | 1 | 72 | Peto Odds Ratio (Peto, Fixed, 95% CI) | 0.90 [0.33, 2.50] |
| 12.3 1250 anti‐Xa units 24‐hourly versus 5000 IU UFH 12‐hourly | 2 | 246 | Peto Odds Ratio (Peto, Fixed, 95% CI) | 0.69 [0.38, 1.25] |
| 12.4 750 anti‐Xa units 12‐hourly versus 5000 IU UFH 12‐hourly | 2 | 138 | Peto Odds Ratio (Peto, Fixed, 95% CI) | 2.73 [1.03, 7.24] |
| 12.5 1250 anti‐Xa units 12‐hourly versus 5000 IU UFH 12‐hourly | 1 | 53 | Peto Odds Ratio (Peto, Fixed, 95% CI) | 1.71 [0.31, 9.25] |