Zanurzanie w wodzie podczas porodu i narodzin dziecka
Abstract
Background
Water immersion during labour and birth is increasingly popular and is becoming widely accepted across many countries, and particularly in midwifery‐led care settings. However, there are concerns around neonatal water inhalation, increased requirement for admission to neonatal intensive care unit (NICU), maternal and/or neonatal infection, and obstetric anal sphincter injuries (OASIS). This is an update of a review last published in 2011.
Objectives
To assess the effects of water immersion during labour and/or birth (first, second and third stage of labour) on women and their infants.
Search methods
We searched Cochrane Pregnancy and Childbirth’s Trials Register, ClinicalTrials.gov and the WHO International Clinical Trials Registry Platform (ICTRP) (18 July 2017), and reference lists of retrieved trials.
Selection criteria
We included randomised controlled trials (RCTs) comparing water immersion with no immersion, or other non‐pharmacological forms of pain management during labour and/or birth in healthy low‐risk women at term gestation with a singleton fetus. Quasi‐RCTs and cluster‐RCTs were eligible for inclusion but none were identified. Cross‐over trials were not eligible for inclusion.
Data collection and analysis
Two review authors independently assessed trials for inclusion and risk of bias, extracted data and checked them for accuracy. Two review authors assessed the quality of the evidence using the GRADE approach.
Main results
This review includes 15 trials conducted between 1990 and 2015 (3663 women): eight involved water immersion during the first stage of labour; two during the second stage only; four during the first and second stages of labour, and one comparing early versus late immersion during the first stage of labour. No trials evaluated different baths/pools, or third‐stage labour management. All trials were undertaken in a hospital labour ward setting, with a varying degree of medical intervention considered as routine practice. No study was carried out in a midwifery‐led care setting. Most trial authors did not specify the parity of women. Trials were subject to varying degrees of bias: the intervention could not be blinded and there was a lack of information about randomisation, and whether analyses were undertaken by intention‐to‐treat.
Immersion in water versus no immersion (first stage of labour)
There is probably little or no difference in spontaneous vaginal birth between immersion and no immersion (83% versus 82%; risk ratio (RR) 1.01, 95% confidence interval (CI) 0.97 to 1.04; 6 trials; 2559 women; moderate‐quality evidence); instrumental vaginal birth (12% versus 14%; RR 0.86, 95% CI 0.70 to 1.05; 6 trials; 2559 women; low‐quality evidence); and caesarean section (5% versus 4%; RR 1.27, 95% CI 0.91 to 1.79; 7 trials; 2652 women; low‐quality evidence). There is insufficient evidence to determine the effect of immersion on estimated blood loss (mean difference (MD) ‐14.33 mL, 95% CI ‐63.03 to 34.37; 2 trials; 153 women; very low‐quality evidence) and third‐ or fourth‐degree tears (3% versus 3%; RR 1.36, 95% CI 0.85 to 2.18; 4 trials; 2341 women; moderate‐quality evidence). There was a small reduction in the risk of using regional analgesia for women allocated to water immersion from 43% to 39% (RR 0.91, 95% CI 0.83 to 0.99; 5 trials; 2439 women; moderate‐quality evidence). Perinatal deaths were not reported, and there is insufficient evidence to determine the impact on neonatal intensive care unit (NICU) admissions (6% versus 6%; average RR 1.30, 95% CI 0.42 to 3.97; 2 trials; 1511 infants; I² = 36%; low‐quality evidence), or on neonatal infection rates (1% versus 1%; RR 2.00, 95% CI 0.50 to 7.94; 5 trials; 1295 infants; very low‐quality evidence).
Immersion in water versus no immersion (second stage of labour)
There were no clear differences between groups for spontaneous vaginal birth (98% versus 97%; RR 1.02, 95% CI 0.96 to 1.08; 120 women; 1 trial; low‐quality evidence); instrumental vaginal birth (2% versus 2%; RR 1.00, 95% CI 0.06 to 15.62; 1 trial; 120 women; very low‐quality evidence); caesarean section (0% versus 2%; RR 0.33, 95% CI 0.01 to 8.02; 1 trial; 120 women; very low‐quality evidence), and NICU admissions (8% versus 11%; RR 0.78, 95% CI 0.38 to 1.59; 2 trials; 291 women; very low‐quality evidence). Use of regional analgesia was not relevant to the second stage of labour. Third‐ or fourth‐degree tears, and estimated blood loss were not reported in either trial. No trial reported neonatal infection but did report neonatal temperature less than 36.2°C at birth (9% versus 9%; RR 0.98, 95% CI 0.30 to 3.20; 1 trial; 109 infants; very low‐quality evidence), greater than 37.5°C at birth (15% versus 6%; RR 2.62, 95% CI 0.73 to 9.35; 1 trial; 109 infants; very low‐quality evidence), and fever reported in first week (2% versus 5%; RR 0.53, 95% CI 0.10 to 2.82; 1 trial; 171 infants; very low‐quality evidence), with no clear effect between groups being observed. One perinatal death occurred in the immersion group in one trial (RR 3.00, 95% CI 0.12 to 72.20; 1 trial; 120 infants; very low‐quality evidence). The infant was born to a mother with HIV and the cause of death was deemed to be intrauterine infection.
There is no evidence of increased adverse effects to the baby or woman from either the first or second stage of labour.
Only one trial (200 women) compared early and late entry into the water and there were insufficient data to show any clear differences.
Authors' conclusions
In healthy women at low risk of complications there is moderate to low‐quality evidence that water immersion during the first stage of labour probably has little effect on mode of birth or perineal trauma, but may reduce the use of regional analgesia. The evidence for immersion during the second stage of labour is limited and does not show clear differences on maternal or neonatal outcomes intensive care. There is no evidence of increased adverse effects to the fetus/neonate or woman from labouring or giving birth in water. Available evidence is limited by clinical variability and heterogeneity across trials, and no trial has been conducted in a midwifery‐led setting.
PICO
Streszczenie prostym językiem
Zanurzanie w wodzie podczas porodu i narodzin dziecka
Czego dotyczy to zagadnienie?
Celem przeglądu jest ocena wpływu imersji wodnej (poród w wodzie) podczas porodu i/lub narodzin (pierwszy, drugi oraz trzeci etapu porodu) u kobiet i noworodków.
Dlatego jest to takie ważne?
Wiele kobiet decyduje się na urodzenie dziecka w wodzie (imersja wodna). Ta forma porodu staje się coraz bardziej popularna w wielu krajach, szczególnie w oddziałach położniczych. W związku z tym ważne jest, aby lepiej zrozumieć korzyści porodu w wodzie dla kobiet oraz ich nowo narodzonych dzieci, łącznie z idącym za tym ryzykiem.
Ważne jest, aby rozważyć, czy imersja wodna podczas pierwszego i/lub drugiego etapu porodu ma potencjał, aby zmaksymalizować możliwości kobiety do radzenia sobie z bólem porodowym oraz normalnego porodu (siłami natury) bez zwiększenia ryzyka działań niepożądanych. Niepożądane zdarzenia mogą obejmować infekcje u kobiet i/lub noworodków oraz poważne pęknięcie krocza (obszar pomiędzy odbytem a pochwą), co może spowodować trudniejsze oszacowanie utraty krwi w przypadku krwotoku. W ocenie korzyści bierzemy pod uwagę dobre samopoczucie, które obejmuje zarówno zdrowie fizyczne, jak i psychiczne.
Jakie dane znaleźliśmy?
Włączyliśmy 15 badań klinicznych (3663 kobiet). Wszystkie badania polegały na porównaniu imersji wodnej i porodu bez zastosowania tej metody: osiem badań obejmowało pierwszy etap porodu, dwa ‐ drugi etap (poród w wodzie), cztery dotyczyły pierwszego i drugiego etapu porodu oraz jeden porównywał wczesne i późne zanurzenie w wodzie podczas pierwszego etapu porodu. Jakość danych naukowych była od bardzo niskiej do średniej. W żadnych badaniach nie porównywano imersji wodnej z innym postępowaniem przeciwbólowym.
Imersja wodna podczas pierwszego etapu porodu prawdopodobnie skutkuje zmniejszeniem liczby kobiet otrzymujących znieczulenie zewnątrzoponowe, ale raczej nie wpływa lub wpływa w minimalnym stopniu na liczbę kobiet z porodem pochwowym lub instrumentalnym (poród przy użyciu wspomagających narzędzi, takich jak próżnociąg lub kleszcze; przyp. tłum.), cięciem cesarskim lub poważnym pęknięciem krocza. Jesteśmy niepewni co do wpływu imersji wodnej na ilość utraty krwi po porodzie, ponieważ jakość danych naukowych była bardzo niska. Rodzenie w wodzie powoduje także niewielką lub żadną różnicę w odniesieniu do ilości dzieci, u których doszło do rozwoju infekcji lub przyjmowanych do oddziału intensywnej terapii noworodka. Nie odnotowano żadnych martwych urodzeń lub nagłego zgonu niemowlęcia.
W dwóch badaniach porównano imersję wodną podczas drugiego etapu porodu z jej brakiem. Okazało się, że zanurzenie w wodzie może powodować niewielką lub żadną różnicę w liczbie kobiet z normalnym porodem pochwowym. Nie jest pewne, czy imersja wodna ma jakikolwiek wpływ na liczbę porodów instrumentalnych lub cięć cesarskich, liczbę dzieci przyjętych do oddziału intensywnej opieki noworodkowej, temperaturę ciała noworodka oraz wystąpienie gorączki w pierwszym tygodniu życia dziecka, ponieważ jakość danych naukowych okazała się bardzo niska dla wszystkich tych wyników. Ocenę wykonania znieczulenia zewnątrzoponowego nie analizowano w odniesieniu do tego etapu porodu. Nie odnotowano poważnego pęknięcia krocza i utraty krwi po porodzie w żadnym badaniu.
Tylko w jednym badaniu (200 uczestniczek) porównano kobiety, które zanurzyły się w wodzie w różnym czasie porodu (wcześnie i późno). Jednak nie było wystarczających informacji, by wykazać jakiekolwiek wyraźne różnice pomiędzy tymi grupami.
Co to oznacza?
Rodzenie w wodzie może wpłynąć na redukcję liczby kobiet przyjmujących znieczulenie zewnątrzoponowe. Wydaje się, że poród w wodzie nie wpływa na rodzaj porodu lub liczbę kobiet z poważnym pęknięciem krocza. W niniejszym przeglądzie nie znaleziono danych wskazujących na to, że poród w wodzie zwiększa ryzyko niekorzystnych działań u kobiet lub ich nowo narodzonych dzieci. Badania różniły się pod względem jakości dlatego konieczne są dalsze badania, szczególnie takie, które dotyczą porodu w wodzie w warunkach innych niż szpitalne oddziały położnicze zanim będziemy bardziej pewni, co do jego skutków. Potrzebne są również badania dotyczące doświadczeń kobiet i ich opiekunów podczas porodu w wodzie.
Authors' conclusions
Summary of findings
| Immersion in water compared to no immersion during first stage of labour in water during labour and birth | ||||||
| Patient or population: women in labour | ||||||
| Outcomes | Anticipated absolute effects* (95% CI) | Relative effect | № of participants | Quality of the evidence | Comments | |
| Risk with no immersion during first stage of labour | Risk with immersion in water | |||||
| Mode of birth (spontaneous vaginal birth) | Study population | RR 1.01 | 2559 | ⊕⊕⊕⊝ | ||
| 822 per 1000 | 830 per 1000 | |||||
| Mode of birth (instrumental vaginal birth) | Study population | RR 0.86 (0.70 to 1.05) | 2559 (6 RCTs) | ⊕⊕⊝⊝ | ||
| 138 per 1000 | 119 per 1000 (97 to 1.05) | |||||
| Mode of birth (caesarean section) | Study population | RR 1.27 (0.91 to 1.79) | 2652 (7 RCTs) | ⊕⊕⊝⊝ | ||
| 41 per 1000 | 52 per 1000 (38 to 74) | |||||
| Use of analgesia (regional) | Study population | RR 0.91 | 2439 | ⊕⊕⊕⊝ | ||
| 429 per 1000 | 390 per 1000 | |||||
| Perineal trauma (third‐ or fourth‐degree tears) | Study population | RR 1.36 | 2341 | ⊕⊕⊕⊝ | ||
| 25 per 1000 | 33 per 1000 | |||||
| Perinatal death | Study population | ‐ | ‐ | ‐ | No trial reported this outcome. | |
| see comment | see comment | |||||
| Admission to neonatal intensive care unit | Study population | Average RR 1.30 | 1511 | ⊕⊕⊝⊝ | ||
| 58 per 1000 | 75 per 1000 | |||||
| Neonatal infection | Study population | RR 2.00 | 1295 | ⊕⊝⊝⊝ | ||
| 5 per 1000 | 9 per 1000 | |||||
| Estimated blood loss (mL) | The mean estimated blood loss with immersion was 265.5 mL | MD 14.33 mL lower without immersion | ‐ | 153 | ⊕⊝⊝⊝ | |
| *The risk in the intervention group (and its 95% confidence interval) is based on the assumed risk in the comparison group and the relative effect of the intervention (and its 95% CI). | ||||||
| GRADE Working Group grades of evidence | ||||||
| 1 All trials had design limitations: No trial was blinded, two trials did not randomise adequately, and three did not report all outcomes (‐1) 2 Wide confidence intervals that cross the line of no effect (‐1) 3 All trials had design limitations: No trial was blinded, two trials did not randomise adequately, one did not conceal allocation, and three did not report all outcomes (‐1) 4 Both trials have design limitations: Neither trial was blinded, one trial did not randomise adequately, and both did not report all outcomes (‐1) 5 Few events and wide confidence intervals crossing the line of no effect (‐2) 6 Both trials have design limitations: Neither trial was blinded, one trial did not randomise adequately (‐1) 7 Small sample size and wide confidence intervals crossing the line of no effect (‐2) | ||||||
| Immersion in water compared to no immersion during second stage of labour in water during labour and birth | ||||||
| Patient or population: women in labour | ||||||
| Outcomes | Anticipated absolute effects* (95% CI) | Relative effect | № of participants | Quality of the evidence | Comments | |
| Risk with no immersion during second stage of labour | Risk with immersion in water | |||||
| Mode of birth (spontaneous vaginal birth) | Study population | RR 1.02 | 120 | ⊕⊕⊝⊝ | ||
| 967 per 1000 | 986 per 1000 | |||||
| Mode of birth (instrumental vaginal birth) | Study population | RR 1.00 (0.06 to 15.62) | 120 (1 RCT) | ⊕⊝⊝⊝ | ||
| 17 per 1000 | 17 per 1000 (1 to 260) | |||||
| Mode of birth (caesarean section) | Study population | RR 0.33 (0.01 to 8.02) | 120 (1 RCT) | ⊕⊝⊝⊝ | ||
| 17 per 1000 | 6 per 1000 (0 to 134) | |||||
| Use of analgesia (regional) | Study population | ‐ | ‐ | ‐ | This outcome was not reported as it is not applicable to the second stage of labour. | |
| see comment | see comment | |||||
| Perineal trauma (third‐ or fourth‐degree tears) | Study population | ‐ | ‐ | ‐ | No trial reported this outcome | |
| see comment | see comment | |||||
| Perinatal death | Study population | RR 3.00 | 120 | ⊕⊝⊝⊝ | 1 death occurred in the immersion group in this trial. The infant was born alive to a woman with HIV who was treated 2 weeks previous to birth for vaginal infection. The infant died at 2.5 hours after birth. After investigation the cause of death was determined to be intrauterine infection. | |
| 0 per 1000 | 0 per 1000 | |||||
| Admission to neonatal intensive care unit | Study population | RR 0.78 | 291 | ⊕⊝⊝⊝ | ||
| 108 per 1000 | 84 per 1000 | |||||
| Neonatal infection, including markers of infection such as pyrexia and raised white cell count: Neonatal temperature less than 36.2oC at birth | Study population | RR 0.98 | 109 | ⊕⊝⊝⊝ | Number of neonatal infections was not reported, but temperature was included as a marker of infection. | |
| 93 per 1000 | 91 per 1000 | |||||
| Neonatal infection, including markers of infection such as pyrexia and raised white cell count: Neonatal temperature greater than 37.5oC at birth | Study population | RR 2.62 | 109 | ⊕⊝⊝⊝ | Number of neonatal infections was not reported, but temperature was included as a marker of infection. | |
| 56 per 1000 | 146 per 1000 | |||||
| Neonatal infection, including markers of infection such as pyrexia and raised white cell count: Fever reported in first week | Study population | RR 0.53 | 171 | ⊕⊝⊝⊝ | Number of neonatal infections was not reported, but fever was included as a marker of infection. | |
| 45 per 1000 | 24 per 1000 | |||||
| Estimated blood loss (mL) | Study population | ‐ | ‐ | ‐ | No trial reported this outcome | |
| see comment | see comment | |||||
| *The risk in the intervention group (and its 95% confidence interval) is based on the assumed risk in the comparison group and the relative effect of the intervention (and its 95% CI). | ||||||
| GRADE Working Group grades of evidence | ||||||
| 1 Data from one study with design limitations: trial was not blinded, and did not randomise adequately (‐1) 2 Small sample size (‐1) 3 Small sample size, few events, and wide confidence intervals crossing the line of no effect (‐2) 4 Data from one study with design limitations: trial was not blinded, did not report all outcomes, and was at unclear risk of bias in most domains (‐1) | ||||||
Background
This review is one in a series of Cochrane Reviews examining pain management in labour. An earlier version of this review contributed to an overview of systematic reviews of pain management for women in labour (Jones 2012) and shared a generic protocol (Jones 2011).
A history of water immersion
The use of water immersion as a therapeutic medium is not new. Its exact origins are unknown, but there is evidence of immersion in water being used as a treatment for physical and psychological ill health by the Chinese, Egyptians, Japanese and Assyrians, as well as Greeks and Romans (Reid Campion 1990; Reid‐Campion 1997). Warm water immersion during labour, including birth, used for relaxation and pain relief, has a long history in lay and clinical care (Garland 2000). Igor Tjarkovsky, a Russian boat builder, stimulated the foundation of a movement to promote waterbirth in Soviet Russia in the 1970s. He became convinced of the benefits of water immersion as a means of maximising physiological potential. Michel Odent subsequently popularised water immersion in other European countries (Odent 1983). Although considered a fad by some, the use of water during labour and birth appeals to both women and their carers, particularly those striving for a woman‐centred, intervention‐free, 'normal' experience. In 1995, the first international waterbirth conference was held in London, followed by many subsequent study events and international conferences.
In 1993, the use of water immersion during labour gained acceptance as a care option in the UK. A key report into maternity service provision, the Changing Childbirth publication recommended that a pool facility should be an option available to women in all UK maternity units (Department of Health 1993). Professional recognition of the use of water during labour and birth followed in 1994 when both the Royal College of Midwives and the United Kingdom Central Council for Nursing, Midwifery and Health Visiting published position statements, which incorporated water immersion during labour into the role of the midwife (RCM 1994; UKCC 1994). The use of water during labour/birth is now integrated in the UK Nursing and Midwifery Council's Midwifery Rules and Standards (NMC 2012), and clinical guidelines (NICE 2014).
Evidence indicates that labouring and giving birth in water is gaining in popularity internationally (Dahlen 2013; Geissbuehler 2004; Henderson 2014; New Zealand College of Midwives 2017), and is emerging as a means of facilitating women to have a greater sense of control and comfort during childbirth (Maude 2007; Richmond 2003). The buoyancy that labouring in water offers can reduce women’s pain perception (Benfield 2010). The calmer and more in control a woman feels during labour reduces her likelihood of requiring interventions such as labour augmentation, and operative birth.
There is an association between birthing pool use during labour, particularly in midwifery‐led settings (alongside/free‐standing midwifery units) and fewer interventions during labour and birth for healthy pregnant women (Burns 2012). This is important in the context of increasing global concern about escalating caesarean section rates without evidence of a concomitant improvement in perinatal mortality (Gibbons 2010; Johanson 2002; McLachlan 2012; National Childbirth Trust 2011; Sufang 2007), and a national drive in the UK to promote midwifery settings as the optimal place of birth for healthy pregnant women (NICE 2014; RCOG 2011). A seminal national prospective study in the UK also found that healthy women who laboured and gave birth in midwifery settings experienced fewer interventions and fewer complications compared with similar women who planned to give birth in a hospital labour ward (Birthplace Collaboration 2011). Birthing pools are most commonly used in midwifery‐led units. A birthing pool therefore offers midwives an opportunity to develop the skills required to provide woman‐centred care, form a therapeutic rapport with women, facilitate their freedom and participation in decision making, and support them in having choice and control over their care (NMC 2012). Importantly, it may also facilitate them to increase the incidence of normal birth as defined in Normal Birth Consensus Statement (Burns 2012; Maternity Care Working Party 2007).
Description of the condition
This review is about care and management of women during labour and birth. It is one in a series of Cochrane reviews examining pain management in labour.
Labour is understood to be as defined by the woman or clinicians at the time, and includes regular painful uterine contractions, leading to full cervical dilation, expulsion of the fetus, and the placenta and membranes.
Description of the intervention
Throughout this review, 'water immersion' refers to the immersion in water by a pregnant woman during any stage of labour (first, second, third) where the woman's abdomen is completely submerged. 'Waterbirth' refers to where the neonate is born under the water. This implies the use of a receptacle that may be called a pool, tub or bath, and which is larger than a normal domestic bath. The period of immersion by the woman may be for one or more stages of labour, and for any duration. Labour is understood to be as defined by the woman or clinicians at the time, and includes regular painful uterine contractions, leading to full cervical dilation, expulsion of the fetus, and the placenta and membranes.
Water immersion during the first and second stage of labour
Prospective observational studies have shown an association between labouring in water and a greater likelihood of having a spontaneous vaginal birth, especially among nulliparous women (Burns 2012; Geissbuehler 2004; Henderson 2014; Lukasse 2014). Research involving women who laboured in water in midwifery‐led units reported a low intrapartum transfer incidence, particularly from the community setting (Bovbjerg 2016, Burns 2012), and lower when compared with women who did not use water immersion (Lukasse 2014).
The UK is promoting water immersion during labour and waterbirth as a means of empowering women, and is consistent with the initiative to normalise birth and reduce inappropriate use of interventions (RCM 2016), which has been supported in evidence form cohort studies (Bovbjerg 2016; Burns 2012; Lukasse 2014). All maternity units are recommended to have at least one birthing pool, and there is a policy drive to encourage healthy pregnant women to give birth in midwifery‐led settings (for example, alongside midwifery units situated inside the hospital, freestanding midwifery‐led units located in the community), and home birth (NHS 2014; RCOG 2011), consistent with the view that non‐medical settings improve outcomes (Hodnett 2012). It is estimated that at least 60% of pregnant women in the UK are healthy and experience a straightforward pregnancy (Birthplace Collaboration 2011; RCOG 2011), and are therefore eligible to give birth in midwifery‐led settings where a birthing pool use is an established, core care option.
'Normal birth' is a composite outcome defined as a spontaneous labour onset, no epidural, spontaneous vaginal birth with no episiotomy (Maternity Care Working Party 2007), has been identified as a care quality marker (Dodwell 2010). The largest prospective national cohort study showed that this outcome was more likely to occur in a midwifery‐led setting (Birthplace Collaboration 2011); a finding echoed among women who used a birthing pool during labour and planned to give birth in the community (Burns 2012).
It has been suggested that waterbirth may reduce the uptake of pharmacological pain relief and increase the likelihood of an intact perineum (Burke 1995; Burns 2012; Garland 2010; Geissbuehler 2004; Henderson 2014; Otigbah 2000). There may also be increased maternal satisfaction with the birth experience (Hall 1998; Maude 2007). Waterbirth may facilitate healthy pregnant women to have a normal birth, and particularly nulliparous women who plan to give birth in the community setting (Burns 2012). Retrospective analysis suggested that waterbirth might predispose women to a greater risk of sustaining obstetric anal sphincter injury (OASIS) (Cortes 2011). However, a prospective study (N = 2745 women) that investigated risk factors for perineal trauma found no link to indicate that labouring in water might predispose women to have a perineal tear (Smith 2013), and two prospective studies found no evidence identifying waterbirth as a risk factor for OASIS (Burns 2012; Henderson 2014). Although historically concerns were raised that waterbirth may present a risk factor for maternal infection (Hawkins 1995; Rawal 1994; Rosevear 1993), there is no current evidence for this.
Concerns raised for the neonate born under water are fourfold. First, concerns have been raised by several authors (Deans 1995; Johnson 1996; Rosser 1994), for fetal (and hence neonatal) well‐being if a woman becomes pyrexial due to immersion in water warmer than her own natural core temperature. Ensuring pool temperature remains below maternal temperature is often recommended to prevent this. Secondly, it has been suggested that fetal/neonatal infection may occur due to cross‐contamination from the water and pool, and from the woman (Hawkins 1995; Rawal 1994). However, several trials, comparative studies, cohort studies, and audits report no increased risk of infection for the fetus/neonate (Alderdice 1995; Anderson 1996; Eriksson 1997; Otigbah 2000; Robertson 1998; Rush 1996; Zanetti‐Daellenbach 2007). As with all maternity provision, it is incumbent upon practitioners to ensure they have appropriate cleaning protocols for labour and birthing pools, and employ universal precautions. Thirdly, there have been case reports of transient tachypnoea of the newborn (TTN) following waterbirth (Kassim 2005; Mammas 2009; Nguyen 2002; Schroeter 2004; Sotiridou 2012). There is some debate among paediatricians, but no evidence beyond case reports about whether waterbirth predisposes a newborn to a greater risk of TTN than land birth (Carpenter 2012; Pinette 2004). However, neither the largest observational studies for waterbirth (Bovbjerg 2016; Burns 2012; Geissbuehler 2004), the randomised controlled trials that involved waterbirths (Chaichian 2009; Gayiti 2015; Ghasemi 2013; Nikodem 1999; Torkamani 2010; Woodward 2004), or a systematic review (Taylor 2016) have reported cases of TTN. Finally, concerns have been raised about the dangers of umbilical cords at water births (Cro 2002; Gilbert 1999). Cords also snap in land births; there are however, no data for this. Cord snaps associated with waterbirth may be related to undue traction exerted on the cord as the baby is lifted out of the water (Burns 2012).
Third stage of labour
Limited data are available on the third stage of labour management during water immersion. Two prospective cohort studies, one involving a UK sample of women (Burns 2012), and the second, an Italian sample (Henderson 2014), reported on third‐stage management and the incidence of postpartum haemorrhage (PPH) for women who used water immersion during labour and for women who had a waterbirth. Both studies found a low incidence of PPH, and a higher use of physiological third stage (no oxytocic drug injection prior to birth of the placenta) among women who had a waterbirth.
How the intervention might work
The positive physiological effects of hydrotherapy such as buoyancy, hydrostatic pressure, and associated thermal changes, are relevant to women labouring in water, where labour is defined as including the first, second (birth) and third stages. The buoyancy of water enables a woman to move more easily than on land (Edlich 1987). This can facilitate the neuro‐hormonal interactions of labour, alleviating pain, and potentially optimising the progress of labour (Benfield 2010; Ginesi 1998a; Ginesi 1998b). Water immersion may be associated with improved uterine perfusion, less painful contractions, a shorter labour with fewer interventions (Aird 1997; Garland 2000; Geissbuehler 2004; Henderson 2014; Moneta 2001; Otigbah 2000; Thoeni 2005; Zanetti‐Daellenbach 2007). In addition, the ease of mobility that water immersion offers women may optimise fetal position by encouraging flexion (Ohlsson 2001). Where water immersion reduces the use of any pharmacological analgesia, either completely or partly, then the fetus/neonate benefits from not being exposed to the side effects of such drugs.
Hydrotherapy has marked physiological effects on the cardiovascular system (Cefalo 1978). Shoulder‐deep warm water immersion has been shown to reduce blood pressure due to vasodilatation of the peripheral vessels and redistribution of blood flow. It is suggested that water immersion during labour increases maternal satisfaction and sense of control (Hall 1998; Richmond 2003). A woman who feels in control during childbirth experiences greater emotional well‐being postnatally (Green 1998; Green 2007; Maude 2007; Meyer 2012).
Why it is important to do this review
Evidence is growing on the benefits of water immersion during labour for the woman and fetus; and of the potential benefits during waterbirth. However, some controversy remains, particularly around the risk of severe perineal trauma and neonatal well‐being. Importantly, most of the evidence on the use of water immersion during labour and waterbirth is based on observational studies (Burns 2012; Garland 2000; Garland 2006; Geissbuehler 2000; Geissbuehler 2004; Henderson 2014; Lukasse 2014; Ohlsson 2001; Thoeni 2005). Understanding the findings of the randomised controlled trials to date may help to elicit causal relationships and/or greater confidence in results to date. This is particularly important given the current drive to normalise birth and reduce unnecessary intervention during labour and birth. This is an update of a review last published in 2011 (Cluett 2009).
Objectives
To assess the effects of water immersion during labour and/or birth (first, second and third stage of labour) on women and their infants.
Methods
Criteria for considering studies for this review
Types of studies
We included randomised controlled trials (RCTs) that assessed the use of water immersion as a form of pain relief. Quasi‐randomised and cluster‐randomised trials were eligible for inclusion but none were identified. Cross‐over trials were not eligible for inclusion because irrespective of maternal parity, the duration of the first and second stage of labour cannot be predicted with a high level of accuracy between women; a factor which would prevent being able to guarantee equitable cross‐over and therefore data precision.
If trials had included randomised and non‐randomised women and if the randomised data were presented separately, we planned to report this. We have included published, unpublished and ongoing studies with reported data. We included trial reports in abstract form.
Types of participants
Nulliparous or multiparous women in labour at term gestation (as defined by trial authors), with a singleton pregnancy, where the woman and her fetus were healthy, and at low risk of complications.
Types of interventions
The previous version of this review (Cluett 2009) contributed to an overview of systematic reviews of interventions for pain management in labour (Jones 2012), and shared a generic protocol (Jones 2011). To avoid duplication, the different methods of pain management were listed in a specific order, from one to 15. Individual reviews focusing on particular interventions included comparisons with only the intervention above it on the list. The list is as follows.
-
Placebo/no treatment
-
Hypnosis (Madden 2016)
-
Biofeedback (Barragán 2011)
-
Intracutaneous or subcutaneous sterile water injection (Derry 2012)
-
Immersion in water (this review)
-
Aromatherapy (Smith 2011a)
-
Relaxation techniques (yoga, music, audio) (Smith 2011b)
-
Acupuncture or acupressure (Smith 2011c)
-
Manual methods (massage, reflexology) (Smith 2012)
-
Transcutaneous electrical nerve stimulation (TENS) (Dowswell 2009)
-
Inhaled analgesia (Klomp 2012)
-
Opioids (Ullman 2010)
-
Non‐opioid drugs (Othman 2011)
-
Local anaesthetic nerve blocks (Novikova 2011)
-
Epidural (including combined spinal epidural) (Anim‐Somuah 2005; Simmons 2007)
Accordingly, this review includes comparisons of any kind of bath/tub/pool that enabled immersion during any stage of labour, regardless of care setting, compared with: 1. no treatment (no immersion); 2. hypnosis; 3. biofeedback; 4. intracutaneous or subcutaneous sterile water injection; and 5. immersion during a different stage of labour.
However, only trials of immersion versus no immersion have been identified to date.
Types of outcome measures
We chose primary outcomes that we thought would be the most clinically valuable in assessing safety and effectiveness for the woman, fetus/neonate and caregivers. In addition, we identified outcomes that were considered to be of interest from the perspective of the woman and her baby, primary caregivers and related service providers. We also included outcomes to be consistent with the overview of systematic reviews of interventions for pain management in labour (Jones 2012).
We then selected the most pertinent maternal and fetal/neonatal outcomes for water immersion as primary outcomes. These (list below) are analysed within the comparison groups:
-
immersion in water versus no immersion during the first stage of labour;
-
immersion in water versus no immersion during the second stage of labour;
-
immersion in water versus no immersion during any stage of labour;
-
immersion in water versus no immersion during the third stage of labour (no trial reported this comparison);
-
early (cervical dilation less than 5 cm) with late (cervical dilation more than 5 cm) immersion.
Primary outcomes
Maternal
-
Mode of birth (spontaneous vaginal birth, instrumental vaginal birth and caesarean section)
-
Use of analgesia (regional) during any stage of labour
-
Perineal trauma (third‐degree or fourth‐degree tear)
Fetal/Neonatal
-
Perinatal death (still birth, neonatal death)
-
Admission to neonatal intensive care unit
-
Neonatal infection, including markers of infection such as pyrexia and raised white cell count
Secondary outcomes
Maternal
-
Mortality
-
Labour
-
Estimated blood loss
-
Postpartum haemorrhage (> 500 mL)
-
Use of analgesia (general anaesthesia, pharmacological analgesia, or other) during any stage of labour
-
Infection during labour/postnatal period
-
Augmentation of labour (artificial rupture of membranes and/or oxytocin administration)
-
Use of non‐pharmacological analgesia
-
Duration of labour (first, second and third stage)
-
Perineal trauma (none ‐intact, first‐degree tear, second‐degree tear, episiotomy)
-
Pain experience/intensity as presented by authors
-
Temperature (degrees Centigrade) (first and second stage)
-
Pulse and blood pressure (first, second and third stage)
-
Maternal self‐esteem
-
Preference for care in subsequent labour
-
Satisfaction with childbirth experience (as defined by trialists)
-
Satisfaction with pain relief (as defined by trialists)
-
Sense of control in labour (as defined by trialists)
-
Effect (negative) on mother/baby interaction
-
-
Long‐term outcomes
-
Postpartum depression
-
Post‐traumatic stress disorder
-
Fetal/Neonatal outcomes
-
Abnormal heart rate pattern
-
Meconium liquor
-
Apgar score less than seven at five minutes (or as presented by authors)
-
Cord pH immediately after birth (arterial and or venous cord blood)
-
Respiratory support (oxygen/ventilation required)
-
Lung hypoplasia
-
Neurological pathology, e.g. seizures, cerebral palsy
-
Snapped cord
-
Birth injury
-
Breastfeeding (at specified time points)
-
Poor infant outcomes at long‐term follow‐up (as defined by trialists)
Other
-
Cost as defined by trialists
Caregiver outcomes
-
Satisfaction
-
Injuries (any reported physical injury attributed to care of women in water)
Search methods for identification of studies
The following methods section of this review is based on a standard template used by Cochrane Pregnancy and Childbirth.
Electronic searches
For this update, we searched Cochrane Pregnancy and Childbirth’s Trials Register by contacting their Information Specialist (18 July 2017).
The Register is a database containing over 24,000 reports of controlled trials in the field of pregnancy and childbirth. It represents over 30 years of searching. For full current search methods used to populate Pregnancy and Childbirth’s Trials Register including the detailed search strategies for CENTRAL, MEDLINE, Embase and CINAHL; the list of handsearched journals and conference proceedings, and the list of journals reviewed via the current awareness service, please follow this link to the editorial information about the Cochrane Pregnancy and Childbirth in the Cochrane Library and select the ‘Specialized Register ’ section from the options on the left side of the screen.
Briefly, Cochrane Pregnancy and Childbirth’s Trials Register is maintained by their Information Specialist and contains trials identified from:
-
monthly searches of the Cochrane Central Register of Controlled Trials (CENTRAL);
-
weekly searches of MEDLINE (Ovid);
-
weekly searches of Embase (Ovid);
-
monthly searches of CINAHL (EBSCO);
-
handsearches of 30 journals and the proceedings of major conferences;
-
weekly current awareness alerts for a further 44 journals plus monthly BioMed Central email alerts.
Search results are screened by two people and the full text of all relevant trial reports identified through the searching activities described above is reviewed. Based on the intervention described, each trial report is assigned a number that corresponds to a specific Pregnancy and Childbirth review topic (or topics), and is then added to the Register. The Information Specialist searches the Register for each review using this topic number rather than keywords. This results in a more specific search set that has been fully accounted for in the relevant review sections (Included studies; Excluded studies; Ongoing studies).
In addition, we searched ClinicalTrials.gov and the WHO International Clinical Trials Registry Platform (ICTRP) for unpublished, planned and ongoing trial reports (18 July 2017) using the terms given in Appendix 1
Searching other resources
We searched the reference lists of retrieved studies.
We did not apply any language or date restrictions.
Data collection and analysis
For methods used in the previous version of this review, seeCluett 2009.
For this update, we used the following methods for assessing the 14 reports that were identified as a result of the updated search.
The following methods section of this review is based on a standard template used by the Cochrane Pregnancy and Childbirth Review Group.
Selection of studies
Two review authors independently assessed for inclusion all the potential studies identified as a result of the search strategy. We resolved any disagreement through discussion.
Data extraction and management
We designed a form to extract data. For eligible studies, two review authors extracted the data using the agreed form. We resolved discrepancies through discussion. Data were entered into Review Manager software (RevMan 2014) by one review author (EC) and checked for accuracy by a second review author (EB).
When information regarding any of the above was unclear, we endeavoured to contact authors of the original reports to provide further details.
We decided to present the data by stage of labour, first, second and third stage. Where a trial involved immersion in labour during first and second stages, we decided to present data in both subgroups. This was because the key outcomes of interest to practitioners and women are presented in clinical practice as ultimate birth outcome regardless of management strategies adopted.
Assessment of risk of bias in included studies
Two review authors independently assessed risk of bias for each study using the criteria outlined in the Cochrane Handbook for Systematic Reviews of Interventions (Higgins 2011). Any disagreement was resolved by discussion.
(1) Random sequence generation (checking for possible selection bias)
We described for each included study the method used to generate the allocation sequence in sufficient detail to allow an assessment of whether it should produce comparable groups.
We assessed the method as:
-
low risk of bias (any truly random process, e.g. random number table; computer random number generator);
-
high risk of bias (any non‐random process, e.g. odd or even date of birth; hospital or clinic record number); or;
-
unclear risk of bias.
(2) Allocation concealment (checking for possible selection bias)
We described for each included study the method used to conceal allocation to interventions prior to assignment and assessed whether intervention allocation could have been foreseen in advance of, or during recruitment, or changed after assignment.
We assessed the methods as:
-
low risk of bias (e.g. telephone or central randomisation; consecutively numbered sealed opaque envelopes);
-
high risk of bias (open random allocation; unsealed or non‐opaque envelopes, alternation; date of birth);
-
unclear risk of bias.
(3.1) Blinding of participants and personnel (checking for possible performance bias)
Due to the nature of the intervention women, carers' and researchers cannot be blind to group allocation after randomisation and so all studies are considered to be at high risk of bias for this domain.
(3.2) Blinding of outcome assessment (checking for possible detection bias)
No study included in this review reported any blinding of outcome assessment. However most outcomes were recorded by the professional providing data for example method of birth, duration of labour which are routine outcomes, so are unlikely to be biased.
As a consequence we have assessed methods used to blind outcome assessment as:
-
unclear risk of bias.
(4) Incomplete outcome data (checking for possible attrition bias due to the amount, nature and handling of incomplete outcome data)
We described for each included study, and for each outcome or class of outcomes, the completeness of data including attrition and exclusions from the analysis. We stated whether attrition and exclusions were reported and the numbers included in the analysis at each stage (compared with the total randomised participants), reasons for attrition or exclusion where reported, and whether missing data were balanced across groups or were related to outcomes.
We assessed methods as:
-
low risk of bias (e.g. no missing outcome data; missing outcome data balanced across groups, less than 20% loss);
-
high risk of bias (e.g. numbers or reasons for missing data imbalanced across groups; ‘as treated” analysis done with substantial departure of intervention received from that assigned at randomisation);
-
unclear risk of bias.
(5) Selective reporting (checking for reporting bias)
We described for each included study how we investigated the possibility of selective outcome reporting bias and what we found.
We assessed the methods as:
-
low risk of bias (where it is clear that all of the study’s pre‐specified outcomes and all expected outcomes of interest to the review have been reported);
-
high risk of bias (where not all the study’s pre‐specified outcomes have been reported; one or more reported primary outcomes were not pre‐specified; outcomes of interest are reported incompletely and so cannot be used; study fails to include results of a key outcome that would have been expected to have been reported);
-
unclear risk of bias.
(6) Other bias (checking for bias due to problems not covered by (1) to (5) above)
We described for each included study any important concerns we had about other possible sources of bias.
We assessed whether each study was free of other problems that could put it at risk of bias:
-
low risk of other bias;
-
high risk of other bias;
-
unclear whether there is risk of other bias.
(7) Overall risk of bias
We made explicit judgements about whether studies were at high risk of bias, according to the criteria given in the Handbook (Higgins 2011). With reference to (1) to (6) above, we assessed the likely magnitude and direction of the bias and considered the likely impact on the findings.
Assessment of the quality of the evidence using the GRADE approach
For this update, we assessed the quality of the evidence using the GRADE approach as outlined in the GRADE handbook in order to assess the quality of the body of evidence relating to the following outcomes.
-
Mode of birth (spontaneous vaginal birth, instrumental vaginal birth, and caesarean section)
-
Use of analgesia (regional) during any stage of labour
-
Perineal trauma (third‐ or fourth‐degree tear)
-
Perinatal mortality
-
Admission to special care baby unit/neonatal intensive care unit
-
Neonatal infection, including markers of infection such as pyrexia and raised white cell count
-
Estimated blood loss
We assessed the evidence for the main comparisons: immersion in water versus no immersion during first stage of labour; and immersion in water versus no immersion during second stage of labour.
We used the GRADEpro Guideline Development Tool to import data from Review Manager 5.3 (RevMan 2014) in order to create ’Summary of findings’ tables. A summary of the intervention effect and a measure of quality for each of the above outcomes was produced using the GRADE approach. The GRADE approach uses five considerations (study limitations, consistency of effect, imprecision, indirectness and publication bias) to assess the quality of the body of evidence for each outcome. The evidence can be downgraded from 'high quality' by one level for serious (or by two levels for very serious) limitations, depending on assessments for risk of bias, indirectness of evidence, serious inconsistency, imprecision of effect estimates or potential publication bias.
Measures of treatment effect
Dichotomous data
For dichotomous data, we presented results as summary risk ratio with 95% confidence intervals.
Continuous data
We used the mean difference if outcomes were measured in the same way between trials. We planned to use the standardised mean difference to combine trials that measured the same outcome, but used different methods.
Unit of analysis issues
Cluster‐randomised trials
We planned to include cluster‐randomised trials, however none were identified. In future updates, if cluster‐randomised trials are included, we will include cluster‐randomised trials in the analyses along with individually‐randomised trials. We will adjust their sample size using the methods described in Section 16.3.4 of the Handbook (Higgins 2011) using an estimate of the intracluster correlation co‐efficient (ICC) derived from the trial (if possible), from a similar trial or from a study of a similar population. If we use ICCs from other sources, we will report this and conduct sensitivity analyses to investigate the effect of variation in the ICC. If we identify both cluster‐randomised trials and individually‐randomised trials, we plan to synthesise the relevant information. We will consider it reasonable to combine the results from both if there is little heterogeneity between the study designs and the interaction between the effect of intervention and the choice of randomisation unit is considered to be unlikely.
We will also acknowledge heterogeneity in the randomisation unit and perform a sensitivity analysis to investigate the effects of the randomisation unit.
Cross‐over trials would not be a feasible or valid design for this topic and were therefore not eligible for inclusion. No other unit of analysis issues were identified.
Dealing with missing data
We analysed data on all participants with available data in the group to which they were allocated, regardless of whether or not they received the allocated intervention, and irrespective of whether they used additional interventions. If, in the original reports, participants were not analysed in the group to which they were randomised, and there was sufficient information in the trial report, we have attempted to restore them to the correct group.
For included studies we noted levels of attrition.
Where data were not reported for some outcomes or groups, we attempted to contact the study authors.
Assessment of heterogeneity
We assessed statistical heterogeneity in each meta‐analysis using the Tau², I² and Chi² statistics. We regarded heterogeneity as substantial if an I² was greater than 30% and either a Tau² was greater than zero, or there was a low P value (less than 0.10) in the Chi² test for heterogeneity. Had we identified substantial heterogeneity (above 30%), we planned to explore it by pre‐specified subgroup analysis.
Assessment of reporting biases
If there were 10 or more studies in any meta‐analysis, we planned to investigate reporting biases (such as publication bias) using funnel plots. There was a single meta‐analysis with 10 studies. We assessed funnel plot asymmetry visually in this single meta‐analysis.
Data synthesis
We carried out statistical analysis using the Review Manager software (RevMan 2014). We used fixed‐effect meta‐analysis for combining data where it was reasonable to assume that studies were estimating the same underlying treatment effect: i.e. where trials were examining the same intervention, and the trials’ populations and methods were judged sufficiently similar.
If there was clinical heterogeneity sufficient to expect that the underlying treatment effects differed between trials, or if substantial statistical heterogeneity was detected, we used random‐effects meta‐analysis to produce an overall summary, if an average treatment effect across trials was considered clinically meaningful. The random‐effects summary was treated as the average range of possible treatment effects and we discussed the clinical implications of treatment effects differing between trials. If the average treatment effect was not clinically meaningful, we did not combine trials. Where we used random‐effects analyses, we presented the results as the average treatment effect with 95% confidence intervals, and the estimates of Tau² and I².
Subgroup analysis and investigation of heterogeneity
If we had identified substantial heterogeneity, we planned to investigate it using subgroup analyses and sensitivity analyses. We would have considered whether an overall summary was meaningful, and if it was, used a random‐effects analysis to produce it.
For the primary outcomes, where data were available, we planned the following subgroup analyses.
-
Spontaneous labour versus induced labour.
-
Primiparous versus multiparous.
-
Continuous support in labour versus no continuous support.
We were unable to perform any of the planned subgroup analyses due to lack of data relating to subgroups.
In future updates, if subgroup analyses are performed, we will assess subgroup differences by interaction tests available within RevMan (RevMan 2014). We will report the results of subgroup analyses quoting the Chi² statistic and P value, and the interaction test I² value.
Sensitivity analysis
We carried out sensitivity analyses to explore the effect of trial quality assessed by concealment of allocation, high attrition rates, or both. We excluded trials assessed to be at high risk of selection bias (allocation concealment), attrition bias, or both from the analyses in order to assess whether this made any difference to the overall results of the review's primary outcomes.
Results
Description of studies
Results of the search
See: Figure 1
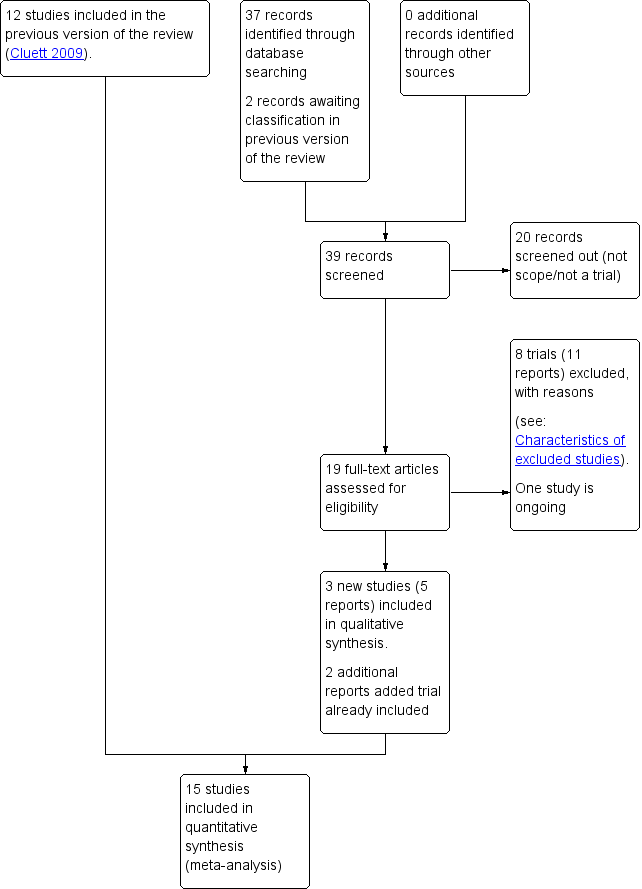
Study flow diagram.
For this update, we retrieved 17 relevant trial reports and we also reassessed the two trial reports (Malarewicz 2005; Torkamani 2010) that were awaiting further classification in the previous version of the review (Cluett 2009). Of these, we included three trials (five reports) (Gayiti 2015; Ghasemi 2013; Torkamani 2010), and added an additional report each to Rush 1996 and Woodward 2004. One trial is ongoing, for which we have requested information on completion (Dabiri 2016), and we excluded eight trials (11 reports). We have now included 15 trials (Cammu 1994; Chaichian 2009; Da Silva 2006; Eckert 2001; Eriksson 1997; Gayiti 2015; Ghasemi 2013; Kuusela 1998; Nikodem 1999; Ohlsson 2001; Rush 1996; Schorn 1993; Taha 2000; Torkamani 2010; Woodward 2004).
Included studies
Design
All included trials are randomised controlled trials (Cammu 1994; Chaichian 2009; Da Silva 2006; Eckert 2001; Eriksson 1997; Gayiti 2015; Ghasemi 2013; Kuusela 1998; Nikodem 1999; Ohlsson 2001; Rush 1996; Schorn 1993; Taha 2000; Torkamani 2010; Woodward 2004).
Sample sizes
Sample size ranged from 33 (Kuusela 1998) to 800 (Rush 1996).
Setting and dates of trials
The trials were conducted across a wide range of countries: Belgium (Cammu 1994), Iran (Chaichian 2009; Ghasemi 2013; Torkamani 2010), Brazil (Da Silva 2006), Australia (Eckert 2001), Sweden (Eriksson 1997; Ohlsson 2001), China (Gayiti 2015), Finland (Kuusela 1998), South Africa (Nikodem 1999; Taha 2000), Canada (Rush 1996), the USA (Schorn 1993), and the UK (Woodward 2004).
All trials were undertaken in a hospital labour ward setting, with varying degree of medical intervention considered as routine practice, for example the use of enemas and shaves (Gayiti 2015), intravenous access and postpartum oxytocin (Ghasemi 2013), other trials did not indicate the underpinning approach to care. In particular, one‐to‐one care in labour is known to affect labour outcomes (Hodnett 2013), and this was clearly documented in only four trials (Cammu 1994; Da Silva 2006; Nikodem 1999; Taha 2000). Where it was stated that normal/routine/standard care was provided, this was understood to mean that the practitioners who normally provided intrapartum care to women in labour in the study centre provided care for the study participants (Da Silva 2006; Eckert 2001; Eriksson 1997; Ghasemi 2013; Nikodem 1999; Rush 1996; Schorn 1993; Woodward 2004). Cammu 1994 indicated that care was supervised by obstetric staff.
Of the trials that reported trial dates, six trials took place between 1990 and 2000 (Eckert 2001 1995 to 1998; Kuusela 1998 1997 to 1998; Nikodem 1999 1999; Ohlsson 2001 1992 to 1995; Rush 1996 1998; Schorn 1993 1990 to 1991), and four took place between 2005 and 2015 (Chaichian 2009 2006 to 2007; Gayiti 2015 2012 to 2013; Ghasemi 2013 2008 to 2009; Torkamani 2010 2006 to 2007).
Participants
Most trial authors did not specify the parity of included women. Three trials only included nulliparous women (Cammu 1994; Da Silva 2006; Gayiti 2015), and one included both multiparous and nulliparous (Woodward 2004).
Interventions and comparisons
Of the 15 trials included in this review, eight related to the first stage of labour only (Cammu 1994; Da Silva 2006; Eckert 2001; Kuusela 1998; Ohlsson 2001; Rush 1996; Schorn 1993; Taha 2000); one related to early versus late immersion in the first stage of labour (Eriksson 1997); four involved immersion during the first and second stages of labour (Chaichian 2009; Gayiti 2015; Torkamani 2010; Woodward 2004); and two involved women in the second stage of labour only (Ghasemi 2013; Nikodem 1999). There were no studies evaluating the use of different types of baths/pools at any stage of labour or the effects of water immersion on the third stage of labour.
Water temperature, which is known to be important in the care of women using water immersion during labour, also differed between trials. Reporting varied across trials, with some using a temperature up to 37ºC (Cammu 1994; Eckert 2001; Gayiti 2015; Kuusela 1998); others up to 38ºC (Da Silva 2006; Eriksson 1997; Taha 2000); and others not stated (Chaichian 2009; Ghasemi 2013; Nikodem 1999; Ohlsson 2001; Schorn 1993; Torkamani 2010; Woodward 2004). Rush 1996 referred to a temperature of 38ºC to 39ºC. Higher temperatures may affect outcomes, but there are no studies comparing outcomes for the use of different water temperatures.
The variation in practices between study centres and data presentation restricted comparison across studies, resulting in the predominance of one study's findings for several variables particularly in relation to the immersion in water during the second stage of labour, and for all of the outcomes for early versus late immersion, which was compared by Eriksson 1997 only.
There were no trials that compared water immersion with other forms of pain relief as described in Types of interventions.
Outcomes
A wide range of data were collected, and there was wide variation regarding specific outcome measures and their presentation. For example, some studies did not consider neonatal well‐being. Apgar scores were reported differently: some used them as continuous data, others as dichotomous. There were also differences in reporting maternal data, for example labour duration was presented as an overall total or only provided for individual stages of labour.
For further details, seeCharacteristics of included studies.
Funding sources
Woodward 2004 was partly funded by Getting Started in Research Grant from Northampton General Hospital NHS Trust. All the remaining trials did not disclose funding sources.
Declarations of interest
One trial (Gayiti 2015) reported that the authors had no conflicts of interest. All the remaining trials did not mention conflicts of interest.
Excluded studies
We excluded 14 studies.
Bastide 1990 was excluded as the description of the intervention was whirlpool bath and was inadequate to confirm if immersion of the pregnant abdomen was possible. We had only unpublished data, and the authors did not provide additional information.
Benfield 2001 was excluded because the intervention was not water immersion, as the water depth was limited as women lay on a raft and the focus was on psychophysical measures of anxiety in early labour only, and it was not an randomised controlled trial (RCT) and had no comparator ‐ it was a pre‐test, post‐test trial.
One pilot study (Calvert 2000), was excluded because its objective was to compare the effect of essential oil of ginger with the essential oil of lemon grass added to a birthing pool, not the water immersion itself.
In two studies by Cluett (Cluett 2001; Cluett 2004), the women were not at low risk of complications as all had been diagnosed as having labour dystocia. These two studies addressed water immersion as a mechanism for addressing dystocia in labour for nullipara.
The trials by Kashanian 2013 and Irion 2011 related to antenatal use of water immersion, and therefore not the intervention being considered in this review.
Labrecque 1999 was excluded because the water group included whirlpool, back massage and ‘liberal mobilisation’ negating the possibility of assessing the effect of water immersion.
We excluded the following studies because they involved inappropriate interventions, using comparisons between women using a shower versus other comparators and therefore they did not immerse in a bath or birthing pool (Henrique 2015; Irion 2011; Khadijeh 2015; Lee 2013).
We excluded Malarewicz 2005 as there was inadequate description of the pool to confirm immersion, and the report only provided data on cervical dilation between two time points, which is a subjective measurement by the caregiver, of a non linear outcome. No data were provided on length of labour which is the outcome used within this review. No other outcome was provided despite direct request to the authors for non published data.
Two studies were excluded as they were not randomised trials (Cai 2005; Zou 2008).
Risk of bias in included studies
See details under Characteristics of included studies, Figure 2; Figure 3.

'Risk of bias' graph: review authors' judgements about each risk of bias item presented as percentages across all included studies.

'Risk of bias' summary: review authors' judgements about each risk of bias item for each included study.
Allocation
We considered random sequence generation to be at low risk of bias for five trials (Da Silva 2006; Eriksson 1997; Rush 1996; Schorn 1993; Woodward 2004) as they used a computer‐generated random number table to generate the random sequence. Three trials were at high risk of bias (Eckert 2001; Nikodem 1999; Taha 2000) because they used blocks for randomisation, with potential for breaking concealment. The remaining seven trials were at unclear risk of bias for random sequence generation because they did not report clearly the method for randomisation.
Similarly for allocation concealment, we judged eight trials to be at low risk of bias as they all reported using sequentially numbered, opaque sealed envelopes (Cammu 1994; Eckert 2001; Eriksson 1997; Nikodem 1999; Ohlsson 2001; Rush 1996; Taha 2000; Woodward 2004). Two were at high risk of bias: Da Silva 2006 only used 'tabs' to cover allocation; and in Schorn 1993, the midwife knew the allocation. The remaining five trials were at unclear risk of bias (Chaichian 2009; Gayiti 2015; Ghasemi 2013; Kuusela 1998; Torkamani 2010) because they did not clearly describe the method for allocation concealment (refer to Figure 2; Figure 3).
Blinding
None of the trials cite any blinding of participants and personnel, and this is likely to be difficult to achieve, as use of water during labour is usually clearly documented in case records, so we have assessed them all as high risk of bias.
As an intervention, it is not possible to blind participants or carers to water immersion. Not all participants and/or carers will be in a state of equipoise between immersion or non‐immersion, that is being equally comfortable and confident about water immersion. This may positively or negatively influence outcomes such as pain perception and hence subsequent analgesia use, maternal satisfaction, self‐esteem and postpartum depression. An example of this is Woodward 2004, which reported that some midwives were apparently not supportive of women using water, suggesting a positive bias within the women, and in this case a negative bias within the midwives. Conversely, Rush 1996 reported practitioners as maintaining an interest in low‐intervention labour practice, suggesting a positive bias towards water immersion. Water immersion, however, is as much a psychological choice as a physical pain‐management strategy, and as such pragmatic clinical trials are assessing the effect of the whole package.
None of the trials cite any blinding of outcome assessment, and while, due to the nature of the intervention which is documented on care records, it is difficult to achieve, it is in theory possible. However, this was not described and so we have assessed all as being at unclear risk of bias.
Incomplete outcome data
We considered compliance with trial allocation to be variable across the trials. We classified eight trials as being at high risk of attrition bias, (Da Silva 2006; Eckert 2001; Eriksson 1997; Ghasemi 2013; Ohlsson 2001; Rush 1996; Torkamani 2010; Woodward 2004), as a known or unknown number of participants did not receive the allocated intervention. Of the trials that involved water immersion in the first stage of labour, Rush 1996 reported that 46% of women allocated to water immersion did not actually enter the water. Woodward 2004 planned a 2:1 ratio allocation to water anticipating that about 50% of women would not use water, but of the 40 allocated to use water, only 24 used the pool. Four (of 58) women in Da Silva 2006 did not receive the water intervention due to medical/obstetric reasons. Another three trials (Eckert 2001; Eriksson 1997; Ohlsson 2001) reported some cross‐over between groups. Analysis of the Torkamani 2010 outcome data in percentages, indicated attrition, as the numbers are not consistent, although this is not explained in the translated trial description available. Ghasemi 2013 data imply attrition of 17 of 100 in the water group and 12 in the traditional care group, but did not provide details. Five studies indicated no attrition (Cammu 1994; Gayiti 2015; Nikodem 1999; Schorn 1993; Taha 2000). Chaichian 2009 and Kuusela 1998 did not provide information on this.
Selective reporting
We judged 10 trials to be at low risk of bias as they appear to have reported all of the data (Cammu 1994; Da Silva 2006; Eckert 2001; Eriksson 1997; Nikodem 1999; Ohlsson 2001; Rush 1996; Schorn 1993; Taha 2000; Woodward 2004). We considered two trials(Chaichian 2009; Torkamani 2010) to be at high risk of bias as it was clear that not all the data were reported; in Torkamani 2010, women who required a caesarean section after apparently consenting and entering the trial were excluded indicating analysis was not by intention‐to‐treat and there were no data on the number of such women in each group. Chaichian 2009 only reported key outcomes, and stated that the rest were not significant. We judged selective reporting bias in three studies as unclear from the available translations (Gayiti 2015; Ghasemi 2013; Kuusela 1998).
Other potential sources of bias
Weclassified all the trials as unclear for other bias as the trials adopted a variety of definitions for water immersion, with different size baths/pools containing different volumes of water. To date, there is no evidence as to whether different degrees of immersion, or the amount of mobility possible within the bath/pool, affect outcomes. Schorn 1993 referred to a tub with a moulded seat, which may restrict mobility and the freedom to adopt different positions while immersed. Likewise, Rush 1996 used a pool where the woman could not change position. Schorn 1993 and Rush 1996 used a whirlpool (hot tub with jets) and the effect of moving water during immersion may be different to the effect of still water. Kuusela 1998 referred to a tub that was 70 cm deep and held 730 litres; Da Silva 2006 indicated tub volume as 194 litres; Eckert 2001 and Eriksson 1997 cite tub depths of 54 cm and 40 cm, respectively. Other trials did not provide a description of the pool used. Differences as to what constitutes water immersion makes comparisons of outcomes across trials difficult.
The duration of immersion in water was very variable. For trials related to the first stage of labour, this ranged from restrictions on length of time in the water of between 30 to 60 minutes (Da Silva 2006; Kuusela 1998, Schorn 1993), to Taha 2000 who indicated women could only be out of the water for a maximum of 30 minutes at any one time during labour. Cammu 1994 and Eckert 2001 specifically indicated there was no restriction, while the other trials did not comment on this.
Women in three trials did not receive the intervention despite being randomised to immersion groups: Rush 1996 reported that 46% of women allocated to water immersion did not enter the water, Woodward 2004 reported that of the 40 allocated to use water, only 24 used the pool, four (of 58) women in Da Silva 2006 did not receive the water intervention due to medical/obstetric reasons. It is not clear if these studies used intention‐to‐treat analysis.
All trials were in hospital‐based settings and had varying degrees of medical models of care, and it was not possible to judge the impact of these on level of bias.
These factors limited comparison across trials and the reliability and validity of the trial findings.
Effects of interventions
See: Summary of findings for the main comparison Immersion in water compared to no immersion during first stage of labour in water during labour and birth; Summary of findings 2 Immersion in water compared to no immersion during second stage of labour in water during labour and birth
This section considers the results from the included trials and overall conclusions.
1. Immersion versus no immersion in the first stage of labour
We included eight trials in this comparison (Cammu 1994; Da Silva 2006; Eckert 2001; Kuusela 1998; Ohlsson 2001; Rush 1996; Schorn 1993; Taha 2000). As indicated above, many outcomes were not defined, defined differently or not reported across all trials. See summary of findings Table for the main comparison.
Primary outcomes
Maternal
Mode of birth (spontaneous birth, assisted vaginal birth and caesarean section)
Seven trials (Cammu 1994; Eckert 2001; Kuusela 1998; Ohlsson 2001; Rush 1996; Taha 2000; Woodward 2004) provided data on mode of birth.
Six trials presenting data on spontaneous vaginal birth rate did not find any clear difference between the groups (risk ratio (RR) 1.01, 95% confidence interval (CI) 0.97 to 1.04; 2559 women; 6 trials; moderate‐quality evidence; Analysis 1.1). There is no clear effect on instrumental vaginal births (RR 0.86, 95% CI 0.70 to 1.05; 2559 women; 6 trials; low‐quality evidence; Analysis 1.2), or caesarean sections (RR 1.27, 95% CI 0.91 to 1.79; 2652 women; 7 trials; low‐quality evidence; Analysis 1.3).
Use of analgesia (regional) during any stage of labour
Five trials (Cammu 1994; Eckert 2001; Kuusela 1998; Ohlsson 2001; Rush 1996) provided data on epidural/spinal analgesia/anaesthesia use and there was a reduction in the incidence of epidural/spinal/paracervical analgesia/anaesthesia amongst women allocated to immersion in water during the first stage of labour compared to controls (RR 0.91, 95% CI 0.83 to 0.99; 2439 women; 5 trials; moderate‐quality evidence, Analysis 1.4). Of these trials, Rush 1996 reported women were allocated to water immersion but did not use water; 183 (46%) of the water group did not immerse, but none of the control group immersed.
Perineal trauma (third‐degree and fourth‐degree perineal tears)
Four trials (Eckert 2001; Ohlsson 2001; Rush 1996; Taha 2000) reported on third‐ and fourth‐degree tears, and it is unclear whether there is a difference in the risk of tears in the groups (RR 1.36, 95% CI 0.85 to 2.18; 2341 women; 4 trials; moderate‐quality evidence, Analysis 1.5).
Perinatal mortality
No trial investigating water immersion during the first stage of labour reported any incidence of perinatal mortality. Considering the importance of this outcome, particularly in relation to water immersion, it is highly likely that this can be interpreted as no cases of mortality, rather than a failure to report the outcomes.
Admission to neonatal intensive care unit
Two trials (Eckert 2001; Ohlsson 2001) reported admissions to the neonatal intensive care unit. There was no clear difference between groups for this outcome (average RR 1.30, 95% CI 0.42 to 3.97, low‐quality evidence, Analysis 1.6). There was some heterogeneity between these studies and the results should be interpreted with caution (heterogeneity: I² = 36%; Tau² = 0.36; Chi² test for heterogeneity (P = 0.21)).
Neonatal infection, including markers of infection such as pyrexia and raised white cell count
Five trials (Cammu 1994; Eckert 2001; Kuusela 1998; Rush 1996; Schorn 1993) reported infection rates and did not find any clear difference between the groups (RR 2.00, 95% CI 0.50 to 7.94, 1295 infants; very low‐quality evidence, Analysis 1.7). Furthermore, both the groups reported few infection rates. Three trials (Cammu 1994; Kuusela 1998; Schorn 1993) reported no infections in either group, which is expected in trials with small sample sizes involving low‐risk women. One trial (Eckert 2001) reported temperature greater than 37.8°C as an indicator of infection but did not find any clear difference between the groups (RR 1.00, 95% CI 0.06 to 15.83, Analysis 1.8).
Sensitivity analysis
Removing Eckert 2001, Ohlsson 2001, Rush 1996, and Schorn 1993 as per review methodology, widened confidence intervals but did not alter overall results for modes of birth, use of regional analgesia, and perineal trauma (third‐ or fourth‐degree tears). For use of analgesia (regional), removing Eckert 2001, Ohlsson 2001, and Rush 1996 removed the favourable immersion results leaving no clear difference between groups. Only Eckert 2001 and Ohlsson 2001 contributed data to admission to neonatal intensive care unit so a sensitivity analysis was not attempted. Eckert 2001 and Rush 1996 were the only trials that contributed events to neonatal infection.
Secondary outcomes
Maternal
The following outcomes were not reported in any of the included studies: maternal mortality; post‐traumatic stress disorder; temperature; satisfaction with childbirth experience; maternal self‐esteem; satisfaction with pain relief; sense of control in labour; and effect on mother/baby interaction.
Mortality
No trial reported any maternal mortality. Given the magnitude of a maternal death, it is reasonable to assume this was because there was none.
Estimated blood loss during labour (first, second, third stage, and immediate postnatal period)
Two trials (Kuusela 1998; Taha 2000) reported on the mean blood loss (mL) in each group but did not find any clear difference between the groups (mean difference (MD) (MD ‐14.33, 95% CI ‐63.03 to 34.37; 153 women; 2 trials; very low‐quality evidence, Analysis 1.9).
Postpartum haemorrhage
One trial (Eckert 2001) reported on the postpartum haemorrhage rate in each group. There was no clear difference between the groups (RR 1.58, 95% CI 0.80 to 3.13; 274 women, Analysis 1.10). Eckert 2001 did not define postpartum haemorrhage so this outcome is unclear.
Use of analgesia (general anaesthesia, or pharmacological analgesia) during any stage of labour
Narcotic/pethidine use was reported by three trials (Eckert 2001; Rush 1996; Taha 2000) and there was no clear difference between the groups (average RR 1.08, 95% CI 0.59 to 1.96; 1180 women; 3 trials; I² = 37%; Analysis 1.11). However, heterogeneity was detected (heterogeneity: I² = 37%, Tau² = 0.12, Chi² test for heterogeneity P = 0.20); and so we used a random‐effects analysis. Consideration of those trials (Eckert 2001; Schorn 1993; Taha 2000) that reported 'any analgesia', also did not find any clear difference between the groups (RR 0.99, 95% CI 0.88 to 1.12, 3 trials; 487 women; Analysis 1.12). Two trials reported on 'any pharmacological analgesia' (Eckert 2001; Taha 2000) also did not find any clear difference between the groups (RR 1.05, 95% CI 0.80 to 1.39, 394 women; Analysis 1.13). Due to the lack of definitions of what was classified by authors for pharmacological analgesia, it was not possible to combine these various outcomes.
Maternal infection during labour/postnatal period (perineal, systemic, uterine or increase in temperature)
The incidence of maternal infection reported by five trials (Cammu 1994; Eckert 2001; Kuusela 1998; Rush 1996; Schorn 1993) did not find any clear difference between the groups (RR 0.99, 95% CI 0.50 to 1.96, 1295 women, Analysis 1.14).
Augmentation of labour (artificial rupture of membranes and/or oxytocin infusion administration)
There has been some concern that water immersion may slow labour, therefore we analysed data on augmentation: three trials (Da Silva 2006; Kuusela 1998; Rush 1996) that reported on the incidence of amniotomy did not find any clear difference between the groups (RR 1.02, 95% CI 0.90 to 1.16, 3 trials, 926 women, Analysis 1.15). Pooled analysis from four trials (Da Silva 2006; Kuusela 1998; Rush 1996; Schorn 1993) found no clear difference in the use of oxytocin infusion (RR 0.91, 95% CI 0.72 to 1.15, 4 trials, 1019 women, Analysis 1.16).
Use of non‐pharmacological analgesia
One trial (Rush 1996) provided data on the use of transcutaneous nerve stimulation (TENS) and found no clear difference between groups (RR 1.25, 95% CI 0.34 to 4.61; 785 women, Analysis 1.17).
Duration of labour (first, second and third stage) (minutes)
Five trials (Cammu 1994; Eckert 2001; Kuusela 1998; Rush 1996; Schorn 1993) provided data on duration of the first stage of labour. They showed no clear difference between the groups (MD ‐11.53, 95% CI ‐45.42 to 22.36; 1295 women, Analysis 1.18).
Six trials (Cammu 1994; Da Silva 2006; Eckert 2001; Kuusela 1998; Rush 1996; Schorn 1993) reported on the duration of the second stage of labour, which showed no clear difference between the groups (MD 1.12, 95% CI ‐5.23 to 7.48; random‐effects; 1403 women; I² = 38%, Analysis 1.19). There was evidence of heterogeneity for this outcome (heterogeneity: Tau² = 18.67; Chi² test for heterogeneity P = 0.17; I² = 38%).
Two trials (Eckert 2001; Rush 1996) reported on the duration of the third stage of labour (MD 0.25, 95% CI ‐1.10 to 1.60; 1059 women, Analysis 1.20). One trial (Taha 2000) that provided only the duration of total labour did not find any clear difference between the groups (MD ‐27.50, 95% CI ‐133.05 to 78.05; 120 women, Analysis 1.21).
Perineal trauma (none/intact, first degree, second degree, episiotomy)
Four trial reported these outcomes (Da Silva 2006; Eckert 2001; Rush 1996; Taha 2000). Slightly more women in the immersion group had an intact perineum following the birth than in the no immersion group (RR 1.17, 95% CI 1.01 to 1.37; 1277 women; Analysis 1.22). There was no clear differences between the numbers of women with second‐degree tears (RR 0.94, 95% CI 0.74 to 1.20; 1212 women; Analysis 1.23) or women with episiotomies (RR 0.94, 95% CI 0.80 to 1.09; 1212 women; Analysis 1.24).
Pain experience/intensity as presented by the authors
Three trials (Da Silva 2006; Kuusela 1998; Taha 2000) reported on pain. Two trials (Da Silva 2006: Kuusela 1998) reported mean visual analogue pain scores (VAS) at the start of assessment and then up to 60 minutes later. At the start of assessment there was no apparent difference between groups (two trials; 72/69, MD 0.15, 95% CI ‐0.79 to 1.08; random‐effects) (heterogeneity: Tau² = 0.26, Chi² = 2.07, df = 1, (P = 0.15); I² = 52%, Analysis 1.25) with the trials reporting effects in opposite directions. Moreover, a considerable amount of heterogeneity was detected among studies reporting pain scores at the start of the assessment. There was, however, evidence to suggest that women in the immersion group experienced less pain when assessed up to an hour later compared to the women in the no immersion group (two trials; 72/69, MD ‐0.81, 95% CI ‐1.34 to ‐0.28, Analysis 1.25).
One trial (Taha 2000) assessed pain using three ordinal scales: pain reported on a VAS scale, where 1 is no pain and 10 is worst pain imaginable; feelings indicated by means of faces on a scale of 0 to 5; description in words the pain experienced, from no pain at all to unbearable pain. They did not use the McGill Pain Questionnaire. The data were reported at six different time points (before randomisation and then 30 minutes, one hour, two hours, three hours and 24 hours after randomisation) and was dichotomised giving the proportion of patients at different points on the scales. We have included these data as information on pain is pertinent to this review and it is possible that future trials may add to the data set, as well as for completeness we only presented the data after randomisation in the analysis (Analysis 1.26). Moderate to severe pain according to all three ordinal scales was less in those labouring in water than those not labouring in water when assessed 30 minutes after randomisation (RR 0.75, 95% CI 0.62 to 0.91; RR 0.72, 95% CI 0.58 to 0.90; RR 0.67, 95% CI 0.51 to 0.90), and 24 hours after randomisation (RR 0.64, 95% CI 0.50 to 0.82; RR 0.62, 95% CI 0.49 to 0.80; RR 0.69, 95% CI 0.54 to 0.87). It was less when assessed at one hour and two hours after randomisation for two out of the three ordinal scales (one hour RR 0.76, 95% CI 0.63 to 0.91; RR 0.68, 95% CI 0.53 to 0.86) (two hours RR 0.76, 95% CI 0.59 to 0.98; RR 0.72, 95% CI 0.52 to 0.98). Data were also assessed between those labouring in water and those not labouring in water using the VAS 1 to 10 ordinal scale at one or two hours after randomisation (one hour, RR 1.21, 95% CI 0.69 to 2.11; two hours, RR 0.83, 95% CI 0.66 to 1.05), and at three hours after randomisation on any of the three ordinal scales (RR 0.69, 95% CI 0.39 to 1.23) (Analysis 1.26).
Pulse and blood pressure (first, second and third stage)
Only one trial (Taha 2000) reported the biophysiological effect of immersion in water on the effect of blood pressure changes. There was reduction in all the outcomes among women in the immersion group compared to those in the non‐immersion group: systolic (mean 120.3 mmHg versus 127.5 mmHg; MD ‐7.20, 95% CI ‐13.12 to ‐1.28; Analysis 1.27); diastolic (mean 62.8 mmHg versus 73 mmHg; MD ‐10.20, 95% CI ‐13.70 to ‐6.70; Analysis 1.28); and mean arterial pressure (mean 83.7 versus 94.2; MD ‐10.50, 95% CI ‐14.68 to ‐6.32; Analysis 1.29).
Preference for care in subsequent labour (does not wish to use bath with next labour/birth)
One trial (Taha 2000) reported this outcome. There was no clear difference between the groups (RR 0.38, 95% CI 0.14 to 0.98; 119 women; Analysis 1.30).
Postpartum depression (EPDS more than 11)
Two trials (Eckert 2001; Taha 2000) that reported postpartum depression did not find any clear difference between the groups (RR 1.38, 95% CI 0.85 to 2.24; 370 women; Analysis 1.31).
Fetal/neonatal outcomes
The following neonatal outcomes were not reported in the trials: respiratory support (oxygen/ventilation required); lung hypoplasia; neurological pathology, e.g. seizures, cerebral palsy; snapped cord; birth injury; poor infant outcomes at long‐term follow‐up (as defined by trialists).
Abnormal heart rate pattern
Three trials (Eckert 2001; Schorn 1993; Taha 2000) that reported abnormal fetal heart rate patterns did not find any clear difference between the groups (average RR 0.75, 95% CI 0.34 to 1.67, 487 women; Analysis 1.32). Substantial heterogeneity was detected among the studies (heterogeneity: I² = 57%, Tau² = 0.22, Chi² test for heterogeneity P = 0.13), and so we used a random‐effects analysis.
Presence of meconium‐stained liquor
Four trials (Da Silva 2006; Eckert 2001; Kuusela 1998; Rush 1996) provided data on the presence of meconium‐stained liquor but did not find any clear difference between the groups (average RR 0.92, 95% CI 0.64 to 1.33; 1200 women; Analysis 1.33). Heterogeneity was detected among the studies (heterogeneity: I² = 35%; Tau² = 0.05; Chi² test for heterogeneity P = 0.20) therefore we used random‐effect analysis.
Apgar score (as presented by authors)
Five trials (Cammu 1994; Eckert 2001; Ohlsson 2001; Schorn 1993; Taha 2000) that reported data on the proportion of children with an Apgar score of less than seven at five minutes did not find any clear difference between the groups (RR 1.58, 95% CI 0.63 to 3.93; 1834 infants; Analysis 1.34). Similarly, there was no clear difference between the groups in the two trials (Da Silva 2006; Rush 1996) that provided mean Apgar score at five minutes (MD ‐0.03, 95% CI ‐0.11 to 0.06; 893 infants; Analysis 1.35).
Cord pH immediately after birth (arterial and or venous cord blood)
One trial (Cammu 1994) that reported umbilical artery pH less than 7.20 did not find any clear difference between the groups (RR 5.18, 95% CI 0.25 to 105.51;110 infants; Analysis 1.36).
Breastfeeding (at specified time points)
Two trials (Eckert 2001; Taha 2000) reported on the number of women not breastfeeding six weeks post birth and did not find any clear difference between the groups (RR 1.17, 95% CI 0.64 to 2.15; 363 women; Analysis 1.37).
Other outcomes
No trial describes the costs associated with immersion in water in labour and birth.
Caregiver outcomes
No trial described any injuries or satisfaction outcomes for caregivers.
2. Immersion versus no immersion in the second stage of labour
We included two trials evaluating immersion during the second stage of labour (Ghasemi 2013; Nikodem 1999). See summary of findings Table 2.
Primary outcomes
Maternal
Mode of birth (spontaneous birth, instrumental vaginal births and caesarean sections)
One trial (Nikodem 1999) reported on spontaneous vaginal birth (RR 1.02, 95% CI 0.96 to 1.08; 120 women, low‐quality evidence; Analysis 2.1), instrumental vaginal birth (RR 1.00, 95% CI 0.06 to 15.62; 120 women; very low‐quality evidence; Analysis 2.2), and caesarean section rate (RR 0.33, 95% CI 0.01 to 8.02; 120 women; very low‐quality evidence; Analysis 2.3), but did not find any clear difference between the groups.
Use of analgesia (regional) during any stage of labour
Regional analgesia was not reported as it is not applicable to the second stage of labour as it would be an exclusion criterion for water immersion.
Third‐ and fourth‐degree tears were not reported under this comparison.
Neonatal
Perinatal death
There was one perinatal death in the immersion group of one trial (Nikodem 1999), although there was no clear difference between the groups (RR 3.00, 95% CI 0.12 to 72.20, very low‐quality evidence; Analysis 2.4). Further, the infant was born to an HIV mother and the cause of death was deemed to be intrauterine infection. Low‐risk women only were included in this study but the HIV status of the women was not known. The woman who was HIV positive found out following the birth.
Admission to neonatal intensive care unit
Two trials (Ghasemi 2013; Nikodem 1999) reported admissions to the neonatal intensive care unit, which did not find any clear difference between the groups (RR 0.78, 95% CI 0.38 to 1.59; 291 infants; very low‐quality evidence; Analysis 2.5).
Neonatal Infection (including markers of infection such as pyrexia and raised white cell count)
No trial report confirmed neonatal infection.
There was no clear difference between the groups in the trial (Nikodem 1999) that reported the incidence of raised neonatal temperature at birth greater than 37.5ºC (RR 2.62; 95% CI 0.73 to 9.35, 109 infants; very low‐quality evidence; Analysis 2.6) or of a temperature less than 36.2ºC at birth (RR 0.98, 95% CI 0.30 to 3.20; 109 infants;very low‐quality evidence; Analysis 2.6). Ghasemi 2013 reported the incidence of fever during the first week of life but again found no clear difference between the groups (RR 0.53, 95% CI 0.10 to 2.82, 171 infants, very low‐quality evidence; Analysis 2.7).
Sensitivity analysis
There was not a sufficient number of trials to perform sensitivity analysis under this comparison.
Secondary outcomes
No trial reported any maternal mortality and given the rarity of this outcome, it is reasonable to assume there was no maternal mortality. No trial reported augmentation of labour in the second stage; temperature; pulse and blood pressure; maternal self esteem; satisfaction with pain relief; or sense of control in labour.
Maternal
Estimated blood loss during labour (first, second, third stage, and immediate postnatal period)
Neither trial reported estimated blood loss.
Postpartum haemorrhage
One trial (Nikodem 1999) reported no clear difference between the groups for postpartum haemorrhage rate (RR 0.14, 95% CI 0.01 to 2.71, 120 women, Analysis 2.8).
Use of analgesia (general anaesthesia, or pharmacological analgesia) during any stage of labour
No other type of analgesia was reported.
Duration of labour (first, second and third stage)
Two trials (Ghasemi 2013; Nikodem 1999) that reported on the duration of the second stage of labour did not find any clear difference between the groups (MD ‐1.83, 95% CI ‐8.18 to 4.52; 291 women; Analysis 2.9).
Perineal trauma (intact, first‐ or second‐degree tears, episiotomy)
One trial (Nikodem 1999) reported perineal trauma. There was no clear difference between group for incidence of episiotomy (RR 0.74, 95% CI 0.17 to 3.15; 119 women; Analysis 2.10), or for second‐degree tears (RR 1.16, 95% CI 0.57 to 2.38; 119 women; Analysis 2.11).
Pain experience/intensity as defined by authors
One trial (Nikodem 1999) reported on the proportion of women experiencing moderate to severe pain, and found no clear difference between groups (RR 1.06, 95% CI 0.73 to 1.53; 117 women, Analysis 2.12).
Preference for care in subsequent labour (does not wish to use bath with next labour/birth)
One trial (Nikodem 1999) reported the number of women who would not wish to use immersion during labour with a subsequent labour and birth but there was no clear difference between the groups (RR 0.57, 95% CI 0.22 to 1.47; 117 women; Analysis 2.13).
Satisfaction with childbirth experience (as defined by trialists)
Nikodem 1999 demonstrated a higher level of satisfaction with the birth experience (one trial; 3/60 versus 12/57, RR 0.24, 95% CI 0.07 to 0.80; Analysis 2.14), with fewer women in the immersion group feeling that they did not cope satisfactorily with their pushing efforts (3/60 versus 12/57).
Fetal
Only one fetal outcome was reported in these trials.
Meconium liquor
One trial (Nikodem 1999) provided data on the presence of meconium‐stained liquor but there was no clear difference between the groups (RR 1.40, 95% CI 0.47 to 4.17; 120 women; Analysis 2.15).
Neonatal outcomes
The following neonatal outcomes were not reported in the trials: respiratory support (oxygen/ventilation required); lung hypoplasia; neurological pathology, e.g. seizures, cerebral palsy; snapped cord; birth injury; poor infant outcomes at long‐term follow‐up (as defined by trialists).
Apgar score (as described by authors)
Two trials (Ghasemi 2013; Nikodem 1999) reported on Apgar score although each used different parameters.
Ghasemi 2013 reported on mean Apgar at five minutes and there was no clear difference between the groups (MD ‐0.10, 95% CI ‐0.22 to 0.02; 171 infants, Analysis 2.17). Similarly, there was no clear difference between the groups in the trial (Nikodem 1999) that reported incidence of an Apgar score less than seven at five minutes (RR 4.92, 95% CI 0.24 to 100.31; 119 infants, Analysis 2.16).
Cord pH immediately after birth (arterial and or venous cord blood)
Nikodem 1999 cited the incidence of an arterial umbilical cord sample pH being below 7.20 (RR 0.89, 95% CI 0.45 to 1.75, 116 infants, Analysis 2.18).
Other outcomes
None of the included trials reported the costs associated with immersion in water in labour and birth.
Caregiver outcomes
None of the included trials reported any injuries or satisfaction outcomes for caregivers.
3. Immersion in water versus no immersion during any stage of labour
We 14 trials in this overall comparison of immersion versus no immersion in any stage of labour. All trials, with the exception of Eriksson 1997, which compares early versus late immersion, are included in this comparison.
We entered all available data for these trials in both the first‐ and second‐stage sections of this review, although it should be noted that in Woodward 2004 only 10 (25%) of the 40 women allocated to birth in water actually received the intervention. All the women received their allocated intervention in two trials (Chaichian 2009; Gayiti 2015), while it was unclear in one trial (Torkamani 2010).
Primary outcomes
Maternal
Mode of birth (spontaneous vaginal birth, instrumental vaginal birth and caesarean section)
Trials contributing to these outcomes included women using immersion in first stage only, second stage only, and both first and second stages.
There is no clear effect on incidence of spontaneous vaginal birth (average RR 1.03, 95% CI 0.99 to 1.09; 2845 women; 9 trials; I² = 51%, Analysis 3.1). Random‐effects analysis was used due to the substantial heterogeneity present between these trials (heterogeneity: Tau² = 0.00; Chi² test for subgroup difference P = 0.04; I² = 51%).
There also appears to be no clear effect on instrumental vaginal births (RR 0.86, 95% CI 0.70 to 1.04; 2739 women; 8 trials, Analysis 3.2), or caesarean section rates (RR 1.19, 95% CI 0.86 to 1.65; 2832 women; 9 trials, Analysis 3.3).
Use of analgesia (regional) during any stage of labour
Trials contributing to these outcomes included women using immersion in first stage only, and both first and second stages.
Women using immersion received less regional analgesia (RR 0.90, 95% CI 0.82 to 0.98; 2499 women; 6 trials, Analysis 3.4).
Perineal trauma (third‐degree or fourth‐degree tear)
Trials contributing to this outcome included women using immersion in first stage only (Eckert 2001; Ohlsson 2001; Rush 1996; Taha 2000), and both first and second stages (Woodward 2004).
There is no clear effect on incidence of third‐ or fourth‐degree tears (RR 1.37, 95% CI 0.86 to 2.17; 2401 women; 5 trials, Analysis 3.5).
Fetal/neonatal
Perinatal death (still birth, neonatal death)
There was one perinatal death in one trial looking at immersion in second stage only (Nikodem 1999), although there was no clear difference between the groups (RR 3.00, 95% CI 0.12 to 72.20; 1 trial; 120 infants; Analysis 3.6). Further, the infant was born to a mother with HIV and the cause of death was deemed to be intrauterine infection. Low‐risk women only were included in this study but the HIV status of the women was not known. The woman who was HIV positive found out following the birth. No other trials reported this outcome.
Admission to neonatal intensive care unit
Trials contributing to this outcome included women using immersion in first stage only (Eckert 2001; Ohlsson 2001), second stage only (Ghasemi 2013; Nikodem 1999), and both first and second stage (Woodward 2004).
There was no clear difference between groups for this outcome (RR 0.99, 95% CI 0.70 to 1.39; 1862 infants; 5 trials, Analysis 3.7).
Neonatal infection, including markers of infection such as pyrexia and raised white cell count
Trials contributing to this outcomes included women using immersion in first stage only (Cammu 1994; Eckert 2001; Kuusela 1998; Rush 1996; Schorn 1993). There was no clear difference between groups for this outcome (RR 2.00, 95% CI 0.50 to 7.94; 1295 infants; 5 trials, Analysis 3.8).
Chaichian 2009 stated there was no "statistically significant difference" between groups but did not provide data.
Two trials, Eckert 2001 (first stage only) and Nikodem 1999 (second stage only), reported no difference between groups for different specified neonatal temperatures: greater than 37.8ºC as an indicator for infection (RR 1.00, 95% CI 0.06 to 15.83; 274 infants; 1 trial), less than 36.2ºC at birth (RR 0.98, 95% CI 0.30 to 3.20; 109 infants; 1 trial), and greater than 37.5ºC at birth (RR 2.62, 95% CI 0.73 to 9.35; 109 infants; 1 trial) (Analysis 3.9).
One trial from the second stage of labour only (Ghasemi 2013) reported no clear difference between groups for fever in the first week (RR 0.53, 95% CI 0.10 to 2.82; 171 infants; 1 trial, Analysis 3.10).
There was no clear difference between the groups in the trial (Woodward 2004) that reported the administration of antibiotics to neonates (RR 1.50, 95% CI 0.17 to 13.52; 60 infants, Analysis 3.11). The same trial reported the incidence of positive neonatal swabs of ear, mouth or umbilicus. Babies born in water appeared to have more positive mouth, ear, and umbilical swabs, however the denominators for these outcomes do not add up and it is not clear how babies were counted if they had more than one positive swab so the data could not be extracted.
Sensitivity analysis
Removing Eckert 2001, Ghasemi 2013, Ohlsson 2001, Rush 1996, Schorn 1993, and Woodward 2004 as per review methodology, widened confidence intervals but did not alter overall results for modes of birth. For use of analgesia (regional), removing Eckert 2001, Ohlsson 2001, Rush 1996, and Woodward 2004 removed the favourable immersion results leaving no clear difference between groups. For perineal trauma (third‐ and fourth‐degree tears), perinatal deaths, admission to neonatal intensive care unit, and neonatal infection, sensitivity analysis was not possible due to a small number of trials left in the analysis, single trials contributing data to the analysis, or the only trials contributing events being removed from the analysis.
Secondary outcomes
Maternal
The following outcomes were not reported by any trial: maternal self‐esteem, satisfaction with pain relief (as defined by trialists), sense of control in labour (as defined by trialists), effect (negative) on mother/baby interaction, post‐traumatic stress disorder.
Estimated blood loss (mL) (not pre‐specified)
Trials contributing to this outcome included women using immersion in first stage only (Kuusela 1998; Taha 2000), and both first and second stages (Gayiti 2015). There was no clear difference between the groups due to wide confidence intervals crossing the line of no effect (MD ‐6.28, 95% CI ‐13.67 to 1.11; 273 women; 3 trials, Analysis 3.12).
Postpartum haemorrhage (PPH)
There was no clear difference between groups in numbers of women who experienced a PPH (average RR 0.73, 95% CI 0.08 to 6.90; 394 women; 2 trials; I² = 61%, Analysis 3.13). There was substantial heterogeneity in this outcome (heterogeneity: Tau² = 1.82; Chi² test for heterogeneity P = 0.11; I² = 61%) and the results should be interpreted with caution.
Use of analgesia (general anaesthesia, or pharmacological analgesia) during any stage of labour
Immersion or no immersion made no clear difference to women receiving pethidine/narcotics (average RR 0.85, 95% CI 0.46 to 1.56; 1240 women; 4 trials; I² = 58%; Tau² = 0.20; Chi² test for subgroup differences P = 0.07, Analysis 3.14), or any pharmacological analgesia (RR 1.05, 95% CI 0.80 to 1.39; 394 women; 2 trials (first stage of labour only), Analysis 3.15). There was no clear difference between groups for using any analgesia (average RR 0.72, 95% CI 0.46 to 1.12; 653 women; 5 trials; I² = 93%; Tau² = 0.19; Chi² test for subgroup differences P < 0.001; Analysis 3.16).
Maternal infection during labour/postnatal period (perineal, systemic, uterine or increase in temperature)
All five trials contributing to this outcome used immersion in the first stage only (Cammu 1994; Eckert 2001; Kuusela 1998; Rush 1996; Schorn 1993). There was no clear difference between the groups (RR 0.99, 95% CI 0.50 to 1.96, 1295 women, 5 trials, Analysis 3.17). This analysis uses the same data as Analysis 1.14.
Augmentation of labour (artificial rupture of membranes and/or oxytoxic administration)
Three trials using immersion or no immersion in the first stage only reported artificial rupture of membranes (Da Silva 2006; Kuusela 1998; Rush 1996). There was no clear difference between the groups (RR 1.02, 95% CI 0.90 to 1.16; 926 women; 3 trials, Analysis 3.18). This analysis uses the same data as Analysis 1.15,
Five trials contributed data to use of oxytocin for augmentation. One trial used immersion in first and second stage of labour (Chaichian 2009) and four were only in first stage (Da Silva 2006; Kuusela 1998; Rush 1996; Schorn 1993). There was no clear difference between groups (average RR 0.64, 95% CI 0.32 to 1.28; 1125 women; 5 trials; I² = 79%, Analysis 3.19). There was substantial heterogeneity (heterogeneity: Tau² = 0.41; Chi² test for heterogeneity P = 0.0008; I² = 79%) in this outcome due to the large number of women in the no immersion group receiving oxytocin in Chaichian 2009.
Use of non‐pharmacological analgesia (TENS)
Trials contributing to this outcome included women using immersion in first stage only (Rush 1996), and both first and second stages (Woodward 2004). There was no clear difference between the groups (RR 1.05, 95% CI 0.37 to 2.94; 845 women; 2 trials, Analysis 3.20).
Duration of labour (first, second and third stage) (minutes)
Trials contributing to this outcome included women using immersion in first stage only (Cammu 1994; Eckert 2001; Kuusela 1998; Rush 1996; Schorn 1993), and both first and second stages (Chaichian 2009; Torkamani 2010; Woodward 2004). Women in the immersion in water groups experienced shorter first stages of labour than those who did not use immersion (MD ‐42.21, 95% CI ‐80.93 to ‐3.49; 1561 women; random‐effects; eight trials; I² = 67%, Analysis 3.21). There was substantial heterogeneity between studies for this outcome (heterogeneity: Tau² = 1600.24; Chi² test for heterogeneity P = 0.004; I² = 67%).
Eleven trials contributed to duration of the second stage of labour: six trials with immersion in first stage (Cammu 1994; Da Silva 2006; Eckert 2001; Kuusela 1998; Rush 1996; Schorn 1993), two trials with immersion in second stage (Ghasemi 2013; Nikodem 1999), and three in both stages (Chaichian 2009; Torkamani 2010; Woodward 2004). There was no clear difference between the groups (MD ‐2.85, 95% CI ‐8.85 to 3.16; random‐effects; 1960 women; 11 trials; I² = 68%, Analysis 3.22). Again, there was a substantial amount of heterogeneity for this outcome (heterogeneity: Tau² = 55.15; Chi² test for heterogeneity P = 0.0009; I² = 68%) and the results should be interpreted with caution.
Three trials (Chaichian 2009; Eckert 2001; Rush 1996) reported on the duration of the third stage of labour. There was no clear difference between the groups (MD ‐0.52, 95% CI ‐1.84 to 0.79; random‐effects; 1165 women; 3 trials; I² = 41%; Tau² = 0.54; Chi² test for heterogeneity P = 0.18, Analysis 3.23).
Two trials contributing data the duration of total labour included women using immersion in first stage only (Taha 2000), and both first and second stages (Gayiti 2015). There was no clear difference between the groups (MD ‐40.83, 95% CI ‐87.09 to 5.43; 240 women; 2 trials).
Perineal trauma (intact, first‐degree tear, second‐degree tear, episiotomy)
Four trials contributing data were using immersion in first stage (Da Silva 2006; Eckert 2001; Rush 1996; Taha 2000) and one trial used immersion in both stages (Woodward 2004). Women using immersion in any stage of their labour appeared to experience more intact perineums than those with no immersion, however the wide confidence intervals just cross the line of no effect (RR 1.16, 95% CI 0.99 to 1.35; 1337 women; 5 trials, Analysis 3.25).
There was no clear difference in second‐degree tears (RR 0.89, 95% CI 0.71 to 1.10; 1525 women; 7 trials, Analysis 3.26). First‐degree tears were not reported by any trial.
There was no clear difference between groups in episiotomy (average RR 0.88, 95% CI 0.67 to 1.17; 1511 women; 7 trials; I² = 41%, Analysis 3.27) however there was substantial heterogeneity between trials (heterogeneity: Tau² = 0.05; Chi² test for heterogeneity P = 0.12; I² = 41%) and this should be interpreted with caution.
Pain experience/intensity as presented by authors
Pain was presented in different ways so that meta‐analyses were not possible. The results for this outcome is identical to that presented in Comparisons 1 and 2.
Torkamani 2010 used immersion in first and second stage and reported much lower pain scores in the immersion group when measured following the birth (MD ‐3.43, 95% CI ‐3.95 to ‐2.91; 100 women, Analysis 3.28).
Temperature (oC) (first and second stage)
One trial looking at immersion in first and second stages (Woodward 2004), reported maternal mean temperature and found there was no clear difference between groups (MD 0.20, 95% CI ‐0.18 to 0.58; 60 women; Analysis 3.30). It is not clear when this temperature was taken.
Pulse and blood pressure (first, second and third stage)
One trial of 120 women (Taha 2000) found that systolic (MD ‐7.20, 95% CI ‐13.12 to ‐1.28, Analysis 3.31), diastolic (MD ‐10.20, 95% CI ‐13.70 to ‐6.70, Analysis 3.32), and mean arterial blood pressures (MD ‐10.50, 95% CI ‐14.68 to ‐6.32, Analysis 3.33) were all lower in the women in the immersion group compared with the no immersion group. The data used for these outcomes are the same as that used for Analysis 1.27, Analysis 1.28, and Analysis 1.29, respectively.
Pulse was not reported in any trial.
Preference for care in subsequent labour
More women in the immersion group reported to want to use immersion again in a subsequent labour compared to those in the no immersion group (RR 0.46, 95% CI 0.24 to 0.90; 236 women; 2 trials, Analysis 3.34).
Satisfaction with childbirth experience (as defined by trialists)
One trial (Nikodem 1999) from the second stage of labour only found that fewer women in the immersion group reported little or no satisfaction in coping in labour (RR 0.24, 95% CI 0.07 to 0.80; 117 women; 1 trial, Analysis 3.35).
However, another trial (Woodward 2004), which measured satisfaction with labour and birth on a scale of 0 to 6 where 0 is not at all satisfied, considered that both groups were 'reasonably satisfied' and there was no clear difference between the groups (MD 0.03, 95% CI ‐0.64 to 0.70; 60 women; Analysis 3.36).
Postpartum depression
Two trials (Eckert 2001; Taha 2000) that reported postpartum depression did not find any clear difference between the groups (RR 1.38, 95% CI 0.85 to 2.24; 370 women, Analysis 3.37). This analysis used the same data as Analysis 1.31.
Fetal/neonatal outcomes
The following outcomes were not reported in any trial: respiratory support (oxygen/ventilation required), lung hypoplasia, neurological pathology (e.g. seizures, cerebral palsy), snapped cord, birth injury, poor infant outcomes at long‐term follow‐up (as defined by trialists).
Abnormal heart rate pattern
There was no clear difference between group in abnormal fetal heart rate patterns (average RR 0.75, 95% CI 0.34 to 1.67; 487 women; 3 trials; I² = 57%, Analysis 3.38). There was substantial heterogeneity between these trials (heterogeneity: Tau² = 0.22; Chi² test for heterogeneity P = 0.13; I² = 57%) and the results should be interpreted with caution. These data are the same used for Analysis 1.32.
Presence of meconium‐stained liquor
Da Silva 2006, Eckert 2001, Kuusela 1998, Nikodem 1999, Rush 1996, and Woodward 2004 found no clear difference between group in presence of meconium liquor (RR 0.97, 95% CI 0.78 to 1.21; 1380 women; 6 trials, Analysis 3.39).
Apgar score less than seven at five minutes (or as presented by authors)
It appears that fewer babies have an Apgar score of less than seven at five minutes in the no immersion group (12/967 versus 6/986) but there are very wide confidence intervals that cross the line of no effect for this analysis (RR 1.79, 95% CI 0.76 to 4.25; 1953 infants; 6 trials, Analysis 3.40).
Similarly, four trials reported mean Apgar score at five minutes and found very slightly higher mean scores in the no immersion group, however wide confidence intervals again crossed the line of no effect (MD ‐0.04, 95% CI ‐0.11 to 0.02; 1184 infants; 4 trials, Analysis 3.41).
Woodward 2004 reported one baby having an Apgar score of less than eight at five minutes in the immersion group (data not shown).
Cord pH immediately after birth (arterial and or venous cord blood)
There was no clear difference between groups in infants born with umbilical artery pH less than 7.20 (RR 1.04, 95% CI 0.54 to 1.98; 226 infants; 2 trials, Analysis 3.42).
Breastfeeding (at specified time points)
Woodward 2004 reported no clear difference between groups on the number of women breastfeeding at birth (RR 0.86, 95% CI 0.69 to 1.08; 60 women; 1 trial, Analysis 3.43).
Two trials (Eckert 2001; Taha 2000) reported on the number of women not breastfeeding six weeks post birth and did not find any clear difference between the groups (RR 1.17; 95% CI 0.64 to 2.15; 363 women; Analysis 3.44). These same data were used for Analysis 1.37.
Other outcomes
Cost as defined by trialists was not reported in any trial.
Caregiver outcomes
Satisfaction, and injuries (any reported physical injury attributed to care of women in water) were not reported in any trial.
4. Early versus late immersion
We included one trial (Eriksson 1997) comparing early versus late immersion during the first stage of labour.
Primary outcomes
Maternal
The single trial (Eriksson 1997) did not report on mode of birth, or perineal trauma. Fewer women used regional analgesia if they had late immersion (RR 2.21, 95% CI 1.39 to 3.52; 1 trial; 200 women, Analysis 4.1).
Fetal/neonatal outcomes
Perinatal death (still birth, neonatal death), and admission to neonatal intensive care unit were not reported.
Neonatal infection
Eriksson 1997 reported on neonatal infection rate but there was no clear difference between the groups (RR 3.00; 95% CI 0.12 to 72.77; 200 infants, Analysis 4.2).
Sensitivity analysis
Eriksson 1997 was the only trial contributing data to this comparison although this trial was assessed to be at high risk of attrition bias.
Secondary outcomes
Maternal outcomes
The following maternal outcomes were not reported in the trials: mortality; use of analgesia (general analgesia, or pharmacological), use of non‐pharmacological analgesia; duration of labour (first, second and third stage); temperature (first and second stage); pulse and blood pressure (first, second and third stage); maternal self‐esteem; preference for care in subsequent labour.
Augmentation of labour (artificial rupture of membranes and/or oxytocic administration)
Eriksson 1997 found an increased incidence of augmentation of labour in the early group (57/100 versus 30/100; RR 1.90; 95% CI 1.35 to 2.68; 200 women, Analysis 4.3).
Fetal/neonatal outcomes
Abnormal fetal heart rate pattern
The single trial (Eriksson 1997) reported that none of the fetus experienced abnormal fetal heart rate pattern, which might be expected in a group of woman/fetal dyads at low risk of complications, where all women entered the water and any abnormality would exclude immersion (Analysis 4.4).
Apgar score less than seven at one minute
There was no neonate with an Apgar lower than seven in either group, which was expected among women/neonate dyads with low risk of complications (Analysis 4.5).
The following fetal/neonatal outcomes were not reported in the trials: meconium liquor; cord pH immediately after birth (arterial and or venous cord blood); admission to special care baby unit/neonatal intensive care unit; respiratory support (oxygen/ventilation required); lung hypoplasia; neurological pathology, e.g. seizures, cerebral palsy; snapped cord; birth injury; poor infant outcomes at long‐term follow‐up (as defined by trialists); well‐being markers; breastfeeding (at specified time points).
Other outcomes
None of the included trials reported the costs associated with immersion in water in labour and birth.
Caregiver outcomes
None of the included trials reported any injuries or satisfaction outcomes for caregivers.
Discussion
Summary of main results
The objective of this review was to assess the effects of water immersion during labour and/or birth (first, second and third stage of labour) on labour interventions and birth, maternal, fetal/neonatal, and caregiver well‐being outcomes. Fifteen trials assessing the effects of water immersion in first and/or second stages of labour were identified. Outcomes that were reported varied across the studies. Risk of bias varied across the trials; no trial blinded participants or staff. We assessed the evidence for our pre‐specified GRADE outcomes for immersion versus no immersion in the first stage of labour and immersion versus no immersion in the second stage. Evidence was downgraded for trial design limitations and imprecision in effect estimates (summary of findings Table for the main comparison; summary of findings Table 2).
Immersion in water compared with no immersion during the first stage of labour
Eight trials reported on this comparison (Cammu 1994; Da Silva 2006; Eckert 2001; Kuusela 1998; Ohlsson 2001; Rush 1996; Schorn 1993; Taha 2000). For the primary outcomes, there were no clear differences between groups for spontaneous vaginal birth (moderate‐quality evidence), instrumental vaginal births (low‐quality evidence), caesarean sections (low‐quality evidence), or third‐ or fourth‐degree tears (moderate‐quality evidence). Fewer women in the immersion group received an epidural compared with those in the no immersion group (moderate‐quality evidence) but there was no clear difference in numbers of women receiving narcotic/pethidine, 'any analgesia', or any pharmacological analgesia. There was no clear difference in neonatal admission to neonatal intensive care (low‐quality evidence), and neonatal infection (very low‐quality evidence). Perinatal death was not reported. For most secondary outcomes, including estimated blood loss (very low‐quality evidence), immersion or no immersion made very little clear differences to outcomes.
Immersion in water compared with no immersion during the second stage of labour
Two trials evaluated this comparison (Ghasemi 2013; Nikodem 1999). For the primary outcomes there was no clear difference between groups for spontaneous vaginal birth (low‐quality evidence), instrumental birth (very low‐quality evidence), or caesarean section (very low‐quality evidence). Use of analgesia, and third‐ and fourth‐ degree tears were not reported. There was one perinatal death in the immersion group (very low‐quality evidence). There was no clear evidence to show a difference between groups for admission to neonatal intensive care unit (very low‐quality evidence), neonatal temperature of below 36.2º (very low‐quality evidence), or greater than 37.5ºC at birth (very low‐quality evidence), or incidence of fever in the first week (very low‐quality evidence). Most secondary outcomes showed no clear difference between the groups. In one trial (Nikodem 1999), the women in the immersion group reported a higher level of satisfaction with their childbirth experience.
Immersion in water compared with no immersion during any stage of labour
In this overall comparison, 14 trials contributed (Cammu 1994; Chaichian 2009; Da Silva 2006; Eckert 2001; Gayiti 2015; Ghasemi 2013; Kuusela 1998; Nikodem 1999; Ohlsson 2001; Rush 1996; Schorn 1993; Taha 2000; Torkamani 2010; Woodward 2004). Heterogeneity was generally high between trials in the comparison and the results should be interpreted with caution. Immersion during any stage did not have a clear effect on the incidence of spontaneous vaginal births, instrumental births, caesarean sections, or third‐ and fourth‐ degree tears. Perinatal death, admission to neonatal intensive care, neonatal infection (including neonatal temperature), showed no clear differences between groups. Fewer women in the immersion group had an epidural. The evidence was less clear for estimated blood loss.
Early versus late immersion
One trial (Eriksson 1997) compared early versus late immersion during the first stage of labour. This trial did not report on mode of birth, or perineal trauma. Fewer women used regional analgesia if they had late immersion. Perinatal death and admission to neonatal intensive care unit were not reported. There was no clear difference between groups in terms of neonatal infection rates. Estimated blood loss was not reported.
In summary
It was not possible to conclude whether the differences identified for primary and secondary outcomes, and particularly the reduction in epidural/spinal analgesia, are due to water alone, or the water/pool environment. Across all trials, in addition to an overall lack of a description of the bath or pool in which the women immersed and what ‘standard care’ incorporated, there was insufficient information about the model of care that women received in either the water immersion or control groups.
Overall completeness and applicability of evidence
Water immersion is a care package, which includes the actual water and associated environment, together with the interactions between the woman and her caregivers. It may be that this last factor, linking midwives/caregivers to proactively support women to optimise their physiological capacity to labour and give birth, to work towards reducing the likelihood of obstetric intervention requirement and to ensure they are comfortable facilitating water immersion during labour and waterbirth, is the most important component. This would be consistent with the evidence on continuous support during labour (Bohren 2017). It could be argued that, if water immersion facilitates the adoption of a woman‐centred approach to care, facilitating normalisation of labour and birth, as many now seek (Maternity Care Working Party 2007; RCM 2016; RCOG 2011), then immersion in water during labour and waterbirth should be promoted for healthy women with a singleton fetus who experience a straightforward pregnancy.
Presentation of findings in all but a couple of the trials indicate a high level of group allocation integrity. However, Rush 1996 and Woodward 2004 reported respectively that 46% (n = 183) and 40% (n = 16) of women allocated to water immersion did not actually use water, although in the case of Woodward 2004, this was expected and a recruitment ratio of 2:1 was adopted. In both studies, analysis was by intention‐to‐treat, although they did not report outcomes by actual use. Subgroup analysis excluding women who did not use the water might have increased the difference between water users and non‐users, in favour of less epidural analgesia for those who used water immersion. This would be consistent with the study by Chaichian 2009. This is pertinent, as the authors reported that the main reasons for non‐use of the water included early request for epidural, identification of complication precluding water use, non‐availability of the pool and change of mind (numbers for each are provided by Woodward 2004, but not by Rush 1996).
Only one trial investigated early (before a cervical dilatation of 5 cm) versus late (after a cervical dilatation of 5 cm) immersion in water during the first stage of labour, which suggested a higher rate of augmentation and use of pharmacological analgesia in the early immersion group (Eriksson 1997). The main issue arising from this trial is whether or not women in the trial were actually in active labour, and could therefore be reasonably expected to progress spontaneously. It is not possible to preclude that some women may have entered a birthing pool in the latent phase of labour, which could predispose them requiring augmentation. The trial did not consider this possibility.
The trials that described the immersion pool reported using different sized pools (only five trials provide information on bath/pool size (Cammu 1994; Da Silva 2006; Eckert 2001; Eriksson 1997; Kuusela 1998), various durations in the water; and still or moving water, each of which may have had an impact on the outcomes. These factors limit the applicability of the findings.
Another confounding factor is that the gestational age at which water immersion was permissible varies across the trials; from greater than 34 weeks' gestation (Eriksson 1997) through 35 weeks (Ohlsson 2001), and 36 weeks (Schorn 1993; Taha 2000; Woodward 2004), to greater than 37 weeks (Cammu 1994; Chaichian 2009; Da Silva 2006; Eckert 2001; Gayiti 2015; Ghasemi 2013; Kuusela 1998; Rush 1996; Torkamani 2010). This is due to variations in the definition of 'preterm' adopted by different countries. However, the baseline characteristics of participants in the included studies showed no differences.
Although all the trials involved women defined as 'in labour', this was interpreted differently, from trials including all women with contractions, or about to have labour induced with a cervical dilatation of as little as 1 cm (Eckert 2001), to trials including only women in active labour with a cervical dilatation of greater than 6 cm (Da Silva 2006). This variability makes comparisons across trials problematic. Another variation is that the length of the first stage of labour for women in the trial by (Cammu 1994) was shorter (mean of 244 minutes) and less variable (small standard deviation of 139 minutes), compared to a first stage length of 846 minutes (standard deviation 432 minutes) in the trial by Schorn 1993. This suggests that participants may have met different inclusion criteria or experienced a different management protocol during labour, although this was not explicit in the papers. The length of the second stage of labour for the women in the immersion group is much longer than might be expected in the trial by Schorn 1993, which involved only nulliparae, compared to Kuusela 1998 and Chaichian 2009 where the second‐stage duration was reported as 21 and 20 minutes, respectively. This may again relate to different management strategies, for example, definition of the onset of the second stage and the use or not of directed pushing, but again this is not detailed in the papers.
All participants across the included trials were considered at low risk of complications and trials were excluded where this was not so (Cluett 2001; Cluett 2004). However, Eckert 2001 reported the inclusion of women whose labour was induced, while Gayiti 2015 reported pre‐birth preparation of enema, shave and rupture of membranes, which may have affected labour duration and maternal pain perception. Rush 1996 indicated that 41 women who did not meet the inclusion criteria had been randomised. When these women were removed from the analysis the P value for epidural analgesia use changes to 0.044 from 0.069, whilst that for instrumental vaginal birth changes to 0.011 from 0.055. Therefore, when ineligible women are excluded the results indicate that, for women at low risk of complications, labouring in water reduced the likelihood of epidural/narcotic use and of needing an instrumental vaginal birth (Rush 1996). The definitions adopted for 'labour' were varied and may have influenced outcomes. In particular, Cammu 1994 required that the amniotic membranes were ruptured, although there is no indication as to whether this occurred spontaneously or artificially. In contrast, the membranes were intact in all participants in the trial by Schorn 1993. Participants in other trials had a mixture of intact and ruptured membranes (Ohlsson 2001; Rush 1996; Taha 2000; Woodward 2004). These differences may affect pain perception, and hence influence analgesia uptake, maternal satisfaction, and possibly labour progress, which makes comparison across trials difficult. Maternal parity is another factor that can affect pain perception and the duration of labour, yet no trials that involved women of mixed parity accounted for this confounder in their analysis. There is little or no information about the presence of one‐to‐one care or not in the trials evaluating first stage of labour outcomes, although Rush 1996 indicated that caregivers tended to be more continuously present with the water immersion participants. As continuous support during labour is known to affect outcomes (Bohren 2017), if this was not balanced across trial arms, it presents a confounding factor.
Overall, while there is good evidence for the use of water immersion during labour for women at low risk of complications, there is a need to explore its wider adoption into practice, and the care culture‐related factors that affect birthing pool use, particularly in the hospital setting (Russell 2011). In line with the policy drive to promote normality and the use of midwifery‐led units for healthy pregnant women who have an uncomplicated pregnancy (NICE 2014; RCM 2016; RCOG 2011), settings where water immersion during labour and waterbirth are common events, an economic evaluation should be undertaken.
Quality of the evidence
Risk of bias varied across the trials. All the trials were assessed to be at high risk of performance bias and most had at least one other domain at high risk of bias. The conclusions need to be considered in the context of small sample sizes (range 33 to 1237); only two trials (Ohlsson 2001; Rush 1996) achieved a total sample size of greater than 300, both trials being during the first stage of labour only. Blinding to the intervention was not possible, and many outcomes were only considered in one or two trials. These factors limit the interpretation of the results.
The GRADE analysis highlighted that the data are of moderate to very low quality. For the comparison of immersion versus no immersion in the first stage of labour, evidence for spontaneous vaginal birth, regional analgesia, and third‐ or fourth‐degree tear was assessed as moderate quality; instrumental vaginal birth, caesarean section, and admission to neonatal intensive care unit assessed as low quality; and neonatal infection and estimated blood loss as very low quality. Perinatal death was not reported. For the comparison of immersion versus no immersion in the second stage of labour, evidence for spontaneous vaginal birth was assessed as low quality; instrumental vaginal birth, caesarean section, perinatal death, and admission to neonatal intensive care was very low quality. Neonatal infection rates were not reported but markers of infection such as neonatal temperature greater than 37.5oC at birth, neonatal temperature less than 36.2oC at birth, and fever reported in the first week were all assessed to be very low quality. Use of regional analgesia, third‐ and fourth‐degree tears, and estimated blood loss were not reported under this comparison. For both comparisons, evidence was downgraded for design limitations and imprecision in effect estimates.
Potential biases in the review process
We aimed to minimise bias during all stages of the review process. Two review authors independently assessed trials and extracted data. A comprehensive search of literature was performed to minimise publication bias. Both review authors are authors of research related to water immersion, although no trials undertaken by them were included within the review. Some papers were not in English and the review authors were reliant on the quality of the translated information provided.
Agreements and disagreements with other studies or reviews
The results of these trials show beneficial effects of water immersion during labour and waterbirth, with reduced use of epidural/spinal analgesia and episiotomy, and women voicing increased satisfaction with their labour experience. They found no indication that labouring or giving birth in water presents an added risk for the neonate. Such findings are consistent with prospectively conducted observational studies (Bovbjerg 2016; Burns 2012; Geissbuehler 2004; Henderson 2014; Thoeni 2005) and a systematic review (Taylor 2016). Observational and case studies have reported a low incidence of umbilical cord snapping in waterbirth (Burns 2012; Cro 2002; Henderson 2014); a complication which can also occur on land, but is rarely reported.

Study flow diagram.

'Risk of bias' graph: review authors' judgements about each risk of bias item presented as percentages across all included studies.

'Risk of bias' summary: review authors' judgements about each risk of bias item for each included study.
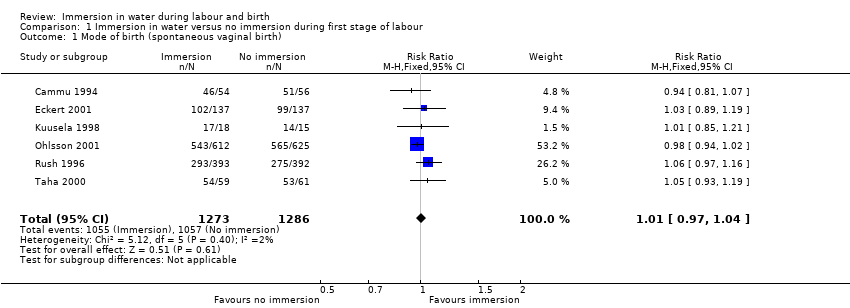
Comparison 1 Immersion in water versus no immersion during first stage of labour, Outcome 1 Mode of birth (spontaneous vaginal birth).

Comparison 1 Immersion in water versus no immersion during first stage of labour, Outcome 2 Mode of birth (instrumental vaginal births).
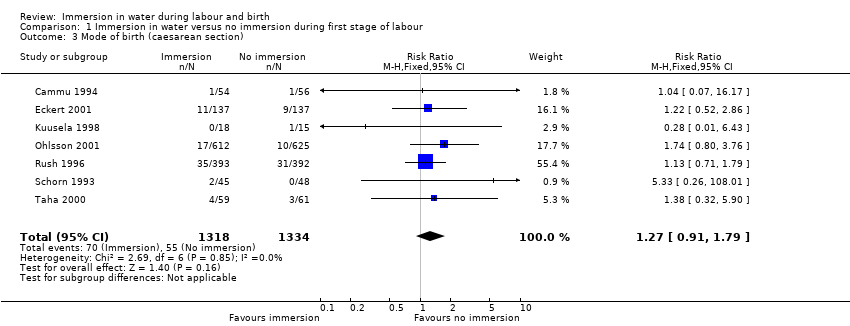
Comparison 1 Immersion in water versus no immersion during first stage of labour, Outcome 3 Mode of birth (caesarean section).

Comparison 1 Immersion in water versus no immersion during first stage of labour, Outcome 4 Use of analgesia (regional).
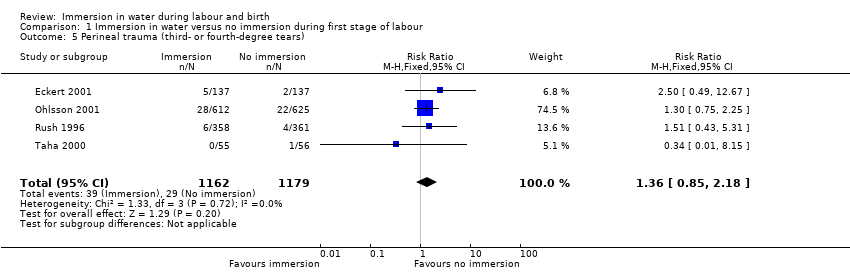
Comparison 1 Immersion in water versus no immersion during first stage of labour, Outcome 5 Perineal trauma (third‐ or fourth‐degree tears).

Comparison 1 Immersion in water versus no immersion during first stage of labour, Outcome 6 Admission to neonatal intensive care unit.

Comparison 1 Immersion in water versus no immersion during first stage of labour, Outcome 7 Neonatal infection.

Comparison 1 Immersion in water versus no immersion during first stage of labour, Outcome 8 Neonate temperature.

Comparison 1 Immersion in water versus no immersion during first stage of labour, Outcome 9 Estimated blood loss (mL).

Comparison 1 Immersion in water versus no immersion during first stage of labour, Outcome 10 Postpartum haemorrhage.

Comparison 1 Immersion in water versus no immersion during first stage of labour, Outcome 11 Use of analgesia (pharmacological ‐ pethidine/narcotic).

Comparison 1 Immersion in water versus no immersion during first stage of labour, Outcome 12 Use of any analgesia.

Comparison 1 Immersion in water versus no immersion during first stage of labour, Outcome 13 Use of analgesia (pharmacological ‐ any).

Comparison 1 Immersion in water versus no immersion during first stage of labour, Outcome 14 Maternal infection during labour/postnatal period (perineal, systemic, uterine or increase in temperature).
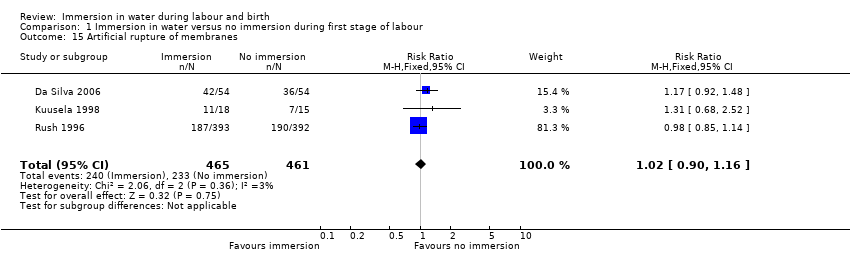
Comparison 1 Immersion in water versus no immersion during first stage of labour, Outcome 15 Artificial rupture of membranes.

Comparison 1 Immersion in water versus no immersion during first stage of labour, Outcome 16 Use of oxytocin for augmentation of labour.
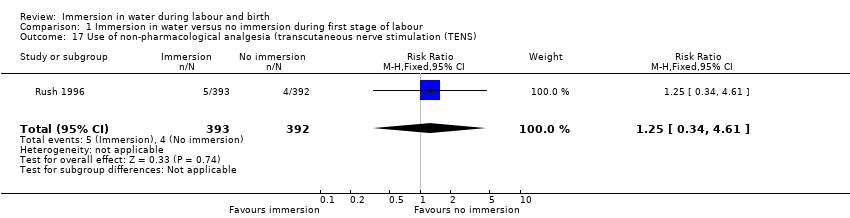
Comparison 1 Immersion in water versus no immersion during first stage of labour, Outcome 17 Use of non‐pharmacological analgesia (transcutaneous nerve stimulation (TENS).
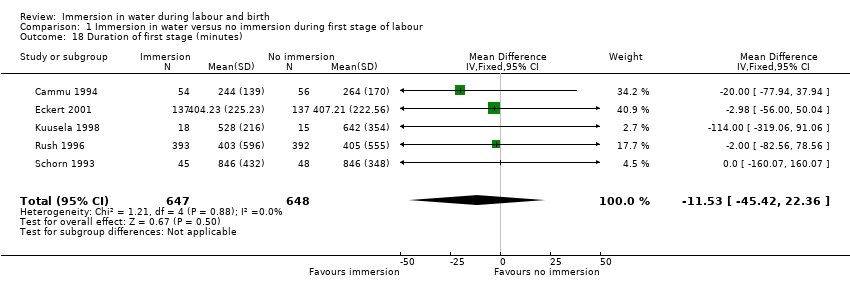
Comparison 1 Immersion in water versus no immersion during first stage of labour, Outcome 18 Duration of first stage (minutes).

Comparison 1 Immersion in water versus no immersion during first stage of labour, Outcome 19 Duration of second stage (minutes).

Comparison 1 Immersion in water versus no immersion during first stage of labour, Outcome 20 Duration of third stage (minutes).

Comparison 1 Immersion in water versus no immersion during first stage of labour, Outcome 21 Duration of total labour (all three stages minutes).

Comparison 1 Immersion in water versus no immersion during first stage of labour, Outcome 22 Perineal trauma (intact).

Comparison 1 Immersion in water versus no immersion during first stage of labour, Outcome 23 Perineal trauma (second‐degree tears).

Comparison 1 Immersion in water versus no immersion during first stage of labour, Outcome 24 Perineal trauma (episiotomy).

Comparison 1 Immersion in water versus no immersion during first stage of labour, Outcome 25 Self reports pain score on visual analogue scale of 0‐10.
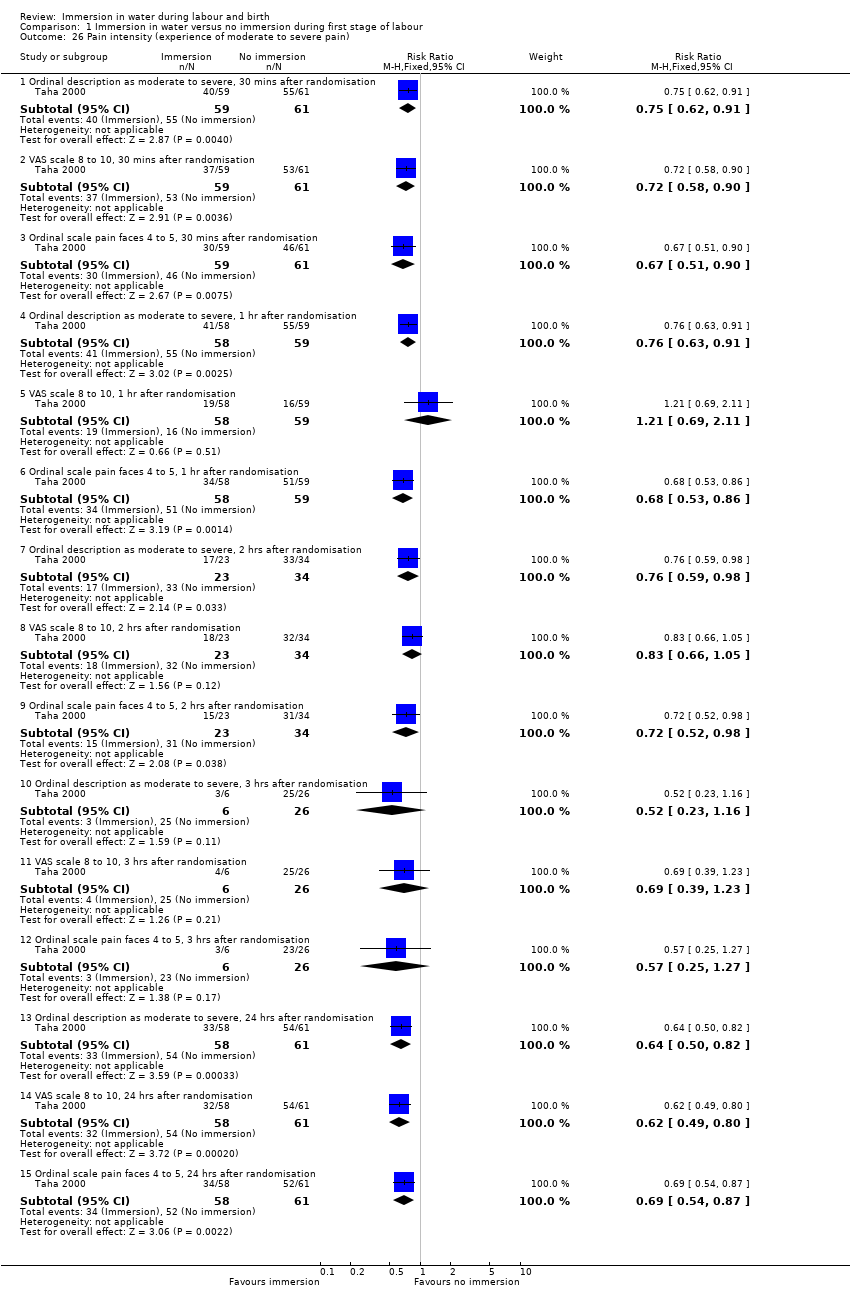
Comparison 1 Immersion in water versus no immersion during first stage of labour, Outcome 26 Pain intensity (experience of moderate to severe pain).
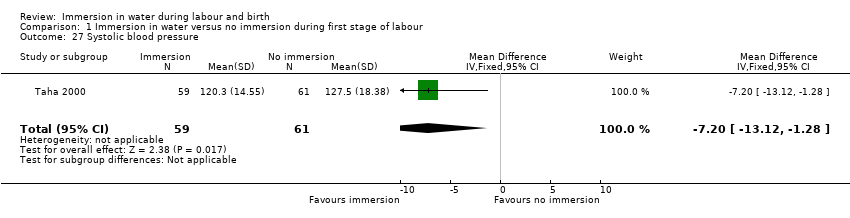
Comparison 1 Immersion in water versus no immersion during first stage of labour, Outcome 27 Systolic blood pressure.

Comparison 1 Immersion in water versus no immersion during first stage of labour, Outcome 28 Diastolic blood pressure.

Comparison 1 Immersion in water versus no immersion during first stage of labour, Outcome 29 Mean arterial blood pressure.

Comparison 1 Immersion in water versus no immersion during first stage of labour, Outcome 30 Preference for care in subsequent labour (Does not wish to use bath with next labour/birth).
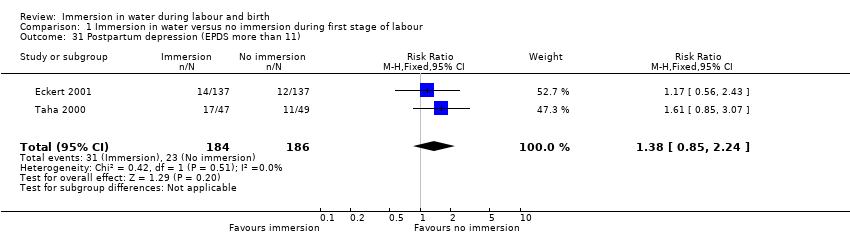
Comparison 1 Immersion in water versus no immersion during first stage of labour, Outcome 31 Postpartum depression (EPDS more than 11).

Comparison 1 Immersion in water versus no immersion during first stage of labour, Outcome 32 Abnormal fetal heart rate patterns.
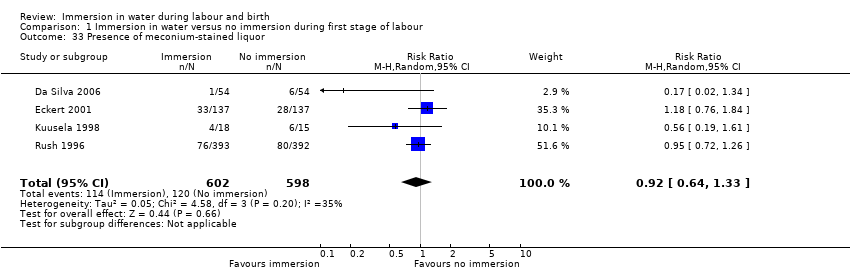
Comparison 1 Immersion in water versus no immersion during first stage of labour, Outcome 33 Presence of meconium‐stained liquor.

Comparison 1 Immersion in water versus no immersion during first stage of labour, Outcome 34 Apgar score less than seven at five minutes.
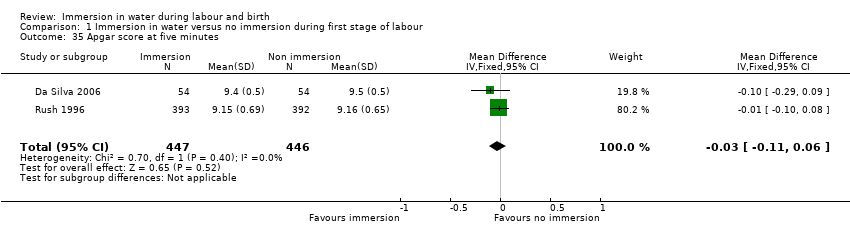
Comparison 1 Immersion in water versus no immersion during first stage of labour, Outcome 35 Apgar score at five minutes.

Comparison 1 Immersion in water versus no immersion during first stage of labour, Outcome 36 Umbilical artery pH less than 7.20.

Comparison 1 Immersion in water versus no immersion during first stage of labour, Outcome 37 Breastfeeding ‐ not breastfeeding after six weeks post birth.
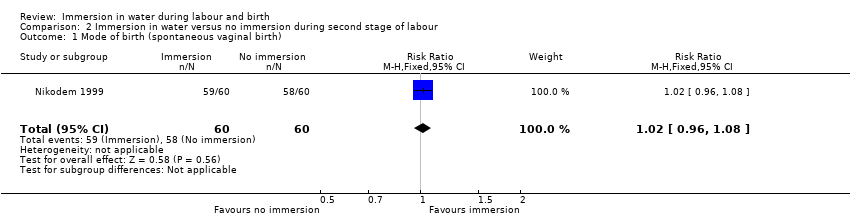
Comparison 2 Immersion in water versus no immersion during second stage of labour, Outcome 1 Mode of birth (spontaneous vaginal birth).

Comparison 2 Immersion in water versus no immersion during second stage of labour, Outcome 2 Mode of birth (instrumental vaginal births).
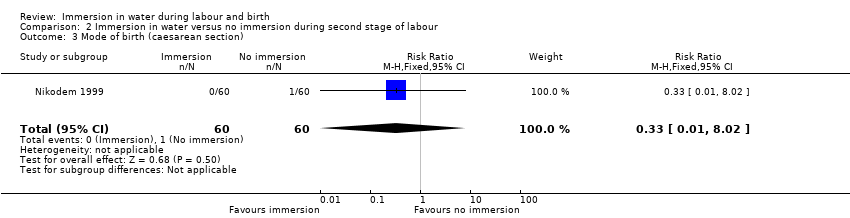
Comparison 2 Immersion in water versus no immersion during second stage of labour, Outcome 3 Mode of birth (caesarean section).

Comparison 2 Immersion in water versus no immersion during second stage of labour, Outcome 4 Perinatal deaths.

Comparison 2 Immersion in water versus no immersion during second stage of labour, Outcome 5 Admission to neonatal intensive care unit.
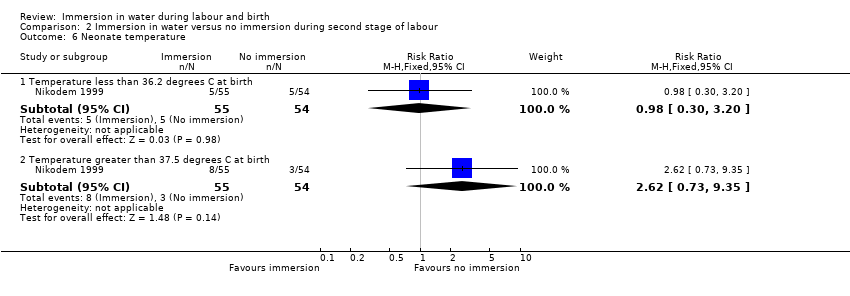
Comparison 2 Immersion in water versus no immersion during second stage of labour, Outcome 6 Neonate temperature.
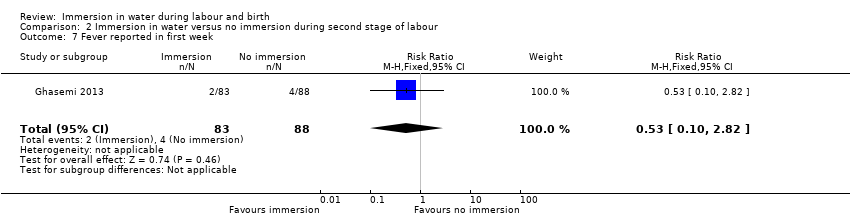
Comparison 2 Immersion in water versus no immersion during second stage of labour, Outcome 7 Fever reported in first week.
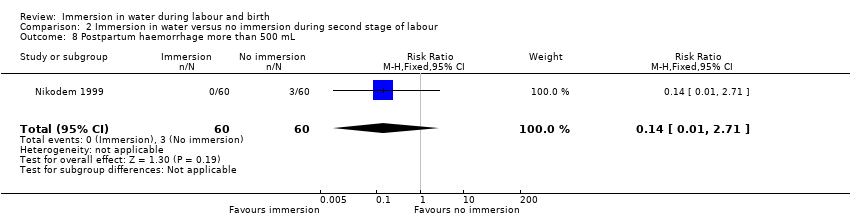
Comparison 2 Immersion in water versus no immersion during second stage of labour, Outcome 8 Postpartum haemorrhage more than 500 mL.

Comparison 2 Immersion in water versus no immersion during second stage of labour, Outcome 9 Duration of second stage (minutes).

Comparison 2 Immersion in water versus no immersion during second stage of labour, Outcome 10 Perineal trauma (episiotomy).
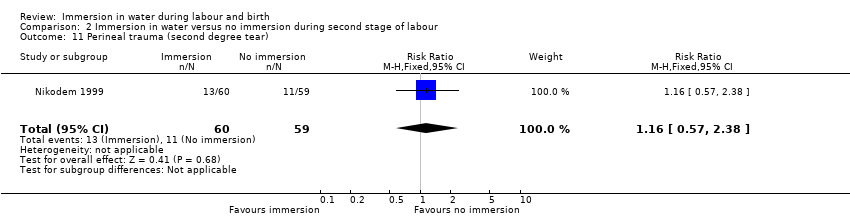
Comparison 2 Immersion in water versus no immersion during second stage of labour, Outcome 11 Perineal trauma (second degree tear).

Comparison 2 Immersion in water versus no immersion during second stage of labour, Outcome 12 Experience of moderate to severe pain.

Comparison 2 Immersion in water versus no immersion during second stage of labour, Outcome 13 Preference for care in subsequent labour (Does not wish to use bath next birth).

Comparison 2 Immersion in water versus no immersion during second stage of labour, Outcome 14 Satisfied with labour.

Comparison 2 Immersion in water versus no immersion during second stage of labour, Outcome 15 Presence of meconium‐stained liquor.
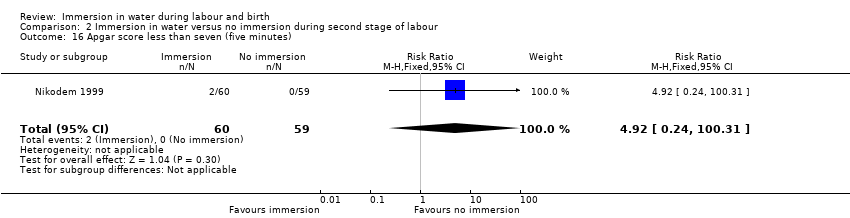
Comparison 2 Immersion in water versus no immersion during second stage of labour, Outcome 16 Apgar score less than seven (five minutes).
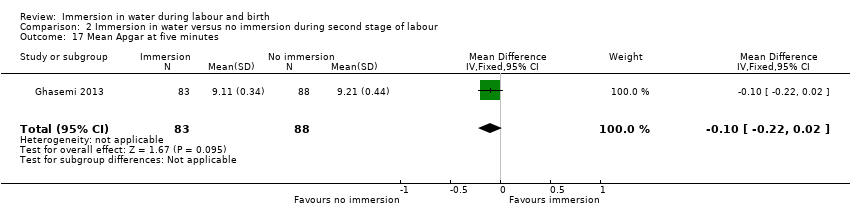
Comparison 2 Immersion in water versus no immersion during second stage of labour, Outcome 17 Mean Apgar at five minutes.

Comparison 2 Immersion in water versus no immersion during second stage of labour, Outcome 18 Umbilical artery pH less than 7.20.
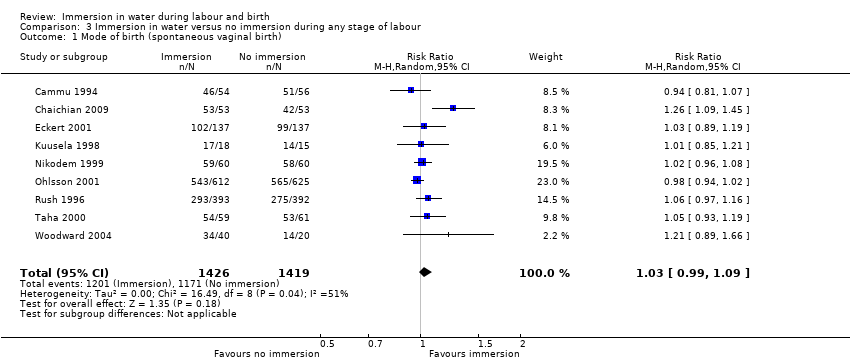
Comparison 3 Immersion in water versus no immersion during any stage of labour, Outcome 1 Mode of birth (spontaneous vaginal birth).

Comparison 3 Immersion in water versus no immersion during any stage of labour, Outcome 2 Mode of birth (instrumental vaginal births).

Comparison 3 Immersion in water versus no immersion during any stage of labour, Outcome 3 Mode of birth (caesarean section).
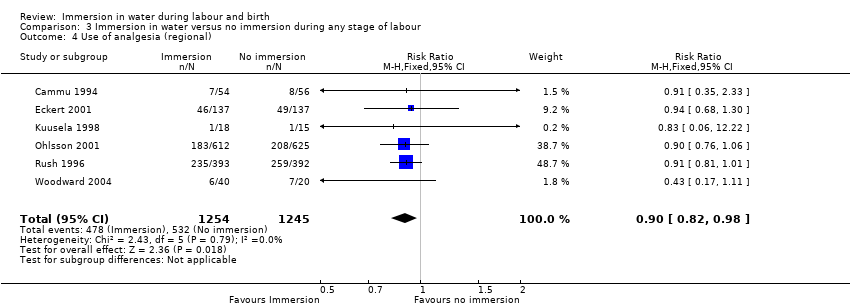
Comparison 3 Immersion in water versus no immersion during any stage of labour, Outcome 4 Use of analgesia (regional).

Comparison 3 Immersion in water versus no immersion during any stage of labour, Outcome 5 Perineal trauma (third‐ or fourth‐degree tears).

Comparison 3 Immersion in water versus no immersion during any stage of labour, Outcome 6 Perinatal deaths.
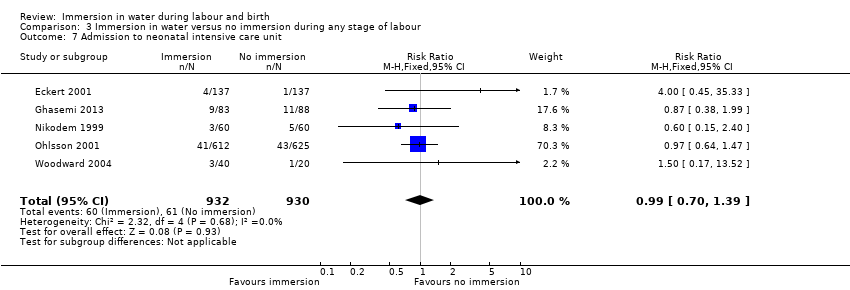
Comparison 3 Immersion in water versus no immersion during any stage of labour, Outcome 7 Admission to neonatal intensive care unit.

Comparison 3 Immersion in water versus no immersion during any stage of labour, Outcome 8 Neonatal infection.
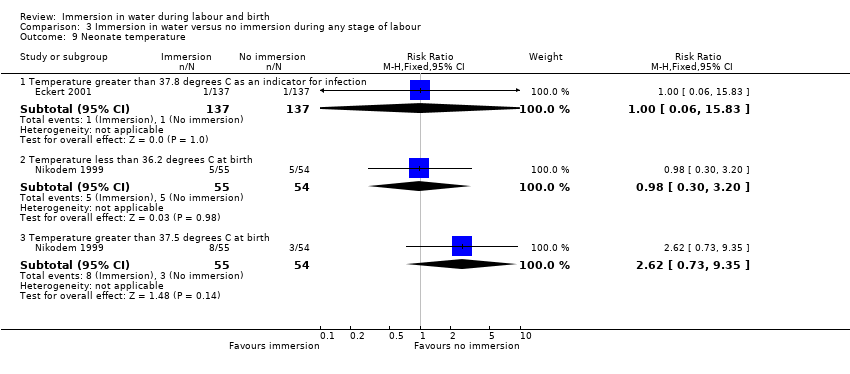
Comparison 3 Immersion in water versus no immersion during any stage of labour, Outcome 9 Neonate temperature.
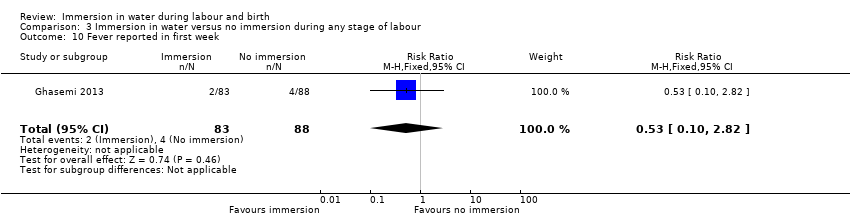
Comparison 3 Immersion in water versus no immersion during any stage of labour, Outcome 10 Fever reported in first week.

Comparison 3 Immersion in water versus no immersion during any stage of labour, Outcome 11 Antibiotics given to neonate.
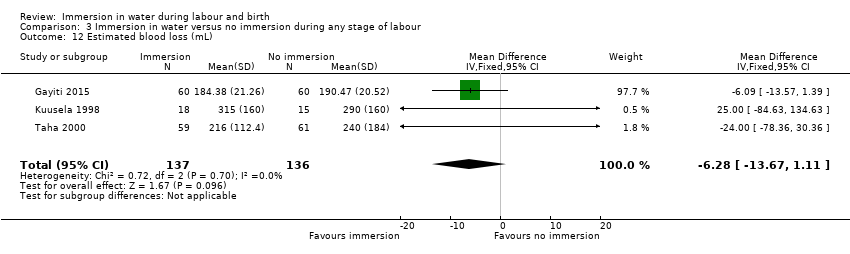
Comparison 3 Immersion in water versus no immersion during any stage of labour, Outcome 12 Estimated blood loss (mL).

Comparison 3 Immersion in water versus no immersion during any stage of labour, Outcome 13 Postpartum haemorrhage.

Comparison 3 Immersion in water versus no immersion during any stage of labour, Outcome 14 Use of analgesia (pharmacological ‐ pethidine/narcotic).
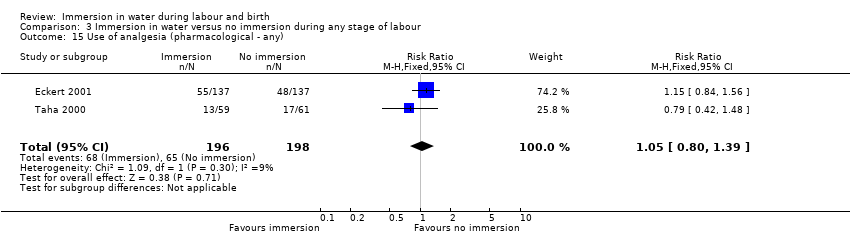
Comparison 3 Immersion in water versus no immersion during any stage of labour, Outcome 15 Use of analgesia (pharmacological ‐ any).

Comparison 3 Immersion in water versus no immersion during any stage of labour, Outcome 16 Use of any analgesia.

Comparison 3 Immersion in water versus no immersion during any stage of labour, Outcome 17 Maternal infection during labour/postnatal period (perineal, systemic, uterine or increase in temperature).

Comparison 3 Immersion in water versus no immersion during any stage of labour, Outcome 18 Artificial rupture of membranes.

Comparison 3 Immersion in water versus no immersion during any stage of labour, Outcome 19 Use of oxytocin for augmentation of labour.

Comparison 3 Immersion in water versus no immersion during any stage of labour, Outcome 20 Use of non‐pharmacological analgesia (transcutaneous nerve stimulation (TENS)).

Comparison 3 Immersion in water versus no immersion during any stage of labour, Outcome 21 Duration of first stage (minutes).

Comparison 3 Immersion in water versus no immersion during any stage of labour, Outcome 22 Duration of second stage (minutes).
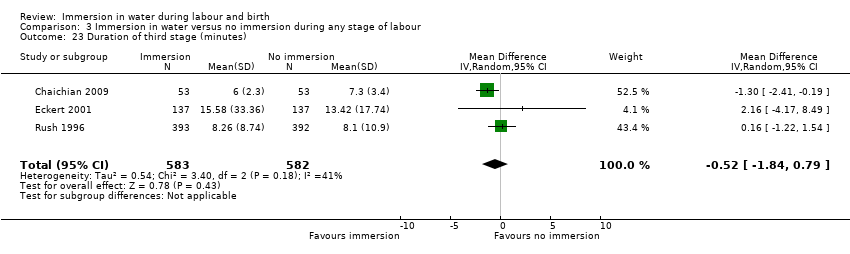
Comparison 3 Immersion in water versus no immersion during any stage of labour, Outcome 23 Duration of third stage (minutes).

Comparison 3 Immersion in water versus no immersion during any stage of labour, Outcome 24 Duration of total labour (all three stages).

Comparison 3 Immersion in water versus no immersion during any stage of labour, Outcome 25 Perineal trauma (none‐ intact).

Comparison 3 Immersion in water versus no immersion during any stage of labour, Outcome 26 Perineal trauma (first‐ and second‐degree tears).

Comparison 3 Immersion in water versus no immersion during any stage of labour, Outcome 27 Perineal trauma (episiotomy).

Comparison 3 Immersion in water versus no immersion during any stage of labour, Outcome 28 Self reports pain score on visual analogue scale of 0‐10.
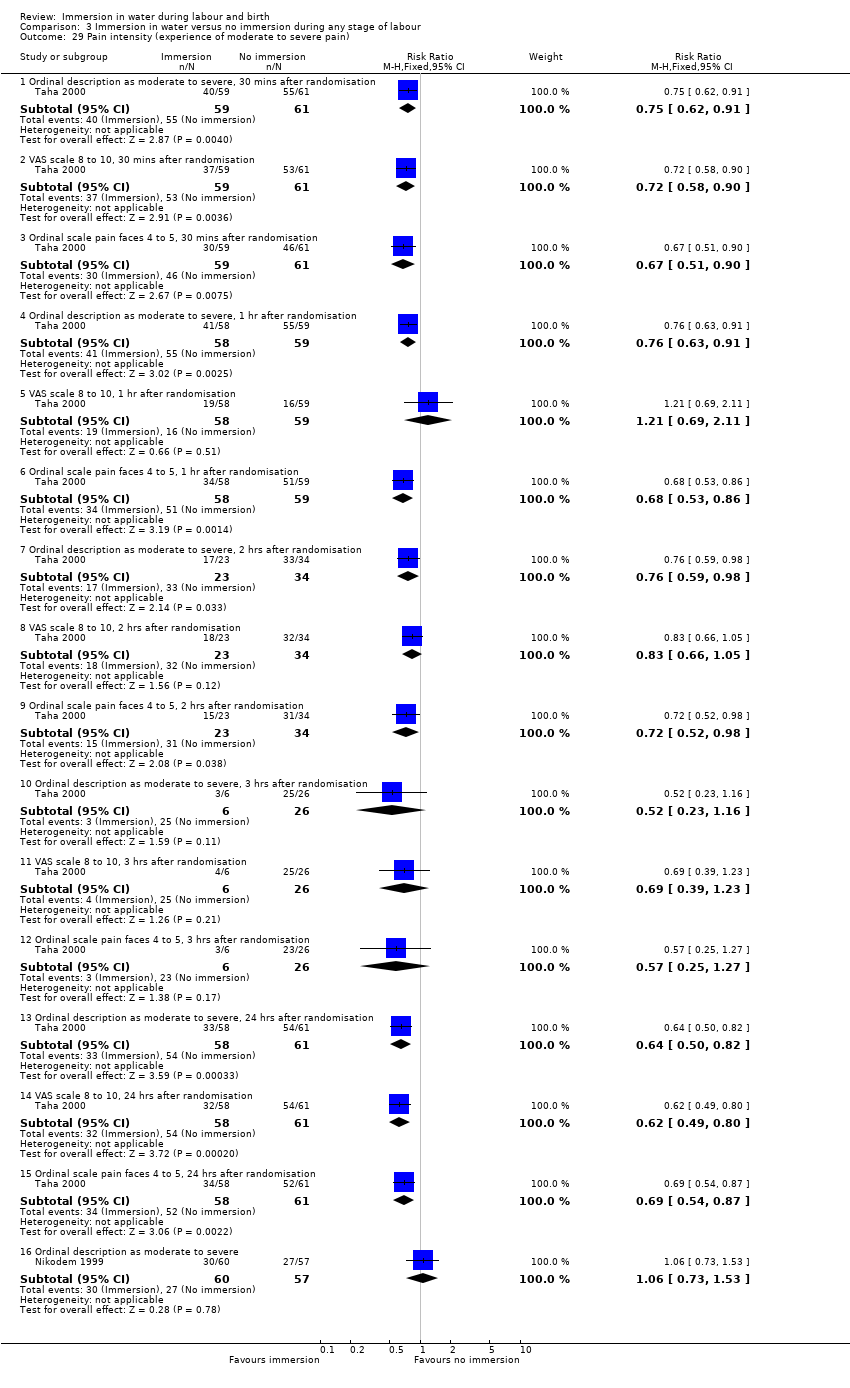
Comparison 3 Immersion in water versus no immersion during any stage of labour, Outcome 29 Pain intensity (experience of moderate to severe pain).
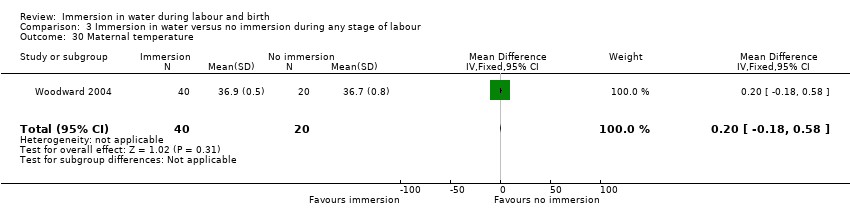
Comparison 3 Immersion in water versus no immersion during any stage of labour, Outcome 30 Maternal temperature.

Comparison 3 Immersion in water versus no immersion during any stage of labour, Outcome 31 Systolic blood pressure.
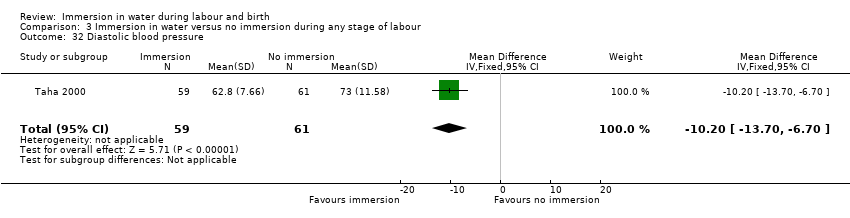
Comparison 3 Immersion in water versus no immersion during any stage of labour, Outcome 32 Diastolic blood pressure.

Comparison 3 Immersion in water versus no immersion during any stage of labour, Outcome 33 Mean arterial blood pressure.
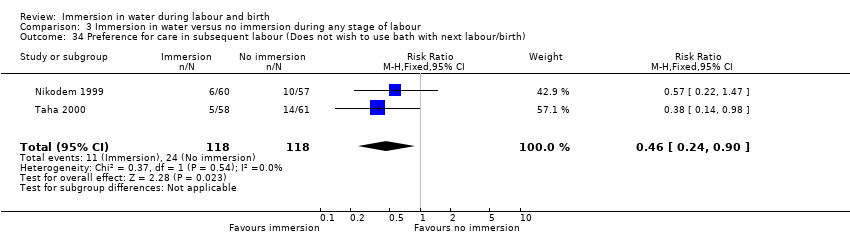
Comparison 3 Immersion in water versus no immersion during any stage of labour, Outcome 34 Preference for care in subsequent labour (Does not wish to use bath with next labour/birth).

Comparison 3 Immersion in water versus no immersion during any stage of labour, Outcome 35 Satisfied with labour.
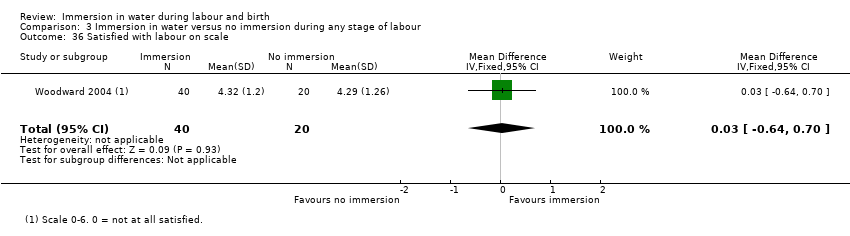
Comparison 3 Immersion in water versus no immersion during any stage of labour, Outcome 36 Satisfied with labour on scale.

Comparison 3 Immersion in water versus no immersion during any stage of labour, Outcome 37 Postpartum depression (EPDS more than 11).
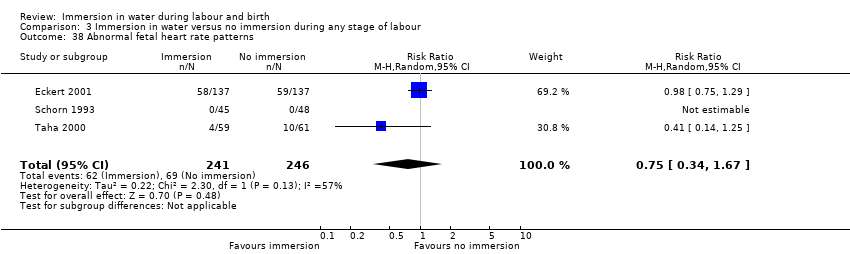
Comparison 3 Immersion in water versus no immersion during any stage of labour, Outcome 38 Abnormal fetal heart rate patterns.
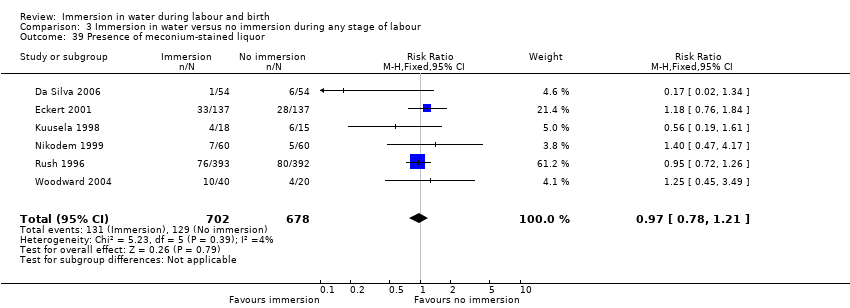
Comparison 3 Immersion in water versus no immersion during any stage of labour, Outcome 39 Presence of meconium‐stained liquor.
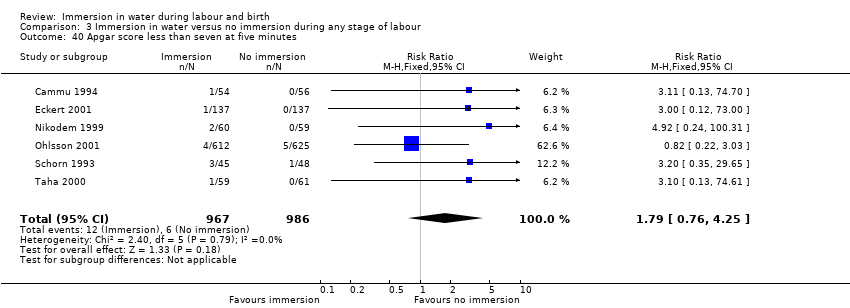
Comparison 3 Immersion in water versus no immersion during any stage of labour, Outcome 40 Apgar score less than seven at five minutes.

Comparison 3 Immersion in water versus no immersion during any stage of labour, Outcome 41 Apgar score at five minutes.

Comparison 3 Immersion in water versus no immersion during any stage of labour, Outcome 42 Umbilical artery pH less than 7.20.

Comparison 3 Immersion in water versus no immersion during any stage of labour, Outcome 43 Breastfeeding.
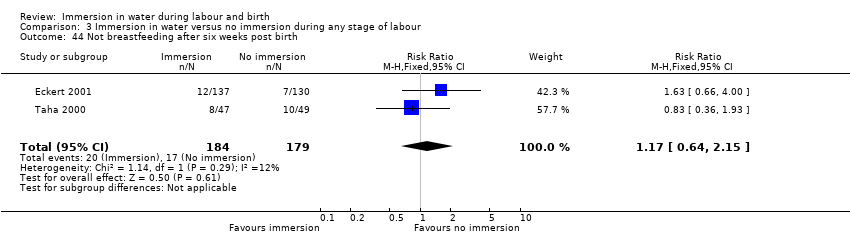
Comparison 3 Immersion in water versus no immersion during any stage of labour, Outcome 44 Not breastfeeding after six weeks post birth.

Comparison 4 Early versus late immersion in water, Outcome 1 Use of pharmacological analgesia (epidural/spinal analgesia/paracervical block).

Comparison 4 Early versus late immersion in water, Outcome 2 Neonatal infection.
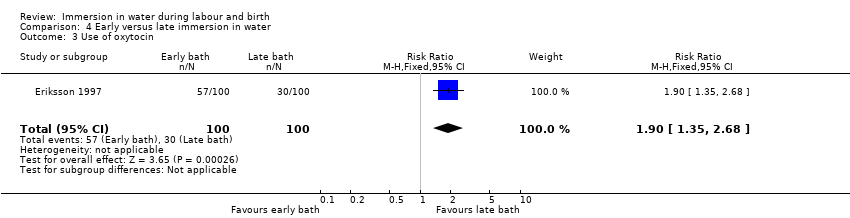
Comparison 4 Early versus late immersion in water, Outcome 3 Use of oxytocin.
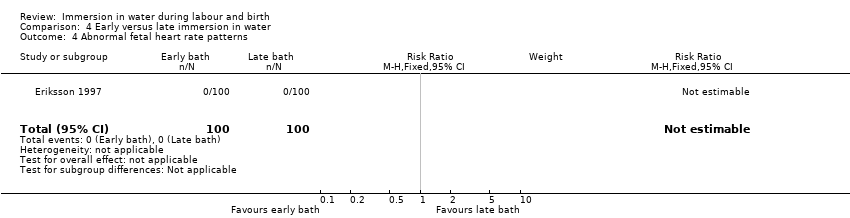
Comparison 4 Early versus late immersion in water, Outcome 4 Abnormal fetal heart rate patterns.

Comparison 4 Early versus late immersion in water, Outcome 5 Apgar score less than seven at one minute.
| Immersion in water compared to no immersion during first stage of labour in water during labour and birth | ||||||
| Patient or population: women in labour | ||||||
| Outcomes | Anticipated absolute effects* (95% CI) | Relative effect | № of participants | Quality of the evidence | Comments | |
| Risk with no immersion during first stage of labour | Risk with immersion in water | |||||
| Mode of birth (spontaneous vaginal birth) | Study population | RR 1.01 | 2559 | ⊕⊕⊕⊝ | ||
| 822 per 1000 | 830 per 1000 | |||||
| Mode of birth (instrumental vaginal birth) | Study population | RR 0.86 (0.70 to 1.05) | 2559 (6 RCTs) | ⊕⊕⊝⊝ | ||
| 138 per 1000 | 119 per 1000 (97 to 1.05) | |||||
| Mode of birth (caesarean section) | Study population | RR 1.27 (0.91 to 1.79) | 2652 (7 RCTs) | ⊕⊕⊝⊝ | ||
| 41 per 1000 | 52 per 1000 (38 to 74) | |||||
| Use of analgesia (regional) | Study population | RR 0.91 | 2439 | ⊕⊕⊕⊝ | ||
| 429 per 1000 | 390 per 1000 | |||||
| Perineal trauma (third‐ or fourth‐degree tears) | Study population | RR 1.36 | 2341 | ⊕⊕⊕⊝ | ||
| 25 per 1000 | 33 per 1000 | |||||
| Perinatal death | Study population | ‐ | ‐ | ‐ | No trial reported this outcome. | |
| see comment | see comment | |||||
| Admission to neonatal intensive care unit | Study population | Average RR 1.30 | 1511 | ⊕⊕⊝⊝ | ||
| 58 per 1000 | 75 per 1000 | |||||
| Neonatal infection | Study population | RR 2.00 | 1295 | ⊕⊝⊝⊝ | ||
| 5 per 1000 | 9 per 1000 | |||||
| Estimated blood loss (mL) | The mean estimated blood loss with immersion was 265.5 mL | MD 14.33 mL lower without immersion | ‐ | 153 | ⊕⊝⊝⊝ | |
| *The risk in the intervention group (and its 95% confidence interval) is based on the assumed risk in the comparison group and the relative effect of the intervention (and its 95% CI). | ||||||
| GRADE Working Group grades of evidence | ||||||
| 1 All trials had design limitations: No trial was blinded, two trials did not randomise adequately, and three did not report all outcomes (‐1) 2 Wide confidence intervals that cross the line of no effect (‐1) 3 All trials had design limitations: No trial was blinded, two trials did not randomise adequately, one did not conceal allocation, and three did not report all outcomes (‐1) 4 Both trials have design limitations: Neither trial was blinded, one trial did not randomise adequately, and both did not report all outcomes (‐1) 5 Few events and wide confidence intervals crossing the line of no effect (‐2) 6 Both trials have design limitations: Neither trial was blinded, one trial did not randomise adequately (‐1) 7 Small sample size and wide confidence intervals crossing the line of no effect (‐2) | ||||||
| Immersion in water compared to no immersion during second stage of labour in water during labour and birth | ||||||
| Patient or population: women in labour | ||||||
| Outcomes | Anticipated absolute effects* (95% CI) | Relative effect | № of participants | Quality of the evidence | Comments | |
| Risk with no immersion during second stage of labour | Risk with immersion in water | |||||
| Mode of birth (spontaneous vaginal birth) | Study population | RR 1.02 | 120 | ⊕⊕⊝⊝ | ||
| 967 per 1000 | 986 per 1000 | |||||
| Mode of birth (instrumental vaginal birth) | Study population | RR 1.00 (0.06 to 15.62) | 120 (1 RCT) | ⊕⊝⊝⊝ | ||
| 17 per 1000 | 17 per 1000 (1 to 260) | |||||
| Mode of birth (caesarean section) | Study population | RR 0.33 (0.01 to 8.02) | 120 (1 RCT) | ⊕⊝⊝⊝ | ||
| 17 per 1000 | 6 per 1000 (0 to 134) | |||||
| Use of analgesia (regional) | Study population | ‐ | ‐ | ‐ | This outcome was not reported as it is not applicable to the second stage of labour. | |
| see comment | see comment | |||||
| Perineal trauma (third‐ or fourth‐degree tears) | Study population | ‐ | ‐ | ‐ | No trial reported this outcome | |
| see comment | see comment | |||||
| Perinatal death | Study population | RR 3.00 | 120 | ⊕⊝⊝⊝ | 1 death occurred in the immersion group in this trial. The infant was born alive to a woman with HIV who was treated 2 weeks previous to birth for vaginal infection. The infant died at 2.5 hours after birth. After investigation the cause of death was determined to be intrauterine infection. | |
| 0 per 1000 | 0 per 1000 | |||||
| Admission to neonatal intensive care unit | Study population | RR 0.78 | 291 | ⊕⊝⊝⊝ | ||
| 108 per 1000 | 84 per 1000 | |||||
| Neonatal infection, including markers of infection such as pyrexia and raised white cell count: Neonatal temperature less than 36.2oC at birth | Study population | RR 0.98 | 109 | ⊕⊝⊝⊝ | Number of neonatal infections was not reported, but temperature was included as a marker of infection. | |
| 93 per 1000 | 91 per 1000 | |||||
| Neonatal infection, including markers of infection such as pyrexia and raised white cell count: Neonatal temperature greater than 37.5oC at birth | Study population | RR 2.62 | 109 | ⊕⊝⊝⊝ | Number of neonatal infections was not reported, but temperature was included as a marker of infection. | |
| 56 per 1000 | 146 per 1000 | |||||
| Neonatal infection, including markers of infection such as pyrexia and raised white cell count: Fever reported in first week | Study population | RR 0.53 | 171 | ⊕⊝⊝⊝ | Number of neonatal infections was not reported, but fever was included as a marker of infection. | |
| 45 per 1000 | 24 per 1000 | |||||
| Estimated blood loss (mL) | Study population | ‐ | ‐ | ‐ | No trial reported this outcome | |
| see comment | see comment | |||||
| *The risk in the intervention group (and its 95% confidence interval) is based on the assumed risk in the comparison group and the relative effect of the intervention (and its 95% CI). | ||||||
| GRADE Working Group grades of evidence | ||||||
| 1 Data from one study with design limitations: trial was not blinded, and did not randomise adequately (‐1) 2 Small sample size (‐1) 3 Small sample size, few events, and wide confidence intervals crossing the line of no effect (‐2) 4 Data from one study with design limitations: trial was not blinded, did not report all outcomes, and was at unclear risk of bias in most domains (‐1) | ||||||
| Outcome or subgroup title | No. of studies | No. of participants | Statistical method | Effect size |
| 1 Mode of birth (spontaneous vaginal birth) Show forest plot | 6 | 2559 | Risk Ratio (M‐H, Fixed, 95% CI) | 1.01 [0.97, 1.04] |
| 2 Mode of birth (instrumental vaginal births) Show forest plot | 6 | 2559 | Risk Ratio (M‐H, Fixed, 95% CI) | 0.86 [0.70, 1.05] |
| 3 Mode of birth (caesarean section) Show forest plot | 7 | 2652 | Risk Ratio (M‐H, Fixed, 95% CI) | 1.27 [0.91, 1.79] |
| 4 Use of analgesia (regional) Show forest plot | 5 | 2439 | Risk Ratio (M‐H, Fixed, 95% CI) | 0.91 [0.83, 0.99] |
| 5 Perineal trauma (third‐ or fourth‐degree tears) Show forest plot | 4 | 2341 | Risk Ratio (M‐H, Fixed, 95% CI) | 1.36 [0.85, 2.18] |
| 6 Admission to neonatal intensive care unit Show forest plot | 2 | 1511 | Risk Ratio (M‐H, Random, 95% CI) | 1.30 [0.42, 3.97] |
| 7 Neonatal infection Show forest plot | 5 | 1295 | Risk Ratio (M‐H, Fixed, 95% CI) | 2.00 [0.50, 7.94] |
| 8 Neonate temperature Show forest plot | 1 | Risk Ratio (M‐H, Fixed, 95% CI) | Subtotals only | |
| 8.1 Temperature greater than 37.8 degrees C as an indicator for infection | 1 | 274 | Risk Ratio (M‐H, Fixed, 95% CI) | 1.0 [0.06, 15.83] |
| 9 Estimated blood loss (mL) Show forest plot | 2 | 153 | Mean Difference (IV, Fixed, 95% CI) | ‐14.33 [‐63.03, 34.37] |
| 10 Postpartum haemorrhage Show forest plot | 1 | 274 | Risk Ratio (M‐H, Fixed, 95% CI) | 1.58 [0.80, 3.13] |
| 11 Use of analgesia (pharmacological ‐ pethidine/narcotic) Show forest plot | 3 | 1180 | Risk Ratio (M‐H, Random, 95% CI) | 1.08 [0.59, 1.96] |
| 12 Use of any analgesia Show forest plot | 3 | 487 | Risk Ratio (M‐H, Fixed, 95% CI) | 0.99 [0.88, 1.12] |
| 13 Use of analgesia (pharmacological ‐ any) Show forest plot | 2 | 394 | Risk Ratio (M‐H, Fixed, 95% CI) | 1.05 [0.80, 1.39] |
| 14 Maternal infection during labour/postnatal period (perineal, systemic, uterine or increase in temperature) Show forest plot | 5 | 1295 | Risk Ratio (M‐H, Fixed, 95% CI) | 0.99 [0.50, 1.96] |
| 15 Artificial rupture of membranes Show forest plot | 3 | 926 | Risk Ratio (M‐H, Fixed, 95% CI) | 1.02 [0.90, 1.16] |
| 16 Use of oxytocin for augmentation of labour Show forest plot | 4 | 1019 | Risk Ratio (M‐H, Fixed, 95% CI) | 0.91 [0.72, 1.15] |
| 17 Use of non‐pharmacological analgesia (transcutaneous nerve stimulation (TENS) Show forest plot | 1 | 785 | Risk Ratio (M‐H, Fixed, 95% CI) | 1.25 [0.34, 4.61] |
| 18 Duration of first stage (minutes) Show forest plot | 5 | 1295 | Mean Difference (IV, Fixed, 95% CI) | ‐11.53 [‐45.42, 22.36] |
| 19 Duration of second stage (minutes) Show forest plot | 6 | 1403 | Mean Difference (IV, Random, 95% CI) | 1.12 [‐5.23, 7.48] |
| 20 Duration of third stage (minutes) Show forest plot | 2 | 1059 | Mean Difference (IV, Fixed, 95% CI) | 0.25 [‐1.10, 1.60] |
| 21 Duration of total labour (all three stages minutes) Show forest plot | 1 | 120 | Mean Difference (IV, Fixed, 95% CI) | ‐27.5 [‐133.05, 78.05] |
| 22 Perineal trauma (intact) Show forest plot | 4 | 1277 | Risk Ratio (M‐H, Fixed, 95% CI) | 1.17 [1.01, 1.37] |
| 23 Perineal trauma (second‐degree tears) Show forest plot | 4 | 1212 | Risk Ratio (M‐H, Fixed, 95% CI) | 0.94 [0.74, 1.20] |
| 24 Perineal trauma (episiotomy) Show forest plot | 4 | 1212 | Risk Ratio (M‐H, Fixed, 95% CI) | 0.94 [0.80, 1.09] |
| 25 Self reports pain score on visual analogue scale of 0‐10 Show forest plot | 2 | Mean Difference (IV, Random, 95% CI) | Subtotals only | |
| 25.1 Pain score at start of assessment period (time zero) | 2 | 141 | Mean Difference (IV, Random, 95% CI) | 0.15 [‐0.79, 1.08] |
| 25.2 Pain score up to 60 minutes later | 2 | 141 | Mean Difference (IV, Random, 95% CI) | ‐0.81 [‐1.34, ‐0.28] |
| 26 Pain intensity (experience of moderate to severe pain) Show forest plot | 1 | Risk Ratio (M‐H, Fixed, 95% CI) | Subtotals only | |
| 26.1 Ordinal description as moderate to severe, 30 mins after randomisation | 1 | 120 | Risk Ratio (M‐H, Fixed, 95% CI) | 0.75 [0.62, 0.91] |
| 26.2 VAS scale 8 to 10, 30 mins after randomisation | 1 | 120 | Risk Ratio (M‐H, Fixed, 95% CI) | 0.72 [0.58, 0.90] |
| 26.3 Ordinal scale pain faces 4 to 5, 30 mins after randomisation | 1 | 120 | Risk Ratio (M‐H, Fixed, 95% CI) | 0.67 [0.51, 0.90] |
| 26.4 Ordinal description as moderate to severe, 1 hr after randomisation | 1 | 117 | Risk Ratio (M‐H, Fixed, 95% CI) | 0.76 [0.63, 0.91] |
| 26.5 VAS scale 8 to 10, 1 hr after randomisation | 1 | 117 | Risk Ratio (M‐H, Fixed, 95% CI) | 1.21 [0.69, 2.11] |
| 26.6 Ordinal scale pain faces 4 to 5, 1 hr after randomisation | 1 | 117 | Risk Ratio (M‐H, Fixed, 95% CI) | 0.68 [0.53, 0.86] |
| 26.7 Ordinal description as moderate to severe, 2 hrs after randomisation | 1 | 57 | Risk Ratio (M‐H, Fixed, 95% CI) | 0.76 [0.59, 0.98] |
| 26.8 VAS scale 8 to 10, 2 hrs after randomisation | 1 | 57 | Risk Ratio (M‐H, Fixed, 95% CI) | 0.83 [0.66, 1.05] |
| 26.9 Ordinal scale pain faces 4 to 5, 2 hrs after randomisation | 1 | 57 | Risk Ratio (M‐H, Fixed, 95% CI) | 0.72 [0.52, 0.98] |
| 26.10 Ordinal description as moderate to severe, 3 hrs after randomisation | 1 | 32 | Risk Ratio (M‐H, Fixed, 95% CI) | 0.52 [0.23, 1.16] |
| 26.11 VAS scale 8 to 10, 3 hrs after randomisation | 1 | 32 | Risk Ratio (M‐H, Fixed, 95% CI) | 0.69 [0.39, 1.23] |
| 26.12 Ordinal scale pain faces 4 to 5, 3 hrs after randomisation | 1 | 32 | Risk Ratio (M‐H, Fixed, 95% CI) | 0.57 [0.25, 1.27] |
| 26.13 Ordinal description as moderate to severe, 24 hrs after randomisation | 1 | 119 | Risk Ratio (M‐H, Fixed, 95% CI) | 0.64 [0.50, 0.82] |
| 26.14 VAS scale 8 to 10, 24 hrs after randomisation | 1 | 119 | Risk Ratio (M‐H, Fixed, 95% CI) | 0.62 [0.49, 0.80] |
| 26.15 Ordinal scale pain faces 4 to 5, 24 hrs after randomisation | 1 | 119 | Risk Ratio (M‐H, Fixed, 95% CI) | 0.69 [0.54, 0.87] |
| 27 Systolic blood pressure Show forest plot | 1 | 120 | Mean Difference (IV, Fixed, 95% CI) | ‐7.20 [‐13.12, ‐1.28] |
| 28 Diastolic blood pressure Show forest plot | 1 | 120 | Mean Difference (IV, Fixed, 95% CI) | ‐10.20 [‐13.70, ‐6.70] |
| 29 Mean arterial blood pressure Show forest plot | 1 | 120 | Mean Difference (IV, Fixed, 95% CI) | ‐10.5 [‐14.68, ‐6.32] |
| 30 Preference for care in subsequent labour (Does not wish to use bath with next labour/birth) Show forest plot | 1 | 119 | Risk Ratio (M‐H, Fixed, 95% CI) | 0.38 [0.14, 0.98] |
| 31 Postpartum depression (EPDS more than 11) Show forest plot | 2 | 370 | Risk Ratio (M‐H, Fixed, 95% CI) | 1.38 [0.85, 2.24] |
| 32 Abnormal fetal heart rate patterns Show forest plot | 3 | 487 | Risk Ratio (M‐H, Random, 95% CI) | 0.75 [0.34, 1.67] |
| 33 Presence of meconium‐stained liquor Show forest plot | 4 | 1200 | Risk Ratio (M‐H, Random, 95% CI) | 0.92 [0.64, 1.33] |
| 34 Apgar score less than seven at five minutes Show forest plot | 5 | 1834 | Risk Ratio (M‐H, Fixed, 95% CI) | 1.58 [0.63, 3.93] |
| 35 Apgar score at five minutes Show forest plot | 2 | 893 | Mean Difference (IV, Fixed, 95% CI) | ‐0.03 [‐0.11, 0.06] |
| 36 Umbilical artery pH less than 7.20 Show forest plot | 1 | 110 | Risk Ratio (M‐H, Fixed, 95% CI) | 5.18 [0.25, 105.51] |
| 37 Breastfeeding ‐ not breastfeeding after six weeks post birth Show forest plot | 2 | 363 | Risk Ratio (M‐H, Fixed, 95% CI) | 1.17 [0.64, 2.15] |
| Outcome or subgroup title | No. of studies | No. of participants | Statistical method | Effect size |
| 1 Mode of birth (spontaneous vaginal birth) Show forest plot | 1 | 120 | Risk Ratio (M‐H, Fixed, 95% CI) | 1.02 [0.96, 1.08] |
| 2 Mode of birth (instrumental vaginal births) Show forest plot | 1 | 120 | Risk Ratio (M‐H, Fixed, 95% CI) | 1.0 [0.06, 15.62] |
| 3 Mode of birth (caesarean section) Show forest plot | 1 | 120 | Risk Ratio (M‐H, Fixed, 95% CI) | 0.33 [0.01, 8.02] |
| 4 Perinatal deaths Show forest plot | 1 | 120 | Risk Ratio (M‐H, Fixed, 95% CI) | 3.0 [0.12, 72.20] |
| 5 Admission to neonatal intensive care unit Show forest plot | 2 | 291 | Risk Ratio (M‐H, Fixed, 95% CI) | 0.78 [0.38, 1.59] |
| 6 Neonate temperature Show forest plot | 1 | Risk Ratio (M‐H, Fixed, 95% CI) | Subtotals only | |
| 6.1 Temperature less than 36.2 degrees C at birth | 1 | 109 | Risk Ratio (M‐H, Fixed, 95% CI) | 0.98 [0.30, 3.20] |
| 6.2 Temperature greater than 37.5 degrees C at birth | 1 | 109 | Risk Ratio (M‐H, Fixed, 95% CI) | 2.62 [0.73, 9.35] |
| 7 Fever reported in first week Show forest plot | 1 | 171 | Risk Ratio (M‐H, Fixed, 95% CI) | 0.53 [0.10, 2.82] |
| 8 Postpartum haemorrhage more than 500 mL Show forest plot | 1 | 120 | Risk Ratio (M‐H, Fixed, 95% CI) | 0.14 [0.01, 2.71] |
| 9 Duration of second stage (minutes) Show forest plot | 2 | 291 | Mean Difference (IV, Fixed, 95% CI) | ‐1.83 [‐8.18, 4.52] |
| 10 Perineal trauma (episiotomy) Show forest plot | 1 | 119 | Risk Ratio (M‐H, Fixed, 95% CI) | 0.74 [0.17, 3.15] |
| 11 Perineal trauma (second degree tear) Show forest plot | 1 | 119 | Risk Ratio (M‐H, Fixed, 95% CI) | 1.16 [0.57, 2.38] |
| 12 Experience of moderate to severe pain Show forest plot | 1 | 117 | Risk Ratio (M‐H, Fixed, 95% CI) | 1.06 [0.73, 1.53] |
| 12.1 Ordinal description as moderate to severe | 1 | 117 | Risk Ratio (M‐H, Fixed, 95% CI) | 1.06 [0.73, 1.53] |
| 13 Preference for care in subsequent labour (Does not wish to use bath next birth) Show forest plot | 1 | 117 | Risk Ratio (M‐H, Fixed, 95% CI) | 0.57 [0.22, 1.47] |
| 14 Satisfied with labour Show forest plot | 1 | 117 | Risk Ratio (M‐H, Fixed, 95% CI) | 0.24 [0.07, 0.80] |
| 14.1 Little or not satisfied with coping experience | 1 | 117 | Risk Ratio (M‐H, Fixed, 95% CI) | 0.24 [0.07, 0.80] |
| 15 Presence of meconium‐stained liquor Show forest plot | 1 | 120 | Risk Ratio (M‐H, Fixed, 95% CI) | 1.4 [0.47, 4.17] |
| 16 Apgar score less than seven (five minutes) Show forest plot | 1 | 119 | Risk Ratio (M‐H, Fixed, 95% CI) | 4.92 [0.24, 100.31] |
| 17 Mean Apgar at five minutes Show forest plot | 1 | 171 | Mean Difference (IV, Fixed, 95% CI) | ‐0.10 [‐0.22, 0.02] |
| 18 Umbilical artery pH less than 7.20 Show forest plot | 1 | 116 | Risk Ratio (M‐H, Fixed, 95% CI) | 0.89 [0.45, 1.75] |
| Outcome or subgroup title | No. of studies | No. of participants | Statistical method | Effect size |
| 1 Mode of birth (spontaneous vaginal birth) Show forest plot | 9 | 2845 | Risk Ratio (M‐H, Random, 95% CI) | 1.03 [0.99, 1.09] |
| 2 Mode of birth (instrumental vaginal births) Show forest plot | 8 | 2739 | Risk Ratio (M‐H, Fixed, 95% CI) | 0.86 [0.70, 1.04] |
| 3 Mode of birth (caesarean section) Show forest plot | 9 | 2832 | Risk Ratio (M‐H, Fixed, 95% CI) | 1.19 [0.86, 1.65] |
| 4 Use of analgesia (regional) Show forest plot | 6 | 2499 | Risk Ratio (M‐H, Fixed, 95% CI) | 0.90 [0.82, 0.98] |
| 5 Perineal trauma (third‐ or fourth‐degree tears) Show forest plot | 5 | 2401 | Risk Ratio (M‐H, Fixed, 95% CI) | 1.37 [0.86, 2.17] |
| 6 Perinatal deaths Show forest plot | 1 | 120 | Risk Ratio (M‐H, Fixed, 95% CI) | 3.0 [0.12, 72.20] |
| 7 Admission to neonatal intensive care unit Show forest plot | 5 | 1862 | Risk Ratio (M‐H, Fixed, 95% CI) | 0.99 [0.70, 1.39] |
| 8 Neonatal infection Show forest plot | 5 | 1295 | Risk Ratio (M‐H, Fixed, 95% CI) | 2.00 [0.50, 7.94] |
| 9 Neonate temperature Show forest plot | 2 | Risk Ratio (M‐H, Fixed, 95% CI) | Subtotals only | |
| 9.1 Temperature greater than 37.8 degrees C as an indicator for infection | 1 | 274 | Risk Ratio (M‐H, Fixed, 95% CI) | 1.0 [0.06, 15.83] |
| 9.2 Temperature less than 36.2 degrees C at birth | 1 | 109 | Risk Ratio (M‐H, Fixed, 95% CI) | 0.98 [0.30, 3.20] |
| 9.3 Temperature greater than 37.5 degrees C at birth | 1 | 109 | Risk Ratio (M‐H, Fixed, 95% CI) | 2.62 [0.73, 9.35] |
| 10 Fever reported in first week Show forest plot | 1 | 171 | Risk Ratio (M‐H, Fixed, 95% CI) | 0.53 [0.10, 2.82] |
| 11 Antibiotics given to neonate Show forest plot | 1 | 60 | Risk Ratio (M‐H, Fixed, 95% CI) | 1.5 [0.17, 13.52] |
| 12 Estimated blood loss (mL) Show forest plot | 3 | 273 | Mean Difference (IV, Fixed, 95% CI) | ‐6.28 [‐13.67, 1.11] |
| 13 Postpartum haemorrhage Show forest plot | 2 | 394 | Risk Ratio (M‐H, Random, 95% CI) | 0.73 [0.08, 6.90] |
| 14 Use of analgesia (pharmacological ‐ pethidine/narcotic) Show forest plot | 4 | 1240 | Risk Ratio (M‐H, Random, 95% CI) | 0.85 [0.46, 1.56] |
| 15 Use of analgesia (pharmacological ‐ any) Show forest plot | 2 | 394 | Risk Ratio (M‐H, Fixed, 95% CI) | 1.05 [0.80, 1.39] |
| 16 Use of any analgesia Show forest plot | 5 | 653 | Risk Ratio (M‐H, Random, 95% CI) | 0.72 [0.46, 1.12] |
| 17 Maternal infection during labour/postnatal period (perineal, systemic, uterine or increase in temperature) Show forest plot | 5 | 1295 | Risk Ratio (M‐H, Fixed, 95% CI) | 0.99 [0.50, 1.96] |
| 18 Artificial rupture of membranes Show forest plot | 3 | 926 | Risk Ratio (M‐H, Fixed, 95% CI) | 1.02 [0.90, 1.16] |
| 19 Use of oxytocin for augmentation of labour Show forest plot | 5 | 1125 | Risk Ratio (M‐H, Random, 95% CI) | 0.64 [0.32, 1.28] |
| 20 Use of non‐pharmacological analgesia (transcutaneous nerve stimulation (TENS)) Show forest plot | 2 | 845 | Risk Ratio (M‐H, Fixed, 95% CI) | 1.05 [0.37, 2.94] |
| 21 Duration of first stage (minutes) Show forest plot | 8 | 1561 | Mean Difference (IV, Random, 95% CI) | ‐42.21 [‐80.93, ‐3.49] |
| 22 Duration of second stage (minutes) Show forest plot | 11 | 1960 | Mean Difference (IV, Random, 95% CI) | ‐2.85 [‐8.85, 3.16] |
| 23 Duration of third stage (minutes) Show forest plot | 3 | 1165 | Mean Difference (IV, Random, 95% CI) | ‐0.52 [‐1.84, 0.79] |
| 24 Duration of total labour (all three stages) Show forest plot | 2 | 240 | Mean Difference (IV, Fixed, 95% CI) | ‐40.83 [‐87.09, 5.43] |
| 25 Perineal trauma (none‐ intact) Show forest plot | 5 | 1337 | Risk Ratio (M‐H, Fixed, 95% CI) | 1.16 [0.99, 1.35] |
| 26 Perineal trauma (first‐ and second‐degree tears) Show forest plot | 7 | Risk Ratio (M‐H, Fixed, 95% CI) | Subtotals only | |
| 26.1 Second‐degree tear | 7 | 1525 | Risk Ratio (M‐H, Fixed, 95% CI) | 0.89 [0.71, 1.10] |
| 27 Perineal trauma (episiotomy) Show forest plot | 7 | 1511 | Risk Ratio (M‐H, Random, 95% CI) | 0.88 [0.67, 1.17] |
| 28 Self reports pain score on visual analogue scale of 0‐10 Show forest plot | 3 | Mean Difference (IV, Random, 95% CI) | Subtotals only | |
| 28.1 Pain score at start of assessment period (time zero) | 2 | 141 | Mean Difference (IV, Random, 95% CI) | 0.15 [‐0.79, 1.08] |
| 28.2 Pain score up to 60 minutes later | 2 | 141 | Mean Difference (IV, Random, 95% CI) | ‐0.81 [‐1.34, ‐0.28] |
| 28.3 overall pain score (assessed once post labour) | 1 | 100 | Mean Difference (IV, Random, 95% CI) | ‐3.43 [‐3.95, ‐2.91] |
| 29 Pain intensity (experience of moderate to severe pain) Show forest plot | 2 | Risk Ratio (M‐H, Fixed, 95% CI) | Subtotals only | |
| 29.1 Ordinal description as moderate to severe, 30 mins after randomisation | 1 | 120 | Risk Ratio (M‐H, Fixed, 95% CI) | 0.75 [0.62, 0.91] |
| 29.2 VAS scale 8 to 10, 30 mins after randomisation | 1 | 120 | Risk Ratio (M‐H, Fixed, 95% CI) | 0.72 [0.58, 0.90] |
| 29.3 Ordinal scale pain faces 4 to 5, 30 mins after randomisation | 1 | 120 | Risk Ratio (M‐H, Fixed, 95% CI) | 0.67 [0.51, 0.90] |
| 29.4 Ordinal description as moderate to severe, 1 hr after randomisation | 1 | 117 | Risk Ratio (M‐H, Fixed, 95% CI) | 0.76 [0.63, 0.91] |
| 29.5 VAS scale 8 to 10, 1 hr after randomisation | 1 | 117 | Risk Ratio (M‐H, Fixed, 95% CI) | 1.21 [0.69, 2.11] |
| 29.6 Ordinal scale pain faces 4 to 5, 1 hr after randomisation | 1 | 117 | Risk Ratio (M‐H, Fixed, 95% CI) | 0.68 [0.53, 0.86] |
| 29.7 Ordinal description as moderate to severe, 2 hrs after randomisation | 1 | 57 | Risk Ratio (M‐H, Fixed, 95% CI) | 0.76 [0.59, 0.98] |
| 29.8 VAS scale 8 to 10, 2 hrs after randomisation | 1 | 57 | Risk Ratio (M‐H, Fixed, 95% CI) | 0.83 [0.66, 1.05] |
| 29.9 Ordinal scale pain faces 4 to 5, 2 hrs after randomisation | 1 | 57 | Risk Ratio (M‐H, Fixed, 95% CI) | 0.72 [0.52, 0.98] |
| 29.10 Ordinal description as moderate to severe, 3 hrs after randomisation | 1 | 32 | Risk Ratio (M‐H, Fixed, 95% CI) | 0.52 [0.23, 1.16] |
| 29.11 VAS scale 8 to 10, 3 hrs after randomisation | 1 | 32 | Risk Ratio (M‐H, Fixed, 95% CI) | 0.69 [0.39, 1.23] |
| 29.12 Ordinal scale pain faces 4 to 5, 3 hrs after randomisation | 1 | 32 | Risk Ratio (M‐H, Fixed, 95% CI) | 0.57 [0.25, 1.27] |
| 29.13 Ordinal description as moderate to severe, 24 hrs after randomisation | 1 | 119 | Risk Ratio (M‐H, Fixed, 95% CI) | 0.64 [0.50, 0.82] |
| 29.14 VAS scale 8 to 10, 24 hrs after randomisation | 1 | 119 | Risk Ratio (M‐H, Fixed, 95% CI) | 0.62 [0.49, 0.80] |
| 29.15 Ordinal scale pain faces 4 to 5, 24 hrs after randomisation | 1 | 119 | Risk Ratio (M‐H, Fixed, 95% CI) | 0.69 [0.54, 0.87] |
| 29.16 Ordinal description as moderate to severe | 1 | 117 | Risk Ratio (M‐H, Fixed, 95% CI) | 1.06 [0.73, 1.53] |
| 30 Maternal temperature Show forest plot | 1 | 60 | Mean Difference (IV, Fixed, 95% CI) | 0.20 [‐0.18, 0.58] |
| 31 Systolic blood pressure Show forest plot | 1 | 120 | Mean Difference (IV, Fixed, 95% CI) | ‐7.20 [‐13.12, ‐1.28] |
| 32 Diastolic blood pressure Show forest plot | 1 | 120 | Mean Difference (IV, Fixed, 95% CI) | ‐10.20 [‐13.70, ‐6.70] |
| 33 Mean arterial blood pressure Show forest plot | 1 | 120 | Mean Difference (IV, Fixed, 95% CI) | ‐10.5 [‐14.68, ‐6.32] |
| 34 Preference for care in subsequent labour (Does not wish to use bath with next labour/birth) Show forest plot | 2 | 236 | Risk Ratio (M‐H, Fixed, 95% CI) | 0.46 [0.24, 0.90] |
| 35 Satisfied with labour Show forest plot | 1 | 117 | Risk Ratio (M‐H, Fixed, 95% CI) | 0.24 [0.07, 0.80] |
| 35.1 Little or not satisfied with coping experience | 1 | 117 | Risk Ratio (M‐H, Fixed, 95% CI) | 0.24 [0.07, 0.80] |
| 36 Satisfied with labour on scale Show forest plot | 1 | 60 | Mean Difference (IV, Fixed, 95% CI) | 0.03 [‐0.64, 0.70] |
| 37 Postpartum depression (EPDS more than 11) Show forest plot | 2 | 370 | Risk Ratio (M‐H, Fixed, 95% CI) | 1.38 [0.85, 2.24] |
| 38 Abnormal fetal heart rate patterns Show forest plot | 3 | 487 | Risk Ratio (M‐H, Random, 95% CI) | 0.75 [0.34, 1.67] |
| 39 Presence of meconium‐stained liquor Show forest plot | 6 | 1380 | Risk Ratio (M‐H, Fixed, 95% CI) | 0.97 [0.78, 1.21] |
| 40 Apgar score less than seven at five minutes Show forest plot | 6 | 1953 | Risk Ratio (M‐H, Fixed, 95% CI) | 1.79 [0.76, 4.25] |
| 41 Apgar score at five minutes Show forest plot | 4 | 1184 | Mean Difference (IV, Fixed, 95% CI) | ‐0.04 [‐0.11, 0.02] |
| 42 Umbilical artery pH less than 7.20 Show forest plot | 2 | 226 | Risk Ratio (M‐H, Fixed, 95% CI) | 1.04 [0.54, 1.98] |
| 43 Breastfeeding Show forest plot | 1 | 60 | Risk Ratio (M‐H, Fixed, 95% CI) | 0.86 [0.69, 1.08] |
| 44 Not breastfeeding after six weeks post birth Show forest plot | 2 | 363 | Risk Ratio (M‐H, Fixed, 95% CI) | 1.17 [0.64, 2.15] |
| Outcome or subgroup title | No. of studies | No. of participants | Statistical method | Effect size |
| 1 Use of pharmacological analgesia (epidural/spinal analgesia/paracervical block) Show forest plot | 1 | 200 | Risk Ratio (M‐H, Fixed, 95% CI) | 2.21 [1.39, 3.52] |
| 2 Neonatal infection Show forest plot | 1 | 200 | Risk Ratio (M‐H, Fixed, 95% CI) | 3.0 [0.12, 72.77] |
| 3 Use of oxytocin Show forest plot | 1 | 200 | Risk Ratio (M‐H, Fixed, 95% CI) | 1.9 [1.35, 2.68] |
| 4 Abnormal fetal heart rate patterns Show forest plot | 1 | 200 | Risk Ratio (M‐H, Fixed, 95% CI) | 0.0 [0.0, 0.0] |
| 5 Apgar score less than seven at one minute Show forest plot | 1 | 200 | Risk Ratio (M‐H, Fixed, 95% CI) | 0.0 [0.0, 0.0] |