ونتیلاسیون نوسانی انتخابی با فرکانس بالا در مقابل ونتیلاسیون متداول در مدیریت بالینی اختلال عملکرد حاد ریوی در نوزادان نارس
Referencias
منابع مطالعات واردشده در این مرور
منابع مطالعات خارجشده از این مرور
منابع مطالعات در انتظار ارزیابی
منابع مطالعات در حال انجام
منابع اضافی
منابع دیگر نسخههای منتشرشده این مرور
Characteristics of studies
Characteristics of included studies [ordered by year of study]
| Methods | Multicentre (11) randomised controlled trial | |
| Participants | Inclusion criteria: ‐ birth weight 750 to 2000 g ‐ respiratory failure in first 24 hrs of life; those at 1250 to 2000 g only eligible if severe RDS ‐ receiving < 12 hrs of mechanical ventilation Exclusion criteria: meconium aspiration; neuromuscular disease; hydrops fetalis; major congenital malformations; hypoplastic lungs Stratification: by centre; by birth weight (from 750 to 1500 g in 250 g strata, 1501 to 2000 g in single stratum) 673 infants enrolled (12 withdrawals, died or consent withdrawn before treated) Mean gestational age: 28.4 ± 2.3 wk in HFOV, 28.3 ± 2.2 in CV Mean birth weight: 1092 ± 294 g in HFOV, 1087 ± 281 g in CV Antenatal corticosteroids: not reported Mean age at randomisation: 6.1 ± 4.6 hrs in HFOV, 5.8 ± 4.0 hrs in CV | |
| Interventions | HFOV: OSC using Hummingbird. Settings: initial MAP same or below MAP on CV, 15 Hz HVS: no. Hypoxaemia first treated by increasing FiO2, and thereafter by increasing MAP CV: IMV. Settings: rate 20 to 40/min, IT 0.3 to 1.0 sec, PIP 20 to 25 cmH2O, PEEP 2 to 5 cm H2O. LPS: no. Target PCO2: 35 to 60 mmHg Duration of assigned treatment: until extubation, unless infant meets failure criteria Cross‐over: if infants meet failure criteria (failure to oxygenate or ventilate adequately with assigned ventilator) | |
| Outcomes | Chronic lung disease (CLD) = oxygen therapy at 28 days and abnormal chest x‐ray; mortality at 28 days; pulmonary air leak (± pneumothorax); all IVH; grade 3 and 4 IVH; PVL; mechanical ventilation at 28 days; failure of assigned treatment (PaO2 < 45 mmHg or PaCO2 > 65 mmHg; NEC; use of vasopressors; pulmonary function at 9 months (432, 82% of survivors); neurodevelopmental outcome at 16 to 24 months (386, 74% of survivors) | |
| Notes | Surfactant: not used (not available) Cross‐over: 26% in HFOV, 17% in CV Postnatal corticosteroids: 12% in HFOV, 9% in CV | |
| Risk of bias | ||
| Bias | Authors' judgement | Support for judgement |
| Random sequence generation (selection bias) | Low risk | Quote: "computer generated randomisation scheme" |
| Allocation concealment (selection bias) | Unclear risk | No information on randomisation procedure |
| Blinding of participants and personnel (performance bias) | High risk | Blinding was not possible for care‐givers and not relevant for patients |
| Blinding of outcome assessment (detection bias) | Unclear risk | Blinding of outcome assessment was not relevant for most outcomes (death, oxygen dependency). No information on blinding for other outcomes |
| Incomplete outcome data (attrition bias) | Low risk | Complete follow‐up for primary outcome (CLD, 98.3%); completeness of follow‐up for longer‐term outcomes: 74% to 82% |
| Methods | Single centre randomised controlled trial | |
| Participants | Inclusion criteria: ‐ gestational age < 35 weeks ‐ birth weight < 1751 g ‐ requiring mechanical ventilation ‐ younger than 24 hours Exclusion criteria: positive blood culture; lethal congenital anomaly; hydrops fetalis; congenital diagrammatic hernia Stratification: by birth weight: < 1001 versus 1001 to 1750 g; by age: 0 to 12 versus 12 to 24 hrs 152 infants eligible, 98 (63%) enrolled: 78% inborn; RDS chest x‐ray score at entry HFOV > CV; 15 post‐randomisation exclusions in publication ‐ data retrieved from author Mean gestational age: 28 ± 3 wk in HFOV and in CV Mean birth weight: 1080 ± 310 g in HFOV, 1080 ± 340 g in CV Antenatal corticosteroids: 12% in HFOV and 13% in CV Mean age at randomisation: 7 hrs in HFOV, 9 hrs in CV | |
| Interventions | HFOV: OSC using Sensormedics 3100. Settings: MAP 1 to 2 cm H2O higher than CV, 10 Hz, I:E ratio 1:2 HVS: yes; increase MAP to optimise oxygenation, wean FiO2 first, once FiO2 < 0.6 priority to wean MAP LPS: no Target PCO2: 35 to 55 mmHg Duration of assigned treatment: HFOV until extubation Cross‐over: balanced crossover design, offering patients failing to respond to the assigned mode a trial of the alternative mode. Failure criteria: failure to maintain adequate oxygenation (PO2 > 50 mmHg) or ventilation (PCO2 > 60 mmHg) for 3 hrs | |
| Outcomes | Chronic lung disease (CLD) = oxygen therapy at 30 days + abnormal chest x‐ray; oxygen therapy at 36 weeks postmenstrual age; failure of assigned treatment to maintain PaO2 > 50 mmHg or PaCO2 < 60 mmHg or in CV group development of pulmonary air leak; pulmonary air leak (± pneumothorax); all IVH; grades 3 or 4 IVH; mortality at 30 days | |
| Notes | Surfactant: no (not available) Cross‐over: 9% in HFOV, 35% in CV Postnatal corticosteroids: not reported Additional arm to the trial consisted of HFOV for 72 hrs then switch to CV (not analysed here) | |
| Risk of bias | ||
| Bias | Authors' judgement | Support for judgement |
| Random sequence generation (selection bias) | Low risk | Quote: "random cards" |
| Allocation concealment (selection bias) | Unclear risk | Quote: "blind draw" |
| Blinding of participants and personnel (performance bias) | High risk | Blinding was not possible for care‐givers and not relevant for patients |
| Blinding of outcome assessment (detection bias) | Unclear risk | Blinding of outcome assessment was not relevant for most outcomes (death, oxygen dependency). No information on outcomes such as brain ultrasound |
| Incomplete outcome data (attrition bias) | Low risk | Complete follow‐up (after additional data from author) |
| Methods | Multicentre (9) randomised controlled trial | |
| Participants | Inclusion criteria: ‐ birth weight 750 to 2000 g ‐ requiring mechanical ventilation soon after birth Exclusion criteria: if > 12 hrs old; presence of IVH within 1 hr after birth for inborns and within 6 hrs for transferred babies Stratification: by birth weight (750 to 1249 g, 1250 to 1999 g) 92 infants enrolled and analysed Mean gestational age: 29 ± 2.3 wk in HFOV, 29 ± 2.1 in CV Mean birth weight: 1243 ± 322 g in HFOV, 1250 ± 318 g in CV Antenatal corticosteroids: not reported Mean age at randomisation: 2.0 ± 1.6 hrs in HFOV, 1.7 ± 1.5 hrs in CV | |
| Interventions | HFOV: OSC using Hummingbird. Settings: high initial MAP, 15 Hz HVS: yes. Alveolar recruitment by manual bagging and use of high MAP. Target FiO2 not reported Target PCO2: 35 to 50 mmHg Duration of assigned treatment: not reported Cross‐over: allowed if infant meets failure criteria (same as in HIFI trial) | |
| Outcomes | Primary outcome all IVH and grade 3 or 4 IVH; chronic lung disease (CLD) = oxygen therapy at 28 days and abnormal chest x‐ray; mortality at 28 days; failure of assigned treatment (as for HIFI 1989); pulmonary air leak; PVL; mechanical ventilation at 28 days; duration of mechanical ventilation; neurodevelopmental outcome at 12 months (all survivors) | |
| Notes | Surfactant: bovine surfactant given in case of "clinical diagnosis of RDS"; 78% of infants received surfactant in both groups Cross‐over: 9% in HFOV, 2% in CV Postnatal corticosteroids: not reported | |
| Risk of bias | ||
| Bias | Authors' judgement | Support for judgement |
| Random sequence generation (selection bias) | Unclear risk | Quote: "eligible for randomisation" |
| Allocation concealment (selection bias) | Low risk | Quote: "randomisation with opaque envelopes" |
| Blinding of participants and personnel (performance bias) | High risk | Blinding was not possible for care‐givers and not relevant for patients |
| Blinding of outcome assessment (detection bias) | Unclear risk | Blinding of outcome assessment was not relevant for most outcomes (death, oxygen dependency). No information on blinding of assessment of head ultrasound or chest x‐ray |
| Incomplete outcome data (attrition bias) | Low risk | Complete follow‐up for primary outcome and for long‐term follow‐up |
| Methods | Multicentre (3) randomised controlled trial | |
| Participants | Inclusion criteria: ‐ gestational age < 36 wk ‐ requiring mechanical ventilation shortly after birth ‐ at least moderate respiratory insufficiency (Pa/AO2 < 0.5; poor ventilation) Exclusion criteria: patients > 12 hrs old; severe congenital defects; pre‐existing air leak Stratification: by birth weight (≤ 1000 g, >1000 g); by age at randomisation (≤ 4 hrs, > 4hrs) 125 infants enrolled Mean gestational age: 30.8 ± 2.2 wk in HFOV, 30.1 ± 2.7 wk in CV Mean birth weight: 1560 ± 460 g in HFOV, 1460 ± 470 in CV Antenatal corticosteroids: 30% in HFOV, 18% in CV Mean age at randomisation: mean 2.9 hrs (range 2.4 to 3.3) in HFOV, mean 2.0 hrs (range 1.4 to 3.0) in CV | |
| Interventions | HFOV: OSC using Sensormedics 3100(A). Settings: initial MAP 1 to 2 cm H2O > with CV, I:E ratio 0.33, 10 to 15 Hz HVS: yes. Increase MAP to improve oxygenation with target FiO2 < 0.30 CV: IMV using Sechrist. Synchronisation: no. Settings: IT 0.35 to 0.55 sec, rate < 60/min, PEEP 3 to 7 cm H2O, PIP up to 30 cm H2O if < 1 kg and up to 35 cm H2O if > 1 kg LPS: no Target PCO2: 35 to 45 mmHg Duration of assigned treatment: HFOV until extubation or switched to CV if insufficient respiratory drive Cross‐over: if infants meet failure criteria (insufficient oxygenation or ventilation for > 2 hrs; persistent haemodynamic problems; destabilizing problem of air leak; requiring hand ventilation) | |
| Outcomes | Chronic lung disease (CLD) = oxygen therapy at 30 days and abnormal chest x‐ray; oxygen at discharge (mean age 37 weeks PMA); mortality at 30 days; failure of assigned treatment (PaO2 < 50 or PaCO2 > 60 mmHg for > 2 hrs, or excessive pressures of IPPV); pulmonary air leak; all IVH; grade 3 or 4 IVH; PVL; mechanical ventilation at 28 days; NEC; use of vasopressors; PDA (treated); ROP; BAER; hospital cost | |
| Notes | Surfactant: all infants received at least one dose of bovine surfactant after enrolment in the trial. Infants in the HFOV group received significantly fewer surfactant doses than infants in the CV group Cross‐over: 2% in HFOV, 15% in CV Postnatal corticosteroids: not reported | |
| Risk of bias | ||
| Bias | Authors' judgement | Support for judgement |
| Random sequence generation (selection bias) | Low risk | Quote: "Randomisation was by blind card draw from separate sets of..." |
| Allocation concealment (selection bias) | Unclear risk | Insufficient information regarding concealment procedures |
| Blinding of participants and personnel (performance bias) | High risk | Blinding was not possible for care‐givers and not relevant for patients |
| Blinding of outcome assessment (detection bias) | Low risk | Blinding of outcome assessment was not relevant for most outcomes (death, oxygen dependency). Neurodevelopmental assessment was blinded |
| Incomplete outcome data (attrition bias) | Low risk | Complete follow‐up for primary outcome. Long‐term follow‐up of infants of 1 centre: 87% completeness of follow‐up |
| Methods | Multicentre (3) randomised controlled trial | |
| Participants | Inclusion criteria: ‐ birth weight 750 to 1500 g ‐ respiratory distress syndrome Exclusion criteria: congenital anomalies; hydrops fetalis Stratification: by birth weight (750 to 1000 g, 1001 to 1500 g) 96 infants enrolled and analysed Mean gestational age: 28.5 ± 0.9 wk in HFOV, 28.4 ± 0.95 wk in CV Mean birth weight: 1107 ± 112 g in HFOV, 1111 ± 116 g in CV Antenatal corticosteroids: 24% in HFOV, 18% in CV Mean age at randomisation: 1.16 ± 0.50 hrs in HFOV, 0.66 ± 0.33 hrs in CV | |
| Interventions | HFOV: OSC using Stephan SHF 3000 piston oscillator. Settings: initial MAP and amplitude to show good chest movements, 15 to 20 Hz, I:E ratio 1:1 HVS: no. Weaning of MAP first CV: IMV using Stephan HF 300 or Dräger Babylog 8000. Synchronisation: not reported. Settings: PIP to show good chest expansion, IT 0.25 to 0.45 sec, I:E at least = 1:2, PEEP 3 to 4 cm H2O LPS: no Target PCO2: 35 to 48 mmHg Duration of assigned treatment: until extubation or allowed switched to CV if FiO2 < 0.30 and MAP 3 to 4 cm H2O Cross‐over: allowed if infant meets failure criteria (inadequate oxygenation of ventilation with assigned mode; for patients on CV: development of PIE) | |
| Outcomes | Mortality before discharge, CLD (O2 at 37 weeks PMA), failure of assigned treatment (PaO2 < 45 mmHg or PaCO2 > 60 mmHg), pulmonary ALS ± pneumothorax, IVH, PVL | |
| Notes | Surfactant: bovine surfactant (Survanta) was administered after randomisation when chest x‐ray showed RDS grade II and FiO2 > 0.60 was necessary to achieve PO2 > 50 mmHg Cross‐over: 17% in HFOV, 18% in CV Postnatal corticosteroids: 43% in HFOV, 60% in CV (all patients still on oxygen therapy at 7 days of age received a 21 day course of dexamethasone) | |
| Risk of bias | ||
| Bias | Authors' judgement | Support for judgement |
| Random sequence generation (selection bias) | Low risk | Quote: "balanced block randomization scheme" |
| Allocation concealment (selection bias) | Unclear risk | No information on procedures to conceal allocation |
| Blinding of participants and personnel (performance bias) | High risk | Blinding was not possible for care‐givers and not relevant for patients |
| Blinding of outcome assessment (detection bias) | Unclear risk | Blinding of outcome assessment was not relevant for most outcomes (death, oxygen dependency). No information on assessment of head ultrasound or chest x‐ray |
| Incomplete outcome data (attrition bias) | Low risk | Complete follow‐up for primary endpoint |
| Methods | Multicentre (6) randomised controlled trial | |
| Participants | Inclusion criteria: ‐ inborn ‐ gestational age 24 to 29 wk ‐ requiring mechanical ventilation within 6 hrs of birth Exclusion criteria: major congenital or chromosomal anomalies, hydrops fetalis Stratification: by centre; by gestational age (24 to 25 wk, 26 to 27 wk, 28 to 29 wk) 289 infants enrolled; 4 infants excluded because of congenital malformation and 1 infant excluded because of pneumothorax before randomisation; 284 infants analysed Median (range) gestational age: 27.0 wk (23.4 to 29.9 wk) in HFOV, 27.3 wk (24.0 to 29.9 wk) in CV Median (range) birth weight: 888 g (420 to 1830 g) in HFOV, 870 g (370 to 1395 g) in CV Antenatal corticosteroids: 81% in HFOV, 86% in CV Median (range) age at intubation: 12 minutes (0 to 360) both in HFOV and in CV Median (range) duration of positive pressure ventilation before randomisation: 28 minutes (0 to 90) in HFOV, 0 minutes (0 to 90) in CV | |
| Interventions | HFOV: HFFI using Infant Star ventilator (software version 83). Settings: initial MAP 1 to 2 cm H2O higher than with CV or 10 to 12 cm H2O if HFV started immediately, 10 Hz HVS: yes. Stepwise increase of MAP until target FiO2 < 0.30 is reached. Mild sustained inflations (MAP +5 cm H2O during 15 sec) after tracheal suctioning LPS: yes Target PCO2: 40 to 60 mmHg, up to 70 mmHg from day 7 Duration of assigned treatment: until extubation or for 10 days Cross‐over: in first 10 days allowed if infant meets failure criteria (air leak, oxygenation index as defined in primary outcome), decision left to the attending physician | |
| Outcomes | "Treatment failure" (ALS < 10 days, oxygenation index > 35 , 40 or 45 in the 3 gestation strata, CLD at 36 weeks or death before discharge), CLD = oxygen or ventilatory support at 36 weeks, ALS = PIE or gross air leaks; IVH; PVL; ROP | |
| Notes | Surfactant: if FiO2 was > 0.30 in HFOV group, or > 0.40 in CV group. Bovine or porcine surfactant given to 68% of HFOV and 71% of CV Cross‐over: not reported Postnatal corticosteroids: 39% of HFOV, 41% of CV | |
| Risk of bias | ||
| Bias | Authors' judgement | Support for judgement |
| Random sequence generation (selection bias) | Unclear risk | Quote: "randomly assigned" |
| Allocation concealment (selection bias) | Low risk | Quote: "consecutively numbered computer‐printed opaque envelopes" |
| Blinding of participants and personnel (performance bias) | High risk | Blinding was not possible for care‐givers and not relevant for patients |
| Blinding of outcome assessment (detection bias) | Unclear risk | Blinding of outcome assessment was not relevant for most outcomes (death, oxygen dependency). Assessment of chest x‐ray was blinded, but not reported for head ultrasound |
| Incomplete outcome data (attrition bias) | Low risk | Complete follow‐up (98.3%) |
| Methods | Single centre randomised controlled trial | |
| Participants | Inclusion criteria: ‐ birth weight 500 to 1500 g ‐ gestational age < 31 wk ‐ respiratory insufficiency Exclusion criteria: small for gestational age infants; major congenital anomalies or neuromuscular disease; ventilated for CNS disorder or circulatory reason Stratification: no 43 infants enrolled and analysed Mean gestational age: Mean birth weight: Antenatal corticosteroids: Mean age at randomisation: selective intubation in the delivery room with immediate randomisation and transfer to the NICU to start assigned ventilation mode. Initiation of ventilation within 20 minutes after birth | |
| Interventions | HFOV: OSC using Sensormedics 3100A. Settings: MAP stepwise increased, 15 Hz, I:E ratio 1:2 HVS: yes. MAP stepwise increased to reach optimal lung inflation; target FiO2 not reported CV: (S)IMV time‐cycled, pressure‐limited using Bearcub 2100 or Infant Star. Synchronisation: not in all patients. Settings: rate 30 to 60/min, IT 0.3 to 0.5 sec, PEEP 3 to 5 cm H2O, PIP to reach adequate chest rise LPS: probably not Target PCO2: not specified ("normocapnia") Duration of assigned treatment: HFOV until extubation Cross‐over: from HFOV to CV if inadequate oxygenation or ventilation despite optimum lung inflation (confirmed by chest x‐ray) and arterial normotension; from CV to HFOV if inadequate oxygenation or ventilation with MAP ≥ 15 cm H2O, PIP ≥ 35 cm H2O and FiO2 ≥ 80% | |
| Outcomes | Mortality at 30 days and at 36 weeks PMA, any air leak, pneumothorax, CLD 30 days and 36 weeks PMA, any IVH and severe grade 3 or 4 IVH, PVL, ROP > grade 2 | |
| Notes | Surfactant: administered within first 3 hrs of life if criteria for surfactant treatment (not reported) are fulfilled; 42% of infants in HFOV group, and 94% of infants in CV group received surfactant Cross‐over: 0% in HFOV, 10% in CV Postnatal corticosteroids: median (range) cumulative dose of dexamethasone 1.6 mg/kg (0 to 11.3) in HFOV, 2.75 mg/kg (0 to 17.5) in CV | |
| Risk of bias | ||
| Bias | Authors' judgement | Support for judgement |
| Random sequence generation (selection bias) | Low risk | Quote: "table of random numbers" |
| Allocation concealment (selection bias) | Low risk | Quote: "sealed envelopes" |
| Blinding of participants and personnel (performance bias) | High risk | Blinding was not possible for care‐givers and not relevant for patients |
| Blinding of outcome assessment (detection bias) | Unclear risk | Blinding of outcome assessment was not relevant for most outcomes (death, oxygen dependency). Chest x‐rays reviewed by blinded observers. No information on assessment of head ultrasound |
| Incomplete outcome data (attrition bias) | Low risk | Complete follow‐up; 2 excluded (1 CNS abnormality in HFOV group and 1 congenital heart disease in CV) |
| Methods | Multicentre (7) randomised controlled pilot study | |
| Participants | Inclusion criteria: ‐ birth weight 501 to 1200 g ‐ mechanically ventilated within 4 hrs after birth ‐ received 1 dose of surfactant ‐ FiO2 ≥ 0.25 ‐ expected to need ventilation > 24 hrs Exclusion criteria: growth not appropriate for gestational age; 5 minute Apgar < 3; base deficit > 14; severe hypotension Stratification: by weight (501 to 800 g, 801 to 1200 g), by antenatal steroids 48 infants enrolled Mean gestational age: 25.9 ± 2.1 in HFOV, 26.1 ± 1.7 in CV Mean birth weight: 823 ± 215 g in HFOV, 856 ± 206 in CV Antenatal corticosteroids: 42% in HFOV, 50% in CV Mean age at randomisation: 2.8 ± 1.2 hrs in HFOV, 2.4 ± 1.0 in CV | |
| Interventions | HFOV: OSC using Sensormedics 3100A. Settings: initial MAP 2 cm H2O higher than with CV, 15 Hz, I/T 0.33 HVS: yes. Increase MAP to optimise oxygenation with target FiO2 < 0.40 CV: SIMV using Dräger Babylog, Bearcub, VIP Bird. Settings: Rate < 60/min, PEEP 4 to 6 cm H2O, Ti 0.25 to 0.35 sec, target Vt 5 to 6 ml/kg LPS: yes. Target PCO2: 40 to 55 mmHg (45 to 65 mmHg for infants with CLD) Duration assigned treatment: until death or extubation or development of CLD Cross‐over: no | |
| Outcomes | Death by 36 weeks, CLD at 36 weeks in survivors, IVH grades 3 or 4, PVL, mean number of doses of surfactant | |
| Notes | Surfactant: all infants received Survanta before enrolment Cross‐over: 8% in HFOV, 29% in CV Postnatal corticosteroids: 42% in HFOV, 62% in CV Pilot study for Courtney 2003 ‐ subjects not include in later study | |
| Risk of bias | ||
| Bias | Authors' judgement | Support for judgement |
| Random sequence generation (selection bias) | Unclear risk | Quote: "Randomly assigned" |
| Allocation concealment (selection bias) | Unclear risk | No information on randomisation procedure |
| Blinding of participants and personnel (performance bias) | High risk | Blinding was not possible for care‐givers and not relevant for patients |
| Blinding of outcome assessment (detection bias) | Unclear risk | Blinding of outcome assessment was not relevant for most outcomes (death, oxygen dependency). No information on blinding of other outcomes |
| Incomplete outcome data (attrition bias) | Low risk | Complete follow‐up ‐ 2 infants withdrawn from HFOV arm at parental request |
| Methods | Multicentre (10) randomised controlled trial | |
| Participants | Inclusion criteria: ‐ gestational age 24 to 29 wk ‐ requiring mechanical ventilation before 6 hrs of life ‐ PaO2/FiO2 < 200 ‐ chest x‐ray compatible with RDS Exclusion criteria: IVH grade 3 or 4; pre‐existing pneumothorax; ROM before 24 wk gestational age; severe congenital malformation or hydrops fetalis Stratification: by centre; by gestational age (24 to 27 wk, 28 to 29 wk) 292 infants randomised; 7 inclusion errors, 8 withdrawals of consent 273 infants analysed Mean gestational age: 27.5 ± 1.4 wk in HFOV, 27.6 ± 1.5 wk in CV Mean birth weight: 976 ± 219 g in HFOV, 997 ± 245 g in CV Antenatal corticosteroids: 52% in HFOV, 55% in CV Mean age at randomisation: 2.42 ± 1.58 hrs in HFOV, 2.37 ± 1.97 hrs in CV | |
| Interventions | HFOV: OSC using OHF1 piston oscillator (Dufour, France). Settings: initial MAP 2 cm H2O > than on CV, I:E ratio 1:1, 15 Hz, high volume strategy (higher mean airway pressure, sighs) HVS: yes. Increase MAP to optimise oxygenation; use of 'sighs'; target FiO2 < 0.40 CV: SIMV using Dräger babylog 8000. Synchronisation: yes. Settings: TI < 0.45 sec, PEEP 4 to 5 cm H2O, minimal PIP to achieve target PCO2 LPS: probably yes. Target PCO2: 40 to 50 mmHg Duration of assigned treatment: 10 days Cross‐over: allowed during first 10 days if infant meets failure criteria (criteria for ventilatory failure, criteria for radiographic failure such as air leak) | |
| Outcomes | Death (neonatal and before discharge) | |
| Notes | Surfactant: all infants received first dose of surfactant (Curosurf, 200 mg/kg) after randomisation Cross‐over: 15% in CV, 29% in CV Postnatal corticosteroids: 54% in HFOV, 52% in CV | |
| Risk of bias | ||
| Bias | Authors' judgement | Support for judgement |
| Random sequence generation (selection bias) | Low risk | Quote: "computer‐generated randomization" |
| Allocation concealment (selection bias) | Low risk | Quote: "using sealed envelopes" |
| Blinding of participants and personnel (performance bias) | High risk | Blinding was not possible for care‐givers and not relevant for patients |
| Blinding of outcome assessment (detection bias) | Low risk | Blinding of outcome assessment was not relevant for most outcomes (death, oxygen dependency). Assessment of head ultrasound and chest x‐rays was blinded |
| Incomplete outcome data (attrition bias) | Low risk | Complete follow‐up: yes (7% loss) |
| Methods | Multicentre (25) randomised controlled trial | |
| Participants | Inclusion criteria: ‐ gestational age 23 to 28 wk ‐ inborn ‐ requiring mechanical ventilation from birth Exclusion criteria: transfer to another hospital shortly after birth; congenital malformations Stratification: by centre; by gestational age (23 to 25 wk, 26 to 28 wk) 870 infants randomised; 66 infants were ineligible and excluded; 7 infants withdrawn (5 deemed ineligible, 2 at parent's request. 797 infants included in analyses Mean gestational age: 26.5 wk for total study population Mean birth weight: 853 ± 185 g for total study population Antenatal corticosteroids: 91% in HFOV, 92% in CV Mean age at randomisation: all infants were randomised within the first 60 minutes after birth | |
| Interventions | HFOV: mix of OSC using SLE2 2000 (187 infants) or Sensormedics 3100A (38 infants), and HFFI using Dräger Babylog 8000 (165 infants). Settings: 10 Hz, MAP 6 to 8 cm H2O; I:E 1:1 or 1:2, FiO2 weaned before MAP (high volume strategy) HVS: yes. Increase MAP until FiO2 < 0.30 LPS: probably yes Target PCO2: 34 to 53 mmHg Duration of assigned treatment: after 120 hrs the clinician could choose the ventilation mode Cross‐over: if infants meet failure criteria (failure to achieve adequate oxygenation or ventilation during > 1 hr) | |
| Outcomes | Death by 36 weeks PMA, chronic lung disease at 36 weeks PMA (oxygen therapy or other assisted ventilation), failure of assigned treatment, IVH, PVL, pulmonary air leak (not defined), ROP grade 2 or more, NEC, length of hospital stay | |
| Notes | Surfactant: protocol recommended surfactant treatment as soon as possible after birth; 97% of HFOV group and 99% of CV group received surfactant Cross‐over: 10% in HFOV, 10% in CV Postnatal corticosteroids: 31% in HFOV, 28% in CV Follow‐up of pulmonary function: Thomas 2004 and Zivanovic 2014 | |
| Risk of bias | ||
| Bias | Authors' judgement | Support for judgement |
| Random sequence generation (selection bias) | Unclear risk | Quote: "infants were randomly assigned" |
| Allocation concealment (selection bias) | Unclear risk | No information on randomisation procedure |
| Blinding of participants and personnel (performance bias) | High risk | Blinding was not possible for care‐givers and not relevant for patients |
| Blinding of outcome assessment (detection bias) | Low risk | Blinding of outcome assessment was not relevant for most outcomes (death, oxygen dependency). Assessment of brain ultrasound was blinded |
| Incomplete outcome data (attrition bias) | Low risk | Complete follow‐up for primary outcome |
| Methods | Multicentre (26) randomised controlled trial | |
| Participants | Inclusion criteria: ‐ birth weight 601 to 1200 g ‐ appropriate growth for gestational age ‐ received 1 dose of surfactant ‐ requiring mechanical ventilation with FiO2 ≥ 0.25 and MAP ≥ 6 cm H2O ‐ less than 4 hours old ‐ expected to require ventilation for > 24 hrs Exclusion criteria: 5 minute Apgar < 3; base deficit ≥ 15; severe hypotension; chromosomal or congenital anomalies, neuromuscular disease Stratification: by centre; by birth weight (601 to 700 g, 701 to 800 g, 801 to 1000 g, 1001 to 1200 g); by antenatal steroids 498 infants enrolled Mean gestational age: 26.0 ± 1.6 wk in HFOV, 26.1 ± 1.6 in CV Mean birth weight: 859 ± 161 in HFOV, 848 ± 160 in CV Antenatal corticosteroids: 74% in HFOV, 71% in CV Mean age at randomisation: 2.7 hrs in both groups | |
| Interventions | HFOV: OSC using SensorMedics 3100A. Settings: initial MAP 2 cm H2O > CV, 10 to 15 Hz, IT 0.33 (I:E ratio 1:2) HVS: yes; increase MAP to optimise oxygenation in order to keep FiO2 ≤ 0.40 LPS: yes PaCO2 target: 45 to 60 mmHg Duration of assigned treatment: HFOV until extubation or for 28 days Crossover: if infants met "clear exit criteria". Analysis according to intention‐to‐treat | |
| Outcomes | Death by 36 weeks PMA, chronic lung disease at 36 weeks PMA (oxygen therapy or other assisted ventilation), IVH, PVL, pneumothorax, ROP grade 2 or more, NEC, duration of IPPV | |
| Notes | Surfactant: first dose before study entry; subsequent doses if FiO2 ≥ 0.30 Prophylactic indomethacin Cross‐over: 10% in HFOV, 19% in CV Postnatal corticosteroids: 46% in HFOV, 55% in CV | |
| Risk of bias | ||
| Bias | Authors' judgement | Support for judgement |
| Random sequence generation (selection bias) | Unclear risk | Quote: "randomly assigned" |
| Allocation concealment (selection bias) | Unclear risk | No information on randomisation procedure |
| Blinding of participants and personnel (performance bias) | High risk | Blinding was not possible for care‐givers and not relevant for patients |
| Blinding of outcome assessment (detection bias) | Low risk | Blinding of outcome assessment was not relevant for most outcomes (death, oxygen dependency). Radiologist assessing cranial ultrasound was blinded |
| Incomplete outcome data (attrition bias) | Low risk | 4% loss in HFOV and 2% loss in CV by 36 weeks PMA |
| Methods | Multicentre (2) randomised controlled trial | |
| Participants | Inclusion criteria: ‐gestational age between 23 and 34 weeks ‐ birth weight < 1000 g ‐ requiring mechanical ventilation Stratification: by birth weight (500 to 750 g versus 751 to 1000 g) 46 infants enrolled Mean birth weight: 22 infants in group '500 to 751 g' and 24 infants in group '751 to 1000 g' Antenatal corticosteroids (full course): 45% in HFOV, 54% in CV Mean age at randomisation: nor reported | |
| Interventions | HFOV: HFFI using Infant Star. Settings: MAP to obtain optimal lung volume, 10 to 12 Hz, amplitude set to meet goal PCO2 HVS: yes; increase MAP to improve oxygenation with target FiO2 < 0.40 LPS: probably yes Target PCO2: 50 to 60 mmHg Duration of assigned treatment: HFOV until extubation or until MAP < 7 cm H2O Crossover: if inability to ventilate (pH < 7.20) or to oxygenate (PO2 < 50) | |
| Outcomes | CLD at 36 weeks PMA ‐ oxygen required to maintain SaO2 > 92%, death, IVH grades 3 or 4, air leak, ROP, failure leading to cross‐over of ventilation type | |
| Notes | Surfactant: all infants received Survanta either in delivery room or within 20 minutes after intubation Cross‐over: not reported Postnatal corticosteroids: not reported January 1999 to May 2000: trial stopped because of lack of effect | |
| Risk of bias | ||
| Bias | Authors' judgement | Support for judgement |
| Random sequence generation (selection bias) | Low risk | Quote: "envelopes with a previously generated random number sequence" |
| Allocation concealment (selection bias) | Low risk | Quote: "sealed opaque envelopes" |
| Blinding of participants and personnel (performance bias) | High risk | Blinding was not possible for care‐givers and not relevant for patients |
| Blinding of outcome assessment (detection bias) | Unclear risk | No information. Blinding of outcome assessment was not relevant for most outcomes (death, oxygen dependency) |
| Incomplete outcome data (attrition bias) | Low risk | Results on outcomes available for 100% of included infants |
| Methods | Single centre randomised controlled trial | |
| Participants | Inclusion criteria: ‐ gestational age < 32 wk ‐ less than 6 hrs old ‐ requiring mechanical ventilation ‐ FiO2 > 0.40 or MAP x FiO2 > 3.8 ‐ chest x‐ray compatible with RDS Exclusion criteria: active infection at birth, congenital anomalies Stratification: not reported 300 infants enrolled and analysed. Mean gestational age: 28.5 ± 1.8 wk in HFOV, 28.8 ± 1.9 in CV Mean birth weight: 1173 ± 346 g in HFOV, 1217 ± 363 g in CV Antenatal corticosteroids: 63% in HFOV, 66% in CV Median (range) age at randomisation: 0.93 hrs (0.33 to 24.9 hrs) in HFOV, 0.88 hrs (0.33 to 24.8 hrs) in CV | |
| Interventions | HFOV: mix of OSC using Sensormedics 3100A (122 infants) and HFFI using Infant Star (25 infants). Settings: initial MAP 8 cm H2O if < 29 weeks and 10 cm H2O if 29 to 31 weeks, 10 Hz. HVS: yes. Increase MAP to improve oxygenation and wean FiO2. Target FiO2 not reported LPS: yes Target PCO2: 35 to 45 mmHg Duration of assigned treatment: preferentially HFOV until extubation, unless failure of weaning (criteria described) in which case infants were switched to CV Crossover: infant was changed to alternative mode if failure criteria were met (one of the following: 1) inadequate oxygenation or ventilation, as described in the trial, in the first 7 days of life, 2) uncontrollable air leak, 3) cardiovascular dysfunction, 4) need for hand ventilation to maintain adequate gas exchange) | |
| Outcomes | Chronic lung disease (CLD ‐ on O2 or assisted ventilation) at 36 weeks, death before discharge, failure of assigned treatment, CLD at 28 days, pulmonary interstitial air, pneumothorax, intraventricular haemorrhage, periventricular leukomalacia, retinopathy of prematurity, days of IPPV or CPAP or O2, developmental outcome in early childhood for infants < 30 weeks or with an abnormal head ultrasound | |
| Notes | Surfactant: after initial stabilization either on CV or on HFOV, all infants were given surfactant (Alveofact or Survanta) Cross‐over: 12% in HFOV, 7% in CV Postnatal corticosteroids: not reported | |
| Risk of bias | ||
| Bias | Authors' judgement | Support for judgement |
| Random sequence generation (selection bias) | Unclear risk | Quote: "were randomised" |
| Allocation concealment (selection bias) | Unclear risk | Quote: "using sealed folded papers" |
| Blinding of participants and personnel (performance bias) | High risk | Blinding was not possible for care‐givers and not relevant for patients |
| Blinding of outcome assessment (detection bias) | Low risk | Blinding of outcome assessment was not relevant for most outcomes (death, oxygen dependency). Blinding was applied for grading of chronic lung disease, intracranial haemorrhage, periventricular leukomalacia and retinopathy of prematurity |
| Incomplete outcome data (attrition bias) | Low risk | Complete follow‐up for primary outcome For long‐term outcome: only 57% follow‐up for HFOV, and 51% follow‐up for CV |
| Methods | Single centre randomised controlled trial | |
| Participants | Inclusion criteria: ‐ birth weight < 2000 g ‐ gestational age < 34 wk ‐ < 72 hrs old ‐ RDS requiring mechanical ventilation and surfactant treatment Exclusion criteria: major congenital anomalies; hydrops fetalis 2 by 2 factorial design Stratification: by birth weight in 250 g categories 207 infants enrolled and analysed Mean gestational age: 27.2 ± 2.6 wk for total study population Mean birth weight: 983 ± 378 g for total study population Antenatal corticosteroids: 53% for total study population Mean age at randomisation: not reported | |
| Interventions | Trial randomised infants to nitric oxide versus placebo and to HFOV versus CV HVS: yes. Use of higher MAP to optimise oxygenation, target FiO2 not reported LPS: probably not Target PCO2: 35 to 55 mmHg Duration of assigned treatment: not reported Cross‐over: allowed if patient's condition was considered to be critical by attending physician | |
| Outcomes | Death, CLD at 28 days and 36 week PMA, pulmonary air leak, severe IVH grades 3 or 4, PVL, ROP | |
| Notes | Surfactant: all infants received Survanta before enrolment (inclusion criterion) Prophylactic indomethacin for infants with birth weight < 1250 g Cross‐over: not reported Postnatal corticosteroids: not reported | |
| Risk of bias | ||
| Bias | Authors' judgement | Support for judgement |
| Random sequence generation (selection bias) | Unclear risk | Quote: "randomly assigned" "according to permuted block design" |
| Allocation concealment (selection bias) | Unclear risk | No information on allocation concealment |
| Blinding of participants and personnel (performance bias) | High risk | Blinding was not possible for care‐givers and not relevant for patients |
| Blinding of outcome assessment (detection bias) | Low risk | Blinding of outcome assessment was not relevant for most outcomes (death, oxygen dependency). Blinding of outcome assessment for chest x‐ray, head ultrasound, ROP, neurodevelopment |
| Incomplete outcome data (attrition bias) | Low risk | Complete follow‐up for primary analysis, 82% for developmental follow‐up |
| Methods | Single centre randomised controlled trial | |
| Participants | Inclusion criteria: ‐ inborn ‐ birth weight 500 to 1500 g ‐ gestational age 24 to 29 wk ‐ requiring intubation at birth and ongoing intensive care Exclusion criteria: congenital malformations, prenatal infections Stratification: not reported 42 infants eligible; 2 infants excluded with congenital pneumonia; 40 infants enrolled and analysed Mean gestational age: 27.1 ± 1.4 wk in HFOV, 27.4 ± 1.2 wk in CV Mean birth weight: 882 ± 157 g in HFOV, 936 ± 285 g in CV Antenatal corticosteroids: any steroids in 100% in HFOV and 90% in CV, complete course of steroids in 55% in HFVO and 60% in CV Mean age at randomisation: all infants were randomised within 30 minutes of life | |
| Interventions | HFOV: HFFI using Dräger Babylog 8000+. Settings: initial MAP 2 cm H2O higher than with CV or at 10 cm H2O, 10 Hz HVS: yes. Increase MAP to improve oxygenation and wean FiO2 with target < 0.25 LPS: yes. Target PCO2: 45 to 55 mmHg Duration of assigned treatment: HFOV until extubation Cross‐over: no | |
| Outcomes | Death before discharge, CLD (O2 therapy at 36 weeks PMA), pneumothorax, PIE, IVH grades 3 or 4, PVL, ROP > stage 2 | |
| Notes | Surfactant: 75% of infants in both groups received surfactant. Criteria are not described Cross‐over: 0% in both groups Postnatal corticosteroids: 35% in HFOV, 60% in CV | |
| Risk of bias | ||
| Bias | Authors' judgement | Support for judgement |
| Random sequence generation (selection bias) | Low risk | Quote: "random number allocation" |
| Allocation concealment (selection bias) | Low risk | Quote: "opaque numbered sealed envelopes" |
| Blinding of participants and personnel (performance bias) | High risk | Blinding was not possible for care‐givers and not relevant for patients |
| Blinding of outcome assessment (detection bias) | Unclear risk | Blinding of outcome assessment was not relevant for most outcomes (death, oxygen dependency). No information on blinding of chest x‐ray or head ultrasound |
| Incomplete outcome data (attrition bias) | Low risk | Completeness of follow‐up is 95%: two infants (one from each group) excluded after randomisation due to diagnosis of congenital pneumonia |
| Methods | Single centre randomised controlled trial | |
| Participants | Inclusion criteria: ‐ gestational age < 30 wk ‐ requiring mechanical ventilation ‐ clinical signs and chest x‐ray compatible with RDS Exclusion criteria: major congenital malformation; IVH > grade 3; ventilation for < 24 hrs Stratification: no 25 infants enrolled Mean gestational age: 28.3 ± 1.5 wk in HFOV, 28.2 ± 0.8 wk in CV Mean birth weight: 1126 ± 170 g in HFOV, 1075 ± 313 g in CV Antenatal corticosteroids: 85% in HFOV, 75% in CV Mean age at randomisation: 0.75 ± 0.15 hrs in HFOV, 0.78 ± 0.13 hrs in CV | |
| Interventions | HFOV: OSC using SensorMedics 3100A. Settings: 10 Hz, initial MAP 8 cm H2O, amplitude 30 cm H2O HVS: yes; no additional information on strategy or target FiO2 CV: pressure support ventilation with volume guarantee (PSV + VG) with Dräger Babylog 8000 plus. Synchronisation: yes. Settings: Vt 5 ml/kg, back‐up rate 60/min, PEEP 3 to 4 cm H2O LPS: yes. PaCO2 target: < 65 mmHg Duration of assigned treatment: presumably until extubation (not explicitly reported) Cross‐over: not reported | |
| Outcomes | Mortality, CLD (defined as oxygen dependency at 36 weeks postmenstrual age), pneumothorax, any IVH, PVL, duration of mechanical ventilation, duration O2 therapy, duration of CPAP, length of hospital stay | |
| Notes | Surfactant: all infants received Curosurf (200 mg/kg) after lung volume recruitment was obtained Cross‐over: not reported Postnatal corticosteroids: not reported | |
| Risk of bias | ||
| Bias | Authors' judgement | Support for judgement |
| Random sequence generation (selection bias) | Unclear risk | Quote: "Enrolled patients were randomly assigned..." |
| Allocation concealment (selection bias) | Low risk | Quote: "...using the opening of sealed opaque envelopes balanced in blocks of four." |
| Blinding of participants and personnel (performance bias) | High risk | Blinding was not possible for care‐givers and not relevant for patients |
| Blinding of outcome assessment (detection bias) | Unclear risk | Blinding of outcome assessment was not relevant for most outcomes (death, oxygen dependency). No information on blinding of assessment of head ultrasound or chest x‐ray |
| Incomplete outcome data (attrition bias) | Low risk | 7/32 infants were excluded post randomisation for the analyses (3 in HFOV group and 4 in CV group) because of mechanical ventilation less than 24 hours, although this was not a pre‐specified exclusion criterion. Final analysis was done on 25 infants |
| Methods | Single centre randomised controlled trial | |
| Participants | Inclusion criteria: ‐ gestational age 25 to 32 wk ‐ received at least one course of antenatal steroids ‐ requiring mechanical ventilation in the first hour of life ‐ severe RDS with a/A ratio of < 0.2 Exclusion criteria: lethal congenital anomalies; IVH > grade 2; suspected infection Stratification: by gestational age (25 to 28 wk, 29 to 32 wk) 40 infants enrolled Mean gestational age: 27.3 ± 2 in HFOV, 27.4 ± 2 in CV Mean birth weight: 1015 ± 200 g in HFOV, 1006 ± 185 g in CV Antenatal corticosteroids: all infants had at least 1 course Mean age at randomisation: all infants randomised at 1 hr of life | |
| Interventions | HFOV: HFFI using Babylog 8000 plus. Settings: 10 Hz, initial MAP 8 to 10 cm H2O, amplitude 40% HVS: yes. Increase MAP to maintain FiO2 below 0.30 CV: assist/control + volume guarantee using Babylog 8000 plus. Settings: Vt 5 ml/kg, PEEP 5 cm H2O, rate 60/min, inspiratory time 0.35 sec LPS: yes Target PCO2: 40 to 65 mmHg Duration of assigned treatment: infants on HFOV were switched to CV if MAP < 8 cm H2O and FiO2 < 0.30 Cross‐over: no | |
| Outcomes | Death at 36 wk PMA, CLD at 36 wk PMA, air leak severe IVH, PVL, severe ROP, duration of mechanical ventilation, duration of oxygen dependency | |
| Notes | All infants underwent a lung recruitment manoeuvre at birth (20 to 25 cm H2O during 2 sec followed by PEEP 5 cm H2O) Surfactant: all infants received surfactant (Curosurf) within first 2 hours after birth All infants received prophylactic ibuprofen Crossover: 0% in both groups Postnatal corticosteroids: 10% in HFOV, 9% in CV | |
| Risk of bias | ||
| Bias | Authors' judgement | Support for judgement |
| Random sequence generation (selection bias) | Low risk | Quote: "following a sequence of random numbers..." |
| Allocation concealment (selection bias) | Unclear risk | No information on concealment of allocation sequence. |
| Blinding of participants and personnel (performance bias) | High risk | Blinding was not possible for care‐givers and not relevant for patients |
| Blinding of outcome assessment (detection bias) | Unclear risk | Blinding of outcome assessment was not relevant for most outcomes (death, oxygen dependency). No information on blinding of assessment of head ultrasound or chest x‐ray |
| Incomplete outcome data (attrition bias) | Low risk | Comment: 5/45 eligible infants were excluded before randomisation. All enrolled infants were analysed |
| Methods | Multicentre (3) randomised controlled trial | |
| Participants | Inclusion criteria: ‐ birth weight < 1500 g ‐ gestational age < 30 wk ‐ no antenatal corticosteroids ‐ requiring mechanical ventilation for RDS within first 2 hrs of life Exclusion criteria: major congenital malformation; hydrops fetalis; congenital diaphragmatic hernia; congenital pneumonia; multiple pregnancies; congenital heart disease Stratification: not reported 112 infants eligible; 24 infants excluded (3 no consent, 18 not ventilated, 3 congenital pneumonia or malformation); 88 infants enrolled and analysed Mean gestational age: 26.4 ± 2.2 wk in HFOV, 26.5 ± 3.2 wk in CV Mean birth weight: 869 ± 266 g in HFOV, 913 ± 224 g in CV Antenatal corticosteroids: 0% (exclusion criterion) Mean age at randomisation: not reported; all infants were randomised within 2 hrs of birth | |
| Interventions | HFOV: OSC using Sensormedics 3100A. Settings: initial MAP 6 to 8 cm H2O, 15 Hz, I:E ratio 1:2, amplitude producing visible chest vibrations HVS: yes. Lung volume recruitment as described by De Jaegere 2006. Target FiO2 < 0.30 CV: SIMV using Bear Cub 750 PSV. Settings: PIP 18 to 24 cm H2O, PEEP 5 to 8 cm H2O, IT 0.30 to 0.40 sec, rate 40 to 60/min LPS: yes Target PCO2: < 65 mmHg Duration of assigned treatment: HFOV until extubation Crossover: switch to alternative mode permitted but not mandatory if failure criteria are met (inadequate oxygenation or ventilation as described in trial protocol; signs of decreased cardiac output) | |
| Outcomes | Primary outcomes were: the length of ventilatory support, the need of reintubation, and the length of nasal continuous positive airway pressure support in the postextubation period. Secondary outcomes were: the length of stay in neonatal intensive care unit and in hospital, death before discharge, adverse short‐ and long‐term pulmonary and neonatal outcomes, and the need for a second dose of surfactant and of postnatal glucocorticoid treatment | |
| Notes | Surfactant: all infants received surfactant (Curosurf, 200 mg/kg) at a mean postnatal age of 47 min for the HFOV group and 44 min for the CV group Cross‐over: 1 infant out of 44 in each group Postnatal corticosteroids: 1 of 39 infants (2.5%) in HFOV, 4 of 39 infants (10.2%) in CV | |
| Risk of bias | ||
| Bias | Authors' judgement | Support for judgement |
| Random sequence generation (selection bias) | Low risk | Quote: "computer generated random numbers" |
| Allocation concealment (selection bias) | Unclear risk | No information on allocation concealment |
| Blinding of participants and personnel (performance bias) | High risk | Blinding was not possible for care‐givers and not relevant for patients |
| Blinding of outcome assessment (detection bias) | Unclear risk | Blinding of outcome assessment was not relevant for most outcomes (death, oxygen dependency). No information on assessment of chest x‐ray and head ultrasound |
| Incomplete outcome data (attrition bias) | Low risk | Complete follow‐up of enrolled infants: although it is mentioned that infants who crossed over would be excluded from the analyses ('as treated' instead of 'intention‐to‐treat' analysis), all 78 survivors (39 in each group) are represented in the table results. One patient crossed over in each arm |
| Methods | Multicentre (2) randomised controlled trial | |
| Participants | Inclusion Criteria: ‐ gestational age < 32 wks ‐ birth weight < 1500 g ‐ less than 24 hours of age ‐ requiring mechanical ventilation for RDS ‐ PaO2/FiO2 ratio < 200 mmHg ‐ Radiograph criteria of severe RDS Exclusion criteria: genetic metabolic diseases, congenital abnormalities, pneumothorax, IVH grade 3 to 4 Stratification: by centre; by gender; by gestational age (< 28 wk, ≥ 28 wk) 366 infants eligible and randomised; 3 infants excluded post‐randomisation (congenital heart disease); 7 dropouts; 356 infants analysed Mean gestational age: 29.3 ± 2.5 wk in HFOV, 29.5 ± 2.3 in CV Mean birth weight: 1129 ± 199 g in HFOV, 1117 ± 241 g in CV Antenatal corticosteroids: 77% in HFOV, 73% in CV Mean age at randomisation: 5.8 ± 5.0 hrs in HFOV, 5.9 ± 5.1 in CV | |
| Interventions | HFOV: OSC using SLE5000. Settings: initial MAP 6 to 8 cm H2O and progressively increased, 10 Hz, IT set at default level of ventilator (I:E ratio not reported) HVS: yes. Lung volume recruitment as described by De Jaegere 2006. Target FiO2 < 0.25 CV: SIMV with pressure‐support (SIMV‐PS) using Servo‐i‐Maquet. Settings: Vt 4 to 6 ml/kg, PIP needed to achieve chest expansion, PEEP 4 to 6 cm H2O, IT 0.25 to 0.40 sec, rate ≤ 60/min (typically 30 to 40/min plus PS) LPS: yes Target PCO2: 40 to 55 mmHg Duration of assigned treatment: HFOV until extubation Cross‐over: no | |
| Outcomes | Primary outcomes were mortality or incidence of BPD. Secondary outcomes were duration of ventilation and hospitalisation, surfactant requirements, pneumothorax, retinopathy of prematurity ≥ stage 2, and neurodevelopment at 18 months of corrected age. Survival and complete outcome data were available for 288 infants at 18 months of corrected age | |
| Notes | Surfactant: rescue surfactant (Curosurf, 200 mg/kg) was administered after randomisation and only if, after 2 hours of ventilation, PaO2/FiO2 was < 200, and if parental consent was given (parents have to pay for the surfactant). A subsequent dose was administered 12 hours after the first dose if PaO2/FiO2 was < 200 Cross‐over: 0% in both groups Postnatal corticosteroids: not reported | |
| Risk of bias | ||
| Bias | Authors' judgement | Support for judgement |
| Random sequence generation (selection bias) | Low risk | Quote: "computer generated randomization plan" |
| Allocation concealment (selection bias) | Unclear risk | No information on allocation concealment |
| Blinding of participants and personnel (performance bias) | High risk | Blinding was not possible for care‐givers and not relevant for patients |
| Blinding of outcome assessment (detection bias) | Low risk | Blinding of outcome assessment was not relevant for most outcomes (death, oxygen dependency). Unclear whether assessment of head ultrasound was blinded Long‐term follow‐up was blinded. Quote: "doctors were blind as to group allocation during follow‐up until 18 months of corrected age" |
| Incomplete outcome data (attrition bias) | Low risk | Completeness of follow‐up: 98% for the primary outcome, 82% for neurodevelopmental outcome at 18 months |
HFOV = high‐frequency oscillatory ventilation; OSC = true oscillator; HFFI : high frequency flow interrupter; CV = conventional ventilation; (S)IMV = (synchronised) intermittent mandatory ventilation; IT = inspiratory time; PIP = positive inspiratory pressure; PEEP = positive end‐expiratory pressure; MAP = mean airway pressure; CLD = chronic lung disease; ALS = air leak syndrome; IVH = intraventricular haemorrhage; PVL = periventricular leukomalacia; PMA = postmenstrual age; HVS = high volume strategy; LPS = lung protective strategy (for CV); Vt = tidal volume
Characteristics of excluded studies [ordered by study ID]
| Study | Reason for exclusion |
| No relevant outcomes | |
| After randomisation of infants (unknown gestation range), 5 of 11 in the HFOV group and an unknown number from the CV group were excluded from the comparisons between treatments | |
| Rescue treatment with primary aim of preventing pulmonary air leak | |
| Cross‐over trial comparing two modes of HFOV | |
| A total of 22% excluded after randomisation, mixed population of preterm and term infants | |
| Prospective randomised trial comparing early HFOV to synchronised intermittent mandatory ventilation (SIMV) in very low birth weight (VLBW) premature infants with omphalocoele: 15 infants weighing 501 to 1000 g less than 4 hours of age, who had received one dose of surfactant and required ventilation with mean airway pressure > 4 to 6 cm H2O and FiO2 > 0.25, and had an anticipated duration of ventilation greater than 48 hours. Newborns were stratified by birth weight and prenatal steroid status, and then randomised to either HFOV or SIMV with tidal volume monitoring. Ventilator management for patients in both study arms was strictly governed by protocols that included optimising lung inflation and blood gases, weaning strategies and extubation criteria. Not included because of unique underlying condition of enrolled infants (presence of omphalocoele) | |
| Results reported for only 13 (54%) of the 24 subjects randomised to high frequency flow interrupter or CV | |
| Prospective, non‐randomised comparison of HFOV versus synchronized intermittent mandatory ventilation (SIMV) in 52 preterm infants 26 to 36 weeks' gestation. The study was excluded because it was not a randomised controlled trial | |
| Mandatory cross‐over of treatments at 96 hrs | |
| Randomised controlled trial comparing HFOV (Dräger Babylog Plus) with synchronised intermittent mandatory ventilation (SIMV) in preterm infants with birth weight > 750 g with RDS. The primary outcome was the oxygen index in the first 24 hours. In all 53 out of the 215 eligible infants could not be included because of unavailability of the designated ventilator. A total of 150 preterm infants (mean gestational age of 32 weeks) were randomised to receive either HFOV (66 infants) or SIMV (84 infants). After randomisation 40 infants were excluded from the analyses because ventilation was discontinued within 24 hours (17 in the HFOV group and 23 in the SIMV group). The reason for discontinuation was death in 15 cases and "left against medical advice" in 25 cases. HFOV strategy was aimed at recruiting lung volume, and adequate lung inflation was assessed by counting posterior ribs on chest x‐ray. SIMV was aimed at keeping tidal volumes low. The study was excluded because of concerns about both selection bias (25% of eligible infants were not included) as well as attrition bias (post‐randomisation exclusion of 27% of infants). In addition, clinically relevant outcomes were not measured |
Characteristics of studies awaiting assessment [ordered by study ID]
| Methods | Elazeez 2010 conducted a randomised controlled trial to determine differences in regional cerebral blood flow velocity (CBFV) in preterm infants receiving conventional ventilation (CV) versus high frequency oscillatory ventilation (HFOV) using a high‐volume strategy |
| Participants | Preterm infants admitted to the NICU at Mansoura University Children's Hospital before 12 hours of age. Those requiring ventilator support were randomly allocated to HFOV (n = 23) or CV (n= 24) |
| Interventions | HFOV versus CV |
| Outcomes | Doppler cranial ultrasound and echocardiography were performed on all subjects on day 1 and day 4 with measurements of CBFV in the anterior cerebral (ACA) and middle cerebral arteries (MCA) and assessment of the ductus arteriosus |
| Notes | Published as abstract PAS 2010 |
| Methods | Sarafidis 2011 conducted a single centre randomised controlled trial to evaluate the effect of optimised synchronized intermittent mandatory ventilation (SIMV) versus high‐frequency oscillatory ventilation (HFOV) on circulating CC16 and IL‐6 levels |
| Participants | Preterm neonates (gestational age < 30 weeks) requiring mechanical ventilation within the first 2 hrs of life. Of the 30 neonates studied, 24 (gestational age 27.1 ± 1.7 weeks, birth weight (942 ± 214 g) were finally analysed |
| Interventions | Synchronised intermittent mandatory ventilation (SIMV) versus high frequency oscillatory ventilation (HFOV) used as the initial ventilation methods |
| Outcomes | Serum CC16 and IL‐6 were measured on establishment of the assigned ventilation mode after admission, at days 3 and 14 of life as well as at 36 weeks postmenstrual age. Demographic‐perinatal data and clinical parameters were also recorded |
| Notes |
Characteristics of ongoing studies [ordered by study ID]
| Trial name or title | Texas infant Star |
| Methods | |
| Participants | Eligible infants include < 1250 g birth weight or < 29 weeks gestation |
| Interventions | Randomisation to 3 modes of ventilation: conventional, high frequency oscillation, and combination (HFOV + 2 to 5 bpm CV) |
| Outcomes | |
| Starting date | Study commenced in late 1996 ‐ has been completed but not yet published |
| Contact information | Contact: Dr Anthony L Talbert, Texas Tech University School of Medicine, Odessa, Texas, USA. Phone +1 915 335 5270 |
| Notes |
Data and analyses
| Outcome or subgroup title | No. of studies | No. of participants | Statistical method | Effect size |
| 1 Death by 28 to 30 days Show forest plot | 10 | 2148 | Risk Ratio (M‐H, Fixed, 95% CI) | 1.09 [0.88, 1.34] |
| Analysis 1.1  Comparison 1 HFOV versus CV (all trials), Outcome 1 Death by 28 to 30 days. | ||||
| 2 Mechanical ventilation at 28 to 30 days in survivors Show forest plot | 3 | 767 | Risk Ratio (M‐H, Fixed, 95% CI) | 1.08 [0.86, 1.35] |
| Analysis 1.2  Comparison 1 HFOV versus CV (all trials), Outcome 2 Mechanical ventilation at 28 to 30 days in survivors. | ||||
| 3 Oxygen at 28 to 30 days in survivors Show forest plot | 6 | 1043 | Risk Ratio (M‐H, Fixed, 95% CI) | 0.98 [0.88, 1.10] |
| Analysis 1.3  Comparison 1 HFOV versus CV (all trials), Outcome 3 Oxygen at 28 to 30 days in survivors. | ||||
| 4 CLD at 28 to 30 days (O2 + x‐ray) in survivors Show forest plot | 4 | 820 | Risk Ratio (M‐H, Fixed, 95% CI) | 0.86 [0.74, 1.01] |
| Analysis 1.4  Comparison 1 HFOV versus CV (all trials), Outcome 4 CLD at 28 to 30 days (O2 + x‐ray) in survivors. | ||||
| 5 Death or CLD at 28 to 30 days Show forest plot | 5 | 1160 | Risk Ratio (M‐H, Fixed, 95% CI) | 0.94 [0.85, 1.04] |
| Analysis 1.5  Comparison 1 HFOV versus CV (all trials), Outcome 5 Death or CLD at 28 to 30 days. | ||||
| 6 Death by 36 to 37 weeks or discharge Show forest plot | 17 | 3329 | Risk Ratio (M‐H, Fixed, 95% CI) | 0.95 [0.81, 1.10] |
| Analysis 1.6  Comparison 1 HFOV versus CV (all trials), Outcome 6 Death by 36 to 37 weeks or discharge. | ||||
| 7 CLD at 36 to 37 weeks PMA or discharge in survivors Show forest plot | 17 | 2786 | Risk Ratio (M‐H, Fixed, 95% CI) | 0.86 [0.78, 0.96] |
| Analysis 1.7  Comparison 1 HFOV versus CV (all trials), Outcome 7 CLD at 36 to 37 weeks PMA or discharge in survivors. | ||||
| 8 Death or CLD at 36 to 37 weeks PMA or discharge Show forest plot | 17 | 3329 | Risk Ratio (M‐H, Fixed, 95% CI) | 0.90 [0.84, 0.97] |
| Analysis 1.8  Comparison 1 HFOV versus CV (all trials), Outcome 8 Death or CLD at 36 to 37 weeks PMA or discharge. | ||||
| 9 Any pulmonary air leak Show forest plot | 13 | 2854 | Risk Ratio (M‐H, Fixed, 95% CI) | 1.19 [1.05, 1.34] |
| Analysis 1.9  Comparison 1 HFOV versus CV (all trials), Outcome 9 Any pulmonary air leak. | ||||
| 10 Gross pulmonary air leak Show forest plot | 11 | 2185 | Risk Ratio (M‐H, Fixed, 95% CI) | 1.13 [0.88, 1.45] |
| Analysis 1.10  Comparison 1 HFOV versus CV (all trials), Outcome 10 Gross pulmonary air leak. | ||||
| 11 Intraventricular haemorrhage ‐ all grades Show forest plot | 12 | 3084 | Risk Ratio (M‐H, Fixed, 95% CI) | 1.04 [0.95, 1.14] |
| Analysis 1.11  Comparison 1 HFOV versus CV (all trials), Outcome 11 Intraventricular haemorrhage ‐ all grades. | ||||
| 12 Intraventricular haemorrhage ‐ grades 3 or 4 Show forest plot | 18 | 4069 | Risk Ratio (M‐H, Fixed, 95% CI) | 1.10 [0.95, 1.27] |
| Analysis 1.12  Comparison 1 HFOV versus CV (all trials), Outcome 12 Intraventricular haemorrhage ‐ grades 3 or 4. | ||||
| 13 Periventricular leukomalacia Show forest plot | 17 | 3983 | Risk Ratio (M‐H, Fixed, 95% CI) | 1.03 [0.81, 1.31] |
| Analysis 1.13  Comparison 1 HFOV versus CV (all trials), Outcome 13 Periventricular leukomalacia. | ||||
| 14 Retinopathy of prematurity (stage 2 or greater) in survivors Show forest plot | 12 | 2781 | Risk Ratio (M‐H, Fixed, 95% CI) | 0.81 [0.70, 0.93] |
| Analysis 1.14  Comparison 1 HFOV versus CV (all trials), Outcome 14 Retinopathy of prematurity (stage 2 or greater) in survivors. | ||||
| Outcome or subgroup title | No. of studies | No. of participants | Statistical method | Effect size |
| 1 Death by 36 to 37 weeks or discharge Show forest plot | 17 | 3329 | Risk Ratio (M‐H, Fixed, 95% CI) | 0.95 [0.81, 1.10] |
| Analysis 2.1  Comparison 2 HFOV versus CV subgrouped by volume strategy on HFOV, Outcome 1 Death by 36 to 37 weeks or discharge. | ||||
| 1.1 High volume strategy on HFOV with target FiO2 ≤ 0.30 | 8 | 1755 | Risk Ratio (M‐H, Fixed, 95% CI) | 0.87 [0.71, 1.08] |
| 1.2 High volume strategy on HFOV with target FiO2 > 0.30 or not specified | 8 | 1478 | Risk Ratio (M‐H, Fixed, 95% CI) | 1.02 [0.81, 1.28] |
| 1.3 No high volume strategy on HFOV | 1 | 96 | Risk Ratio (M‐H, Fixed, 95% CI) | 1.36 [0.39, 4.75] |
| 2 CLD at 36 to 37 weeks PMA or discharge in survivors Show forest plot | 17 | 2786 | Risk Ratio (M‐H, Fixed, 95% CI) | 0.86 [0.78, 0.96] |
| Analysis 2.2  Comparison 2 HFOV versus CV subgrouped by volume strategy on HFOV, Outcome 2 CLD at 36 to 37 weeks PMA or discharge in survivors. | ||||
| 2.1 High volume strategy on HFOV with target FiO2 ≤ 0.30 | 8 | 1483 | Risk Ratio (M‐H, Fixed, 95% CI) | 0.87 [0.76, 0.99] |
| 2.2 High volume strategy on HFOV with target FiO2 > 0.30 or not specified | 8 | 1216 | Risk Ratio (M‐H, Fixed, 95% CI) | 0.86 [0.73, 1.00] |
| 2.3 No high volume strategy of HFOV | 1 | 87 | Risk Ratio (M‐H, Fixed, 95% CI) | 0.0 [0.0, 0.0] |
| 3 Death or CLD at 36 to 37 weeks PMA or discharge Show forest plot | 17 | 3329 | Risk Ratio (M‐H, Fixed, 95% CI) | 0.90 [0.84, 0.97] |
| Analysis 2.3  Comparison 2 HFOV versus CV subgrouped by volume strategy on HFOV, Outcome 3 Death or CLD at 36 to 37 weeks PMA or discharge. | ||||
| 3.1 High volume strategy on HFOV with target FiO2 ≤ 0.30 | 8 | 1755 | Risk Ratio (M‐H, Fixed, 95% CI) | 0.89 [0.81, 0.97] |
| 3.2 High volume strategy on HFOV with target FiO2 > 0.30 or not specified | 8 | 1478 | Risk Ratio (M‐H, Fixed, 95% CI) | 0.91 [0.81, 1.02] |
| 3.3 No high volume strategy on HFOV | 1 | 96 | Risk Ratio (M‐H, Fixed, 95% CI) | 1.36 [0.39, 4.75] |
| 4 Gross pulmonary air leak Show forest plot | 11 | 2185 | Risk Ratio (M‐H, Fixed, 95% CI) | 1.13 [0.88, 1.45] |
| Analysis 2.4  Comparison 2 HFOV versus CV subgrouped by volume strategy on HFOV, Outcome 4 Gross pulmonary air leak. | ||||
| 4.1 High volume strategy HFOV with target FiO2 ≤ 0.30 | 4 | 705 | Risk Ratio (M‐H, Fixed, 95% CI) | 0.96 [0.61, 1.51] |
| 4.2 High volume strategy on HFOV with target FiO2 > 0.30 or not specified | 6 | 1384 | Risk Ratio (M‐H, Fixed, 95% CI) | 1.26 [0.93, 1.71] |
| 4.3 No high volume strategy on HFOV | 1 | 96 | Risk Ratio (M‐H, Fixed, 95% CI) | 0.65 [0.17, 2.58] |
| 5 Intraventricular haemorrhage ‐ grades 3 or 4 Show forest plot | 18 | 4069 | Risk Ratio (M‐H, Fixed, 95% CI) | 1.10 [0.95, 1.27] |
| Analysis 2.5  Comparison 2 HFOV versus CV subgrouped by volume strategy on HFOV, Outcome 5 Intraventricular haemorrhage ‐ grades 3 or 4. | ||||
| 5.1 High volume strategy on HFOV with target FiO2 ≤ 0.30 | 7 | 1730 | Risk Ratio (M‐H, Fixed, 95% CI) | 0.84 [0.65, 1.08] |
| 5.2 High volume strategy on HFOV with target FiO2 > 0.30 or not specified | 9 | 1570 | Risk Ratio (M‐H, Fixed, 95% CI) | 1.17 [0.92, 1.48] |
| 5.3 No high volume strategy on HFOV | 2 | 769 | Risk Ratio (M‐H, Fixed, 95% CI) | 1.45 [1.09, 1.93] |
| 6 Periventricular leukomalacia Show forest plot | 17 | 3983 | Risk Ratio (M‐H, Fixed, 95% CI) | 1.03 [0.81, 1.31] |
| Analysis 2.6  Comparison 2 HFOV versus CV subgrouped by volume strategy on HFOV, Outcome 6 Periventricular leukomalacia. | ||||
| 6.1 High volume strategy on HFOV with target FiO2 ≤ 0.30 | 8 | 1755 | Risk Ratio (M‐H, Fixed, 95% CI) | 0.91 [0.55, 1.48] |
| 6.2 High volume strategy with target FiO2 > 0.30 or not specified | 7 | 1459 | Risk Ratio (M‐H, Fixed, 95% CI) | 0.85 [0.60, 1.21] |
| 6.3 No high volume strategy on HFOV | 2 | 769 | Risk Ratio (M‐H, Fixed, 95% CI) | 1.64 [1.02, 2.64] |
| Outcome or subgroup title | No. of studies | No. of participants | Statistical method | Effect size |
| 1 Death by 36 to 37 weeks or discharge Show forest plot | 16 | 3233 | Risk Ratio (M‐H, Fixed, 95% CI) | 0.94 [0.80, 1.10] |
| Analysis 3.1  Comparison 3 HFOV versus CV subgrouped by use of surfactant, Outcome 1 Death by 36 to 37 weeks or discharge. | ||||
| 1.1 Routine surfactant | 15 | 3168 | Risk Ratio (M‐H, Fixed, 95% CI) | 0.94 [0.80, 1.10] |
| 1.2 No routine surfactant | 1 | 65 | Risk Ratio (M‐H, Fixed, 95% CI) | 1.01 [0.40, 2.58] |
| 2 CLD at 36 to 37 weeks PMA or discharge in survivors Show forest plot | 16 | 2699 | Risk Ratio (M‐H, Fixed, 95% CI) | 0.86 [0.78, 0.96] |
| Analysis 3.2  Comparison 3 HFOV versus CV subgrouped by use of surfactant, Outcome 2 CLD at 36 to 37 weeks PMA or discharge in survivors. | ||||
| 2.1 Routine surfactant | 15 | 2648 | Risk Ratio (M‐H, Fixed, 95% CI) | 0.88 [0.80, 0.97] |
| 2.2 No routine surfactant | 1 | 51 | Risk Ratio (M‐H, Fixed, 95% CI) | 0.23 [0.07, 0.73] |
| 3 Death or CLD at 36 to 37 weeks PMA or discharge Show forest plot | 16 | 3233 | Risk Ratio (M‐H, Fixed, 95% CI) | 0.90 [0.83, 0.97] |
| Analysis 3.3  Comparison 3 HFOV versus CV subgrouped by use of surfactant, Outcome 3 Death or CLD at 36 to 37 weeks PMA or discharge. | ||||
| 3.1 Routine surfactant | 15 | 3168 | Risk Ratio (M‐H, Fixed, 95% CI) | 0.91 [0.84, 0.98] |
| 3.2 No routine surfactant | 1 | 65 | Risk Ratio (M‐H, Fixed, 95% CI) | 0.52 [0.29, 0.94] |
| 4 Gross pulmonary air leak Show forest plot | 10 | 2089 | Risk Ratio (M‐H, Fixed, 95% CI) | 1.15 [0.90, 1.49] |
| Analysis 3.4  Comparison 3 HFOV versus CV subgrouped by use of surfactant, Outcome 4 Gross pulmonary air leak. | ||||
| 4.1 Routine surfactant | 9 | 2024 | Risk Ratio (M‐H, Fixed, 95% CI) | 1.14 [0.87, 1.49] |
| 4.2 No routine surfactant | 1 | 65 | Risk Ratio (M‐H, Fixed, 95% CI) | 1.32 [0.65, 2.71] |
| 5 Intraventricular haemorrhage ‐ grades 3 or 4 Show forest plot | 16 | 3300 | Risk Ratio (M‐H, Fixed, 95% CI) | 1.00 [0.84, 1.19] |
| Analysis 3.5  Comparison 3 HFOV versus CV subgrouped by use of surfactant, Outcome 5 Intraventricular haemorrhage ‐ grades 3 or 4. | ||||
| 5.1 Routine surfactant | 15 | 3235 | Risk Ratio (M‐H, Fixed, 95% CI) | 1.00 [0.84, 1.19] |
| 5.2 No routine surfactant | 1 | 65 | Risk Ratio (M‐H, Fixed, 95% CI) | 0.88 [0.33, 2.34] |
| 6 Periventricular leukomalacia Show forest plot | 15 | 3214 | Risk Ratio (M‐H, Fixed, 95% CI) | 0.87 [0.65, 1.16] |
| Analysis 3.6  Comparison 3 HFOV versus CV subgrouped by use of surfactant, Outcome 6 Periventricular leukomalacia. | ||||
| 6.1 Routine surfactant | 15 | 3214 | Risk Ratio (M‐H, Fixed, 95% CI) | 0.87 [0.65, 1.16] |
| 6.2 No routine surfactant | 0 | 0 | Risk Ratio (M‐H, Fixed, 95% CI) | 0.0 [0.0, 0.0] |
| Outcome or subgroup title | No. of studies | No. of participants | Statistical method | Effect size |
| 1 Death by 36 to 37 weeks or discharge Show forest plot | 16 | 3233 | Risk Ratio (M‐H, Fixed, 95% CI) | 0.94 [0.80, 1.10] |
| Analysis 4.1  Comparison 4 HFOV versus CV subgrouped by type of HFO ventilator, Outcome 1 Death by 36 to 37 weeks or discharge. | ||||
| 1.1 Flow interrupter | 4 | 410 | Risk Ratio (M‐H, Fixed, 95% CI) | 0.94 [0.52, 1.69] |
| 1.2 HF oscillator | 11 | 2026 | Risk Ratio (M‐H, Fixed, 95% CI) | 0.93 [0.75, 1.16] |
| 1.3 Both HF oscillation and flow interruptors | 1 | 797 | Risk Ratio (M‐H, Fixed, 95% CI) | 0.95 [0.75, 1.20] |
| 2 CLD at 36 to 37 weeks PMA or discharge in survivors Show forest plot | 16 | 2699 | Risk Ratio (M‐H, Fixed, 95% CI) | 0.86 [0.78, 0.96] |
| Analysis 4.2  Comparison 4 HFOV versus CV subgrouped by type of HFO ventilator, Outcome 2 CLD at 36 to 37 weeks PMA or discharge in survivors. | ||||
| 2.1 Flow interrupter | 4 | 370 | Risk Ratio (M‐H, Fixed, 95% CI) | 0.96 [0.70, 1.32] |
| 2.2 HF oscillator | 11 | 1737 | Risk Ratio (M‐H, Fixed, 95% CI) | 0.77 [0.67, 0.90] |
| 2.3 Both HF oscillators and flow interrupters | 1 | 592 | Risk Ratio (M‐H, Fixed, 95% CI) | 0.99 [0.85, 1.14] |
| 3 Death or CLD at 36 to 37 weeks PMA or discharge Show forest plot | 16 | 3233 | Risk Ratio (M‐H, Fixed, 95% CI) | 0.90 [0.83, 0.97] |
| Analysis 4.3  Comparison 4 HFOV versus CV subgrouped by type of HFO ventilator, Outcome 3 Death or CLD at 36 to 37 weeks PMA or discharge. | ||||
| 3.1 HF flow interrupter | 4 | 410 | Risk Ratio (M‐H, Fixed, 95% CI) | 0.96 [0.74, 1.24] |
| 3.2 HF oscillation | 11 | 2026 | Risk Ratio (M‐H, Fixed, 95% CI) | 0.83 [0.74, 0.93] |
| 3.3 Both HF oscillators and HF flow interrupters | 1 | 797 | Risk Ratio (M‐H, Fixed, 95% CI) | 0.98 [0.89, 1.08] |
| 4 Gross pulmonary air leak Show forest plot | 10 | 2089 | Risk Ratio (M‐H, Fixed, 95% CI) | 1.15 [0.90, 1.49] |
| Analysis 4.4  Comparison 4 HFOV versus CV subgrouped by type of HFO ventilator, Outcome 4 Gross pulmonary air leak. | ||||
| 4.1 HF flow interrupter | 2 | 324 | Risk Ratio (M‐H, Fixed, 95% CI) | 1.88 [0.96, 3.67] |
| 4.2 HF oscillation | 8 | 1765 | Risk Ratio (M‐H, Fixed, 95% CI) | 1.06 [0.80, 1.39] |
| 4.3 Both HF oscillators and HF flow interrupters | 0 | 0 | Risk Ratio (M‐H, Fixed, 95% CI) | 0.0 [0.0, 0.0] |
| 5 Intraventricular haemorrhage ‐ grades 3 or 4 Show forest plot | 16 | 3300 | Risk Ratio (M‐H, Fixed, 95% CI) | 1.00 [0.84, 1.19] |
| Analysis 4.5  Comparison 4 HFOV versus CV subgrouped by type of HFO ventilator, Outcome 5 Intraventricular haemorrhage ‐ grades 3 or 4. | ||||
| 5.1 HF flow interrupter | 4 | 410 | Risk Ratio (M‐H, Fixed, 95% CI) | 1.08 [0.65, 1.78] |
| 5.2 HF oscillator | 11 | 2093 | Risk Ratio (M‐H, Fixed, 95% CI) | 1.11 [0.90, 1.36] |
| 5.3 Both HF oscillators and HF flow interrupters | 1 | 797 | Risk Ratio (M‐H, Fixed, 95% CI) | 0.69 [0.46, 1.01] |
| 6 Periventricular leukomalacia Show forest plot | 16 | 3216 | Risk Ratio (M‐H, Fixed, 95% CI) | 0.87 [0.65, 1.16] |
| Analysis 4.6  Comparison 4 HFOV versus CV subgrouped by type of HFO ventilator, Outcome 6 Periventricular leukomalacia. | ||||
| 6.1 HF flow interrupter | 3 | 364 | Risk Ratio (M‐H, Fixed, 95% CI) | 2.29 [0.52, 10.04] |
| 6.2 HF oscillator | 12 | 2055 | Risk Ratio (M‐H, Fixed, 95% CI) | 0.82 [0.60, 1.11] |
| 6.3 Both HF oscillators and HF flow interrupters | 1 | 797 | Risk Ratio (M‐H, Fixed, 95% CI) | 0.99 [0.38, 2.62] |
| Outcome or subgroup title | No. of studies | No. of participants | Statistical method | Effect size |
| 1 Death by 36 to 37 weeks or discharge Show forest plot | 16 | 3233 | Risk Ratio (M‐H, Fixed, 95% CI) | 0.94 [0.80, 1.10] |
| Analysis 5.1  Comparison 5 HFOV versus CV subgrouped by lung protective (LPS) CV strategy, Outcome 1 Death by 36 to 37 weeks or discharge. | ||||
| 1.1 Definitive LPS on CV | 9 | 1679 | Risk Ratio (M‐H, Fixed, 95% CI) | 0.91 [0.70, 1.18] |
| 1.2 Probable LPS on CV | 3 | 1116 | Risk Ratio (M‐H, Fixed, 95% CI) | 0.98 [0.80, 1.21] |
| 1.3 Probably no LPS on CV | 2 | 248 | Risk Ratio (M‐H, Fixed, 95% CI) | 0.89 [0.52, 1.53] |
| 1.4 Definitively no LPS on CV | 2 | 190 | Risk Ratio (M‐H, Fixed, 95% CI) | 0.79 [0.33, 1.88] |
| 2 CLD at 36 to 37 weeks PMA or discharge in survivors Show forest plot | 16 | 2699 | Risk Ratio (M‐H, Fixed, 95% CI) | 0.86 [0.78, 0.96] |
| Analysis 5.2  Comparison 5 HFOV versus CV subgrouped by lung protective (LPS) CV strategy, Outcome 2 CLD at 36 to 37 weeks PMA or discharge in survivors. | ||||
| 2.1 Definitive LPS on CV | 9 | 1473 | Risk Ratio (M‐H, Fixed, 95% CI) | 0.79 [0.66, 0.94] |
| 2.2 Probable LPS on CV | 3 | 847 | Risk Ratio (M‐H, Fixed, 95% CI) | 0.96 [0.84, 1.10] |
| 2.3 Probably no LPS on CV | 2 | 205 | Risk Ratio (M‐H, Fixed, 95% CI) | 1.09 [0.79, 1.49] |
| 2.4 Definitively no LPS on CV | 2 | 174 | Risk Ratio (M‐H, Fixed, 95% CI) | 0.48 [0.31, 0.75] |
| 3 Death or CLD at 36 to 37 weeks PMA or discharge Show forest plot | 16 | 3235 | Risk Ratio (M‐H, Fixed, 95% CI) | 0.90 [0.83, 0.96] |
| Analysis 5.3  Comparison 5 HFOV versus CV subgrouped by lung protective (LPS) CV strategy, Outcome 3 Death or CLD at 36 to 37 weeks PMA or discharge. | ||||
| 3.1 Definitive LPS on CV | 9 | 1679 | Risk Ratio (M‐H, Fixed, 95% CI) | 0.83 [0.72, 0.95] |
| 3.2 Probable LPS on CV | 3 | 1118 | Risk Ratio (M‐H, Fixed, 95% CI) | 0.97 [0.89, 1.07] |
| 3.3 Probably no LPS on CV | 2 | 248 | Risk Ratio (M‐H, Fixed, 95% CI) | 1.04 [0.82, 1.31] |
| 3.4 Definitively no LPS on CV | 2 | 190 | Risk Ratio (M‐H, Fixed, 95% CI) | 0.56 [0.38, 0.81] |
| 4 Gross pulmonary air leak Show forest plot | 10 | 2089 | Risk Ratio (M‐H, Fixed, 95% CI) | 1.15 [0.90, 1.49] |
| Analysis 5.4  Comparison 5 HFOV versus CV subgrouped by lung protective (LPS) CV strategy, Outcome 4 Gross pulmonary air leak. | ||||
| 4.1 Definitive LPS on CV | 6 | 1503 | Risk Ratio (M‐H, Fixed, 95% CI) | 1.04 [0.77, 1.41] |
| 4.2 Probable LPS on CV | 1 | 273 | Risk Ratio (M‐H, Fixed, 95% CI) | 1.69 [0.51, 5.63] |
| 4.3 Probably no LPS on CV | 2 | 248 | Risk Ratio (M‐H, Fixed, 95% CI) | 1.53 [0.77, 3.04] |
| 4.4 Definitively no LPS on CV | 1 | 65 | Risk Ratio (M‐H, Fixed, 95% CI) | 1.32 [0.65, 2.71] |
| 5 Intraventricular haemorrhage ‐ grades 3 or 4 Show forest plot | 16 | 3300 | Risk Ratio (M‐H, Fixed, 95% CI) | 1.00 [0.84, 1.19] |
| Analysis 5.5  Comparison 5 HFOV versus CV subgrouped by lung protective (LPS) CV strategy, Outcome 5 Intraventricular haemorrhage ‐ grades 3 or 4. | ||||
| 5.1 Definitive LPS on CV | 8 | 1654 | Risk Ratio (M‐H, Fixed, 95% CI) | 1.03 [0.81, 1.30] |
| 5.2 Probable LPS on CV | 3 | 1116 | Risk Ratio (M‐H, Fixed, 95% CI) | 0.95 [0.71, 1.27] |
| 5.3 Probably no LPS on CV | 3 | 340 | Risk Ratio (M‐H, Fixed, 95% CI) | 1.32 [0.73, 2.37] |
| 5.4 Definitively no PLS on CV | 2 | 190 | Risk Ratio (M‐H, Fixed, 95% CI) | 0.62 [0.27, 1.39] |
| 6 Periventricular leukomalacia Show forest plot | 15 | 3214 | Risk Ratio (M‐H, Fixed, 95% CI) | 0.87 [0.65, 1.16] |
| Analysis 5.6  Comparison 5 HFOV versus CV subgrouped by lung protective (LPS) CV strategy, Outcome 6 Periventricular leukomalacia. | ||||
| 6.1 Definitive LPS on CV | 9 | 1679 | Risk Ratio (M‐H, Fixed, 95% CI) | 0.88 [0.61, 1.28] |
| 6.2 Probable LPS on CV | 2 | 1070 | Risk Ratio (M‐H, Fixed, 95% CI) | 0.82 [0.48, 1.42] |
| 6.3 Probably no LPS on CV | 3 | 340 | Risk Ratio (M‐H, Fixed, 95% CI) | 0.78 [0.30, 2.06] |
| 6.4 Definitively no LPS on CV | 1 | 125 | Risk Ratio (M‐H, Fixed, 95% CI) | 1.27 [0.30, 5.45] |
| Outcome or subgroup title | No. of studies | No. of participants | Statistical method | Effect size |
| 1 Death by 36 to 37 weeks or discharge Show forest plot | 14 | 2887 | Risk Ratio (M‐H, Fixed, 95% CI) | 0.91 [0.78, 1.07] |
| Analysis 6.1  Comparison 6 HFOV versus CV subgrouped by age at randomisation, Outcome 1 Death by 36 to 37 weeks or discharge. | ||||
| 1.1 Less than 2 hours | 7 | 1315 | Risk Ratio (M‐H, Fixed, 95% CI) | 0.95 [0.77, 1.18] |
| 1.2 2 to 6 hours | 5 | 1300 | Risk Ratio (M‐H, Fixed, 95% CI) | 0.85 [0.64, 1.14] |
| 1.3 Greater than 6 hours | 2 | 272 | Risk Ratio (M‐H, Fixed, 95% CI) | 0.91 [0.56, 1.48] |
| 2 CLD at 36 to 37 weeks PMA or discharge in survivors Show forest plot | 14 | 2404 | Risk Ratio (M‐H, Fixed, 95% CI) | 0.84 [0.75, 0.93] |
| Analysis 6.2  Comparison 6 HFOV versus CV subgrouped by age at randomisation, Outcome 2 CLD at 36 to 37 weeks PMA or discharge in survivors. | ||||
| 2.1 Less than 2 hours | 7 | 1058 | Risk Ratio (M‐H, Fixed, 95% CI) | 0.94 [0.82, 1.08] |
| 2.2 2 to 6 hours | 5 | 1127 | Risk Ratio (M‐H, Fixed, 95% CI) | 0.68 [0.56, 0.81] |
| 2.3 Greater than 6 hours | 2 | 219 | Risk Ratio (M‐H, Fixed, 95% CI) | 1.00 [0.74, 1.37] |
| 3 Death or CLD at 36 to 37 weeks PMA or discharge Show forest plot | 14 | 2887 | Risk Ratio (M‐H, Fixed, 95% CI) | 0.87 [0.81, 0.94] |
| Analysis 6.3  Comparison 6 HFOV versus CV subgrouped by age at randomisation, Outcome 3 Death or CLD at 36 to 37 weeks PMA or discharge. | ||||
| 3.1 Less than 2 hours | 7 | 1315 | Risk Ratio (M‐H, Fixed, 95% CI) | 0.95 [0.87, 1.05] |
| 3.2 2‐6 hours | 5 | 1300 | Risk Ratio (M‐H, Fixed, 95% CI) | 0.74 [0.64, 0.85] |
| 3.3 Greater than 6 hours | 2 | 272 | Risk Ratio (M‐H, Fixed, 95% CI) | 0.99 [0.79, 1.23] |
| 4 Gross pulmonary air leak Show forest plot | 9 | 1789 | Risk Ratio (M‐H, Fixed, 95% CI) | 1.12 [0.86, 1.46] |
| Analysis 6.4  Comparison 6 HFOV versus CV subgrouped by age at randomisation, Outcome 4 Gross pulmonary air leak. | ||||
| 4.1 Less than 2 hours | 4 | 390 | Risk Ratio (M‐H, Fixed, 95% CI) | 1.54 [0.84, 2.82] |
| 4.2 2 ‐ 6 hours | 3 | 1127 | Risk Ratio (M‐H, Fixed, 95% CI) | 0.87 [0.60, 1.24] |
| 4.3 Greater than 6 hours | 2 | 272 | Risk Ratio (M‐H, Fixed, 95% CI) | 1.55 [0.92, 2.59] |
| 5 Intraventricular haemorrhage ‐ grades 3 or 4 Show forest plot | 15 | 3050 | Risk Ratio (M‐H, Fixed, 95% CI) | 1.01 [0.85, 1.21] |
| Analysis 6.5  Comparison 6 HFOV versus CV subgrouped by age at randomisation, Outcome 5 Intraventricular haemorrhage ‐ grades 3 or 4. | ||||
| 5.1 less than 2 hours | 7 | 1382 | Risk Ratio (M‐H, Fixed, 95% CI) | 0.80 [0.59, 1.08] |
| 5.2 2 ‐ 6 hours | 6 | 1396 | Risk Ratio (M‐H, Fixed, 95% CI) | 1.15 [0.90, 1.46] |
| 5.3 Greater than 6 hours | 2 | 272 | Risk Ratio (M‐H, Fixed, 95% CI) | 1.18 [0.69, 2.01] |
| 6 Periventricular leukomalacia Show forest plot | 15 | 2916 | Risk Ratio (M‐H, Fixed, 95% CI) | 0.82 [0.61, 1.11] |
| Analysis 6.6  Comparison 6 HFOV versus CV subgrouped by age at randomisation, Outcome 6 Periventricular leukomalacia. | ||||
| 6.1 Less than 2 hours | 8 | 1407 | Risk Ratio (M‐H, Fixed, 95% CI) | 1.00 [0.52, 1.90] |
| 6.2 2 ‐ 6 hours | 5 | 1300 | Risk Ratio (M‐H, Fixed, 95% CI) | 0.76 [0.53, 1.08] |
| 6.3 Greater than 6 hours | 2 | 209 | Risk Ratio (M‐H, Fixed, 95% CI) | 1.03 [0.26, 4.01] |
| Outcome or subgroup title | No. of studies | No. of participants | Statistical method | Effect size |
| 1 Death by 36 to 37 weeks or discharge Show forest plot | 16 | 3233 | Risk Ratio (M‐H, Fixed, 95% CI) | 0.94 [0.80, 1.10] |
| Analysis 7.1  Comparison 7 HFOV versus CV subgrouped by I:E ratio on HFOV, Outcome 1 Death by 36 to 37 weeks or discharge. | ||||
| 1.1 1:1 | 1 | 273 | Risk Ratio (M‐H, Fixed, 95% CI) | 1.11 [0.70, 1.75] |
| 1.2 1:2 | 9 | 1397 | Risk Ratio (M‐H, Fixed, 95% CI) | 0.97 [0.75, 1.25] |
| 1.3 Range of I:Es or unknown | 6 | 1563 | Risk Ratio (M‐H, Fixed, 95% CI) | 0.89 [0.71, 1.10] |
| 2 CLD at 36 to 37 weeks PMA or discharge in survivors Show forest plot | 16 | 2699 | Risk Ratio (M‐H, Fixed, 99% CI) | 0.86 [0.76, 0.99] |
| Analysis 7.2  Comparison 7 HFOV versus CV subgrouped by I:E ratio on HFOV, Outcome 2 CLD at 36 to 37 weeks PMA or discharge in survivors. | ||||
| 2.1 1:1 | 1 | 215 | Risk Ratio (M‐H, Fixed, 99% CI) | 0.79 [0.43, 1.46] |
| 2.2 1:2 | 9 | 1183 | Risk Ratio (M‐H, Fixed, 99% CI) | 0.81 [0.66, 1.01] |
| 2.3 Range of I:Es or unknown | 6 | 1301 | Risk Ratio (M‐H, Fixed, 99% CI) | 0.92 [0.77, 1.09] |
| 3 Death or CLD at 36 to 37 weeks PMA or discharge Show forest plot | 16 | 3233 | Risk Ratio (M‐H, Fixed, 95% CI) | 0.90 [0.83, 0.97] |
| Analysis 7.3  Comparison 7 HFOV versus CV subgrouped by I:E ratio on HFOV, Outcome 3 Death or CLD at 36 to 37 weeks PMA or discharge. | ||||
| 3.1 1:1 | 1 | 273 | Risk Ratio (M‐H, Fixed, 95% CI) | 0.93 [0.70, 1.24] |
| 3.2 1:2 | 9 | 1397 | Risk Ratio (M‐H, Fixed, 95% CI) | 0.87 [0.77, 0.98] |
| 3.3 Range of I:Es or unknown | 6 | 1563 | Risk Ratio (M‐H, Fixed, 95% CI) | 0.92 [0.83, 1.01] |
| 4 Gross pulmonary air leak Show forest plot | 11 | 2185 | Risk Ratio (M‐H, Fixed, 95% CI) | 1.13 [0.88, 1.45] |
| Analysis 7.4  Comparison 7 HFOV versus CV subgrouped by I:E ratio on HFOV, Outcome 4 Gross pulmonary air leak. | ||||
| 4.1 1:1 | 1 | 273 | Risk Ratio (M‐H, Fixed, 95% CI) | 1.69 [0.51, 5.63] |
| 4.2 1:2 | 7 | 1232 | Risk Ratio (M‐H, Fixed, 95% CI) | 1.17 [0.86, 1.58] |
| 4.3 Range of I:Es or unknown | 3 | 680 | Risk Ratio (M‐H, Fixed, 95% CI) | 0.99 [0.62, 1.57] |
| 5 Intraventricular haemorrhage ‐ grades 3 or 4 Show forest plot | 15 | 3259 | Risk Ratio (M‐H, Fixed, 95% CI) | 1.00 [0.84, 1.19] |
| Analysis 7.5  Comparison 7 HFOV versus CV subgrouped by I:E ratio on HFOV, Outcome 5 Intraventricular haemorrhage ‐ grades 3 or 4. | ||||
| 5.1 1:1 | 1 | 273 | Risk Ratio (M‐H, Fixed, 95% CI) | 1.73 [1.04, 2.87] |
| 5.2 1:2 | 7 | 1331 | Risk Ratio (M‐H, Fixed, 95% CI) | 0.97 [0.74, 1.26] |
| 5.3 Range of I:Es or unknown | 7 | 1655 | Risk Ratio (M‐H, Fixed, 95% CI) | 0.90 [0.70, 1.16] |
| 6 Periventricular leukomalacia Show forest plot | 15 | 3214 | Risk Ratio (M‐H, Fixed, 95% CI) | 0.87 [0.65, 1.16] |
| Analysis 7.6  Comparison 7 HFOV versus CV subgrouped by I:E ratio on HFOV, Outcome 6 Periventricular leukomalacia. | ||||
| 6.1 1:1 | 1 | 273 | Risk Ratio (M‐H, Fixed, 95% CI) | 0.75 [0.39, 1.45] |
| 6.2 1:2 | 8 | 1332 | Risk Ratio (M‐H, Fixed, 95% CI) | 0.96 [0.64, 1.43] |
| 6.3 Range of I:Es or unknown | 6 | 1609 | Risk Ratio (M‐H, Fixed, 95% CI) | 0.81 [0.48, 1.36] |
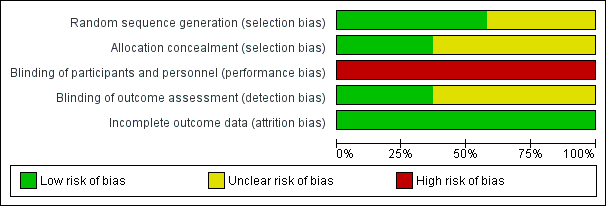
Risk of bias graph: review authors' judgements about each risk of bias item presented as percentages across all included studies.

Risk of bias summary: review authors' judgements about each risk of bias item for each included study.
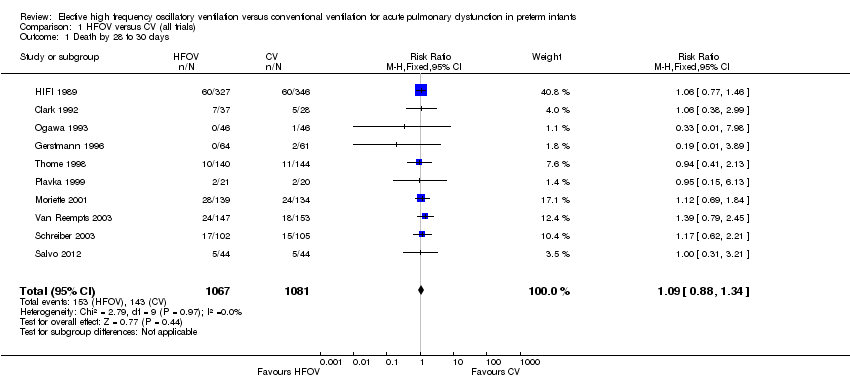
Comparison 1 HFOV versus CV (all trials), Outcome 1 Death by 28 to 30 days.
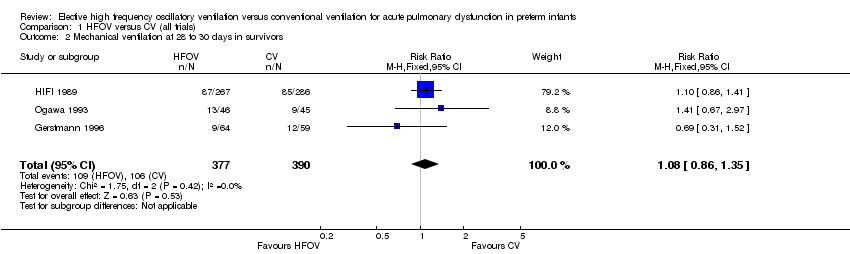
Comparison 1 HFOV versus CV (all trials), Outcome 2 Mechanical ventilation at 28 to 30 days in survivors.

Comparison 1 HFOV versus CV (all trials), Outcome 3 Oxygen at 28 to 30 days in survivors.

Comparison 1 HFOV versus CV (all trials), Outcome 4 CLD at 28 to 30 days (O2 + x‐ray) in survivors.

Comparison 1 HFOV versus CV (all trials), Outcome 5 Death or CLD at 28 to 30 days.

Comparison 1 HFOV versus CV (all trials), Outcome 6 Death by 36 to 37 weeks or discharge.

Comparison 1 HFOV versus CV (all trials), Outcome 7 CLD at 36 to 37 weeks PMA or discharge in survivors.
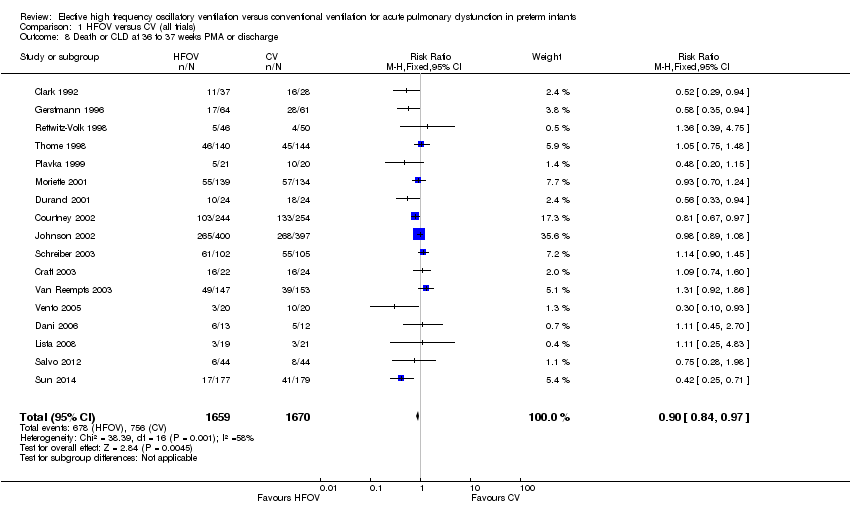
Comparison 1 HFOV versus CV (all trials), Outcome 8 Death or CLD at 36 to 37 weeks PMA or discharge.

Comparison 1 HFOV versus CV (all trials), Outcome 9 Any pulmonary air leak.
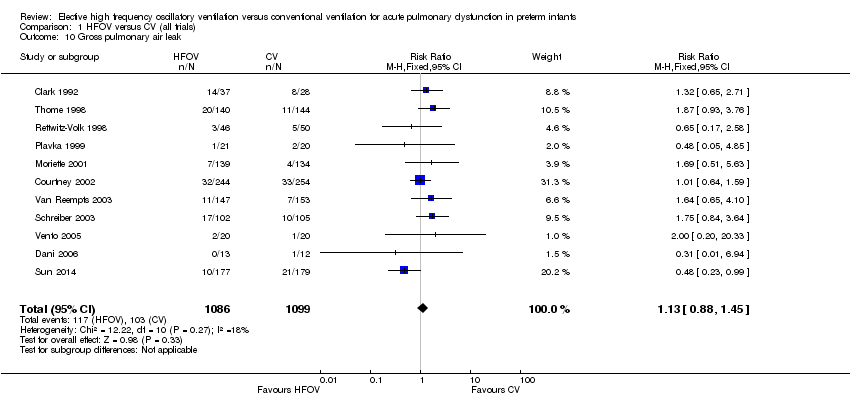
Comparison 1 HFOV versus CV (all trials), Outcome 10 Gross pulmonary air leak.
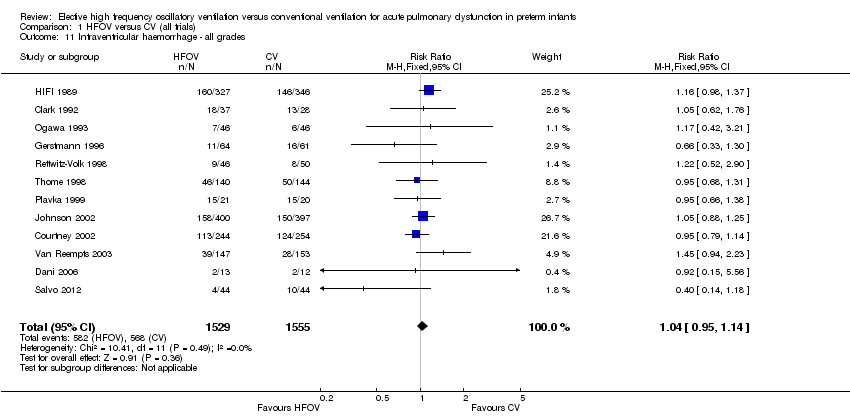
Comparison 1 HFOV versus CV (all trials), Outcome 11 Intraventricular haemorrhage ‐ all grades.
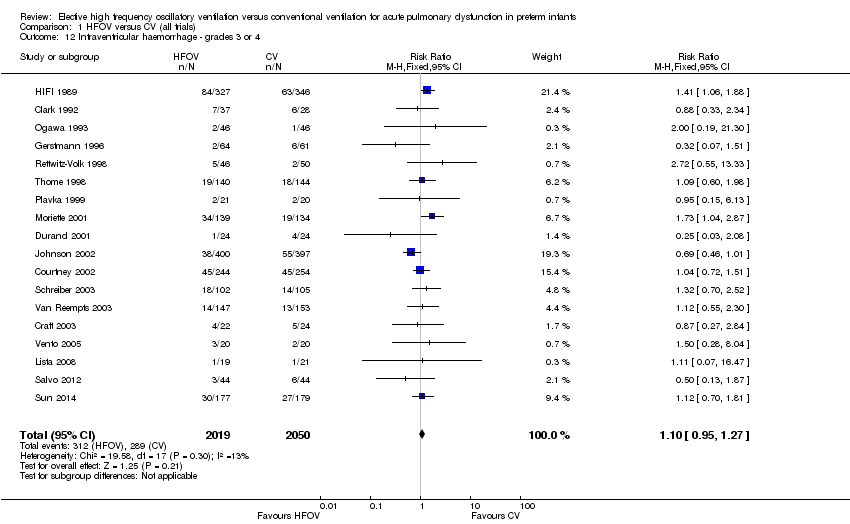
Comparison 1 HFOV versus CV (all trials), Outcome 12 Intraventricular haemorrhage ‐ grades 3 or 4.

Comparison 1 HFOV versus CV (all trials), Outcome 13 Periventricular leukomalacia.

Comparison 1 HFOV versus CV (all trials), Outcome 14 Retinopathy of prematurity (stage 2 or greater) in survivors.

Comparison 2 HFOV versus CV subgrouped by volume strategy on HFOV, Outcome 1 Death by 36 to 37 weeks or discharge.

Comparison 2 HFOV versus CV subgrouped by volume strategy on HFOV, Outcome 2 CLD at 36 to 37 weeks PMA or discharge in survivors.
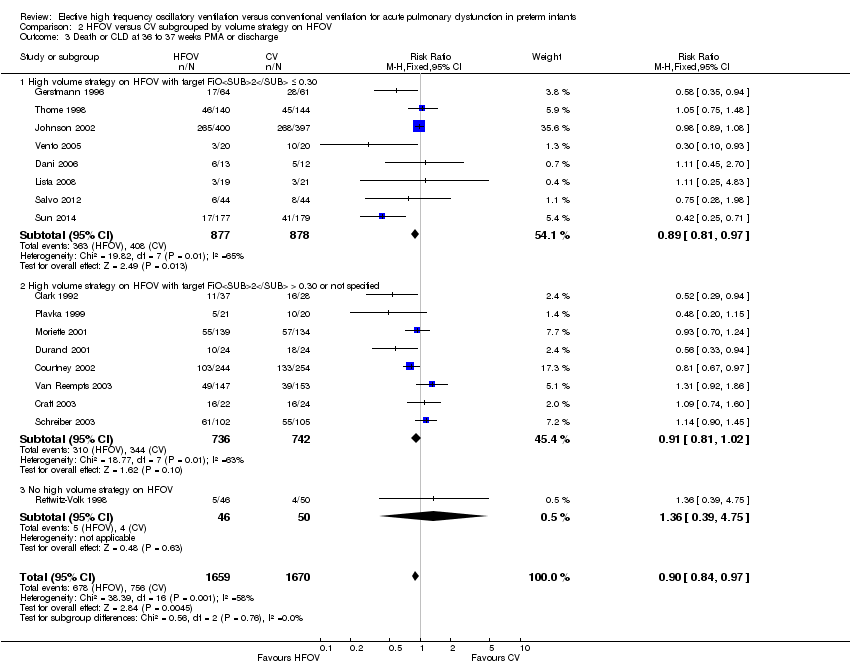
Comparison 2 HFOV versus CV subgrouped by volume strategy on HFOV, Outcome 3 Death or CLD at 36 to 37 weeks PMA or discharge.
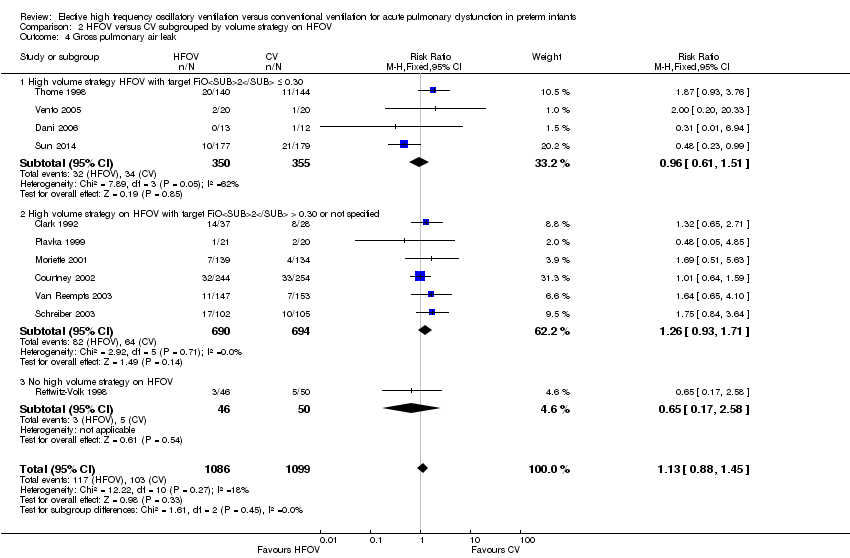
Comparison 2 HFOV versus CV subgrouped by volume strategy on HFOV, Outcome 4 Gross pulmonary air leak.
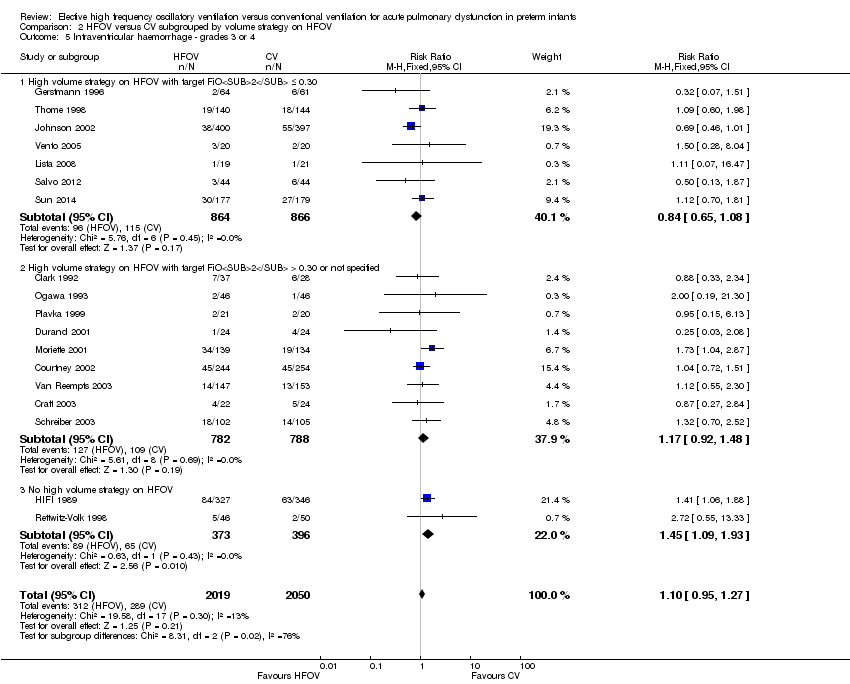
Comparison 2 HFOV versus CV subgrouped by volume strategy on HFOV, Outcome 5 Intraventricular haemorrhage ‐ grades 3 or 4.
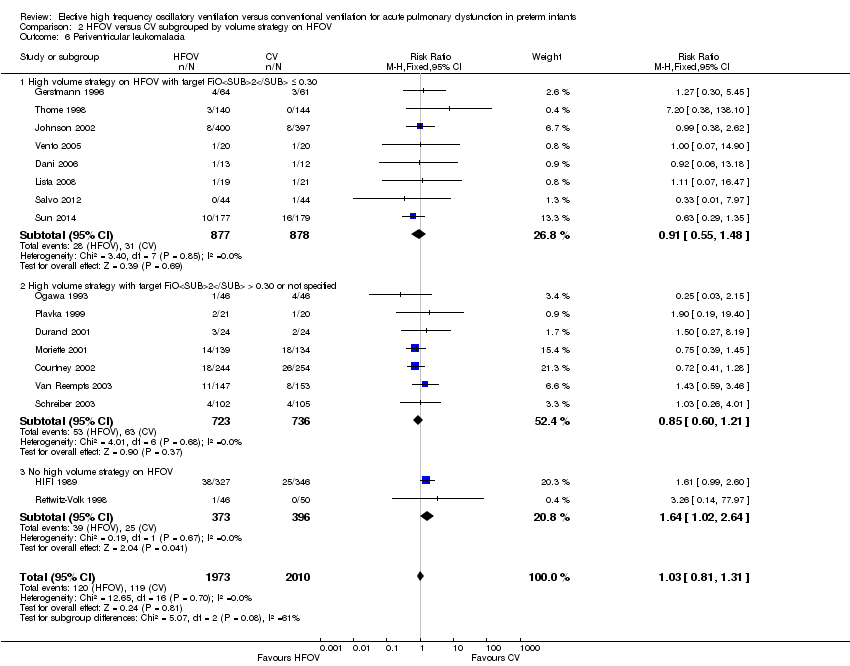
Comparison 2 HFOV versus CV subgrouped by volume strategy on HFOV, Outcome 6 Periventricular leukomalacia.
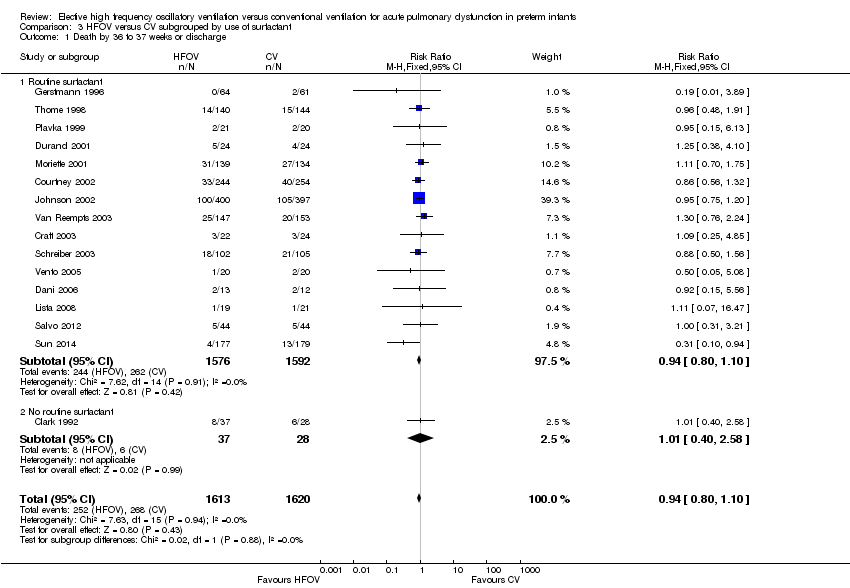
Comparison 3 HFOV versus CV subgrouped by use of surfactant, Outcome 1 Death by 36 to 37 weeks or discharge.
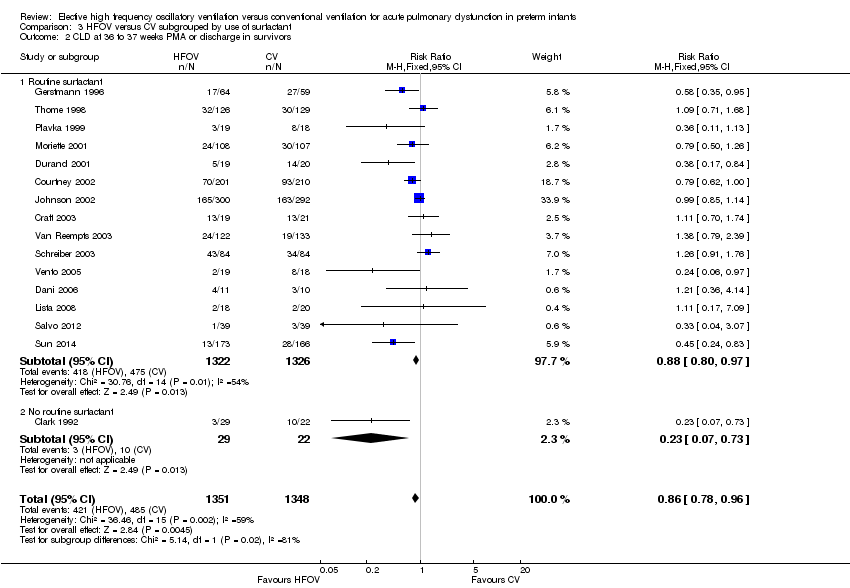
Comparison 3 HFOV versus CV subgrouped by use of surfactant, Outcome 2 CLD at 36 to 37 weeks PMA or discharge in survivors.
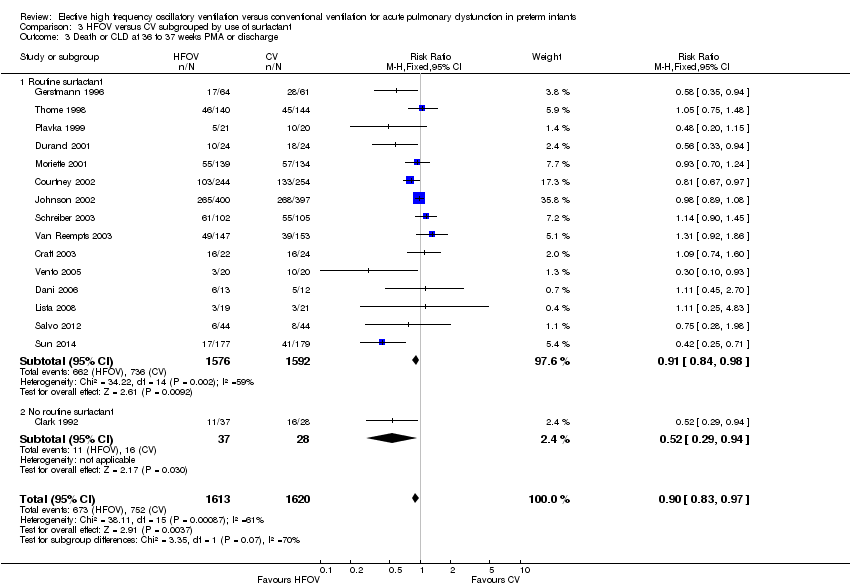
Comparison 3 HFOV versus CV subgrouped by use of surfactant, Outcome 3 Death or CLD at 36 to 37 weeks PMA or discharge.

Comparison 3 HFOV versus CV subgrouped by use of surfactant, Outcome 4 Gross pulmonary air leak.
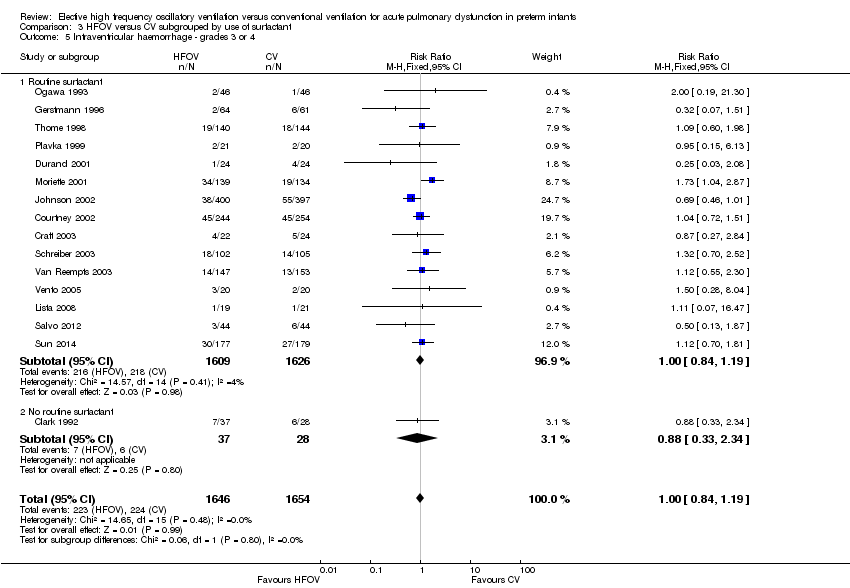
Comparison 3 HFOV versus CV subgrouped by use of surfactant, Outcome 5 Intraventricular haemorrhage ‐ grades 3 or 4.

Comparison 3 HFOV versus CV subgrouped by use of surfactant, Outcome 6 Periventricular leukomalacia.

Comparison 4 HFOV versus CV subgrouped by type of HFO ventilator, Outcome 1 Death by 36 to 37 weeks or discharge.

Comparison 4 HFOV versus CV subgrouped by type of HFO ventilator, Outcome 2 CLD at 36 to 37 weeks PMA or discharge in survivors.
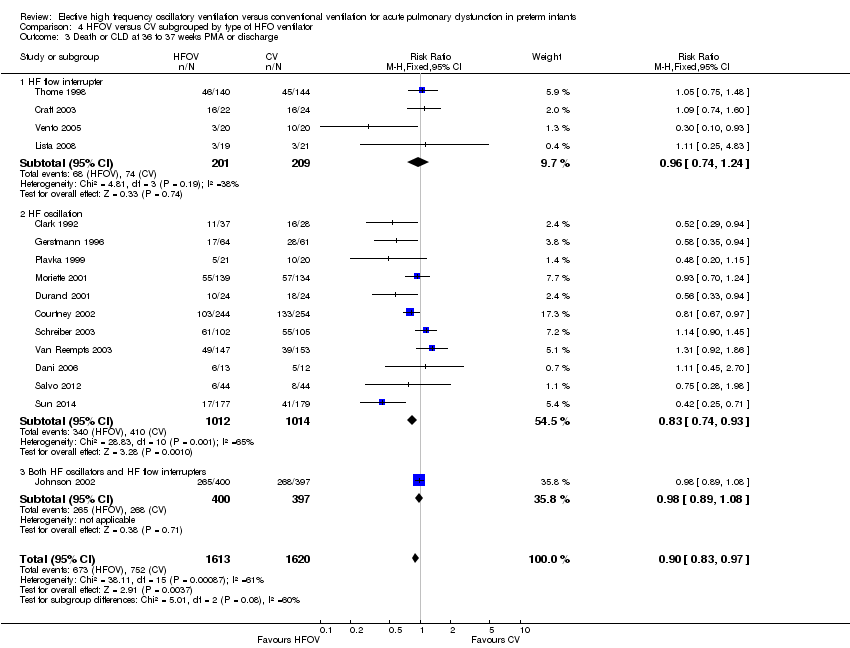
Comparison 4 HFOV versus CV subgrouped by type of HFO ventilator, Outcome 3 Death or CLD at 36 to 37 weeks PMA or discharge.
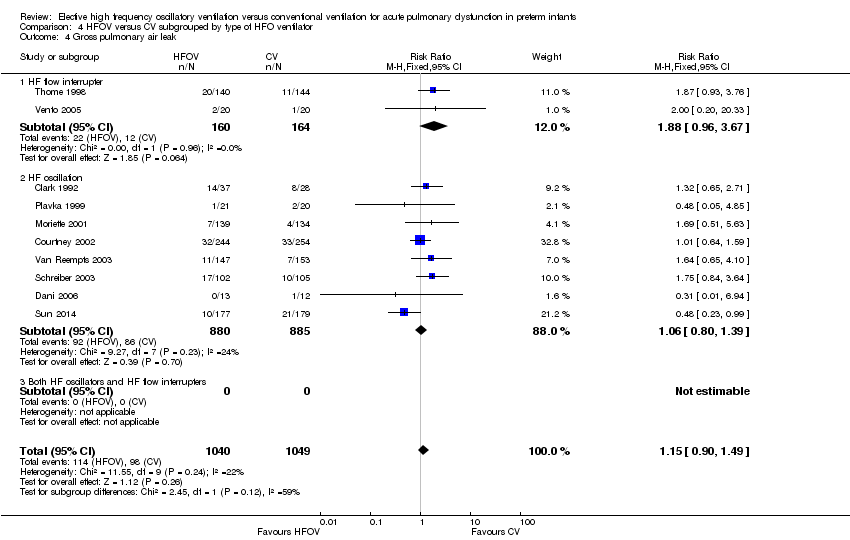
Comparison 4 HFOV versus CV subgrouped by type of HFO ventilator, Outcome 4 Gross pulmonary air leak.

Comparison 4 HFOV versus CV subgrouped by type of HFO ventilator, Outcome 5 Intraventricular haemorrhage ‐ grades 3 or 4.

Comparison 4 HFOV versus CV subgrouped by type of HFO ventilator, Outcome 6 Periventricular leukomalacia.

Comparison 5 HFOV versus CV subgrouped by lung protective (LPS) CV strategy, Outcome 1 Death by 36 to 37 weeks or discharge.
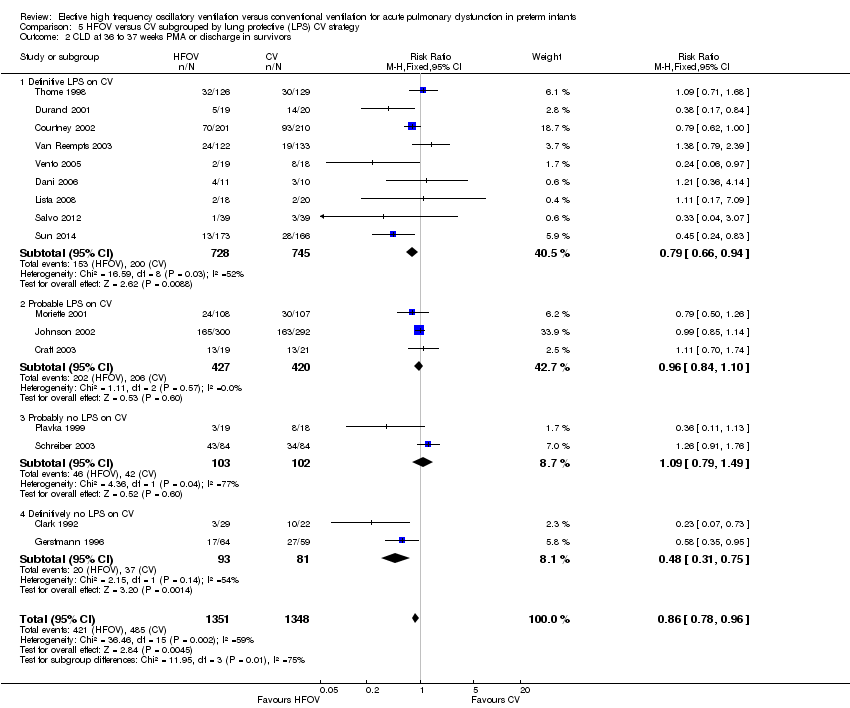
Comparison 5 HFOV versus CV subgrouped by lung protective (LPS) CV strategy, Outcome 2 CLD at 36 to 37 weeks PMA or discharge in survivors.

Comparison 5 HFOV versus CV subgrouped by lung protective (LPS) CV strategy, Outcome 3 Death or CLD at 36 to 37 weeks PMA or discharge.
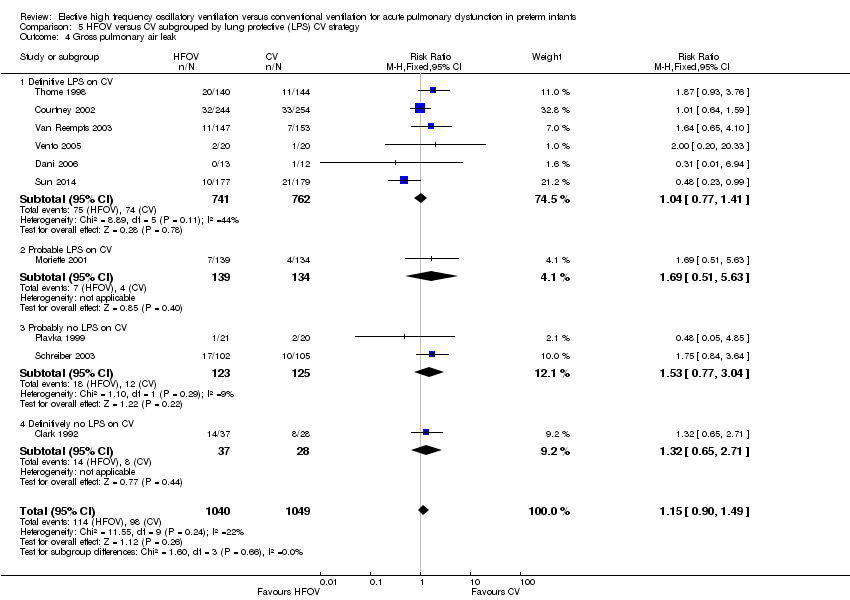
Comparison 5 HFOV versus CV subgrouped by lung protective (LPS) CV strategy, Outcome 4 Gross pulmonary air leak.
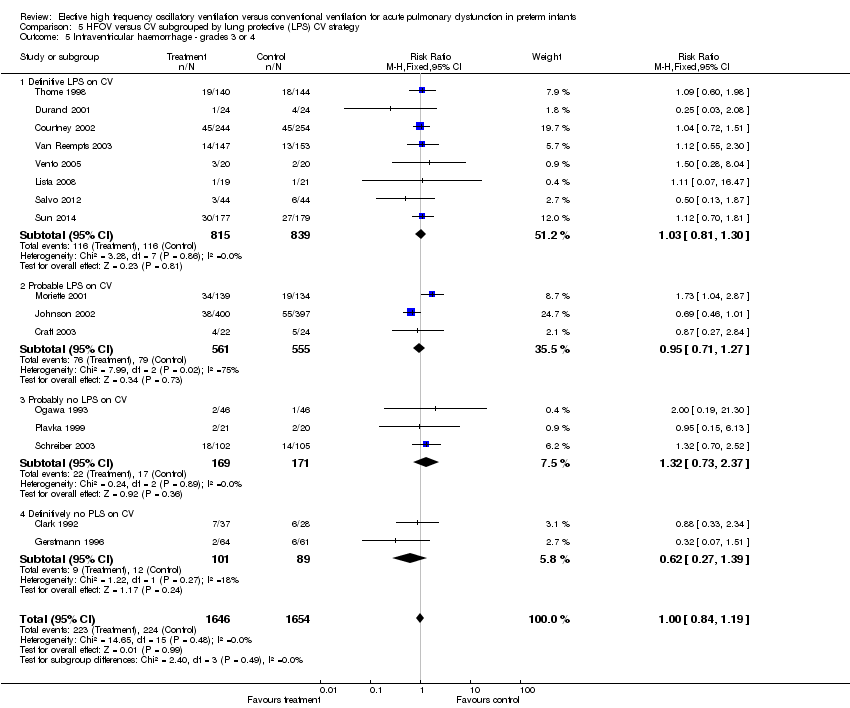
Comparison 5 HFOV versus CV subgrouped by lung protective (LPS) CV strategy, Outcome 5 Intraventricular haemorrhage ‐ grades 3 or 4.
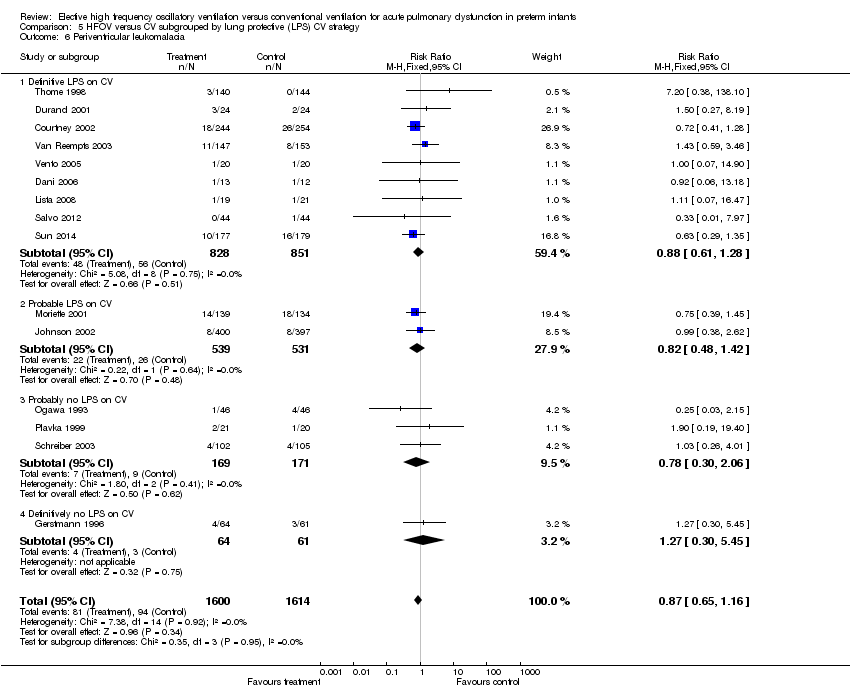
Comparison 5 HFOV versus CV subgrouped by lung protective (LPS) CV strategy, Outcome 6 Periventricular leukomalacia.

Comparison 6 HFOV versus CV subgrouped by age at randomisation, Outcome 1 Death by 36 to 37 weeks or discharge.

Comparison 6 HFOV versus CV subgrouped by age at randomisation, Outcome 2 CLD at 36 to 37 weeks PMA or discharge in survivors.
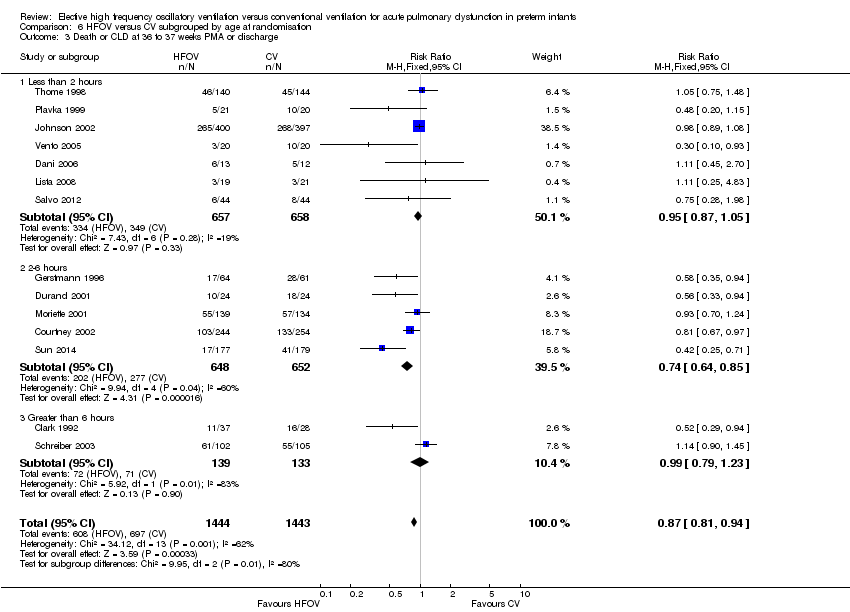
Comparison 6 HFOV versus CV subgrouped by age at randomisation, Outcome 3 Death or CLD at 36 to 37 weeks PMA or discharge.

Comparison 6 HFOV versus CV subgrouped by age at randomisation, Outcome 4 Gross pulmonary air leak.

Comparison 6 HFOV versus CV subgrouped by age at randomisation, Outcome 5 Intraventricular haemorrhage ‐ grades 3 or 4.

Comparison 6 HFOV versus CV subgrouped by age at randomisation, Outcome 6 Periventricular leukomalacia.

Comparison 7 HFOV versus CV subgrouped by I:E ratio on HFOV, Outcome 1 Death by 36 to 37 weeks or discharge.

Comparison 7 HFOV versus CV subgrouped by I:E ratio on HFOV, Outcome 2 CLD at 36 to 37 weeks PMA or discharge in survivors.

Comparison 7 HFOV versus CV subgrouped by I:E ratio on HFOV, Outcome 3 Death or CLD at 36 to 37 weeks PMA or discharge.

Comparison 7 HFOV versus CV subgrouped by I:E ratio on HFOV, Outcome 4 Gross pulmonary air leak.

Comparison 7 HFOV versus CV subgrouped by I:E ratio on HFOV, Outcome 5 Intraventricular haemorrhage ‐ grades 3 or 4.
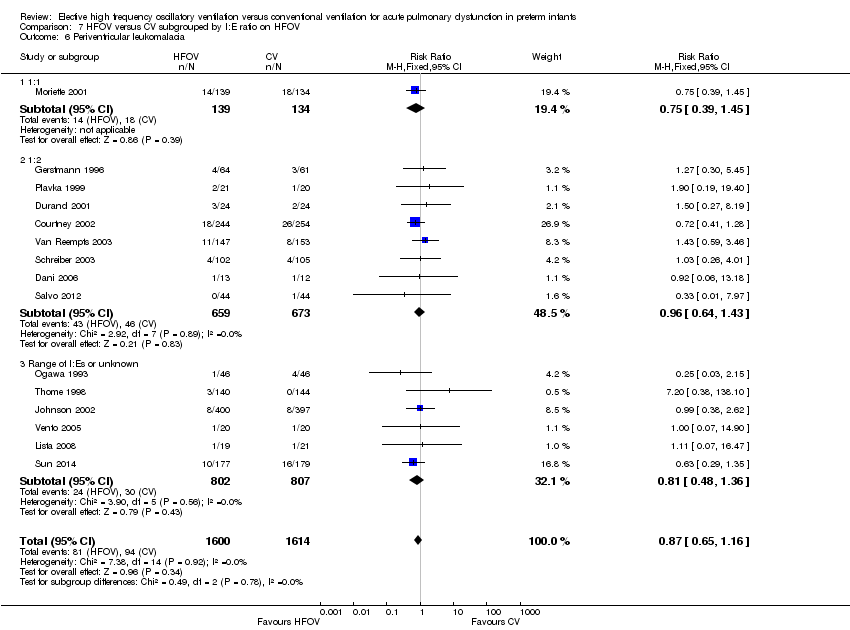
Comparison 7 HFOV versus CV subgrouped by I:E ratio on HFOV, Outcome 6 Periventricular leukomalacia.
| Outcome or subgroup title | No. of studies | No. of participants | Statistical method | Effect size |
| 1 Death by 28 to 30 days Show forest plot | 10 | 2148 | Risk Ratio (M‐H, Fixed, 95% CI) | 1.09 [0.88, 1.34] |
| 2 Mechanical ventilation at 28 to 30 days in survivors Show forest plot | 3 | 767 | Risk Ratio (M‐H, Fixed, 95% CI) | 1.08 [0.86, 1.35] |
| 3 Oxygen at 28 to 30 days in survivors Show forest plot | 6 | 1043 | Risk Ratio (M‐H, Fixed, 95% CI) | 0.98 [0.88, 1.10] |
| 4 CLD at 28 to 30 days (O2 + x‐ray) in survivors Show forest plot | 4 | 820 | Risk Ratio (M‐H, Fixed, 95% CI) | 0.86 [0.74, 1.01] |
| 5 Death or CLD at 28 to 30 days Show forest plot | 5 | 1160 | Risk Ratio (M‐H, Fixed, 95% CI) | 0.94 [0.85, 1.04] |
| 6 Death by 36 to 37 weeks or discharge Show forest plot | 17 | 3329 | Risk Ratio (M‐H, Fixed, 95% CI) | 0.95 [0.81, 1.10] |
| 7 CLD at 36 to 37 weeks PMA or discharge in survivors Show forest plot | 17 | 2786 | Risk Ratio (M‐H, Fixed, 95% CI) | 0.86 [0.78, 0.96] |
| 8 Death or CLD at 36 to 37 weeks PMA or discharge Show forest plot | 17 | 3329 | Risk Ratio (M‐H, Fixed, 95% CI) | 0.90 [0.84, 0.97] |
| 9 Any pulmonary air leak Show forest plot | 13 | 2854 | Risk Ratio (M‐H, Fixed, 95% CI) | 1.19 [1.05, 1.34] |
| 10 Gross pulmonary air leak Show forest plot | 11 | 2185 | Risk Ratio (M‐H, Fixed, 95% CI) | 1.13 [0.88, 1.45] |
| 11 Intraventricular haemorrhage ‐ all grades Show forest plot | 12 | 3084 | Risk Ratio (M‐H, Fixed, 95% CI) | 1.04 [0.95, 1.14] |
| 12 Intraventricular haemorrhage ‐ grades 3 or 4 Show forest plot | 18 | 4069 | Risk Ratio (M‐H, Fixed, 95% CI) | 1.10 [0.95, 1.27] |
| 13 Periventricular leukomalacia Show forest plot | 17 | 3983 | Risk Ratio (M‐H, Fixed, 95% CI) | 1.03 [0.81, 1.31] |
| 14 Retinopathy of prematurity (stage 2 or greater) in survivors Show forest plot | 12 | 2781 | Risk Ratio (M‐H, Fixed, 95% CI) | 0.81 [0.70, 0.93] |
| Outcome or subgroup title | No. of studies | No. of participants | Statistical method | Effect size |
| 1 Death by 36 to 37 weeks or discharge Show forest plot | 17 | 3329 | Risk Ratio (M‐H, Fixed, 95% CI) | 0.95 [0.81, 1.10] |
| 1.1 High volume strategy on HFOV with target FiO2 ≤ 0.30 | 8 | 1755 | Risk Ratio (M‐H, Fixed, 95% CI) | 0.87 [0.71, 1.08] |
| 1.2 High volume strategy on HFOV with target FiO2 > 0.30 or not specified | 8 | 1478 | Risk Ratio (M‐H, Fixed, 95% CI) | 1.02 [0.81, 1.28] |
| 1.3 No high volume strategy on HFOV | 1 | 96 | Risk Ratio (M‐H, Fixed, 95% CI) | 1.36 [0.39, 4.75] |
| 2 CLD at 36 to 37 weeks PMA or discharge in survivors Show forest plot | 17 | 2786 | Risk Ratio (M‐H, Fixed, 95% CI) | 0.86 [0.78, 0.96] |
| 2.1 High volume strategy on HFOV with target FiO2 ≤ 0.30 | 8 | 1483 | Risk Ratio (M‐H, Fixed, 95% CI) | 0.87 [0.76, 0.99] |
| 2.2 High volume strategy on HFOV with target FiO2 > 0.30 or not specified | 8 | 1216 | Risk Ratio (M‐H, Fixed, 95% CI) | 0.86 [0.73, 1.00] |
| 2.3 No high volume strategy of HFOV | 1 | 87 | Risk Ratio (M‐H, Fixed, 95% CI) | 0.0 [0.0, 0.0] |
| 3 Death or CLD at 36 to 37 weeks PMA or discharge Show forest plot | 17 | 3329 | Risk Ratio (M‐H, Fixed, 95% CI) | 0.90 [0.84, 0.97] |
| 3.1 High volume strategy on HFOV with target FiO2 ≤ 0.30 | 8 | 1755 | Risk Ratio (M‐H, Fixed, 95% CI) | 0.89 [0.81, 0.97] |
| 3.2 High volume strategy on HFOV with target FiO2 > 0.30 or not specified | 8 | 1478 | Risk Ratio (M‐H, Fixed, 95% CI) | 0.91 [0.81, 1.02] |
| 3.3 No high volume strategy on HFOV | 1 | 96 | Risk Ratio (M‐H, Fixed, 95% CI) | 1.36 [0.39, 4.75] |
| 4 Gross pulmonary air leak Show forest plot | 11 | 2185 | Risk Ratio (M‐H, Fixed, 95% CI) | 1.13 [0.88, 1.45] |
| 4.1 High volume strategy HFOV with target FiO2 ≤ 0.30 | 4 | 705 | Risk Ratio (M‐H, Fixed, 95% CI) | 0.96 [0.61, 1.51] |
| 4.2 High volume strategy on HFOV with target FiO2 > 0.30 or not specified | 6 | 1384 | Risk Ratio (M‐H, Fixed, 95% CI) | 1.26 [0.93, 1.71] |
| 4.3 No high volume strategy on HFOV | 1 | 96 | Risk Ratio (M‐H, Fixed, 95% CI) | 0.65 [0.17, 2.58] |
| 5 Intraventricular haemorrhage ‐ grades 3 or 4 Show forest plot | 18 | 4069 | Risk Ratio (M‐H, Fixed, 95% CI) | 1.10 [0.95, 1.27] |
| 5.1 High volume strategy on HFOV with target FiO2 ≤ 0.30 | 7 | 1730 | Risk Ratio (M‐H, Fixed, 95% CI) | 0.84 [0.65, 1.08] |
| 5.2 High volume strategy on HFOV with target FiO2 > 0.30 or not specified | 9 | 1570 | Risk Ratio (M‐H, Fixed, 95% CI) | 1.17 [0.92, 1.48] |
| 5.3 No high volume strategy on HFOV | 2 | 769 | Risk Ratio (M‐H, Fixed, 95% CI) | 1.45 [1.09, 1.93] |
| 6 Periventricular leukomalacia Show forest plot | 17 | 3983 | Risk Ratio (M‐H, Fixed, 95% CI) | 1.03 [0.81, 1.31] |
| 6.1 High volume strategy on HFOV with target FiO2 ≤ 0.30 | 8 | 1755 | Risk Ratio (M‐H, Fixed, 95% CI) | 0.91 [0.55, 1.48] |
| 6.2 High volume strategy with target FiO2 > 0.30 or not specified | 7 | 1459 | Risk Ratio (M‐H, Fixed, 95% CI) | 0.85 [0.60, 1.21] |
| 6.3 No high volume strategy on HFOV | 2 | 769 | Risk Ratio (M‐H, Fixed, 95% CI) | 1.64 [1.02, 2.64] |
| Outcome or subgroup title | No. of studies | No. of participants | Statistical method | Effect size |
| 1 Death by 36 to 37 weeks or discharge Show forest plot | 16 | 3233 | Risk Ratio (M‐H, Fixed, 95% CI) | 0.94 [0.80, 1.10] |
| 1.1 Routine surfactant | 15 | 3168 | Risk Ratio (M‐H, Fixed, 95% CI) | 0.94 [0.80, 1.10] |
| 1.2 No routine surfactant | 1 | 65 | Risk Ratio (M‐H, Fixed, 95% CI) | 1.01 [0.40, 2.58] |
| 2 CLD at 36 to 37 weeks PMA or discharge in survivors Show forest plot | 16 | 2699 | Risk Ratio (M‐H, Fixed, 95% CI) | 0.86 [0.78, 0.96] |
| 2.1 Routine surfactant | 15 | 2648 | Risk Ratio (M‐H, Fixed, 95% CI) | 0.88 [0.80, 0.97] |
| 2.2 No routine surfactant | 1 | 51 | Risk Ratio (M‐H, Fixed, 95% CI) | 0.23 [0.07, 0.73] |
| 3 Death or CLD at 36 to 37 weeks PMA or discharge Show forest plot | 16 | 3233 | Risk Ratio (M‐H, Fixed, 95% CI) | 0.90 [0.83, 0.97] |
| 3.1 Routine surfactant | 15 | 3168 | Risk Ratio (M‐H, Fixed, 95% CI) | 0.91 [0.84, 0.98] |
| 3.2 No routine surfactant | 1 | 65 | Risk Ratio (M‐H, Fixed, 95% CI) | 0.52 [0.29, 0.94] |
| 4 Gross pulmonary air leak Show forest plot | 10 | 2089 | Risk Ratio (M‐H, Fixed, 95% CI) | 1.15 [0.90, 1.49] |
| 4.1 Routine surfactant | 9 | 2024 | Risk Ratio (M‐H, Fixed, 95% CI) | 1.14 [0.87, 1.49] |
| 4.2 No routine surfactant | 1 | 65 | Risk Ratio (M‐H, Fixed, 95% CI) | 1.32 [0.65, 2.71] |
| 5 Intraventricular haemorrhage ‐ grades 3 or 4 Show forest plot | 16 | 3300 | Risk Ratio (M‐H, Fixed, 95% CI) | 1.00 [0.84, 1.19] |
| 5.1 Routine surfactant | 15 | 3235 | Risk Ratio (M‐H, Fixed, 95% CI) | 1.00 [0.84, 1.19] |
| 5.2 No routine surfactant | 1 | 65 | Risk Ratio (M‐H, Fixed, 95% CI) | 0.88 [0.33, 2.34] |
| 6 Periventricular leukomalacia Show forest plot | 15 | 3214 | Risk Ratio (M‐H, Fixed, 95% CI) | 0.87 [0.65, 1.16] |
| 6.1 Routine surfactant | 15 | 3214 | Risk Ratio (M‐H, Fixed, 95% CI) | 0.87 [0.65, 1.16] |
| 6.2 No routine surfactant | 0 | 0 | Risk Ratio (M‐H, Fixed, 95% CI) | 0.0 [0.0, 0.0] |
| Outcome or subgroup title | No. of studies | No. of participants | Statistical method | Effect size |
| 1 Death by 36 to 37 weeks or discharge Show forest plot | 16 | 3233 | Risk Ratio (M‐H, Fixed, 95% CI) | 0.94 [0.80, 1.10] |
| 1.1 Flow interrupter | 4 | 410 | Risk Ratio (M‐H, Fixed, 95% CI) | 0.94 [0.52, 1.69] |
| 1.2 HF oscillator | 11 | 2026 | Risk Ratio (M‐H, Fixed, 95% CI) | 0.93 [0.75, 1.16] |
| 1.3 Both HF oscillation and flow interruptors | 1 | 797 | Risk Ratio (M‐H, Fixed, 95% CI) | 0.95 [0.75, 1.20] |
| 2 CLD at 36 to 37 weeks PMA or discharge in survivors Show forest plot | 16 | 2699 | Risk Ratio (M‐H, Fixed, 95% CI) | 0.86 [0.78, 0.96] |
| 2.1 Flow interrupter | 4 | 370 | Risk Ratio (M‐H, Fixed, 95% CI) | 0.96 [0.70, 1.32] |
| 2.2 HF oscillator | 11 | 1737 | Risk Ratio (M‐H, Fixed, 95% CI) | 0.77 [0.67, 0.90] |
| 2.3 Both HF oscillators and flow interrupters | 1 | 592 | Risk Ratio (M‐H, Fixed, 95% CI) | 0.99 [0.85, 1.14] |
| 3 Death or CLD at 36 to 37 weeks PMA or discharge Show forest plot | 16 | 3233 | Risk Ratio (M‐H, Fixed, 95% CI) | 0.90 [0.83, 0.97] |
| 3.1 HF flow interrupter | 4 | 410 | Risk Ratio (M‐H, Fixed, 95% CI) | 0.96 [0.74, 1.24] |
| 3.2 HF oscillation | 11 | 2026 | Risk Ratio (M‐H, Fixed, 95% CI) | 0.83 [0.74, 0.93] |
| 3.3 Both HF oscillators and HF flow interrupters | 1 | 797 | Risk Ratio (M‐H, Fixed, 95% CI) | 0.98 [0.89, 1.08] |
| 4 Gross pulmonary air leak Show forest plot | 10 | 2089 | Risk Ratio (M‐H, Fixed, 95% CI) | 1.15 [0.90, 1.49] |
| 4.1 HF flow interrupter | 2 | 324 | Risk Ratio (M‐H, Fixed, 95% CI) | 1.88 [0.96, 3.67] |
| 4.2 HF oscillation | 8 | 1765 | Risk Ratio (M‐H, Fixed, 95% CI) | 1.06 [0.80, 1.39] |
| 4.3 Both HF oscillators and HF flow interrupters | 0 | 0 | Risk Ratio (M‐H, Fixed, 95% CI) | 0.0 [0.0, 0.0] |
| 5 Intraventricular haemorrhage ‐ grades 3 or 4 Show forest plot | 16 | 3300 | Risk Ratio (M‐H, Fixed, 95% CI) | 1.00 [0.84, 1.19] |
| 5.1 HF flow interrupter | 4 | 410 | Risk Ratio (M‐H, Fixed, 95% CI) | 1.08 [0.65, 1.78] |
| 5.2 HF oscillator | 11 | 2093 | Risk Ratio (M‐H, Fixed, 95% CI) | 1.11 [0.90, 1.36] |
| 5.3 Both HF oscillators and HF flow interrupters | 1 | 797 | Risk Ratio (M‐H, Fixed, 95% CI) | 0.69 [0.46, 1.01] |
| 6 Periventricular leukomalacia Show forest plot | 16 | 3216 | Risk Ratio (M‐H, Fixed, 95% CI) | 0.87 [0.65, 1.16] |
| 6.1 HF flow interrupter | 3 | 364 | Risk Ratio (M‐H, Fixed, 95% CI) | 2.29 [0.52, 10.04] |
| 6.2 HF oscillator | 12 | 2055 | Risk Ratio (M‐H, Fixed, 95% CI) | 0.82 [0.60, 1.11] |
| 6.3 Both HF oscillators and HF flow interrupters | 1 | 797 | Risk Ratio (M‐H, Fixed, 95% CI) | 0.99 [0.38, 2.62] |
| Outcome or subgroup title | No. of studies | No. of participants | Statistical method | Effect size |
| 1 Death by 36 to 37 weeks or discharge Show forest plot | 16 | 3233 | Risk Ratio (M‐H, Fixed, 95% CI) | 0.94 [0.80, 1.10] |
| 1.1 Definitive LPS on CV | 9 | 1679 | Risk Ratio (M‐H, Fixed, 95% CI) | 0.91 [0.70, 1.18] |
| 1.2 Probable LPS on CV | 3 | 1116 | Risk Ratio (M‐H, Fixed, 95% CI) | 0.98 [0.80, 1.21] |
| 1.3 Probably no LPS on CV | 2 | 248 | Risk Ratio (M‐H, Fixed, 95% CI) | 0.89 [0.52, 1.53] |
| 1.4 Definitively no LPS on CV | 2 | 190 | Risk Ratio (M‐H, Fixed, 95% CI) | 0.79 [0.33, 1.88] |
| 2 CLD at 36 to 37 weeks PMA or discharge in survivors Show forest plot | 16 | 2699 | Risk Ratio (M‐H, Fixed, 95% CI) | 0.86 [0.78, 0.96] |
| 2.1 Definitive LPS on CV | 9 | 1473 | Risk Ratio (M‐H, Fixed, 95% CI) | 0.79 [0.66, 0.94] |
| 2.2 Probable LPS on CV | 3 | 847 | Risk Ratio (M‐H, Fixed, 95% CI) | 0.96 [0.84, 1.10] |
| 2.3 Probably no LPS on CV | 2 | 205 | Risk Ratio (M‐H, Fixed, 95% CI) | 1.09 [0.79, 1.49] |
| 2.4 Definitively no LPS on CV | 2 | 174 | Risk Ratio (M‐H, Fixed, 95% CI) | 0.48 [0.31, 0.75] |
| 3 Death or CLD at 36 to 37 weeks PMA or discharge Show forest plot | 16 | 3235 | Risk Ratio (M‐H, Fixed, 95% CI) | 0.90 [0.83, 0.96] |
| 3.1 Definitive LPS on CV | 9 | 1679 | Risk Ratio (M‐H, Fixed, 95% CI) | 0.83 [0.72, 0.95] |
| 3.2 Probable LPS on CV | 3 | 1118 | Risk Ratio (M‐H, Fixed, 95% CI) | 0.97 [0.89, 1.07] |
| 3.3 Probably no LPS on CV | 2 | 248 | Risk Ratio (M‐H, Fixed, 95% CI) | 1.04 [0.82, 1.31] |
| 3.4 Definitively no LPS on CV | 2 | 190 | Risk Ratio (M‐H, Fixed, 95% CI) | 0.56 [0.38, 0.81] |
| 4 Gross pulmonary air leak Show forest plot | 10 | 2089 | Risk Ratio (M‐H, Fixed, 95% CI) | 1.15 [0.90, 1.49] |
| 4.1 Definitive LPS on CV | 6 | 1503 | Risk Ratio (M‐H, Fixed, 95% CI) | 1.04 [0.77, 1.41] |
| 4.2 Probable LPS on CV | 1 | 273 | Risk Ratio (M‐H, Fixed, 95% CI) | 1.69 [0.51, 5.63] |
| 4.3 Probably no LPS on CV | 2 | 248 | Risk Ratio (M‐H, Fixed, 95% CI) | 1.53 [0.77, 3.04] |
| 4.4 Definitively no LPS on CV | 1 | 65 | Risk Ratio (M‐H, Fixed, 95% CI) | 1.32 [0.65, 2.71] |
| 5 Intraventricular haemorrhage ‐ grades 3 or 4 Show forest plot | 16 | 3300 | Risk Ratio (M‐H, Fixed, 95% CI) | 1.00 [0.84, 1.19] |
| 5.1 Definitive LPS on CV | 8 | 1654 | Risk Ratio (M‐H, Fixed, 95% CI) | 1.03 [0.81, 1.30] |
| 5.2 Probable LPS on CV | 3 | 1116 | Risk Ratio (M‐H, Fixed, 95% CI) | 0.95 [0.71, 1.27] |
| 5.3 Probably no LPS on CV | 3 | 340 | Risk Ratio (M‐H, Fixed, 95% CI) | 1.32 [0.73, 2.37] |
| 5.4 Definitively no PLS on CV | 2 | 190 | Risk Ratio (M‐H, Fixed, 95% CI) | 0.62 [0.27, 1.39] |
| 6 Periventricular leukomalacia Show forest plot | 15 | 3214 | Risk Ratio (M‐H, Fixed, 95% CI) | 0.87 [0.65, 1.16] |
| 6.1 Definitive LPS on CV | 9 | 1679 | Risk Ratio (M‐H, Fixed, 95% CI) | 0.88 [0.61, 1.28] |
| 6.2 Probable LPS on CV | 2 | 1070 | Risk Ratio (M‐H, Fixed, 95% CI) | 0.82 [0.48, 1.42] |
| 6.3 Probably no LPS on CV | 3 | 340 | Risk Ratio (M‐H, Fixed, 95% CI) | 0.78 [0.30, 2.06] |
| 6.4 Definitively no LPS on CV | 1 | 125 | Risk Ratio (M‐H, Fixed, 95% CI) | 1.27 [0.30, 5.45] |
| Outcome or subgroup title | No. of studies | No. of participants | Statistical method | Effect size |
| 1 Death by 36 to 37 weeks or discharge Show forest plot | 14 | 2887 | Risk Ratio (M‐H, Fixed, 95% CI) | 0.91 [0.78, 1.07] |
| 1.1 Less than 2 hours | 7 | 1315 | Risk Ratio (M‐H, Fixed, 95% CI) | 0.95 [0.77, 1.18] |
| 1.2 2 to 6 hours | 5 | 1300 | Risk Ratio (M‐H, Fixed, 95% CI) | 0.85 [0.64, 1.14] |
| 1.3 Greater than 6 hours | 2 | 272 | Risk Ratio (M‐H, Fixed, 95% CI) | 0.91 [0.56, 1.48] |
| 2 CLD at 36 to 37 weeks PMA or discharge in survivors Show forest plot | 14 | 2404 | Risk Ratio (M‐H, Fixed, 95% CI) | 0.84 [0.75, 0.93] |
| 2.1 Less than 2 hours | 7 | 1058 | Risk Ratio (M‐H, Fixed, 95% CI) | 0.94 [0.82, 1.08] |
| 2.2 2 to 6 hours | 5 | 1127 | Risk Ratio (M‐H, Fixed, 95% CI) | 0.68 [0.56, 0.81] |
| 2.3 Greater than 6 hours | 2 | 219 | Risk Ratio (M‐H, Fixed, 95% CI) | 1.00 [0.74, 1.37] |
| 3 Death or CLD at 36 to 37 weeks PMA or discharge Show forest plot | 14 | 2887 | Risk Ratio (M‐H, Fixed, 95% CI) | 0.87 [0.81, 0.94] |
| 3.1 Less than 2 hours | 7 | 1315 | Risk Ratio (M‐H, Fixed, 95% CI) | 0.95 [0.87, 1.05] |
| 3.2 2‐6 hours | 5 | 1300 | Risk Ratio (M‐H, Fixed, 95% CI) | 0.74 [0.64, 0.85] |
| 3.3 Greater than 6 hours | 2 | 272 | Risk Ratio (M‐H, Fixed, 95% CI) | 0.99 [0.79, 1.23] |
| 4 Gross pulmonary air leak Show forest plot | 9 | 1789 | Risk Ratio (M‐H, Fixed, 95% CI) | 1.12 [0.86, 1.46] |
| 4.1 Less than 2 hours | 4 | 390 | Risk Ratio (M‐H, Fixed, 95% CI) | 1.54 [0.84, 2.82] |
| 4.2 2 ‐ 6 hours | 3 | 1127 | Risk Ratio (M‐H, Fixed, 95% CI) | 0.87 [0.60, 1.24] |
| 4.3 Greater than 6 hours | 2 | 272 | Risk Ratio (M‐H, Fixed, 95% CI) | 1.55 [0.92, 2.59] |
| 5 Intraventricular haemorrhage ‐ grades 3 or 4 Show forest plot | 15 | 3050 | Risk Ratio (M‐H, Fixed, 95% CI) | 1.01 [0.85, 1.21] |
| 5.1 less than 2 hours | 7 | 1382 | Risk Ratio (M‐H, Fixed, 95% CI) | 0.80 [0.59, 1.08] |
| 5.2 2 ‐ 6 hours | 6 | 1396 | Risk Ratio (M‐H, Fixed, 95% CI) | 1.15 [0.90, 1.46] |
| 5.3 Greater than 6 hours | 2 | 272 | Risk Ratio (M‐H, Fixed, 95% CI) | 1.18 [0.69, 2.01] |
| 6 Periventricular leukomalacia Show forest plot | 15 | 2916 | Risk Ratio (M‐H, Fixed, 95% CI) | 0.82 [0.61, 1.11] |
| 6.1 Less than 2 hours | 8 | 1407 | Risk Ratio (M‐H, Fixed, 95% CI) | 1.00 [0.52, 1.90] |
| 6.2 2 ‐ 6 hours | 5 | 1300 | Risk Ratio (M‐H, Fixed, 95% CI) | 0.76 [0.53, 1.08] |
| 6.3 Greater than 6 hours | 2 | 209 | Risk Ratio (M‐H, Fixed, 95% CI) | 1.03 [0.26, 4.01] |
| Outcome or subgroup title | No. of studies | No. of participants | Statistical method | Effect size |
| 1 Death by 36 to 37 weeks or discharge Show forest plot | 16 | 3233 | Risk Ratio (M‐H, Fixed, 95% CI) | 0.94 [0.80, 1.10] |
| 1.1 1:1 | 1 | 273 | Risk Ratio (M‐H, Fixed, 95% CI) | 1.11 [0.70, 1.75] |
| 1.2 1:2 | 9 | 1397 | Risk Ratio (M‐H, Fixed, 95% CI) | 0.97 [0.75, 1.25] |
| 1.3 Range of I:Es or unknown | 6 | 1563 | Risk Ratio (M‐H, Fixed, 95% CI) | 0.89 [0.71, 1.10] |
| 2 CLD at 36 to 37 weeks PMA or discharge in survivors Show forest plot | 16 | 2699 | Risk Ratio (M‐H, Fixed, 99% CI) | 0.86 [0.76, 0.99] |
| 2.1 1:1 | 1 | 215 | Risk Ratio (M‐H, Fixed, 99% CI) | 0.79 [0.43, 1.46] |
| 2.2 1:2 | 9 | 1183 | Risk Ratio (M‐H, Fixed, 99% CI) | 0.81 [0.66, 1.01] |
| 2.3 Range of I:Es or unknown | 6 | 1301 | Risk Ratio (M‐H, Fixed, 99% CI) | 0.92 [0.77, 1.09] |
| 3 Death or CLD at 36 to 37 weeks PMA or discharge Show forest plot | 16 | 3233 | Risk Ratio (M‐H, Fixed, 95% CI) | 0.90 [0.83, 0.97] |
| 3.1 1:1 | 1 | 273 | Risk Ratio (M‐H, Fixed, 95% CI) | 0.93 [0.70, 1.24] |
| 3.2 1:2 | 9 | 1397 | Risk Ratio (M‐H, Fixed, 95% CI) | 0.87 [0.77, 0.98] |
| 3.3 Range of I:Es or unknown | 6 | 1563 | Risk Ratio (M‐H, Fixed, 95% CI) | 0.92 [0.83, 1.01] |
| 4 Gross pulmonary air leak Show forest plot | 11 | 2185 | Risk Ratio (M‐H, Fixed, 95% CI) | 1.13 [0.88, 1.45] |
| 4.1 1:1 | 1 | 273 | Risk Ratio (M‐H, Fixed, 95% CI) | 1.69 [0.51, 5.63] |
| 4.2 1:2 | 7 | 1232 | Risk Ratio (M‐H, Fixed, 95% CI) | 1.17 [0.86, 1.58] |
| 4.3 Range of I:Es or unknown | 3 | 680 | Risk Ratio (M‐H, Fixed, 95% CI) | 0.99 [0.62, 1.57] |
| 5 Intraventricular haemorrhage ‐ grades 3 or 4 Show forest plot | 15 | 3259 | Risk Ratio (M‐H, Fixed, 95% CI) | 1.00 [0.84, 1.19] |
| 5.1 1:1 | 1 | 273 | Risk Ratio (M‐H, Fixed, 95% CI) | 1.73 [1.04, 2.87] |
| 5.2 1:2 | 7 | 1331 | Risk Ratio (M‐H, Fixed, 95% CI) | 0.97 [0.74, 1.26] |
| 5.3 Range of I:Es or unknown | 7 | 1655 | Risk Ratio (M‐H, Fixed, 95% CI) | 0.90 [0.70, 1.16] |
| 6 Periventricular leukomalacia Show forest plot | 15 | 3214 | Risk Ratio (M‐H, Fixed, 95% CI) | 0.87 [0.65, 1.16] |
| 6.1 1:1 | 1 | 273 | Risk Ratio (M‐H, Fixed, 95% CI) | 0.75 [0.39, 1.45] |
| 6.2 1:2 | 8 | 1332 | Risk Ratio (M‐H, Fixed, 95% CI) | 0.96 [0.64, 1.43] |
| 6.3 Range of I:Es or unknown | 6 | 1609 | Risk Ratio (M‐H, Fixed, 95% CI) | 0.81 [0.48, 1.36] |