Ventilación oscilatoria de alta frecuencia electiva versus ventilación convencional para la disfunción pulmonar aguda en lactantes prematuros
Resumen
Antecedentes
La insuficiencia respiratoria por inmadurez pulmonar es una causa importante de mortalidad en los lactantes prematuros. Aunque el uso de la ventilación con presión positiva intermitente (VPPI) en neonatos con insuficiencia respiratoria puede salvarles la vida, este uso se asocia con lesiones pulmonares y enfermedad pulmonar crónica. Una forma más nueva de ventilación llamada ventilación oscilatoria de alta frecuencia ha mostrado en estudios experimentales que provoca menos lesión pulmonar.
Objetivos
El objetivo de esta revisión fue determinar el efecto del uso electivo de la ventilación oscilatoria de alta frecuencia (VOAF) en comparación con la ventilación convencional (VC) sobre la incidencia de enfermedad pulmonar crónica (EPC), mortalidad y otras complicaciones asociadas con la prematuridad y la ventilación asistida en los lactantes prematuros que se ventilaron mecánicamente para el síndrome de dificultad respiratoria (SDR).
Métodos de búsqueda
Se hicieron búsquedas en la Oxford Database of Perinatal Trials, MEDLINE, EMBASE, revisiones anteriores incluyendo referencias cruzadas, resúmenes, actas de congresos y simposios; y en fuentes expertas y se realizó una búsqueda manual en revistas de La Colaboración Cochrane, principalmente en idioma inglés. La búsqueda se actualizó en enero 2009 y de nuevo en noviembre 2014.
Criterios de selección
Ensayos controlados aleatorios que comparan la VOAF y la VC en lactantes prematuros o de bajo peso al nacer con disfunción pulmonar, principalmente debida al SDR, que requirieron ventilación mecánica. La asignación al azar y el comienzo del tratamiento debían realizarse lo antes posible a partir del comienzo de la VC y en general durante las primeras 12 horas de vida.
Obtención y análisis de los datos
La calidad metodológica de cada ensayo fue revisada de forma independiente por los autores de la revisión. Las medidas del efecto estándar fueron el riesgo relativo (RR) y la diferencia de riesgos (DR). El número necesario a tratar para lograr un efecto beneficioso (NNTB) se calculó a partir de 1/DR. Se utilizaron los intervalos de confianza (IC) del 95% en todas las medidas del efecto. Para la interpretación de los análisis de subgrupos se calculó el valor de p para las diferencias de subgrupos y la estadística I2 para la heterogeneidad entre subgrupos. El metanálisis se realizó mediante un modelo de efectos fijos y de efectos aleatorios. Cuando la heterogeneidad fue mayor del 50% también se informó el RR calculado con un modelo de efectos aleatorios.
Resultados principales
Se incluyeron 19 estudios elegibles con 4096 lactantes. El metanálisis que comparó la VOAF con la VC no mostró pruebas de que exista un efecto sobre la mortalidad a los 28 a 30 días de vida o a una edad gestacional aproximadamente equivalente al término. Estos resultados fueron consistentes entre los estudios y en los análisis de subgrupos. El riesgo de EPC en los supervivientes a una edad gestacional equivalente al término se redujo de forma significativa con el uso de VOAF pero este efecto no fue consistente entre los estudios, incluso después de que el metanálisis se restringió a los estudios que aplicaron una estrategia de volumen pulmonar alto con VOAF. El análisis de subgrupos por estrategia de VOAF mostró un efecto similar en los ensayos con una estrategia más estricta de reclutamiento del volumen pulmonar, dirigido a una fracción muy baja de oxígeno inspirado (FiO2), y ensayos con una estrategia menos estricta de reclutamiento del volumen pulmonar y con una FiO2 objetivo algo mayor o no especificada.. Los análisis de subgrupos por la edad al momento de la asignación al azar, la administración habitual de surfactante o no, el tipo de respirador de alta frecuencia (oscilador versus interruptor de flujo), la tasa inspiratoria a espiratoria (I:E) del respirador de alta frecuencia (1:1 versus 1:2) y la estrategia de VC (de protección pulmonar o no) no pudieron explicar la heterogeneidad de forma suficiente. Las pérdidas de aire pulmonar, definidas como pérdidas evidentes de aire o enfisema pulmonar intersticial, ocurrieron con mayor frecuencia en el grupo de VOAF, mientras que el riesgo de retinopatía grave del prematuro se redujo de forma significativa.
Aunque en algunos estudios se encontró un aumento en el riesgo de hemorragia intracraneal grave y leucomalacia periventricular, el metanálisis general no mostró diferencias significativas en el efecto entre la VOAF y la VC. La morbilidad neurológica a corto plazo con la VOAF solamente se encontró en el subgrupo de dos ensayos que no utilizaron una estrategia de volumen alto con la VOAF. La mayoría de los ensayos no encontró una diferencia significativa en el resultado del desarrollo nervioso a largo plazo, aunque un ensayo reciente mostró una reducción significativa en el riesgo de parálisis cerebral y desarrollo mental deficiente.
Conclusiones de los autores
Hay pruebas de que el uso de VOAF electiva en comparación con VC da lugar a una reducción pequeña en el riesgo de EPC, pero las pruebas son débiles debido a la falta de consistencia de este efecto entre los ensayos. Probablemente muchos factores relacionados con la intervención en sí y con el paciente individual interactúan de maneras complejas. Además, el efecto beneficioso podría contrarrestarse por un aumento en el riesgo de pérdida aguda de aire. En algunos estudios se han observado efectos adversos sobre los resultados neurológicos a corto plazo, aunque en general estos efectos no son significativos. La mayoría de los ensayos que informaron medidas de resultado a largo plazo no identificó diferencias.
PICOs
Resumen en términos sencillos
Ventilación de alta frecuencia electiva en comparación con ventilación mecánica convencional en la estabilización temprana de los lactantes con dificultad respiratoria
Pregunta de la revisión. ¿El uso electivo de la ventilación oscilatoria de alta frecuencia en comparación con la ventilación convencional reduce el daño pulmonar y otras complicaciones asociadas con prematuridad y la ventilación asistida en los lactantes prematuros con ventilación mecánica para el síndrome de dificultad respiratoria (SDR)?
Antecedentes. La insuficiencia respiratoria por inmadurez pulmonar es una causa importante de mortalidad en los lactantes prematuros. Aunque la ventilación con presión positiva intermitente en recién nacidos con insuficiencia respiratoria puede salvarles la vida, su uso se asocia con lesiones pulmonares y enfermedad pulmonar crónica. Una forma más nueva de ventilación llamada ventilación oscilatoria de alta frecuencia ha mostrado en estudios experimentales provocar menos lesión pulmonar.
Características de los estudios. Diecinueve estudios que incluyeron a 4096 lactantes cumplieron con los criterios de inclusión.
Resultados No existen pruebas suficientes que apoyen el uso sistemático de la ventilación oscilatoria de alta frecuencia en lugar de la ventilación convencional en los lactantes prematuros con enfermedad pulmonar que necesitan ventilación con presión positiva. La ventilación oscilatoria de alta frecuencia es una forma de brindar ventilación artificial que teóricamente puede producir menos lesión en los pulmones y por consiguiente disminuir la tasa de enfermedad pulmonar crónica. Esta revisión de las pruebas de 19 ensayos controlados aleatorios indicó que aunque se puede observar un efecto de protección pulmonar pequeño, este efecto beneficioso moderado es muy variable entre los estudios y se debe sopesar frente a los posibles efectos perjudiciales.
Conclusiones de los autores
Antecedentes
La enfermedad pulmonar todavía es la causa principal de morbilidad y mortalidad en los lactantes muy prematuros. Aunque la ventilación con presión positiva intermitente (VPPI) ha disminuido la mortalidad, la morbilidad por lesión pulmonar es alta. Las lesiones agudas como la pérdida de aire pulmonar eran frecuentes antes del uso de surfactante. La enfermedad pulmonar crónica (EPC) se presenta hasta en un tercio de los lactantes prematuros con síndrome de dificultad respiratoria (SDR) que reciben VPPI (Ehrenkrantz 1992; Northway 1992). Además de la inmadurez, la sobredistensión pulmonar y la toxicidad del oxígeno se consideran factores importantes en la patogenia de la EPC (Jobe 2000).
Para evitar la distorsión pulmonar causada por las grandes oscilaciones de la presión pulmonar durante la ventilación convencional (VC) administrada a razón de 30 a 80 ciclos respiratorios por minuto, se desarrolló la ventilación oscilatoria de alta frecuencia (VOAF), con 600 a 800 ciclos respiratorios por minuto. En los modelos animales, el uso de la VOAF provoca una distensión pulmonar más uniforme, mejora la oxigenación y reduce la gravedad de la patología pulmonar producida por la VPPI (Truog 1984; de Lemos 1987).
Como se analiza en Clark 2000, hay estrategias que reducen la lesión pulmonar con la VOAF y la VC. Estudios en animales revelan que el mantenimiento del volumen pulmonar con la VOAF previene la lesión pulmonar (McCulloch 1988). La efectividad de la VOAF también se podría mejorar con el uso de respiradores impulsados por un pistón más potente en comparación con los que generan oscilaciones mediante la interrupción del flujo (Jouvet 1997) e incluso por ciertas características del mismo tipo de respirador (tasa inspiratoria a espiratorio de 1:1 versus 1:2) (Pillow 1999). Diversas estrategias con la VC parecen disminuir la lesión pulmonar aguda. Estas estrategias incluyen evitar los volúmenes tidales altos, el empleo de presión espiratoria final positiva (PEFP) y el uso de períodos inspiratorios cortos y frecuencias más rápidas. También se puede reducir la lesión pulmonar de los lactantes prematuros con el aumento del dióxido de carbono (hipercapnia permisiva) en lugar de aumentar la ventilación (Woodgate 2006). Muchas de estas estrategias de tratamiento y sus efectos sobre la lesión pulmonar se basan en estudios fisiopatológicos en modelos animales (mayor liberación de citocinas con el volumen tidal alto y disminución del PEFP) (Meredith 1989) o en ensayos en adultos con SDR (Petrucci 2007). Hay pruebas en los lactantes prematuros de que las estrategias para sincronizar la ventilación (tasas más altas y ventilación iniciada por el paciente) reducen la tasa de neumotórax y la duración de la ventilación, aunque no existen pruebas de que estas estrategias reduzcan la EPC a las 36 semanas de edad posmenstrual (Greenough 2008).
Objetivos
El objetivo de esta revisión fue determinar el efecto del uso electivo de la ventilación oscilatoria de alta frecuencia (VOAF) en comparación con la ventilación convencional (VC) sobre la incidencia de enfermedad pulmonar crónica (EPC), mortalidad y otras complicaciones asociadas con la prematurez y la ventilación asistida en los lactantes prematuros ventilados mecánicamente para el síndrome de dificultad respiratoria (SDR).
Se preespecificaron los siguientes análisis de subgrupos.
(1) Condiciones de la VOAF: una estrategia para mantener el volumen pulmonar puede producir un mejor reclutamiento alveolar que la estrategia de volumen bajo y, por lo tanto, se pueden obtener mejores resultados en términos de EPC. La "estrategia de volumen alto" (EVA) con la VOAF se definió como una estrategia en la que dos o más de los siguientes puntos debían estar establecidos explícitamente en los métodos: el uso inicial de una presión media de las vías aéreas más alta que con la VC; la desconexión inicial de la fracción inspirada de oxígeno (FiO2) antes de la desconexión de la presión media en las vías respiratorias; o el uso de maniobras de reclutamiento alveolar. La FiO2 se considera un parámetro clínico útil para el reclutamiento del volumen pulmonar. El reclutamiento alveolar óptimo se refleja por la capacidad de desconexión de la FiO2 por debajo de 0,30 o incluso 0,25. Por lo tanto, los ensayos se clasificaron como "sin estrategia de volumen pulmonar alto", "estrategia de volumen pulmonar alto con una FiO2 objetivo > 0,3 o no especificada", y "estrategia de volumen pulmonar alto con una FiO2 objetivo ≤ 0,30".
(2) Tratamiento de reemplazo con surfactante: el tratamiento de reemplazo con surfactante aumenta el reclutamiento alveolar, atenúa el SDR y ocasiona una tasa menor de lesión pulmonar y de EPC. Un efecto beneficioso pulmonar similar puede ocurrir en los lactantes cuyas madres recibieron corticosteroides prenatales.
(3) Peso al nacer y edad gestacional: los resultados pueden diferir entre los grupos de neonatos con distinto peso al nacer y distinta edad gestacional. Los lactantes con muy poca edad gestacional o muy bajo peso al nacer, o ambos, presentan una mayor incidencia de EPC y pueden obtener un mayor beneficio con la VOAF. Por otro lado, estos lactantes son más susceptibles a complicaciones neurológicas como la hemorragia intraventricular (HIV) y la leucomalacia periventricular (LPV).
Para explicar la persistente heterogeneidad de los metanálisis en las versiones anteriores de esta revisión, en la actualización de 2007 se agregaron los siguientes análisis de subgrupos.
(4) Tipo de respirador para la VOAF: los respiradores que realmente son oscilatorios de alta frecuencia (con pistón) podrían ser más efectivos para mantener el volumen pulmonar y aportar diferentes efectos comparados con los que utilizan la interrupción del flujo. Además, las diferencias en los períodos inspiratorios a espiratorios en la VOAF puede afectar la incidencia de lesión pulmonar.
(5) Condiciones de la ventilación convencional: las estrategias de protección pulmonar durante la VC (períodos inspiratorios cortos, frecuencia ≥ 60 ciclos/minuto, PEFP de 4 a 6 cm H20, volumen tidal limitante, ventilación iniciada por el paciente o hipercapnia permisiva) pueden afectar las diferencias entre la VOAF y la VC.
(6) Duración de la ventilación antes de la asignación al azar o edad al momento de la asignación al azar: el tratamiento que los lactantes reciben antes de la asignación al azar podría alterar los resultados, lo que se podría medir con la duración de la ventilación antes de la asignación al azar o por la edad al momento de la asignación al azar, o ambas.
Métodos
Criterios de inclusión de estudios para esta revisión
Tipos de estudios
Ensayos controlados con asignación aleatoria o cuasialeatoria.
Tipos de participantes
Lactantes prematuros o con bajo peso al nacer con disfunción pulmonar, principalmente debida al SDR, que necesitaron VPPI.
Tipos de intervenciones
VOAF electiva versus VC: la asignación al azar se realizó a principios del tratamiento del SDR poco después de comenzar la ventilación mecánica. Estos ensayos se clasificaron como "electivos". Los ensayos se clasificaron como "de rescate", y por lo tanto se excluyeron de esta revisión, cuando la asignación al azar de los pacientes se realizó después de no lograr una ventilación adecuada con VC o cuando aparecieron complicaciones o era probable que se desarrollaran con la VC. El uso de la VOAF como tratamiento de rescate y el uso de la ventilación a chorros de alta frecuencia electiva son los temas de otras revisiones (Bhuta 2003; Henderson‐Smart 2005). Los ensayos no fueron considerados elegibles si era obligatorio cruzar las intervenciones.
Tipos de medida de resultado
Los resultados de los ensayos no fueron elegibles si la tasa de datos perdidos o no informados fue del 20% o más.
Resultados primarios
1. Mortalidad a los 28 a 30 días de vida y a una edad gestacional equivalente al término.
2. Enfermedad pulmonar crónica (EPC):
-
dependencia de oxígeno a los 28 a 30 días (con presencia y ausencia de cambios en la radiografía de tórax);
-
dependencia del oxígeno o uso de la ventilación a las 36 a 37 semanas de edad posmenstrual (EPM) o al momento del alta.
3. Muerte o EPC.
Resultados secundarios
4. Fracaso del tratamiento asignado para mantener el intercambio gaseoso, lo que llevó al cruzamiento al tratamiento alternativo.
5. Síndromes de pérdida de aire pulmonar: todos, incluido el enfisema pulmonar intersticial (EPI) y la pérdida evidente de aire extrapulmonar (como el neumotórax).
6. Hemorragia intraventricular:
-
todos los grados;
-
grado 3 (ventrículos distendidos con sangre) o 4 (implicación parenquimatosa).
7. Leucomalacia periventricular.
8. Retinopatía del prematuro (RP) ≥ grado 2.
9. Uso de los recursos hospitalarios (duración de la estancia hospitalaria, duración de la VPPI).
10. Crecimiento y desarrollo neurológico a largo plazo.
Results
Description of studies
Included studies
Overall, 28 randomised controlled trials of HFOV versus CV were found, of which 19 met the eligibility criteria and full trial data were available. Details of each of these included studies (HIFI 1989; Clark 1992; Ogawa 1993; Gerstmann 1996; Rettwitz‐Volk 1998; Thome 1998; Plavka 1999; Durand 2001; Moriette 2001; Courtney 2002; Johnson 2002; Craft 2003; Schreiber 2003; Van Reempts 2003; Vento 2005; Dani 2006; Lista 2008; Salvo 2012; Sun 2014) are given in the table 'Characteristics of included studies'.
Participants
All but six of the included studies (Clark 1992; Plavka 1999; Van Reempts 2003; Vento 2005; Dani 2006; Lista 2008) were multicentre studies. The total number of infants randomised in each study varied from 25 (Dani 2006) to 797 (Johnson 2002). All studies included preterm infants, although the upper limit for birth weight or gestation differed. This upper limit for birth weight was 1001 grams in one study (Craft 2003), 1200 grams in two (Durand 2001; Courtney 2002), 1500 grams in five (Rettwitz‐Volk 1998; Plavka 1999; Vento 2005; Salvo 2012, Sun 2014), 1750 grams in one (Clark 1992) and 2000 grams in three (HIFI 1989; Ogawa 1993; Schreiber 2003). Upper gestational age limits were 36 weeks in one study (Gerstmann 1996), 35 weeks in one (Clark 1992), 34 weeks in two (Craft 2003; Schreiber 2003), 32 weeks in three (Van Reempts 2003; Lista 2008; Sun 2014), 31 weeks in one (Plavka 1999), 30 weeks in four (Thome 1998, Moriette 2001; Dani 2006; Salvo 2012) and 29 weeks in two (Johnson 2002; Vento 2005). The average age at randomisation varied from less than one hour (Thome 1998; Johnson 2002; Vento 2005; Dani 2006) to 12 hours (Schreiber 2003). Each trial stratified infants at randomisation by weight or gestational age, although few data were reported by these subgroups.
Prenatal corticosteroid use was not reported in two trials (HIFI 1989; Ogawa 1993); they were used in a minority of women in two studies (Clark 1992; Gerstmann 1996), were an exclusion criterion in one (Salvo 2012) and used in 50% to 100% of women in the remaining 14 studies.
Interventions
Different ventilators were used to deliver HFOV. Eight trials used the Sensormedics 3100 (Clark 1992; Gerstmann 1996; Plavka 1999; Durand 2001; Courtney 2002; Schreiber 2003; Dani 2006; Salvo 2012), two used the Hummingbird (HIFI 1989; Ogawa 1993), one used a Stephan piston oscillator (Rettwitz‐Volk 1998), one used an Infant Star ventilator (Thome 1998), one used a French piston oscillator (Moriette 2001), two trials used the Dräger Babylog ventilator (Vento 2005; Lista 2008) and one trial used the SLE5000 (Sun 2014). Two trials used more than one type of ventilator: Van Reempts used either the Sensormedics 3100 (83%) or Infant Star (17%) (Van Reempts 2003) and in the United Kingdom Oscillation Study (UKOS) (Johnson 2002) a variety of ventilators (Sensormedics, SLE, Dräger) were used. HFOV was delivered at 10 to 15 Hz in 12 trials and at 15 to 20 Hz in one (Rettwitz‐Volk 1998).
The three criteria used to define a high volume strategy (HVS) with HFOV are given in the objectives. All 17 trials with a HVS used a higher mean airway pressure (MAP) on HFOV than on CV. In addition, three trials (Thome 1998; Moriette 2001; Salvo 2012) used both alveolar recruitment manoeuvres and weaning of FiO2 prior to weaning MAP, while Gerstmann 1996; Clark 1992; and Van Reempts 2003 used weaning of FiO2 first and Ogawa 1993 used alveolar recruitment manoeuvres. In one trial (Sun 2014) a lung volume recruitment manoeuvre was applied to reach optimal alveolar recruitment as described in detail by De Jaegere et al (De Jaegere 2006). In eight trials, lung volume recruitment was defined as the ability to wean to an FiO2 to 0.30 or less (Gerstmann 1996; Thome 1998; Johnson 2002; Vento 2005; Dani 2006; Lista 2008; Salvo 2012, Sun 2014), whereas in the other trials the targeted FiO2 was higher than 0.30 or not specified. Two trials (HIFI 1989; Rettwitz‐Volk 1998) did not use a HVS for HFOV.
In all trials, CV was administered using time cycled, pressure limited ventilators. There was a large variation in the specific methods of administration of CV that might provide lung protection. Details are given in the table 'Characteristics of included studies'.
Surfactant therapy with animal derived extracts was used as therapy for RDS in the majority of participants in all but two trials (HIFI 1989; Clark 1992).
Postnatal corticosteroids for CLD were used in 41% to 61% of infants in three trials (Rettwitz‐Volk 1998; Thome 1998; Courtney 2002), in 20% of infants in one trial (Johnson 2002) and in less than 8% of infants in three trials (Moriette 2001; Van Reempts 2003; Salvo 2012). Plavka 1999 reported cumulative dosage and Courtney 2002 reported mean days of therapy in each group. In all studies, the usage of postnatal steroids was similar in the two treatment groups, with the exception of the trial of Veemto and colleagues (Vento 2005), in which corticosteroids were administered to 35% of survivors in the HFOV group and to 60% of survivors in the CV group.
In Durand 2001 and Courtney 2002 prophylactic indomethacin was given routinely to all infants.
Outcomes
Not all outcomes were reported in each study. The definitions of CLD at 28 days differed between studies. CLD was assessed at 28 days of age in six studies (HIFI 1989; Ogawa 1993; Rettwitz‐Volk 1998; Thome 1998; Moriette 2001; Van Reempts 2003; Schreiber 2003) and 30 days of age in the other two (Clark 1992; Gerstmann 1996). In five studies, the definition of CLD at 28 days of age was based on oxygen therapy alone (Rettwitz‐Volk 1998; Thome 1998; Plavka 1999; Moriette 2001; Schreiber 2003) while in the remainder both oxygen therapy and an abnormal chest x‐ray were required.
Late CLD at term equivalent age varied from 36 weeks PMA (Clark 1992; Thome 1998; Plavka 1999; Moriette 2001; Courtney 2002; Johnson 2002; Salvo 2012 ; Sun 2014) or 37 weeks PMA (Rettwitz‐Volk 1998) to at discharge (Gerstmann 1996) (mean PMA 37.1 (95% CI 36.5 to 37.9) weeks in the HFOV group and 37.5 (95% CI 36.6 to 38.0) weeks in the CV group). The criterion for CLD at term equivalent age was based on use of oxygen therapy in nine trials, on clinical score (oxygen plus signs) in one trial (Plavka 1999), on oxygen or use of assisted ventilation in two trials (Courtney 2002; Van Reempts 2003) and on oxygen use plus an abnormal chest radiograph in one trial (Schreiber 2003).
In most trials, cross‐over to the other treatment was allowed when predetermined failure criteria were reached. These criteria (hypoxaemia or hypercarbia, or both) were similar in each trial and for each treatment group, but the decision to cross over was left to the clinician. In two trials (Clark 1992; Rettwitz‐Volk 1998) the additional criterion for cross‐over of severe pulmonary interstitial emphysema was applied only to the CV group. Because of the variable definition of 'failure of assigned treatment' between treatment groups, this outcome has not been included in the meta‐analysis. When cross‐over occurred, the participants were analysed in the groups as randomised. In the Sun 2014 trial, cross‐over was not allowed.
Excluded studies
The study by Froese 1987 has not been included because after randomisation of infants (unknown gestation range) with presumed RDS, 5 of 11 in the HFOV group and an unknown number from the CV group were excluded from the comparisons between treatments. Only data on infants < 29 weeks with RDS were reported. Lombet 1996 has been excluded because there was a 22% loss after randomisation. Pardou 1993 reported results for only 13 (54%) of the 24 infants randomised to the high frequency flow interrupter or CV.
Cambonie 2003 was not included as the trial only examined haemodynamic status during HFOV compared to CV and clinical outcomes were not reported.
HiFO 1993 was excluded since HFOV was used as rescue therapy. This study was included in a separate review of HFOV (Henderson‐Smart 2005). The study by Ramanathan 1995, which has only been published in abstract form, was excluded because there was a mandatory cross‐over from HFOV to CV at 96 hours of age. Some information from these latter two trials concerning rates of IVH is considered in the discussion.
Nazarchuk 2010 was excluded because the study was restricted to a population of very low birth weight infants with omphalocoele. Singh 2012 was excluded because 27% of infants were excluded post‐randomisation and because the main outcome was the oxygenation index in the first 24 hours.
Prashanth 2012 was excluded because it was not a randomised controlled study.
Risk of bias in included studies
Details of the methodological quality of each study are available in the table 'Characteristics of included studies' and summarized in Figure 1 and Figure 2.
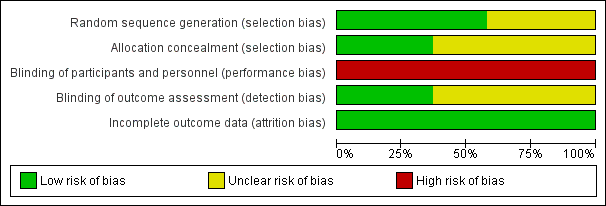
Risk of bias graph: review authors' judgements about each risk of bias item presented as percentages across all included studies.
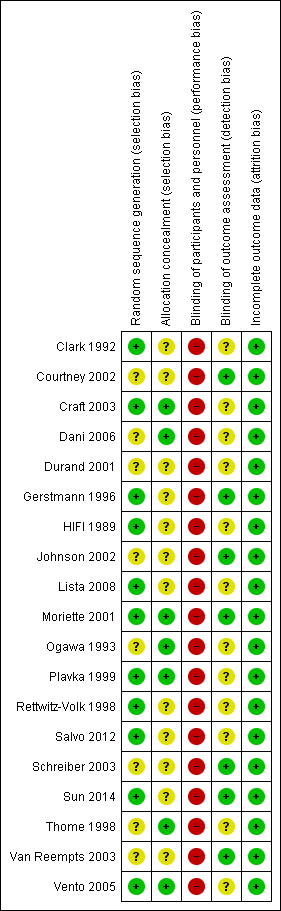
Risk of bias summary: review authors' judgements about each risk of bias item for each included study.
Randomisation: the majority of the studies had an adequate, documented method of random sequence generation. In only seven studies sufficient information was provided to assess the quality of allocation concealment.
Blinding of treatment: due to the nature of the intervention blinding of the experimental and control interventions was not possible for care‐givers. This could possibly introduce bias in all the trials. Blinding of participants was not relevant.
Blinding of outcome assessment was not relevant for most outcomes (death, oxygen dependency). For outcomes that needed interpretation of images, such as head ultrasound or chest x‐ray, and for long‐term neurodevelopmental assessment, blinding was variable between outcomes and studies. Assessment of chest x‐rays for the diagnosis of CLD was blinded as to treatment group in studies by Clark 1992; Ogawa 1993; Plavka 1999; Moriette 2001; and Schreiber 2003. Blinded head ultrasound assessments were carried out in the HIFI 1989; Clark 1992; Ogawa 1993; Durand 2001; Moriette 2001; Courtney 2002; Johnson 2002; Van Reempts 2003; and Schreiber 2003 trials.
Exclusions after randomisation were minimal for primary outcomes (all less than 8%), so low risk of bias. For long‐term neurological assessment follow‐up rates were lower (for some studies as low as 51% to 57%).
Effects of interventions
Nineteen trials involving 4096 infants were included.
Mortality
There were no significant differences in the rates of mortality by 28 to 30 days (Analysis 1.1) (2148 infants in 10 trials; summary RR 1.09, 95% CI 0.88 to 1.34) or in the rates of mortality by 36 to 37 weeks PMA or discharge (Analysis 1.6) (3329 infants in 17 trials; summary RR 0.95, 95% CI 0.81 to 1.10). There was no heterogeneity between studies for this outcome (I² = 0%). Only one individual trial (Sun 2014) showed a significant reduction in mortality before discharge (RR 0.31, 95% CI 0.10 to 0.94). Subgroup analyses including use of volume recruitment on HFOV, routine use of surfactant, use of piston oscillators, use of lung protective strategies on CV, and inspiratory to expiratory ratio on HFOV also failed to show any significant differences in effect on mortality rates between subgroups.
Chronic lung disease (CLD) at 28 to 30 days
The use of oxygen therapy at 28 to 30 days was reported for 1043 infants in six trials. There was no significant difference between the HFOV and CV groups in the individual trials or in the meta‐analysis (Analysis 1.3) (summary RR 0.98, 95% CI 0.88 to 1.10).
CLD in survivors at 28 to 30 days of age, based on the use of oxygen or mechanical ventilation and the presence of an abnormal chest x‐ray, was reported for 820 infants in four trials (Analysis 1.4). Two trials (Clark 1992; Gerstmann 1996) showed a significantly lower incidence of this outcome in the HFOV group and there was a trend towards a reduced incidence in the overall analysis (summary RR 0.86, 95% CI 0.74 to 1.01). This latter meta‐analysis showed significant heterogeneity (P = 0.02; I2 = 71.3%), and when a random‐effects model was used the summary RR was 0.66 (95% CI 0.41 to 1.07). When only trials that used HVS were considered for analysis (thereby excluding the High Frequency Ventilation in Premature Infants (HIFI) trial), heterogeneity disappeared (I² = 0%) and a significant reduction in the need for oxygen at 28 to 30 days was shown (summary RR 0.53, 95% CI 0.36 to 0.76).
Five trials involving 1160 infants reported both mortality and CLD at 28 to 30 days (Analysis 1.5). Two showed a significant decrease of this combined outcome in the HFOV group (Clark 1992; Gerstmann 1996). In the overall analysis, there was a non‐significant trend towards a reduced risk of death or CLD at 28 to 30 days in the HFOV group (summary RR 0.94, 95% CI 0.85 to 1.04). Again, significant heterogeneity existed for this outcome (I² = 74%), which persisted when only trials that used HVS were considered (I² = 83%). The random effects model summary RR for this combined outcome was 0.83 (95% CI 0.65 to 1.07).
CLD at 36 to 37 weeks postmenstrual age (PMA) in survivors
CLD in survivors at 36 to 37 weeks PMA or at discharge was reported for 2786 infants in 17 trials (Analysis 1.7). Five trials (Clark 1992; Gerstmann 1996; Durand 2001; Vento 2005; Sun 2014) found a significant decrease in the HFOV group. In the overall analysis using a fixed‐effect model, there was a significant reduction of CLD in the HFOV group (summary RR 0.86, 95% CI 0.78 to 0.96; summary RD ‐0.05, 95% CI ‐0.08 to ‐0.02; NNTB 20, 95% CI 12 to 50). There was significant heterogeneity in this meta‐analysis (P = 0.002; I2 = 59%), and using a random‐effects model the summary RR was 0.80 (95% CI 0.65 to 0.99), which was borderline significant. Heterogeneity persisted if only trials that used HVS were considered.
Subgroup analyses
The subgroup analysis by high volume strategy (HVS) on HFOV (Analysis 2.2) showed similar results in the subgroups: HVS with target FiO2 ≤ 0.30 (8 trials, 1483 infants; summary RR 0.87, 95% CI 0.76 to 0.99) and HFV with target FiO2 > 0.30 or unspecified (8 trials, 1216 infants; summary RR 0.86, 95% CI 0.73 to 1.00). Only one trial not using HVS reported CLD at 36 weeks PMA and had no cases of CLD to contribute to the overall analysis (Rettwitz‐Volk 1998). The test for subgroup difference was not significant (P = 0.50; I2 = 0%) and heterogeneity persisted within the subgroups.
In the subgroup analysis by use of routine surfactant (Analysis 3.2) only 1 small trial of 51 infants (Clark 1992) reporting CLD at 36 weeks did not use surfactant. This trial showed a significant and marked reduction in the HFOV group (RR 0.23, 95% CI 0.07 to 0.73). This result was significantly different from the subgroup analysis of the 15 trials involving 2648 infants in which surfactant was used. The latter result is similar to the overall analysis of CLD at 36 weeks PMA (summary RR using fixed‐effect model 0.88, 95% CI 0.80 to 0.97) with persisting heterogeneity (I2 = 48%).
Subgroups by use of different types of oscillator (flow interrupters, true piston oscillators, or both) only showed a statistically significant difference between the summary RRs of the subgroups when a fixed‐effect model was used (test for subgroup difference P = 0.06; I2 = 64.4%), not when a random‐effects model was used (test for subgroup difference P = 0.14; I² = 50%) (Analysis 4.2). For the subgroup of 11 trials involving 1737 infants that used HF piston oscillators (including the Van Reempts trial, where 83% of study patients were ventilated with an HF oscillator and 17% were ventilated with a flow interrupter) there was a significant reduction in CLD in the HFOV group (summary RR 0.77, 95% CI 0.67 to 0.90; summary RD ‐0.07, 95% CI ‐0.11 to ‐0.03; NNTB 14, 95% CI 9 to 33). However, significant heterogeneity persisted within this subgroup (P = 0.003; I2 = 63%), and using a random‐effects model the summary RR was 0.77 (95% CI 0.67 to 0.90).
Similarly, for the subgroup analysis based on lung protective strategies (LPS) on CV (Analysis 5.2), the outcome was significantly different between subgroups when using a fixed‐effect model (test for subgroup difference P = 0.008; I² = 74.9%) but not when using a random‐effects model (test for subgroup difference P = 0.15; I2 = 43.5%). The largest benefit was seen in the subgroup of trials that definitively did not use LPS (fixed‐effect model summary RR 0.48, 95% CI 0.31 to 0.75; summary RD ‐0.24, 95 CI ‐0.37 to ‐0.10; NNTB 4, 95% CI 4 to 10; random‐effects model summary RR 0.42, 95% CI 0.18 to 1.02). There was persisting heterogeneity within the subgroups, with I² varying from 52% up to 77%.
The subgroup analysis by age at randomisation (less than 2 hrs, 2 to 6 hrs, greater than 6 hrs) showed a significant difference between the summary RRs of the subgroups using the fixed‐effect model (P = 0.01; I2 = 78.3%) but not using the random‐effects model (P = 0.29; I2 = 18.2%) (Analysis 6.2).
Subgroups by inspiratory:expiratory time ratio on HFOV (I:E = 1:1, 1:2 or variable or unknown) showed no statistically significant difference (test for subgroup difference P = 0.49; I² = 0% using fixed‐effect model and P = 0.77; I2 = 0% using random‐effects model) between the summary RRs of the subgroups (Analysis 7.2).
Death or CLD at 36 weeks postmenstrual age
There was a small reduction in the risk of the combined outcome of death or CLD at 36 to 37 weeks PMA or at discharge in the HFOV group (Analysis 1.8) (summary RR 0.90, 95% CI 0.84 to 0.97; summary RD ‐0.05, 95% CI ‐0.08 to ‐0.01; NNTB 20, 95% CI 12 to 100; 17 trials, 3329 infants) using the fixed‐effect model. There was significant heterogeneity for this outcome (P = 0.001; I2 = 58%). The summary RR using a random‐effects model was RR 0.85 (95% CI 0.73 to 0.99).
Subgroup analyses
The subgroup analysis by high lung volume strategy for HFOV showed no significant differences between subgroups for this outcome (test for subgroup difference P = 0.76; I2 = 0%) (Analysis 2.3). In the subgroup analysis by surfactant use (Analysis 3.3), the one trial that did not use surfactant routinely (Clark 1992) showed a significantly larger reduction in the risk for death or CLD at 36 weeks PMA (RR 0.52, 95% CI 0.29 to 0.94) as compared to the subgroup of trials that used surfactant (summary RR 0.87, 95% CI 0.75 to 1.01; 15 trials, 3168 infants) (test for subgroup difference using fixed‐effect model P = 0.07; I2 = 70%). For the subgroup analysis by type of HFO ventilator (Analysis 4.3) subgroup differences were not statistically significant when a random‐effects model was used (test for subgroup difference P = 0.15; I2 = 46.7%). In the subgroup analysis by CV strategy (Analysis 5.3) results were significantly different between subgroups both when using a fixed‐effect model and a random‐effects model (test for subgroup difference for random‐effects model P = 0.02; I2 = 69.6%). The largest benefit from HFOV was seen in the subgroup of trials that definitively did not use an LPS (summary RR 0.55, 95% CI 0.38 to 0.81). For the subgroup analysis by age at randomisation (Analysis 6.3), the summary RRs of subgroups were only significantly different when using the fixed‐effect model (test for subgroup difference P = 0.007; I2 = 79.9%), and not when using the random‐effects model (test for subgroup difference P = 0.19; I2 = 40.7%). In the subgroup analysis by I:E ratio (Analysis 7.3), there were no significant between‐subgroup differences.
Duration of oxygen therapy
The duration of oxygen therapy was reported in nine trials. The statistical reporting of this outcome differed substantially between trials so meta‐analysis was not undertaken.
Gerstmann 1996 found no significant difference in the duration of oxygen therapy in infants with birth weights of one kilogram or less, but a shorter duration of oxygen therapy in HFOV infants with birth weights over one kilogram (median days 13.2, 95% CI 6.6 to 24.3 versus 27.6, 95% CI 14.3 to 37.7; P ≤ 0.05). Two studies reported means and standard deviations (SDs) for days of oxygen that were similar in the two groups: Van Reempts 2003, HFOV 23.6 (SD 28.2) versus CV 22.7 (SD 28.5); and Dani 2006, HFOV 20.3 (SD 14.6) versus CV 22.0 (SD 15.9). No significant difference in the median days of oxygen therapy between treatment groups was found in the three other studies: Thome 1998, 36 versus 39.5; Plavka 1999, 20 (95% CI 1 to 86) versus 29 (95% CI 4 to 107); Moriette 2001, 22 (interquartile range (IQR) 47) versus 22 (IQR 41). Craft 2003 reported mean (and range) for days of oxygen therapy for the two subgroups by birthweight; 500 to 750 grams, HFOV 75.5 (3 to 136) versus CV 95.1 (3 to 196); 751 to 1000 grams, HFOV 59.9 (1 to 119) versus CV 53.0 (27 to 93). These differences were not statistically different. Vento 2005 reported the mean (SD) hours of oxygen therapy, which was significantly lower in the HFOV group (mean 760, SD 473) compared with the CV group (mean 1445, SD 1297) (P = 0.03). Lista 2008 reported a significantly longer duration of oxygen dependency in the HFOV group (mean 36 days, SD 23) and in the CV group (mean 19 days, SD 11).
Use of mechanical ventilation
Twelve trials reported on the total duration of mechanical ventilation (MV). Overall, the trend was for shorter durations of ventilation in the HFOV groups, but only two trials (Salvo 2012; Sun 2014) showed a significant difference. Seven trials provided data that could be combined in a meta‐analysis but because of extreme heterogeneity between studies for this outcome (P = 0.00001; I2 = 97%) and strong dominance of the meta‐analysis by one trial (Sun 2014) with 89% of the total weight, the result of this meta‐analysis is not reported.
In the Gerstmann 1996 trial the median days on MV (95% CI) in those with a birth weight less than 1 kg was 24.7 days (95% CI 3.7 to 61.4) in the HFOV group and 53.7 days (95% CI 28.4 to 103) in the CV group, a trend that was not significantly different. In this trial there was also a similar median duration of MV in infants with birth weights over 1 kg; 4.1 days (95% CI 1.7 to 6) in the HFOV group versus 4.5 days (95% CI 3 to 6.1) in the CV group. Clark 1992 reported medians and ranges for the days on MV for all infants entered in the study, which were not significantly different between the HFOV group (16 days, 1.8 to 67) and the CV group (30.3 days, 0.5 to 222). Ogawa 1993 reported similar mean (± SD) days of mechanical ventilation in the HFOV group (17.3 ± 24.4) and CV group (13.5 ± 21). Plavka 1999 reported means with 95% CIs for duration of MV and no difference between the HFOV and CV groups (5, 95% CI 1 to 70 versus 7, 95% CI 3 to 52) was shown. Moriette 2001 found similar mean (IQR) durations of MV between HFOV and CV groups (9, IQR 17 versus 9, IQR 16). Van Reempts 2003 reported similar means and SDs for days of MV in the two groups (HFOV 7.7, SD 9.7) versus CV 4.9, SD 9.1). Craft 2003 reported mean (and range) for days of mechanical ventilation for the two subgroups by birthweight; 500 to 750 grams, HFOV 43.3 (range 1 to 136) versus CV 59 (range 3 to 133); 751 to 1000 grams, HFOV 37.7 (range 1 to 83) versus CV 20.1 (range 1 to 56). These differences were not statistically different. Vento 2005 reported the mean (SD) hours of MV, which were not significantly different between the HFOV group (mean 310, SD 313) and the CV group (mean 656, SD 981) (P = 0.15). Dani 2006 and Lista 2008 showed no significant differences in mean days (SD) of MV between the HFOV group and the CV group: 4.1 (SD 1.1) versus 4.5 (SD 2.2) respectively for Dani 2006; and 9.6 (SD 4) versus 10 (SD 2) respectively for Lista 2008. Salvo 2012 and Sun 2014 reported a significantly shorter duration of MV in the HFOV group as compared with the CV group (mean ± SD): 45 ± 17 hours versus 177 ± 84 hours (P < 0.01) for Salvo 2012; 4.0 ± 4.0 days versus 5.7 ± 5.0 days (P < 0.001) for Sun 2014.
Failed treatment
Two trials reported failure to maintain gas exchange with the allocated treatment. Thome 1998 reported a non‐significant trend towards more infants failing based on oxygenation index criteria in the HFOV group (7/140 versus 4/144), while Gerstmann 1996 reported more failures with CV (1/64 versus 9/64, P = 0.008).
Eight trials reported cross‐over to the alternate treatment, a decision that was left to the judgement of individual clinicians. In the HIFI 1989 trial there was a significant increase in treatment failures (failure to maintain adequate gas exchange) in the HFOV group leading to cross‐over of treatment (85/346 in the HFOV group and 60/327 in the CV group, P = 0.01). Moriette 2001 reported a switch in ventilator mode for fewer infants assigned to HFOV than to CV (15% versus 29%; OR 0.43, 95% CI 0.24 to 0.78). Johnson 2002 found the same rate of failure of assigned treatment (10% in each group), while Courtney 2002 reported that more infants exited the assigned mode of treatment in the CV group compared to the HFOV group (52/254 versus 31/244 respectively, P = 0.02). Van Reempts 2003 reported 17 (11.6%) failures in the HFOV group and 10 (6.5%) failures in the CV group, a non‐significant difference. In Durand 2001, two infants crossed over from HFOV and seven infants crossed over from CV at the discretion of clinicians. In Craft 2003, one infant crossed over from HFOV and none crossed over from SIMV. Salvo 2012 reported one treatment failure in each group; both of those infants subsequently died. These data have not been combined in a meta‐analysis as there were differences in definitions between trials and possibly in clinician uptake of the option to cross over.
Two trials had the additional failure criterion of PIE in the CV group. These trials reported cross‐over to be similar between groups (Rettwitz‐Volk 1998: 8/46 versus 9/50) or to be more common in the CV group (Clark 1992: 5/30 versus 9/26, P = 0.01).
Pulmonary air leak syndromes
Thirteen trials involving 2854 infants reported any pulmonary air leak (Analysis 1.9). Two trials showed a significant increase in any air leak in the HFOV group (Thome 1998: RR 1.38, 95% CI 1.01 to 1.89; Schreiber 2003: RR 1.67, 95% CI 1.15 to 2.43). Overall analysis of the 13 trials showed a small but significant increase in the risk of air leak in the HFOV group (fixed‐effect model summary RR 1.19, 95% CI 1.05 to 1.34; summary RD 0.04, 95% CI 0.01 to 0.07; NNTH 25, 95% CI 14 to 100), which remained similar when only HVS trials were considered (11 trials, 2085 infants; fixed‐effect model summary RR 1.19, 95% CI 1.01 to 1.40; summary RD 0.04, 95% CI 0.00 to 0.07). Results were consistent across trials (P for heterogeneity = 0.49; I² = 0% for all trials and 13% for HVS trials).
Gross pulmonary air leak (excluding PIE alone) was reported for 2185 infants in 11 trials (Analysis 1.10). One trial (Sun 2014) showed a significant reduction with HFOV in the risk of gross air leak (RR 0.48, 95% CI 0.23 to 0.99). The meta‐analysis, however, showed a non‐significant trend towards an increased risk in the HFOV group (summary RR 1.13, 95% CI 0.88 to 1.45). When only HVS trials were considered, the summary RR was 1.15 (95% CI 0.90 to 1.49). There was no significant heterogeneity for this outcome (P = 0.27; I2 = 18%).
Subgroup analyses of gross pulmonary air leak
None of the subgroup analyses showed a significant difference between the summary RRs of the subgroups (P value for between‐subgroup heterogeneity > 0.10). However, in the subgroup analysis by type of HFO ventilator, a considerable proportion (I2 = 59.3% with fixed‐effect model) of the observed heterogeneity between the subgroups was due to true between‐subgroup differences rather than chance. In this subgroup analysis a clear trend towards an increased risk of gross pulmonary air leak was seen in the subgroup of trials using a high frequency flow interrupter (summary RR 1.88, 95% CI 0.96 to 3.67) as compared to the subgroup of trials using a true oscillator (summary RR 1.06, 95% CI 0.80 to 1.39).
Intraventricular haemorrhage (IVH)
Twelve trials involving 3084 infants reported all grades of IVH (Analysis 1.11). There was no significant difference in the rate of IVH (all grades) between the treatment groups in individual trials or in the overall analysis (summary RR 1.04, 95% CI 0.95 to 1.14). When only HVS trials (10 trials, 2315 infants) were included, the summary RR was 1.00 (95% CI 0.90 to 1.11). There was no heterogeneity between trials for this outcome.
Eighteen trials involving 4069 infants reported the rates of the more severe grades of IVH, grade 3 or 4 (Analysis 1.12). Two trials reported significantly higher rates in the HFOV group: the large HIFI 1989 study, which contributed most weight in the overall analysis (RR 1.41, 95% CI 1.06 to 1.88); and the trial by Moriette 2001 (RR 1.73, 95% CI 1.04 to 2.87). Moriette 2001 reported an increased rate of severe IVH in the HFOV group, both in infants born at less than 28 weeks gestation (HFOV 26/81 versus CV 15/72) and in infants born at 28 or 29 weeks gestation (HFOV 8/58 versus CV 4/61). Overall, there was no significant difference in the rates of more severe grades of IVH between the HFOV and CV groups (summary RR 1.10, 95% CI 0.95 to 1.27). When only HVS trials (16 trials, 3300 infants) were included, the summary RR was 1.00 (95% CI 0.84 to 1.19). This finding was consistent across trials (P for heterogeneity = 0.30; I² = 13%).
A significantly different effect of HFOV on severe IVH was seen in the subgroup analysis by lung volume strategy: in the subgroup of trials not using a HVS the risk was significantly increased (summary RR 1.45, 95% CI 1.09 to 1.93; summary RD 0.07, 95% CI 0.02 to 0.13; NNTH 14, 95% CI 8 to 50) whereas in the subgroup of trials with a HVS targeting an FiO2 ≤ 0.30 the summary RR was 0.84 (95% CI 0.65 to 1.08) (test for between‐subgroup difference P = 0.02; I2 = 76%). No significant between‐subgroup differences were found for the subgroup analyses by surfactant use, type of HFO ventilator, CV strategy and age at randomisation. For the subgroup analysis by I:E ratio, a significantly increased risk was seen in the trial that used an I:E ratio of 1:1 (Moriette 2001) (RR 1.73, 95% CI 1.04 to 2.87; RD 0.10, 95% CI 0.01 to 0.20; NNTH 10, 95% CI 5 to 100) as compared to the other subgroups (I:E ratio of 1:2, and range of I:E ratios or unknown) (test for subgroup difference P = 0.08; I2 = 61%).
Periventricular leukomalacia (PVL)
PVL was reported for 3983 infants in 17 studies. There was a non‐significant trend towards an increased rate with HFOV in HIFI 1989 (RR 1.61, 95% CI 0.99 to 2.60) but no significant difference overall (summary RR 1.03, 95% CI 0.81 to 1.31) (Analysis 1.13).
In the subgroup analysis by HFOV strategy (Analysis 2.6), there was a significant between‐subgroup heterogeneity (test for subgroup difference P = 0.08; I2 = 61%) with a significantly increased risk for PVL in the subgroup of trials that did not use a HVS (summary RR 1.64, 95% CI 1.02 to 2.64). Both subgroups of trials using HVS showed no significant difference in the risk of PVL (summary RR 0.91, 95% CI 0.55 to 1.48 for subgroup HVS with target FiO2 ≤ 0.30; and 0.85, 95% CI 0.60 to 1.21 for subgroup HVS with target FiO2 > 0.30 or not specified).
For the subgroup analyses by type of HFO ventilator, CV strategy, age at randomisation and I:E ratio, where only trials that used an HVS with HFOV were included, no significant differences between subgroups were found.
Retinopathy of prematurity (ROP)
Twelve trials with 2781 surviving infants reported significant ROP (stage 2 or greater) (Analysis 1.14). The overall analysis showed a significant decrease in the HFOV group with no heterogeneity (summary RR 0.81, 95% CI 0.70 to 0.93; summary RD ‐0.04, 95% CI ‐0.07 to ‐0.01; NNTB 25, 95% CI 14 to 100) (I2 = 0%). When only trials that used HVS were considered, the summary RR was 0.75 (95% CI 0.63 to 0.89).
Pulmonary function tests, symptoms and growth at follow‐up
No significant differences in pulmonary function test results were found during the neonatal period (Abbasi 1991) or at discharge (Gerhardt 1989) in subgroups of infants from individual centres in the HIFI 1989 trial. Long‐term follow‐up assessments (in 82% of survivors), including pulmonary function tests (in 43% of survivors from 7 of the 10 centres), were carried out at nine months corrected age in infants from HIFI 1989 (The HIFI Study Group 1990a). There were no significant differences in respiratory function tests (compliance, resistance, lung volumes) or in the incidence of respiratory tract infections, hospital re‐admissions, respiratory symptoms and signs (retractions and episodes of wheezing) or in growth.
Twelve month follow‐up of patients in the Ogawa 1993 trial showed persistence of abnormal fibrous or emphysematous shadows on chest x‐ray in two of the infants in the HFOV group and four in the CV group.
Eighty‐seven per cent of the infants in Gerstmann 1996 were followed up at a mean age of 6.4 years. Improved respiratory function tests (decreased peak expiratory flow, increased residual lung volume, maldistribution of ventilation) were found in the HFOV group but there were no significant differences in symptoms (pulmonary illness, asthma, hospitalisation) between the groups.
Of 185 survivors from 12 centres in Johnson 2002, 149 were invited for respiratory function tests and these were successfully carried out in 76 at 11 to 14 months of age (Thomas 2004). No differences were found between the HFOV and CV groups in any of the measures (functional residual capacity, inspiratory and expiratory resistance, respirator rate). Respiratory symptoms, treatments and growth were assessed at two years of age (Marlow 2006) and there were no differences between the HFOV and CV groups. A larger cohort of adolescent survivors (n = 319) was followed by Zivanovic 2014. The HFOV group had superior results on a test of small‐airway function, forced expiratory volume in 1 second, forced vital capacity, peak expiratory flow, diffusing capacity, and impulse‐oscillometric findings. As compared with the conventional‐therapy group, the HFOV group had significantly higher ratings from teachers in three of eight school subjects assessed, but there were no other significant differences in functional outcomes.
A two years of age assessment of 138 (82%) of survivors in the NOVA study (Schreiber 2003), re‐analysed by type of ventilation, revealed no difference in the mean height, weight or head circumference of children in the HFOV and CV groups.
Neurodevelopmental outcomes at follow‐up
Neurodevelopmental status at follow‐up was reported for eight studies (HIFI 1989; Ogawa 1993; Gerstmann 1996; Moriette 2001; Johnson 2002; Schreiber 2003; Van Reempts 2003; Sun 2014). The age and methods of assessment varied between studies so the results were presented in the text and not included in a meta‐analysis.
Neurodevelopmental status was assessed at 16 to 24 months corrected age in 77% of survivors of the HIFI 1989 study (185 HFOV & 201 CV) using Bayley psychometric tests and central nervous system examinations (The HIFI Study Group 1990b). The rate of moderate to severe abnormality (Bayley's scores more than one SD below the mean, or neurological abnormality) was higher in the HFOV group (RR 1.28, 95% CI 1.02 to 1.60). The rate of cerebral palsy was 11% in both groups. There was an increase in the rate of hydrocephalus in the HFOV group (RR 2.08, 95% CI 1.07 to 4.06). Using logistic regression, abnormal neurological status was shown to be associated with the increased rate of severe grade 3 or 4 IVH in this study.
One year follow‐up in the trial by Ogawa 1993 showed no significant difference in motor or mental development, although the method of neurological assessment was not given.
Gerstmann 1996 reported neurodevelopmental status at a mean of 6.4 years for 87% of the infants. Assessment of mental function using the Wechsler Scale for Children, and motor function using the Bruinink‐Oseretsky test showed no significant difference in mean scores between the two groups.
Moriette 2001 assessed neuromotor outcome at the corrected age of two years in 192 of 212 survivors (90%) using a physician questionnaire. Despite a non‐significant increase in severe IVH rate in the HFOV group as compared with the CV group, the risk of spastic cerebral palsy was significantly lower for infants ventilated with HFOV (4% versus 17%; OR 0.87, 95% CI 0.79 to 0.96), even after adjustment for multiple factors. Survival without cerebral palsy was significantly more likely in the HFOV group than in the CV group (OR 1.89, 95% CI 1.04 to 3.44).
Johnson 2002 reported neurodevelopmental outcomes at 22 to 28 months (corrected for prematurity) based on paediatric report for 73% of survivors and on parent questionnaires for 49% of survivors. No differences between the HFOV and CV groups were found.
Van Reempts 2003 followed up a subgroup of infants who were less than 30 weeks gestation or 1250 grams at birth, or had intracranial lesions on ultrasound. This included 70 infants in the HFOV group and 68 in the CV group, representing 57% and 51% respectively of survivors in the whole trial. Bayley motor and mental developmental indices, as well as motor diagnoses, were assessed at 7 to 12 months corrected age. There was no significant difference between the groups, with 60% of HFOV infants and 70% of CV infants being completely normal. Follow‐up of only the 'abnormal' infants at 18 to 24 months corrected age revealed that none of the infants in the HFOV group and four of the infants in the CV group were persistently abnormal, which was not statistically different.
Schreiber 2003 re‐analysed the follow‐up data from the NOVA study according to mode of ventilation. Of the 168 survivors to two years of age (84 in each group), data were available for 66 (78.6%) of those in the HFOV group and 72 (85.7%) in the CV group. Based on blinded assessments using Bayley's Scales (mean scores and number with scores < 70) and Pediatric neurological assessment there were no differences between the groups.
Sun 2014 assessed neurodevelopmental outcomes at 18 months of corrected age in 145 infants of the HFOV group (84% of survivors) and in 143 infants of the CV group (86% of survivors). Cerebral palsy occurred significantly less in the HFOV group (3% versus 10% in the CV group, P = 0.03), and the risk of having a mental developmental index < 70 was significantly lower in the HFOV group as compared to the CV group (20% versus 31%, P = 0.03). The rate of visual impairment and severe hearing loss was comparable in both groups.
Length of stay and hospital costs
The total hospital costs from a subgroup of patients from one centre (Gerstmann 1996) suggested that the median hospital costs were less in 42 patients randomised to HFOV compared with 41 in the CV group. In this trial, similar differences were found for those infants with birth weights of one kilogram or less and those of more than one kilogram. There were no significant reductions in the median length of hospital stay or in median duration of IPPV in this trial, nor in Rettwitz‐Volk 1998 and Clark 1992, although the trend in each case was towards a reduction in the HFOV group. Johnson 2002 reported similar median and range of days of hospital stay in survivors between treatment groups (HFOV 94 days, range 73 to 114; CV 89 days, range 70 to 112). In the trial by Salvo 2012 a significantly shorter duration of hospital stay was found in the HFOV group (mean days ± SD): 53 ± 21 versus 77 ± 33 in the CV group, P < 0.05. In the Sun 2014 trial a significantly shorter duration of hospital stay was found in the HFOV group (mean days ± SD): 27.0 ± 20.2 versus 31.6 ± 21.7 in the CV group (P = 0.04).
Other outcomes
Subgroup analyses based on baseline patient risk factors have been performed in an individual patient data meta‐analysis reported elsewhere Cools 2010). No differences in effect were found between HFOV and CV on the outcomes of death or bronchopulmonary dysplasia (BPD) at 36 weeks and death or severe adverse neurological event for subgroups based on gestational age at birth (< 26 wk, 26 to 28 wk, 29 to 31 wk, ≥ 32 wk), oxygenation index at study entry (< 4, 4 to 9, > 9), treatment with antenatal corticosteroids or not, age at intubation (< 1 hr, 1 to 4 hr, > 4 hr) and age at randomisation (< 1 hr, 1 to 4 hr, > 4 hr).
Use of surfactant was not a pre‐specified outcome in this review. Four trials (Gerstmann 1996; Plavka 1999; Moriette 2001; Salvo 2012) reported less use of surfactant in the group receiving HFOV. In four trials there was no significant difference in surfactant use (Durand 2001; Courtney 2002; Johnson 2002; Van Reempts 2003).
Discusión
En esta revisión, la búsqueda reveló 19 ensayos que cumplieron los criterios de elegibilidad preespecificados y diez ensayos que se excluyeron. Es posible que haya otros ensayos que no hayan sido publicados o fueron publicados en un idioma no cubierto por esta revisión sistemática. Los revisores están muy interesados en obtener información sobre otros ensayos publicados, no publicados o en curso.
Limitaciones de esta revisión
Los estudios se realizaron durante un largo período (25 años), en el que es posible que los cambios de las prácticas obstétricas y de neonatología hayan influido en las enfermedades estudiadas, como por ejemplo el SDR, la HIV y la EPC. Los participantes en los primeros ensayos podían tener hasta 34 semanas de edad gestacional o un peso al nacer de 2000 gramos, mientras que los ensayos recientes se han limitado a los lactantes más inmaduros, por ejemplo con menos de 30 semanas de edad gestacional o menos de 1200 gramos de peso al nacer, o a una población más seleccionada de lactantes prematuros que tiene mayor riesgo de desarrollar EPC, por ejemplo lactantes prematuros que no recibieron corticosteroides prenatales o con enfermedad pulmonar más grave, expresada por un índice de oxigenación.
Las intervenciones variaron significativamente según el tipo de respirador y la estrategia utilizada para la VOAF y la VC. Con el transcurso del tiempo hay mayor probabilidad que la VOAF se suministre con una EVA, con mayor probabilidad de mejorar el efecto de la VOAF, mientras que la VC tiene mayor probabilidad de ser administrada con el uso de estrategias de protección pulmonar (EPP), lo que puede disminuir la efectividad comparativa de la VOAF. Al considerar la discusión más reciente acerca de la importancia de obtener un "reclutamiento alveolar óptimo" durante la EVA con el objetivo de una FiO2 por debajo de 0,30 o incluso de 0,25 durante la fase de reclutamiento del volumen pulmonar, el análisis de subgrupos por la estrategia VOAF fue más refinado al analizar por separado los ensayos de una EVA dirigida a una FiO2 ≤ 0,30 y los ensayos de una EVA dirigidos a una FiO2 > 0,30. Sin embargo, este análisis de subgrupos se basa en la estrategia de ventilación concebida o prescrita, que quizás no siempre refleje la estrategia de ventilación utilizada en realidad en el ensayo. Lo anterior se podría explorar de forma adicional en el metanálisis de datos de pacientes individuales mediante técnicas de análisis multifactorial. Las estrategias de protección del pulmón (EPP) para prevenir la EPC en la VC son difíciles de definir. Hay diversas maniobras dirigidas principalmente a evitar la lesión pulmonar aguda en lugar de la EPC. En esta revisión se utilizaron cuatro categorías para evaluar los ensayos que utilizaron la mayoría de las estrategias ("definitivamente EPP") en comparación con el otro extremo de ninguna ("definitivamente no EPP") y dos grupos intermedios Estos datos resumidos se basan en pruebas mixtas débiles y quizás también se puedan explorar aún más en el metanálisis de datos de pacientes individuales anteriormente mencionado.
La calidad de los estudios fue generalmente alta, ya que todos intentaron ocultar el proceso de asignación al azar. Sin embargo, las intervenciones no estaban cegadas en ningún estudio, lo que puede asociarse con sesgos relativos al uso de cointervenciones y en el examen de las medidas de resultado, como la duración de la intervención mecánica y de la oxigenoterapia. La confirmación de los resultados fue completa en la mayoría de los casos, o se completó mediante la aclaración del autor. Como en ninguno de los estudios se pudo cegar el tratamiento, es posible que las medidas de resultado que dependen de los cuidadores, como la duración de la oxigenoterapia o el diagnóstico de la EPC, puedan tener menos validez.
Resultados pulmonares
Una estrategia de ventilación con VOAF dirigida al reclutamiento alveolar óptimo se considera ampliamente en la actualidad como la estrategia más apropiada para el uso de la VOAF en los lactantes prematuros para evitar la lesión pulmonar. En esta revisión solamente se identificaron dos ensayos que no lograron utilizar una estrategia de volumen pulmonar alto (HIFI 1989; Rettwitz‐Volk 1998). Debido a la relevancia clínica de dicha estrategia, no solo se realizaron metanálisis que incluyeron todos los ensayos, sino también después de la exclusión de los ensayos que no lograron utilizar una estrategia de reclutamiento de volumen pulmonar con VOAF.
Es posible que el uso de la VOAF se asocie con efectos beneficiosos pulmonares a corto plazo. Varios estudios informan una duración más corta de la ventilación mecánica, aunque no siempre fue estadísticamente significativa. Desafortunadamente, el metanálisis no fue posible para este resultado debido a diferencias en el informe. El resultado es apoyado por los resultados del metanálisis de datos de pacientes individuales y muestra una reducción significativa de la edad posmenstrual a la extubación final en el grupo de VOAF (nueve ensayos, 2480 lactantes; diferencia de medias ponderada ‐0,35 semanas; IC del 95%: ‐0,57 a ‐0,12) (Cools 2010) y en la edad posmenstrual a la cual se podría interrumpir la PPNCVR en el grupo de VOAF (cuatro ensayos, 737 lactantes; diferencia de medias ponderada ‐0,42 semanas; IC del 95%: ‐0,85 a 0,00) (Cools 2010).
Sin embargo, este efecto beneficioso potencial se contrarresta por un posible aumento en el riesgo de lesión pulmonar aguda. Se encontró un aumento significativo en el riesgo de pérdidas de aire pulmonar en el grupo de VOAF en el metanálisis cuando el enfisema pulmonar intersticial y las pérdidas evidentes de aire pulmonar se consideraron en un resultado combinado. Cuando solamente se considera la pérdida evidente de aire pulmonar, que consiste principalmente en el neumotórax, se encontró una tendencia no significativa hacia un aumento en el riesgo. Este resultado fue consistente entre los ensayos.
Al combinar todos los ensayos que utilizaron una estrategia de volumen alto (EVA) se observó una reducción pequeña pero estadísticamente significativa en el riesgo de EPC a una edad gestacional equivalente al término (36 a 37 semanas de gestación o al alta) con el uso de la VOAF. Sin embargo, hubo una heterogeneidad significativa entre los ensayos en este resultado, lo que significa que este efecto beneficioso no fue consistentemente reproducible en cada ensayo. Esta heterogeneidad se exploró de forma adicional con análisis de subgrupos.
Aunque se ha demostrado claramente la factibilidad de lograr un reclutamiento alveolar óptimo con la VOAF, y lograr así una FiO2 < 0,30 (De Jaegere 2006) y en muchas ocasiones se ha recomendado la importancia de dicha EVA estricta, el análisis de subgrupos por rigor de la estrategia de VOAF (EVA "estricta" con una FiO2 objetivo ≤ 0,30 versus EVA "menos estricta" con una FiO2 objetivo > 0,30 o no especificada) no redujo esta heterogeneidad. Lo anterior quizás se deba al hecho de que la estrategia de ventilación concebida o prescrita no siempre reflejó la estrategia que en realidad se aplicó en el ensayo. Los datos del metanálisis de datos de pacientes individuales apoyan esta idea al indicar que en varios ensayos más del 50% de los lactantes del grupo de VOAF nunca alcanzaron la FiO2 que se fijó como un objetivo para el reclutamiento del volumen pulmonar (datos no publicados).
La VOAF no solamente varió de un ensayo a otro en cuanto a la estrategia de ventilación sino también con respecto al tipo de respirador (osciladores de pistón versus interruptores del flujo) y las características del respirador (cociente I:E de 1:1 versus 1:2). Estudios experimentales han mostrado que los respiradores funcionan de forma diferente según la técnica que se utilice (Pillow 2001) y que los cambios en el cociente I:E pueden afectar las presiones intrapulmonares (Pillow 1999). Sin embargo, en esta revisión no se encontraron de forma consistente diferencias significativas entre los subgrupos en el efecto en los análisis de subgrupos por tipo de respirador o por las características I:E. En algunos ensayos (Johnson 2002) se utilizó más de un tipo de respirador, lo que hizo que la clasificación de dichos ensayos fuera problemática. Aunque el metanálisis de datos de pacientes individuales pudo superar esta limitación, no logró mostrar ninguna interacción significativa entre los subgrupos (Cools 2010).
En el análisis de subgrupos por estrategia de VC no fue posible demostrar de forma consistente diferencias significativas en el efecto entre los subgrupos y persistió una heterogeneidad considerable entre los ensayos dentro de los subgrupos. Debido a la falta de información detallada con respecto a la estrategia de ventilación, los ensayos fueron difíciles de clasificar. Se debe señalar que los dos ensayos que definitivamente no utilizaron una estrategia de ventilación de protección pulmonar con VC (Clark 1992; Gerstmann 1996) encontraron una reducción significativa en el riesgo de EPC a una edad gestacional equivalente al término en el grupo de VOAF.
El análisis de subgrupos por la edad a la asignación al azar no demostró a una diferencia significativa entre los subgrupos cuando se utilizó el modelo de efectos aleatorios. Sin embargo, los dos ensayos en el subgrupo > seis horas tuvieron resultados contradictorios (un efecto beneficioso significativo en Clark 1992 versus una tendencia hacia el efecto perjudicial en Schreiber 2003) lo que indica que probablemente estos ensayos difirieron en muchos otros aspectos y no solo en la edad en el momento de la asignación al azar. A diferencia con el subgrupo < dos horas, en el subgrupo de dos a seis horas se encontró una reducción significativa en el riesgo de EPC a una edad gestacional equivalente al término y este resultado fue consistente entre los cuatro ensayos en este subgrupo. Aunque de forma hipotética, el hecho de que la asignación al azar a las dos a seis horas de edad en comparación con cero a dos horas pueda haber incluido a lactantes con enfermedad pulmonar más definitiva, en lugar de un grupo mixto que incluyera lactantes con hipoventilación al nacer, podría ser una explicación convincente.
Probablemente muchos factores han interactuado en esos ensayos, como la administración prenatal de esteroides, la administración de surfactante y la estrategia de ventilación. El metanálisis de datos de pacientes individuales quizás pueda aclarar la interacción compleja de todos estos factores al utilizar análisis multifactoriales más complejos.
Resultados en el neurodesarrollo
El aumento de las tasas de HIV o de LPV ocurrió en algunos ensayos individuales pero no en general. Los factores fisiopatológicos que pueden producir un incremento de la tasa de HIV o de LPV son inciertos. Los autores de HIFI 1989 indicaron que la casi constante presión media alta de las vías aéreas durante la VOAF puede restringir el retorno venoso, incrementar la presión venosa intracraneal y disminuir el flujo sanguíneo cerebral. Sin embargo, estudios en animales (Kinsella 1991) y estudios realizados en humanos (Laubscher 1996) no lograron mostrar estos cambios cardiovasculares. El último estudio informó que el gasto cardíaco disminuyó con el uso de la VOAF. En un centro único involucrado en el estudio Johnson 2002, se les realizó ecocardiografía a 45 lactantes (Osborn 2003). El flujo de la vena cava superior se redujo (< 50 ml/kg/min) en más lactantes con VOAF (48%) que con VC (20%), pero esta diferencia no fue significativa. Cambonie 2003 examinó los cambios hemodinámicos durante la VOAF versus la VC y no encontró diferencias de la función cardíaca, pero sí una menor velocidad diastólica final y un mayor índice de resistencia en la arteria cerebral anterior.
La tendencia a tasas mayores de HIV o LPV encontrada en esta revisión asociada con el no uso de EVA también se mostró en otras dos revisiones de las pruebas de la efectividad de la ventilación de alta frecuencia (ventilación oscilatoria y a chorros) (Bollen 2003; Thome 2005) y en una revisión de la ventilación a chorros electiva versus VC (Bhuta 2003). Se ha involucrado la imposibilidad de reclutar el volumen pulmonar y la consiguiente inestabilidad cardiorrespiratoria (Bryan 1991). Es difícil decir si se debió a uno de estos mecanismos o sólo a la falta de experiencia en ese momento con una nueva tecnología. El ensayo grande HIFI 1989 dominó este análisis.
En cinco de los siete ensayos que informaron la medida de resultado del desarrollo neurológico a largo plazo no fueron evidentes las diferencias, aunque en algunos estudios hubo considerables pérdidas durante el seguimiento. Sólo en un ensayo (Sun 2014) se observó un efecto beneficioso significativo de la VOAF en el riesgo de parálisis cerebral o de presentar un desarrollo mental deficiente a los 18 meses de edad corregidos.
Preguntas de investigación planteadas por esta revisión
Se incluyeron las siguientes.
-
¿Hay una población específica de lactantes prematuros con alto riesgo de EPC que se beneficiaría de la VOAF temprana? El metanálisis de datos de pacientes individuales no logró identificar dicho grupo sobre la base de la edad gestacional al nacer, el tratamiento prenatal con corticosteroides o no, el índice de oxigenación temprana o el crecimiento intrauterino, pero tiene limitaciones debido al diseño retrospectivo. Los ensayos más recientes que se incluyeron en esta actualización también estaban dirigidos a responder esta pregunta debido a que incluyeron solamente lactantes que no se beneficiaron de los corticosteroides prenatales (Salvo 2012) o que presentaban enfermedad pulmonar más grave (Sun 2014). Sólo uno de esos ensayos (Sun 2014) mostró un efecto beneficioso significativo de la VOAF, el otro tuvo un tamaño de la muestra pequeño y la incidencia de EPC en el grupo control fue muy baja (8%).
-
En la última década, el tratamiento temprano del SDR en los lactantes prematuros ha variado desde la ventilación mecánica invasiva temprana hacia diferentes formas de ventilación no invasivas (presión positiva nasal continua de las vías respiratorias [PPNCVR], PPNCVR de alta frecuencia, VPPI nasal, VPPI nasal sincronizada) combinadas o no con la administración temprana de surfactante (método INSURE, administración mínimamente invasiva de surfactante). ¿Cuáles son los efectos de la VOAF electivo en comparación con la VC cuando se utiliza como una intervención temprana de rescate después del fracaso de estas intervenciones respiratorias iniciales no invasivas?
-
¿Existen diferencias en los resultados pulmonares y los efectos adversos según el tipo de respirador utilizado para generar la VOAF? Aunque el metanálisis de datos de pacientes individuales superó algunas limitaciones del metanálisis de datos agrupados al abordar esta pregunta, no se pueden excluir los factores de confusión posibles por otros factores relacionados con el ensayo. Esta pregunta se podría responder mejor con un ensayo de comparación directa de VOAF con un oscilador verdadero versus un interruptor de flujo.
-
Los datos de seguimiento a largo plazo neurológicos y pulmonares de los ensayos aún son limitados. Por lo tanto, todavía son inciertos cuáles son los resultados del crecimiento y el desarrollo a largo plazo de los lactantes tratados con VOAF versus VC.
-
¿Hay diferencias en los costos en comparación con los efectos beneficiosos de la VOAF? Solamente un estudio pequeño (Gerstmann 1996) indicó que la VOAF redujo los costos de la atención.
Risk of bias graph: review authors' judgements about each risk of bias item presented as percentages across all included studies.
Risk of bias summary: review authors' judgements about each risk of bias item for each included study.

Comparison 1 HFOV versus CV (all trials), Outcome 1 Death by 28 to 30 days.

Comparison 1 HFOV versus CV (all trials), Outcome 2 Mechanical ventilation at 28 to 30 days in survivors.

Comparison 1 HFOV versus CV (all trials), Outcome 3 Oxygen at 28 to 30 days in survivors.

Comparison 1 HFOV versus CV (all trials), Outcome 4 CLD at 28 to 30 days (O2 + x‐ray) in survivors.

Comparison 1 HFOV versus CV (all trials), Outcome 5 Death or CLD at 28 to 30 days.

Comparison 1 HFOV versus CV (all trials), Outcome 6 Death by 36 to 37 weeks or discharge.

Comparison 1 HFOV versus CV (all trials), Outcome 7 CLD at 36 to 37 weeks PMA or discharge in survivors.

Comparison 1 HFOV versus CV (all trials), Outcome 8 Death or CLD at 36 to 37 weeks PMA or discharge.

Comparison 1 HFOV versus CV (all trials), Outcome 9 Any pulmonary air leak.

Comparison 1 HFOV versus CV (all trials), Outcome 10 Gross pulmonary air leak.

Comparison 1 HFOV versus CV (all trials), Outcome 11 Intraventricular haemorrhage ‐ all grades.

Comparison 1 HFOV versus CV (all trials), Outcome 12 Intraventricular haemorrhage ‐ grades 3 or 4.

Comparison 1 HFOV versus CV (all trials), Outcome 13 Periventricular leukomalacia.

Comparison 1 HFOV versus CV (all trials), Outcome 14 Retinopathy of prematurity (stage 2 or greater) in survivors.

Comparison 2 HFOV versus CV subgrouped by volume strategy on HFOV, Outcome 1 Death by 36 to 37 weeks or discharge.

Comparison 2 HFOV versus CV subgrouped by volume strategy on HFOV, Outcome 2 CLD at 36 to 37 weeks PMA or discharge in survivors.

Comparison 2 HFOV versus CV subgrouped by volume strategy on HFOV, Outcome 3 Death or CLD at 36 to 37 weeks PMA or discharge.

Comparison 2 HFOV versus CV subgrouped by volume strategy on HFOV, Outcome 4 Gross pulmonary air leak.

Comparison 2 HFOV versus CV subgrouped by volume strategy on HFOV, Outcome 5 Intraventricular haemorrhage ‐ grades 3 or 4.

Comparison 2 HFOV versus CV subgrouped by volume strategy on HFOV, Outcome 6 Periventricular leukomalacia.

Comparison 3 HFOV versus CV subgrouped by use of surfactant, Outcome 1 Death by 36 to 37 weeks or discharge.

Comparison 3 HFOV versus CV subgrouped by use of surfactant, Outcome 2 CLD at 36 to 37 weeks PMA or discharge in survivors.

Comparison 3 HFOV versus CV subgrouped by use of surfactant, Outcome 3 Death or CLD at 36 to 37 weeks PMA or discharge.

Comparison 3 HFOV versus CV subgrouped by use of surfactant, Outcome 4 Gross pulmonary air leak.

Comparison 3 HFOV versus CV subgrouped by use of surfactant, Outcome 5 Intraventricular haemorrhage ‐ grades 3 or 4.

Comparison 3 HFOV versus CV subgrouped by use of surfactant, Outcome 6 Periventricular leukomalacia.

Comparison 4 HFOV versus CV subgrouped by type of HFO ventilator, Outcome 1 Death by 36 to 37 weeks or discharge.

Comparison 4 HFOV versus CV subgrouped by type of HFO ventilator, Outcome 2 CLD at 36 to 37 weeks PMA or discharge in survivors.

Comparison 4 HFOV versus CV subgrouped by type of HFO ventilator, Outcome 3 Death or CLD at 36 to 37 weeks PMA or discharge.

Comparison 4 HFOV versus CV subgrouped by type of HFO ventilator, Outcome 4 Gross pulmonary air leak.

Comparison 4 HFOV versus CV subgrouped by type of HFO ventilator, Outcome 5 Intraventricular haemorrhage ‐ grades 3 or 4.

Comparison 4 HFOV versus CV subgrouped by type of HFO ventilator, Outcome 6 Periventricular leukomalacia.

Comparison 5 HFOV versus CV subgrouped by lung protective (LPS) CV strategy, Outcome 1 Death by 36 to 37 weeks or discharge.

Comparison 5 HFOV versus CV subgrouped by lung protective (LPS) CV strategy, Outcome 2 CLD at 36 to 37 weeks PMA or discharge in survivors.

Comparison 5 HFOV versus CV subgrouped by lung protective (LPS) CV strategy, Outcome 3 Death or CLD at 36 to 37 weeks PMA or discharge.

Comparison 5 HFOV versus CV subgrouped by lung protective (LPS) CV strategy, Outcome 4 Gross pulmonary air leak.

Comparison 5 HFOV versus CV subgrouped by lung protective (LPS) CV strategy, Outcome 5 Intraventricular haemorrhage ‐ grades 3 or 4.

Comparison 5 HFOV versus CV subgrouped by lung protective (LPS) CV strategy, Outcome 6 Periventricular leukomalacia.

Comparison 6 HFOV versus CV subgrouped by age at randomisation, Outcome 1 Death by 36 to 37 weeks or discharge.

Comparison 6 HFOV versus CV subgrouped by age at randomisation, Outcome 2 CLD at 36 to 37 weeks PMA or discharge in survivors.

Comparison 6 HFOV versus CV subgrouped by age at randomisation, Outcome 3 Death or CLD at 36 to 37 weeks PMA or discharge.

Comparison 6 HFOV versus CV subgrouped by age at randomisation, Outcome 4 Gross pulmonary air leak.

Comparison 6 HFOV versus CV subgrouped by age at randomisation, Outcome 5 Intraventricular haemorrhage ‐ grades 3 or 4.

Comparison 6 HFOV versus CV subgrouped by age at randomisation, Outcome 6 Periventricular leukomalacia.

Comparison 7 HFOV versus CV subgrouped by I:E ratio on HFOV, Outcome 1 Death by 36 to 37 weeks or discharge.

Comparison 7 HFOV versus CV subgrouped by I:E ratio on HFOV, Outcome 2 CLD at 36 to 37 weeks PMA or discharge in survivors.

Comparison 7 HFOV versus CV subgrouped by I:E ratio on HFOV, Outcome 3 Death or CLD at 36 to 37 weeks PMA or discharge.

Comparison 7 HFOV versus CV subgrouped by I:E ratio on HFOV, Outcome 4 Gross pulmonary air leak.

Comparison 7 HFOV versus CV subgrouped by I:E ratio on HFOV, Outcome 5 Intraventricular haemorrhage ‐ grades 3 or 4.

Comparison 7 HFOV versus CV subgrouped by I:E ratio on HFOV, Outcome 6 Periventricular leukomalacia.
| Outcome or subgroup title | No. of studies | No. of participants | Statistical method | Effect size |
| 1 Death by 28 to 30 days Show forest plot | 10 | 2148 | Risk Ratio (M‐H, Fixed, 95% CI) | 1.09 [0.88, 1.34] |
| 2 Mechanical ventilation at 28 to 30 days in survivors Show forest plot | 3 | 767 | Risk Ratio (M‐H, Fixed, 95% CI) | 1.08 [0.86, 1.35] |
| 3 Oxygen at 28 to 30 days in survivors Show forest plot | 6 | 1043 | Risk Ratio (M‐H, Fixed, 95% CI) | 0.98 [0.88, 1.10] |
| 4 CLD at 28 to 30 days (O2 + x‐ray) in survivors Show forest plot | 4 | 820 | Risk Ratio (M‐H, Fixed, 95% CI) | 0.86 [0.74, 1.01] |
| 5 Death or CLD at 28 to 30 days Show forest plot | 5 | 1160 | Risk Ratio (M‐H, Fixed, 95% CI) | 0.94 [0.85, 1.04] |
| 6 Death by 36 to 37 weeks or discharge Show forest plot | 17 | 3329 | Risk Ratio (M‐H, Fixed, 95% CI) | 0.95 [0.81, 1.10] |
| 7 CLD at 36 to 37 weeks PMA or discharge in survivors Show forest plot | 17 | 2786 | Risk Ratio (M‐H, Fixed, 95% CI) | 0.86 [0.78, 0.96] |
| 8 Death or CLD at 36 to 37 weeks PMA or discharge Show forest plot | 17 | 3329 | Risk Ratio (M‐H, Fixed, 95% CI) | 0.90 [0.84, 0.97] |
| 9 Any pulmonary air leak Show forest plot | 13 | 2854 | Risk Ratio (M‐H, Fixed, 95% CI) | 1.19 [1.05, 1.34] |
| 10 Gross pulmonary air leak Show forest plot | 11 | 2185 | Risk Ratio (M‐H, Fixed, 95% CI) | 1.13 [0.88, 1.45] |
| 11 Intraventricular haemorrhage ‐ all grades Show forest plot | 12 | 3084 | Risk Ratio (M‐H, Fixed, 95% CI) | 1.04 [0.95, 1.14] |
| 12 Intraventricular haemorrhage ‐ grades 3 or 4 Show forest plot | 18 | 4069 | Risk Ratio (M‐H, Fixed, 95% CI) | 1.10 [0.95, 1.27] |
| 13 Periventricular leukomalacia Show forest plot | 17 | 3983 | Risk Ratio (M‐H, Fixed, 95% CI) | 1.03 [0.81, 1.31] |
| 14 Retinopathy of prematurity (stage 2 or greater) in survivors Show forest plot | 12 | 2781 | Risk Ratio (M‐H, Fixed, 95% CI) | 0.81 [0.70, 0.93] |
| Outcome or subgroup title | No. of studies | No. of participants | Statistical method | Effect size |
| 1 Death by 36 to 37 weeks or discharge Show forest plot | 17 | 3329 | Risk Ratio (M‐H, Fixed, 95% CI) | 0.95 [0.81, 1.10] |
| 1.1 High volume strategy on HFOV with target FiO2 ≤ 0.30 | 8 | 1755 | Risk Ratio (M‐H, Fixed, 95% CI) | 0.87 [0.71, 1.08] |
| 1.2 High volume strategy on HFOV with target FiO2 > 0.30 or not specified | 8 | 1478 | Risk Ratio (M‐H, Fixed, 95% CI) | 1.02 [0.81, 1.28] |
| 1.3 No high volume strategy on HFOV | 1 | 96 | Risk Ratio (M‐H, Fixed, 95% CI) | 1.36 [0.39, 4.75] |
| 2 CLD at 36 to 37 weeks PMA or discharge in survivors Show forest plot | 17 | 2786 | Risk Ratio (M‐H, Fixed, 95% CI) | 0.86 [0.78, 0.96] |
| 2.1 High volume strategy on HFOV with target FiO2 ≤ 0.30 | 8 | 1483 | Risk Ratio (M‐H, Fixed, 95% CI) | 0.87 [0.76, 0.99] |
| 2.2 High volume strategy on HFOV with target FiO2 > 0.30 or not specified | 8 | 1216 | Risk Ratio (M‐H, Fixed, 95% CI) | 0.86 [0.73, 1.00] |
| 2.3 No high volume strategy of HFOV | 1 | 87 | Risk Ratio (M‐H, Fixed, 95% CI) | 0.0 [0.0, 0.0] |
| 3 Death or CLD at 36 to 37 weeks PMA or discharge Show forest plot | 17 | 3329 | Risk Ratio (M‐H, Fixed, 95% CI) | 0.90 [0.84, 0.97] |
| 3.1 High volume strategy on HFOV with target FiO2 ≤ 0.30 | 8 | 1755 | Risk Ratio (M‐H, Fixed, 95% CI) | 0.89 [0.81, 0.97] |
| 3.2 High volume strategy on HFOV with target FiO2 > 0.30 or not specified | 8 | 1478 | Risk Ratio (M‐H, Fixed, 95% CI) | 0.91 [0.81, 1.02] |
| 3.3 No high volume strategy on HFOV | 1 | 96 | Risk Ratio (M‐H, Fixed, 95% CI) | 1.36 [0.39, 4.75] |
| 4 Gross pulmonary air leak Show forest plot | 11 | 2185 | Risk Ratio (M‐H, Fixed, 95% CI) | 1.13 [0.88, 1.45] |
| 4.1 High volume strategy HFOV with target FiO2 ≤ 0.30 | 4 | 705 | Risk Ratio (M‐H, Fixed, 95% CI) | 0.96 [0.61, 1.51] |
| 4.2 High volume strategy on HFOV with target FiO2 > 0.30 or not specified | 6 | 1384 | Risk Ratio (M‐H, Fixed, 95% CI) | 1.26 [0.93, 1.71] |
| 4.3 No high volume strategy on HFOV | 1 | 96 | Risk Ratio (M‐H, Fixed, 95% CI) | 0.65 [0.17, 2.58] |
| 5 Intraventricular haemorrhage ‐ grades 3 or 4 Show forest plot | 18 | 4069 | Risk Ratio (M‐H, Fixed, 95% CI) | 1.10 [0.95, 1.27] |
| 5.1 High volume strategy on HFOV with target FiO2 ≤ 0.30 | 7 | 1730 | Risk Ratio (M‐H, Fixed, 95% CI) | 0.84 [0.65, 1.08] |
| 5.2 High volume strategy on HFOV with target FiO2 > 0.30 or not specified | 9 | 1570 | Risk Ratio (M‐H, Fixed, 95% CI) | 1.17 [0.92, 1.48] |
| 5.3 No high volume strategy on HFOV | 2 | 769 | Risk Ratio (M‐H, Fixed, 95% CI) | 1.45 [1.09, 1.93] |
| 6 Periventricular leukomalacia Show forest plot | 17 | 3983 | Risk Ratio (M‐H, Fixed, 95% CI) | 1.03 [0.81, 1.31] |
| 6.1 High volume strategy on HFOV with target FiO2 ≤ 0.30 | 8 | 1755 | Risk Ratio (M‐H, Fixed, 95% CI) | 0.91 [0.55, 1.48] |
| 6.2 High volume strategy with target FiO2 > 0.30 or not specified | 7 | 1459 | Risk Ratio (M‐H, Fixed, 95% CI) | 0.85 [0.60, 1.21] |
| 6.3 No high volume strategy on HFOV | 2 | 769 | Risk Ratio (M‐H, Fixed, 95% CI) | 1.64 [1.02, 2.64] |
| Outcome or subgroup title | No. of studies | No. of participants | Statistical method | Effect size |
| 1 Death by 36 to 37 weeks or discharge Show forest plot | 16 | 3233 | Risk Ratio (M‐H, Fixed, 95% CI) | 0.94 [0.80, 1.10] |
| 1.1 Routine surfactant | 15 | 3168 | Risk Ratio (M‐H, Fixed, 95% CI) | 0.94 [0.80, 1.10] |
| 1.2 No routine surfactant | 1 | 65 | Risk Ratio (M‐H, Fixed, 95% CI) | 1.01 [0.40, 2.58] |
| 2 CLD at 36 to 37 weeks PMA or discharge in survivors Show forest plot | 16 | 2699 | Risk Ratio (M‐H, Fixed, 95% CI) | 0.86 [0.78, 0.96] |
| 2.1 Routine surfactant | 15 | 2648 | Risk Ratio (M‐H, Fixed, 95% CI) | 0.88 [0.80, 0.97] |
| 2.2 No routine surfactant | 1 | 51 | Risk Ratio (M‐H, Fixed, 95% CI) | 0.23 [0.07, 0.73] |
| 3 Death or CLD at 36 to 37 weeks PMA or discharge Show forest plot | 16 | 3233 | Risk Ratio (M‐H, Fixed, 95% CI) | 0.90 [0.83, 0.97] |
| 3.1 Routine surfactant | 15 | 3168 | Risk Ratio (M‐H, Fixed, 95% CI) | 0.91 [0.84, 0.98] |
| 3.2 No routine surfactant | 1 | 65 | Risk Ratio (M‐H, Fixed, 95% CI) | 0.52 [0.29, 0.94] |
| 4 Gross pulmonary air leak Show forest plot | 10 | 2089 | Risk Ratio (M‐H, Fixed, 95% CI) | 1.15 [0.90, 1.49] |
| 4.1 Routine surfactant | 9 | 2024 | Risk Ratio (M‐H, Fixed, 95% CI) | 1.14 [0.87, 1.49] |
| 4.2 No routine surfactant | 1 | 65 | Risk Ratio (M‐H, Fixed, 95% CI) | 1.32 [0.65, 2.71] |
| 5 Intraventricular haemorrhage ‐ grades 3 or 4 Show forest plot | 16 | 3300 | Risk Ratio (M‐H, Fixed, 95% CI) | 1.00 [0.84, 1.19] |
| 5.1 Routine surfactant | 15 | 3235 | Risk Ratio (M‐H, Fixed, 95% CI) | 1.00 [0.84, 1.19] |
| 5.2 No routine surfactant | 1 | 65 | Risk Ratio (M‐H, Fixed, 95% CI) | 0.88 [0.33, 2.34] |
| 6 Periventricular leukomalacia Show forest plot | 15 | 3214 | Risk Ratio (M‐H, Fixed, 95% CI) | 0.87 [0.65, 1.16] |
| 6.1 Routine surfactant | 15 | 3214 | Risk Ratio (M‐H, Fixed, 95% CI) | 0.87 [0.65, 1.16] |
| 6.2 No routine surfactant | 0 | 0 | Risk Ratio (M‐H, Fixed, 95% CI) | 0.0 [0.0, 0.0] |
| Outcome or subgroup title | No. of studies | No. of participants | Statistical method | Effect size |
| 1 Death by 36 to 37 weeks or discharge Show forest plot | 16 | 3233 | Risk Ratio (M‐H, Fixed, 95% CI) | 0.94 [0.80, 1.10] |
| 1.1 Flow interrupter | 4 | 410 | Risk Ratio (M‐H, Fixed, 95% CI) | 0.94 [0.52, 1.69] |
| 1.2 HF oscillator | 11 | 2026 | Risk Ratio (M‐H, Fixed, 95% CI) | 0.93 [0.75, 1.16] |
| 1.3 Both HF oscillation and flow interruptors | 1 | 797 | Risk Ratio (M‐H, Fixed, 95% CI) | 0.95 [0.75, 1.20] |
| 2 CLD at 36 to 37 weeks PMA or discharge in survivors Show forest plot | 16 | 2699 | Risk Ratio (M‐H, Fixed, 95% CI) | 0.86 [0.78, 0.96] |
| 2.1 Flow interrupter | 4 | 370 | Risk Ratio (M‐H, Fixed, 95% CI) | 0.96 [0.70, 1.32] |
| 2.2 HF oscillator | 11 | 1737 | Risk Ratio (M‐H, Fixed, 95% CI) | 0.77 [0.67, 0.90] |
| 2.3 Both HF oscillators and flow interrupters | 1 | 592 | Risk Ratio (M‐H, Fixed, 95% CI) | 0.99 [0.85, 1.14] |
| 3 Death or CLD at 36 to 37 weeks PMA or discharge Show forest plot | 16 | 3233 | Risk Ratio (M‐H, Fixed, 95% CI) | 0.90 [0.83, 0.97] |
| 3.1 HF flow interrupter | 4 | 410 | Risk Ratio (M‐H, Fixed, 95% CI) | 0.96 [0.74, 1.24] |
| 3.2 HF oscillation | 11 | 2026 | Risk Ratio (M‐H, Fixed, 95% CI) | 0.83 [0.74, 0.93] |
| 3.3 Both HF oscillators and HF flow interrupters | 1 | 797 | Risk Ratio (M‐H, Fixed, 95% CI) | 0.98 [0.89, 1.08] |
| 4 Gross pulmonary air leak Show forest plot | 10 | 2089 | Risk Ratio (M‐H, Fixed, 95% CI) | 1.15 [0.90, 1.49] |
| 4.1 HF flow interrupter | 2 | 324 | Risk Ratio (M‐H, Fixed, 95% CI) | 1.88 [0.96, 3.67] |
| 4.2 HF oscillation | 8 | 1765 | Risk Ratio (M‐H, Fixed, 95% CI) | 1.06 [0.80, 1.39] |
| 4.3 Both HF oscillators and HF flow interrupters | 0 | 0 | Risk Ratio (M‐H, Fixed, 95% CI) | 0.0 [0.0, 0.0] |
| 5 Intraventricular haemorrhage ‐ grades 3 or 4 Show forest plot | 16 | 3300 | Risk Ratio (M‐H, Fixed, 95% CI) | 1.00 [0.84, 1.19] |
| 5.1 HF flow interrupter | 4 | 410 | Risk Ratio (M‐H, Fixed, 95% CI) | 1.08 [0.65, 1.78] |
| 5.2 HF oscillator | 11 | 2093 | Risk Ratio (M‐H, Fixed, 95% CI) | 1.11 [0.90, 1.36] |
| 5.3 Both HF oscillators and HF flow interrupters | 1 | 797 | Risk Ratio (M‐H, Fixed, 95% CI) | 0.69 [0.46, 1.01] |
| 6 Periventricular leukomalacia Show forest plot | 16 | 3216 | Risk Ratio (M‐H, Fixed, 95% CI) | 0.87 [0.65, 1.16] |
| 6.1 HF flow interrupter | 3 | 364 | Risk Ratio (M‐H, Fixed, 95% CI) | 2.29 [0.52, 10.04] |
| 6.2 HF oscillator | 12 | 2055 | Risk Ratio (M‐H, Fixed, 95% CI) | 0.82 [0.60, 1.11] |
| 6.3 Both HF oscillators and HF flow interrupters | 1 | 797 | Risk Ratio (M‐H, Fixed, 95% CI) | 0.99 [0.38, 2.62] |
| Outcome or subgroup title | No. of studies | No. of participants | Statistical method | Effect size |
| 1 Death by 36 to 37 weeks or discharge Show forest plot | 16 | 3233 | Risk Ratio (M‐H, Fixed, 95% CI) | 0.94 [0.80, 1.10] |
| 1.1 Definitive LPS on CV | 9 | 1679 | Risk Ratio (M‐H, Fixed, 95% CI) | 0.91 [0.70, 1.18] |
| 1.2 Probable LPS on CV | 3 | 1116 | Risk Ratio (M‐H, Fixed, 95% CI) | 0.98 [0.80, 1.21] |
| 1.3 Probably no LPS on CV | 2 | 248 | Risk Ratio (M‐H, Fixed, 95% CI) | 0.89 [0.52, 1.53] |
| 1.4 Definitively no LPS on CV | 2 | 190 | Risk Ratio (M‐H, Fixed, 95% CI) | 0.79 [0.33, 1.88] |
| 2 CLD at 36 to 37 weeks PMA or discharge in survivors Show forest plot | 16 | 2699 | Risk Ratio (M‐H, Fixed, 95% CI) | 0.86 [0.78, 0.96] |
| 2.1 Definitive LPS on CV | 9 | 1473 | Risk Ratio (M‐H, Fixed, 95% CI) | 0.79 [0.66, 0.94] |
| 2.2 Probable LPS on CV | 3 | 847 | Risk Ratio (M‐H, Fixed, 95% CI) | 0.96 [0.84, 1.10] |
| 2.3 Probably no LPS on CV | 2 | 205 | Risk Ratio (M‐H, Fixed, 95% CI) | 1.09 [0.79, 1.49] |
| 2.4 Definitively no LPS on CV | 2 | 174 | Risk Ratio (M‐H, Fixed, 95% CI) | 0.48 [0.31, 0.75] |
| 3 Death or CLD at 36 to 37 weeks PMA or discharge Show forest plot | 16 | 3235 | Risk Ratio (M‐H, Fixed, 95% CI) | 0.90 [0.83, 0.96] |
| 3.1 Definitive LPS on CV | 9 | 1679 | Risk Ratio (M‐H, Fixed, 95% CI) | 0.83 [0.72, 0.95] |
| 3.2 Probable LPS on CV | 3 | 1118 | Risk Ratio (M‐H, Fixed, 95% CI) | 0.97 [0.89, 1.07] |
| 3.3 Probably no LPS on CV | 2 | 248 | Risk Ratio (M‐H, Fixed, 95% CI) | 1.04 [0.82, 1.31] |
| 3.4 Definitively no LPS on CV | 2 | 190 | Risk Ratio (M‐H, Fixed, 95% CI) | 0.56 [0.38, 0.81] |
| 4 Gross pulmonary air leak Show forest plot | 10 | 2089 | Risk Ratio (M‐H, Fixed, 95% CI) | 1.15 [0.90, 1.49] |
| 4.1 Definitive LPS on CV | 6 | 1503 | Risk Ratio (M‐H, Fixed, 95% CI) | 1.04 [0.77, 1.41] |
| 4.2 Probable LPS on CV | 1 | 273 | Risk Ratio (M‐H, Fixed, 95% CI) | 1.69 [0.51, 5.63] |
| 4.3 Probably no LPS on CV | 2 | 248 | Risk Ratio (M‐H, Fixed, 95% CI) | 1.53 [0.77, 3.04] |
| 4.4 Definitively no LPS on CV | 1 | 65 | Risk Ratio (M‐H, Fixed, 95% CI) | 1.32 [0.65, 2.71] |
| 5 Intraventricular haemorrhage ‐ grades 3 or 4 Show forest plot | 16 | 3300 | Risk Ratio (M‐H, Fixed, 95% CI) | 1.00 [0.84, 1.19] |
| 5.1 Definitive LPS on CV | 8 | 1654 | Risk Ratio (M‐H, Fixed, 95% CI) | 1.03 [0.81, 1.30] |
| 5.2 Probable LPS on CV | 3 | 1116 | Risk Ratio (M‐H, Fixed, 95% CI) | 0.95 [0.71, 1.27] |
| 5.3 Probably no LPS on CV | 3 | 340 | Risk Ratio (M‐H, Fixed, 95% CI) | 1.32 [0.73, 2.37] |
| 5.4 Definitively no PLS on CV | 2 | 190 | Risk Ratio (M‐H, Fixed, 95% CI) | 0.62 [0.27, 1.39] |
| 6 Periventricular leukomalacia Show forest plot | 15 | 3214 | Risk Ratio (M‐H, Fixed, 95% CI) | 0.87 [0.65, 1.16] |
| 6.1 Definitive LPS on CV | 9 | 1679 | Risk Ratio (M‐H, Fixed, 95% CI) | 0.88 [0.61, 1.28] |
| 6.2 Probable LPS on CV | 2 | 1070 | Risk Ratio (M‐H, Fixed, 95% CI) | 0.82 [0.48, 1.42] |
| 6.3 Probably no LPS on CV | 3 | 340 | Risk Ratio (M‐H, Fixed, 95% CI) | 0.78 [0.30, 2.06] |
| 6.4 Definitively no LPS on CV | 1 | 125 | Risk Ratio (M‐H, Fixed, 95% CI) | 1.27 [0.30, 5.45] |
| Outcome or subgroup title | No. of studies | No. of participants | Statistical method | Effect size |
| 1 Death by 36 to 37 weeks or discharge Show forest plot | 14 | 2887 | Risk Ratio (M‐H, Fixed, 95% CI) | 0.91 [0.78, 1.07] |
| 1.1 Less than 2 hours | 7 | 1315 | Risk Ratio (M‐H, Fixed, 95% CI) | 0.95 [0.77, 1.18] |
| 1.2 2 to 6 hours | 5 | 1300 | Risk Ratio (M‐H, Fixed, 95% CI) | 0.85 [0.64, 1.14] |
| 1.3 Greater than 6 hours | 2 | 272 | Risk Ratio (M‐H, Fixed, 95% CI) | 0.91 [0.56, 1.48] |
| 2 CLD at 36 to 37 weeks PMA or discharge in survivors Show forest plot | 14 | 2404 | Risk Ratio (M‐H, Fixed, 95% CI) | 0.84 [0.75, 0.93] |
| 2.1 Less than 2 hours | 7 | 1058 | Risk Ratio (M‐H, Fixed, 95% CI) | 0.94 [0.82, 1.08] |
| 2.2 2 to 6 hours | 5 | 1127 | Risk Ratio (M‐H, Fixed, 95% CI) | 0.68 [0.56, 0.81] |
| 2.3 Greater than 6 hours | 2 | 219 | Risk Ratio (M‐H, Fixed, 95% CI) | 1.00 [0.74, 1.37] |
| 3 Death or CLD at 36 to 37 weeks PMA or discharge Show forest plot | 14 | 2887 | Risk Ratio (M‐H, Fixed, 95% CI) | 0.87 [0.81, 0.94] |
| 3.1 Less than 2 hours | 7 | 1315 | Risk Ratio (M‐H, Fixed, 95% CI) | 0.95 [0.87, 1.05] |
| 3.2 2‐6 hours | 5 | 1300 | Risk Ratio (M‐H, Fixed, 95% CI) | 0.74 [0.64, 0.85] |
| 3.3 Greater than 6 hours | 2 | 272 | Risk Ratio (M‐H, Fixed, 95% CI) | 0.99 [0.79, 1.23] |
| 4 Gross pulmonary air leak Show forest plot | 9 | 1789 | Risk Ratio (M‐H, Fixed, 95% CI) | 1.12 [0.86, 1.46] |
| 4.1 Less than 2 hours | 4 | 390 | Risk Ratio (M‐H, Fixed, 95% CI) | 1.54 [0.84, 2.82] |
| 4.2 2 ‐ 6 hours | 3 | 1127 | Risk Ratio (M‐H, Fixed, 95% CI) | 0.87 [0.60, 1.24] |
| 4.3 Greater than 6 hours | 2 | 272 | Risk Ratio (M‐H, Fixed, 95% CI) | 1.55 [0.92, 2.59] |
| 5 Intraventricular haemorrhage ‐ grades 3 or 4 Show forest plot | 15 | 3050 | Risk Ratio (M‐H, Fixed, 95% CI) | 1.01 [0.85, 1.21] |
| 5.1 less than 2 hours | 7 | 1382 | Risk Ratio (M‐H, Fixed, 95% CI) | 0.80 [0.59, 1.08] |
| 5.2 2 ‐ 6 hours | 6 | 1396 | Risk Ratio (M‐H, Fixed, 95% CI) | 1.15 [0.90, 1.46] |
| 5.3 Greater than 6 hours | 2 | 272 | Risk Ratio (M‐H, Fixed, 95% CI) | 1.18 [0.69, 2.01] |
| 6 Periventricular leukomalacia Show forest plot | 15 | 2916 | Risk Ratio (M‐H, Fixed, 95% CI) | 0.82 [0.61, 1.11] |
| 6.1 Less than 2 hours | 8 | 1407 | Risk Ratio (M‐H, Fixed, 95% CI) | 1.00 [0.52, 1.90] |
| 6.2 2 ‐ 6 hours | 5 | 1300 | Risk Ratio (M‐H, Fixed, 95% CI) | 0.76 [0.53, 1.08] |
| 6.3 Greater than 6 hours | 2 | 209 | Risk Ratio (M‐H, Fixed, 95% CI) | 1.03 [0.26, 4.01] |
| Outcome or subgroup title | No. of studies | No. of participants | Statistical method | Effect size |
| 1 Death by 36 to 37 weeks or discharge Show forest plot | 16 | 3233 | Risk Ratio (M‐H, Fixed, 95% CI) | 0.94 [0.80, 1.10] |
| 1.1 1:1 | 1 | 273 | Risk Ratio (M‐H, Fixed, 95% CI) | 1.11 [0.70, 1.75] |
| 1.2 1:2 | 9 | 1397 | Risk Ratio (M‐H, Fixed, 95% CI) | 0.97 [0.75, 1.25] |
| 1.3 Range of I:Es or unknown | 6 | 1563 | Risk Ratio (M‐H, Fixed, 95% CI) | 0.89 [0.71, 1.10] |
| 2 CLD at 36 to 37 weeks PMA or discharge in survivors Show forest plot | 16 | 2699 | Risk Ratio (M‐H, Fixed, 99% CI) | 0.86 [0.76, 0.99] |
| 2.1 1:1 | 1 | 215 | Risk Ratio (M‐H, Fixed, 99% CI) | 0.79 [0.43, 1.46] |
| 2.2 1:2 | 9 | 1183 | Risk Ratio (M‐H, Fixed, 99% CI) | 0.81 [0.66, 1.01] |
| 2.3 Range of I:Es or unknown | 6 | 1301 | Risk Ratio (M‐H, Fixed, 99% CI) | 0.92 [0.77, 1.09] |
| 3 Death or CLD at 36 to 37 weeks PMA or discharge Show forest plot | 16 | 3233 | Risk Ratio (M‐H, Fixed, 95% CI) | 0.90 [0.83, 0.97] |
| 3.1 1:1 | 1 | 273 | Risk Ratio (M‐H, Fixed, 95% CI) | 0.93 [0.70, 1.24] |
| 3.2 1:2 | 9 | 1397 | Risk Ratio (M‐H, Fixed, 95% CI) | 0.87 [0.77, 0.98] |
| 3.3 Range of I:Es or unknown | 6 | 1563 | Risk Ratio (M‐H, Fixed, 95% CI) | 0.92 [0.83, 1.01] |
| 4 Gross pulmonary air leak Show forest plot | 11 | 2185 | Risk Ratio (M‐H, Fixed, 95% CI) | 1.13 [0.88, 1.45] |
| 4.1 1:1 | 1 | 273 | Risk Ratio (M‐H, Fixed, 95% CI) | 1.69 [0.51, 5.63] |
| 4.2 1:2 | 7 | 1232 | Risk Ratio (M‐H, Fixed, 95% CI) | 1.17 [0.86, 1.58] |
| 4.3 Range of I:Es or unknown | 3 | 680 | Risk Ratio (M‐H, Fixed, 95% CI) | 0.99 [0.62, 1.57] |
| 5 Intraventricular haemorrhage ‐ grades 3 or 4 Show forest plot | 15 | 3259 | Risk Ratio (M‐H, Fixed, 95% CI) | 1.00 [0.84, 1.19] |
| 5.1 1:1 | 1 | 273 | Risk Ratio (M‐H, Fixed, 95% CI) | 1.73 [1.04, 2.87] |
| 5.2 1:2 | 7 | 1331 | Risk Ratio (M‐H, Fixed, 95% CI) | 0.97 [0.74, 1.26] |
| 5.3 Range of I:Es or unknown | 7 | 1655 | Risk Ratio (M‐H, Fixed, 95% CI) | 0.90 [0.70, 1.16] |
| 6 Periventricular leukomalacia Show forest plot | 15 | 3214 | Risk Ratio (M‐H, Fixed, 95% CI) | 0.87 [0.65, 1.16] |
| 6.1 1:1 | 1 | 273 | Risk Ratio (M‐H, Fixed, 95% CI) | 0.75 [0.39, 1.45] |
| 6.2 1:2 | 8 | 1332 | Risk Ratio (M‐H, Fixed, 95% CI) | 0.96 [0.64, 1.43] |
| 6.3 Range of I:Es or unknown | 6 | 1609 | Risk Ratio (M‐H, Fixed, 95% CI) | 0.81 [0.48, 1.36] |