Elective high frequency oscillatory ventilation versus conventional ventilation for acute pulmonary dysfunction in preterm infants
Información
- DOI:
- https://doi.org/10.1002/14651858.CD000104.pub4Copiar DOI

- Base de datos:
-
- Cochrane Database of Systematic Reviews
- Versión publicada:
-
- 19 marzo 2015see what's new
- Tipo:
-
- Intervention
- Etapa:
-
- Review
- Grupo Editorial Cochrane:
-
Grupo Cochrane de Neonatología
- Copyright:
-
- Copyright © 2015 The Cochrane Collaboration. Published by John Wiley & Sons, Ltd.
Cifras del artículo
Altmetric:
Citado por:
Autores
Contributions of authors
An earlier version of this review was developed by Bhuta and Henderson‐Smart and published in 1996. Both authors were involved at all stages in the review.
In 1999 the review was reformatted by Henderson‐Smart with inclusion of two new review authors, Cools and Offringa. Each author evaluated the trials and extracted data independently. Henderson‐Smart entered the data and wrote the text while all the co‐reviewers contributed to data checking and editing.
The update in 2007 included a search and data extraction from four new trials, by Henderson‐Smart and Cools. Henderson‐Smart entered the data and edited the review. The review was evaluated by all review authors.
The update in 2009 included a search by Cools and Offringa. Data from the two new trials were extracted by Cools, Offringa and Henderson‐Smart. Cools entered the data and edited the review. The review was evaluated by all authors.
The update in 2012 included a search by the CNRG Editorial Office through December 2012. Drs Cools and Offringa reviewed the data from the new trial of Salvo 2012 and edited the review. The review was evaluated by all authors.
The updated search in 2014 identified a follow‐up study of pulmonary function from the original trial of Johnson 2002 (Zivanovic. N Engl J Med. 2014 Mar 20;370 (12):1121‐30) and a new trial from Sun 2014. Drs Cools and Offringa reviewed the data from the Sun 2014 trial and edited the review.
Sources of support
Internal sources
-
Royal Prince Alfred Hospital, Sydney, Australia.
-
Department of Neonatology, Royal North Shore Hospital, Sydney, Australia.
-
Department of Neonatology, Academic Medical Centre, Amsterdam, Netherlands.
-
Centre for Perinatal Health Services Research, University of Sydney, Australia.
External sources
-
Eunice Kennedy Shriver National Institute of Child Health and Human Development National Institutes of Health, Department of Health and Human Services, USA.
Editorial support of the Cochrane Neonatal Review Group has been funded with Federal funds from the Eunice Kennedy Shriver National Institute of Child Health and Human Development National Institutes of Health, Department of Health and Human Services, USA, under Contract No. HHSN275201100016C.
Declarations of interest
None
Acknowledgements
Authors of the following trials: Clark 1992, Ogawa 1993, Gerstmann 1996, Rettwitz‐Volk 1998, Thome 1998, Plavka 1999, Moriette 2001, Johnson 2002, Van Reempts 2003 kindly provided additional information about their studies. Michael Schreiber kindly re‐analysed the data from the NOVA study (Schreiber 2003) and its follow‐up results according to type of ventilation.
The Cochrane Neonatal Review Group (CNRG) has been funded in part with Federal funds from the Eunice Kennedy Shriver National Institute of Child Health and Human Development National Institutes of Health, Department of Health and Human Services, USA, under Contract No. HHSN267200603418C.
Version history
| Published | Title | Stage | Authors | Version |
| 2015 Mar 19 | Elective high frequency oscillatory ventilation versus conventional ventilation for acute pulmonary dysfunction in preterm infants | Review | Filip Cools, Martin Offringa, Lisa M Askie | |
| 2009 Jul 08 | Elective high frequency oscillatory ventilation versus conventional ventilation for acute pulmonary dysfunction in preterm infants | Review | Filip Cools, David J Henderson‐Smart, Martin Offringa, Lisa M Askie | |
| 2007 Jul 18 | Elective high frequency oscillatory ventilation versus conventional ventilation for acute pulmonary dysfunction in preterm infants | Review | David J Henderson‐Smart, Filip Cools, Tushar Bhuta, Martin Offringa | |
| 2003 Oct 20 | Elective high frequency oscillatory ventilation versus conventional ventilation for acute pulmonary dysfunction in preterm infants | Review | David J Henderson‐Smart, Tushar Bhuta, Filip Cools, Martin Offringa | |
Keywords
MeSH
Medical Subject Headings (MeSH) Keywords
- *High‐Frequency Ventilation;
- Chronic Disease;
- Infant, Premature;
- Infant, Premature, Diseases [*prevention & control];
- Lung Diseases [*prevention & control];
- Lung Injury [prevention & control];
- Randomized Controlled Trials as Topic;
- Respiration, Artificial;
- Respiratory Distress Syndrome, Newborn [therapy];
Medical Subject Headings Check Words
Humans; Infant, Newborn;
PICO
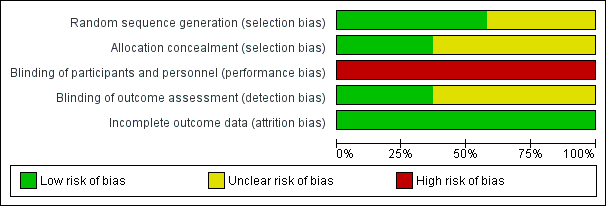
Risk of bias graph: review authors' judgements about each risk of bias item presented as percentages across all included studies.

Risk of bias summary: review authors' judgements about each risk of bias item for each included study.
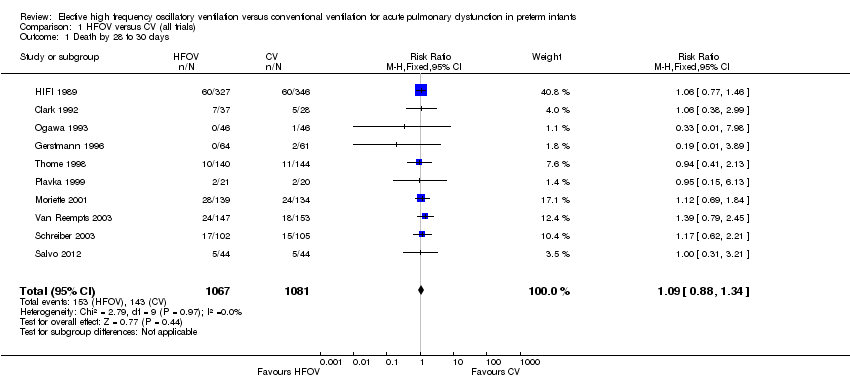
Comparison 1 HFOV versus CV (all trials), Outcome 1 Death by 28 to 30 days.
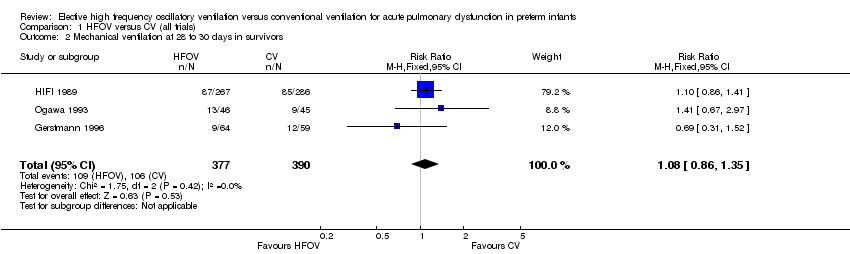
Comparison 1 HFOV versus CV (all trials), Outcome 2 Mechanical ventilation at 28 to 30 days in survivors.

Comparison 1 HFOV versus CV (all trials), Outcome 3 Oxygen at 28 to 30 days in survivors.

Comparison 1 HFOV versus CV (all trials), Outcome 4 CLD at 28 to 30 days (O2 + x‐ray) in survivors.

Comparison 1 HFOV versus CV (all trials), Outcome 5 Death or CLD at 28 to 30 days.

Comparison 1 HFOV versus CV (all trials), Outcome 6 Death by 36 to 37 weeks or discharge.

Comparison 1 HFOV versus CV (all trials), Outcome 7 CLD at 36 to 37 weeks PMA or discharge in survivors.
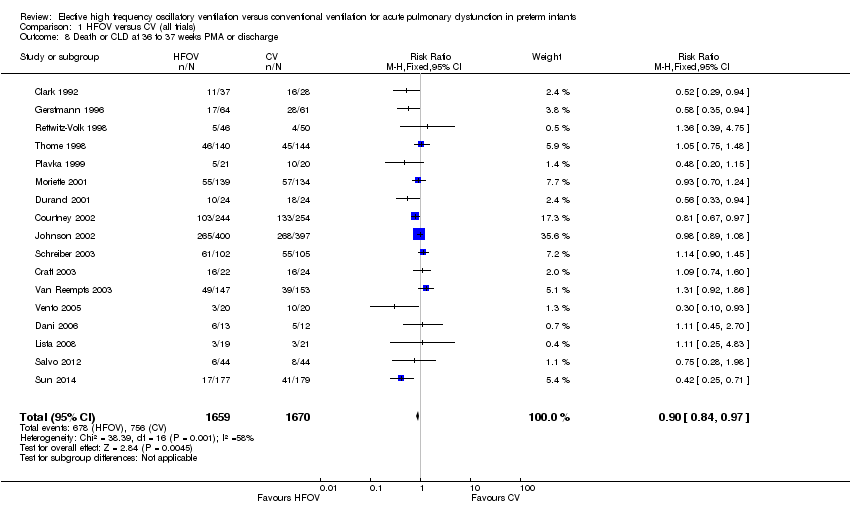
Comparison 1 HFOV versus CV (all trials), Outcome 8 Death or CLD at 36 to 37 weeks PMA or discharge.

Comparison 1 HFOV versus CV (all trials), Outcome 9 Any pulmonary air leak.
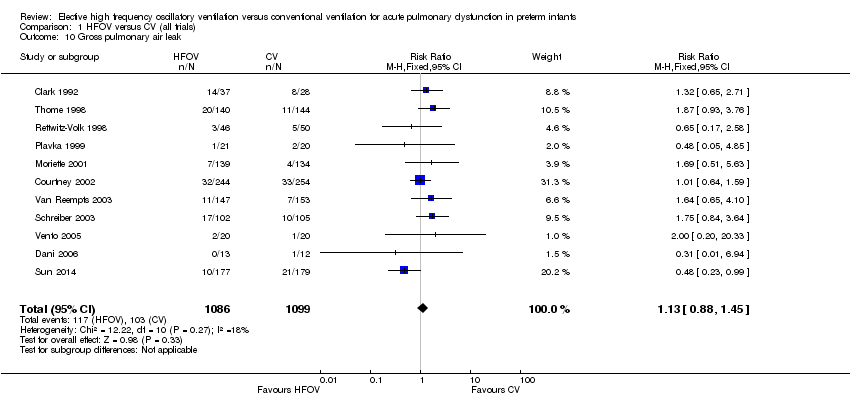
Comparison 1 HFOV versus CV (all trials), Outcome 10 Gross pulmonary air leak.
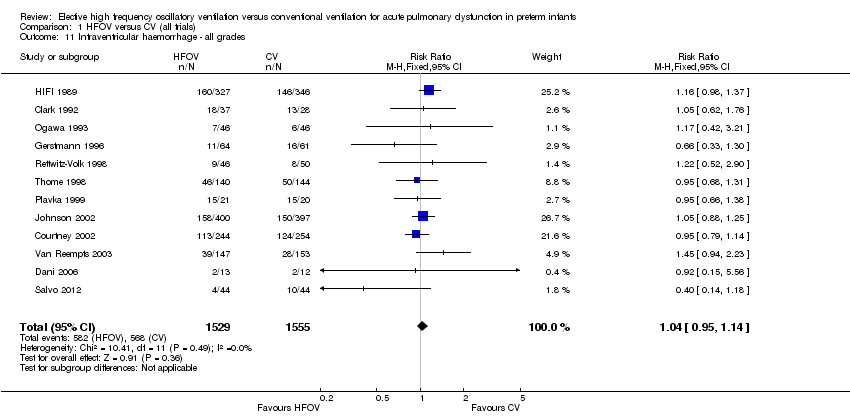
Comparison 1 HFOV versus CV (all trials), Outcome 11 Intraventricular haemorrhage ‐ all grades.
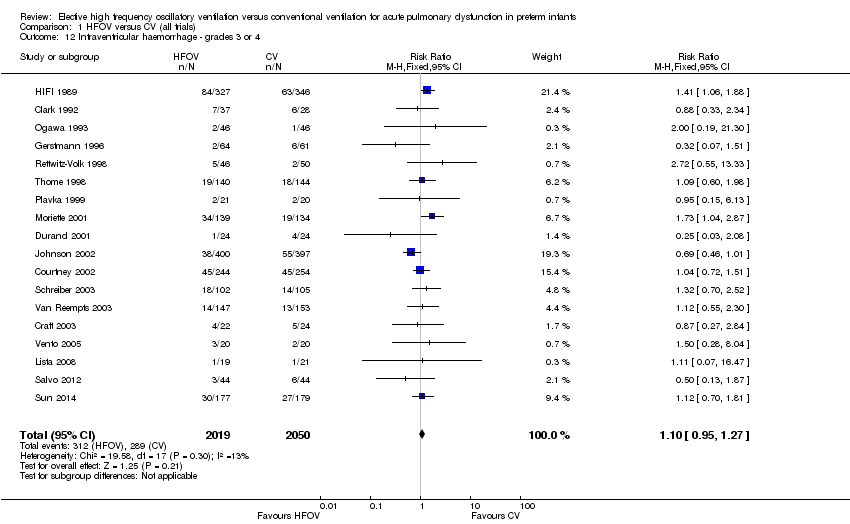
Comparison 1 HFOV versus CV (all trials), Outcome 12 Intraventricular haemorrhage ‐ grades 3 or 4.

Comparison 1 HFOV versus CV (all trials), Outcome 13 Periventricular leukomalacia.

Comparison 1 HFOV versus CV (all trials), Outcome 14 Retinopathy of prematurity (stage 2 or greater) in survivors.

Comparison 2 HFOV versus CV subgrouped by volume strategy on HFOV, Outcome 1 Death by 36 to 37 weeks or discharge.

Comparison 2 HFOV versus CV subgrouped by volume strategy on HFOV, Outcome 2 CLD at 36 to 37 weeks PMA or discharge in survivors.
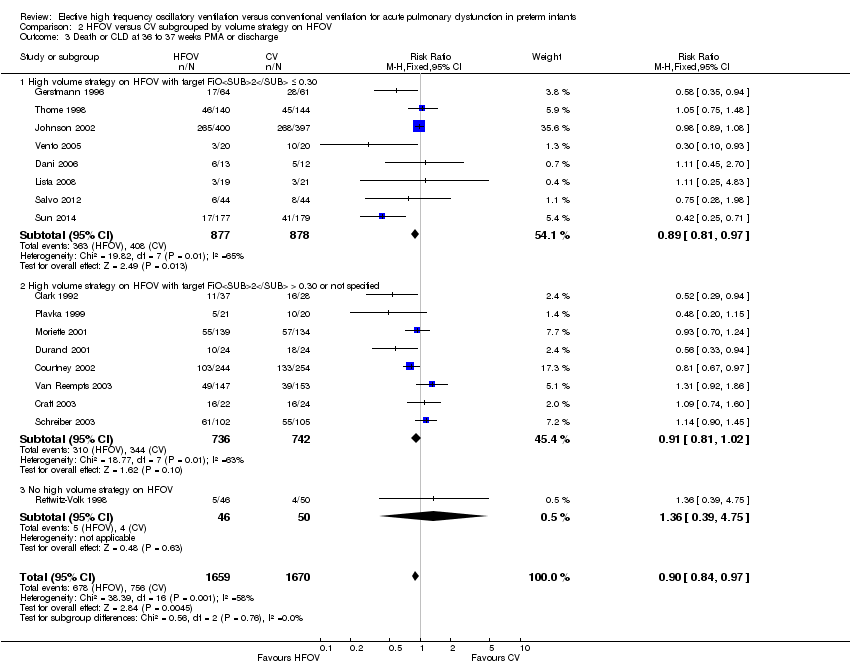
Comparison 2 HFOV versus CV subgrouped by volume strategy on HFOV, Outcome 3 Death or CLD at 36 to 37 weeks PMA or discharge.
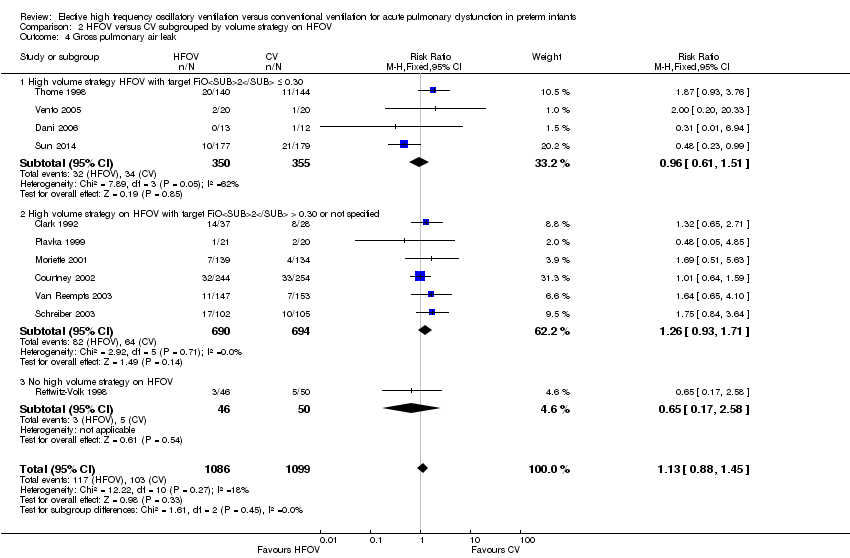
Comparison 2 HFOV versus CV subgrouped by volume strategy on HFOV, Outcome 4 Gross pulmonary air leak.
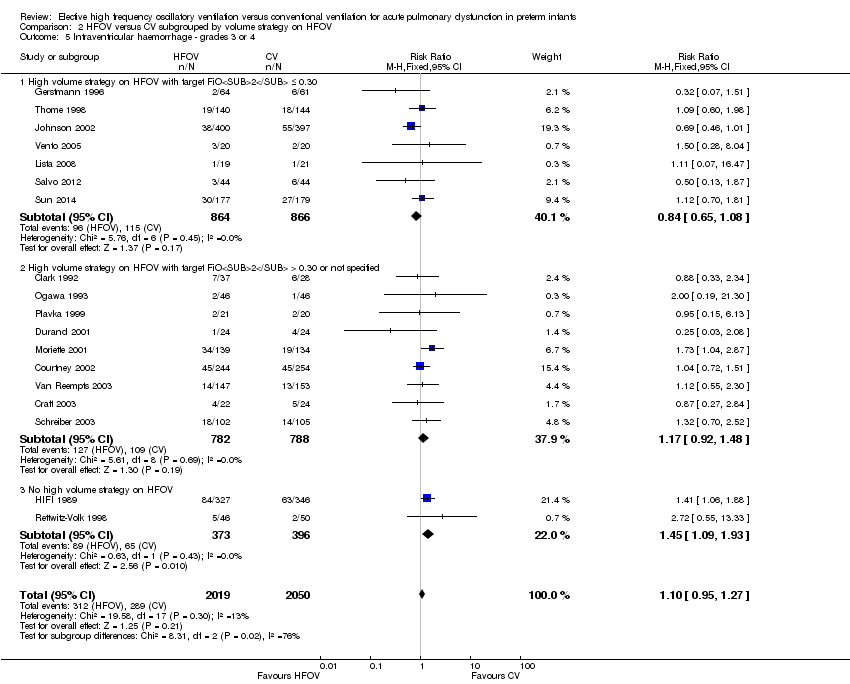
Comparison 2 HFOV versus CV subgrouped by volume strategy on HFOV, Outcome 5 Intraventricular haemorrhage ‐ grades 3 or 4.
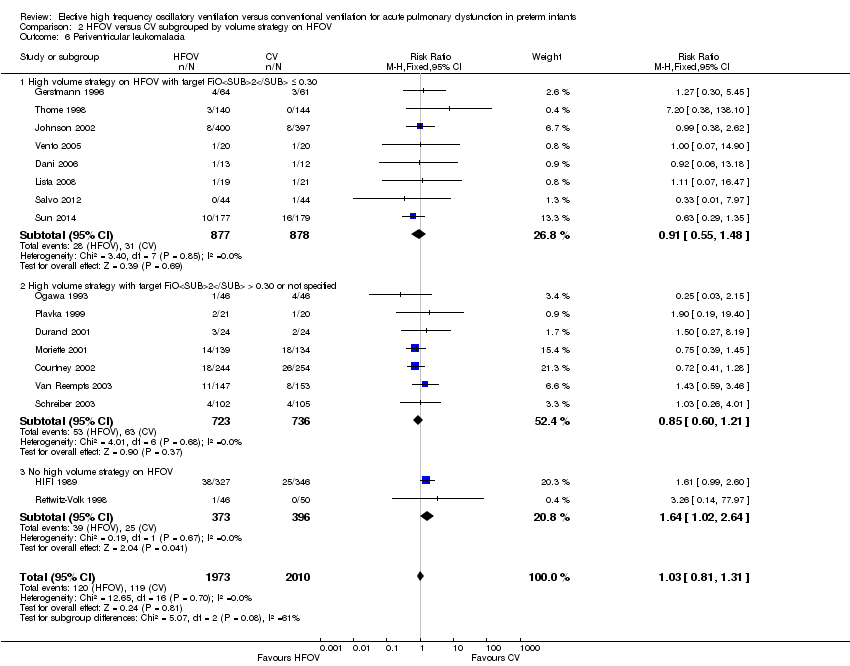
Comparison 2 HFOV versus CV subgrouped by volume strategy on HFOV, Outcome 6 Periventricular leukomalacia.
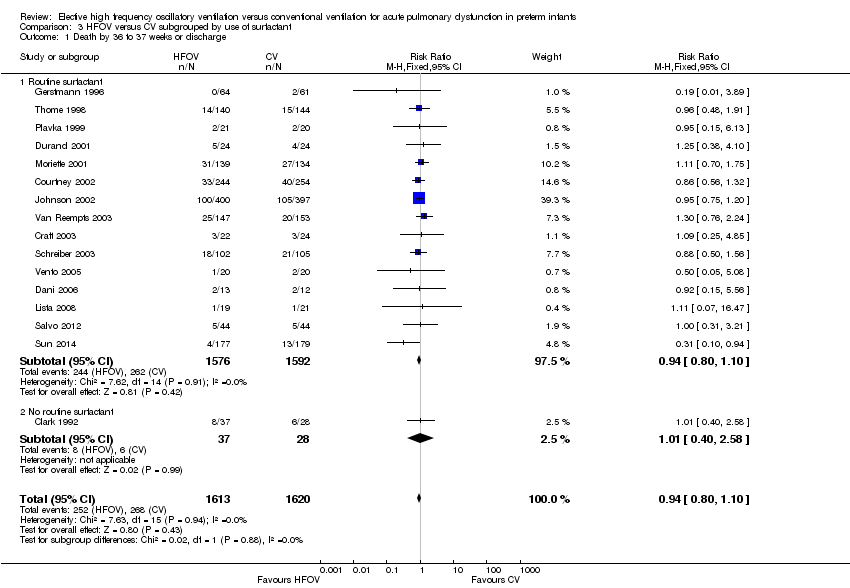
Comparison 3 HFOV versus CV subgrouped by use of surfactant, Outcome 1 Death by 36 to 37 weeks or discharge.
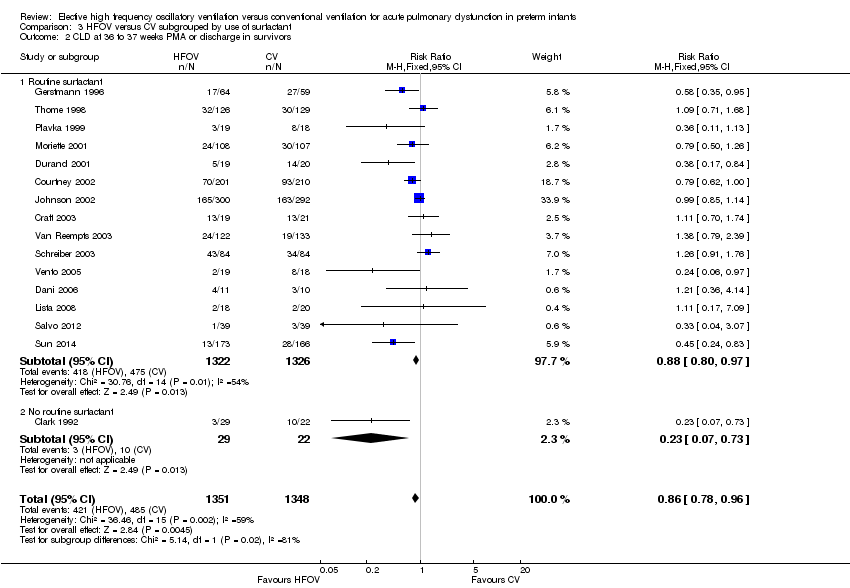
Comparison 3 HFOV versus CV subgrouped by use of surfactant, Outcome 2 CLD at 36 to 37 weeks PMA or discharge in survivors.
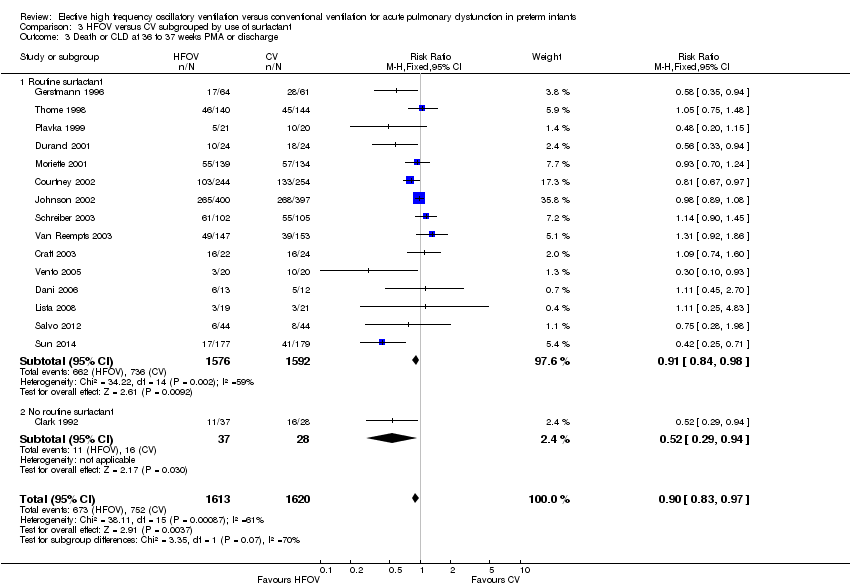
Comparison 3 HFOV versus CV subgrouped by use of surfactant, Outcome 3 Death or CLD at 36 to 37 weeks PMA or discharge.

Comparison 3 HFOV versus CV subgrouped by use of surfactant, Outcome 4 Gross pulmonary air leak.
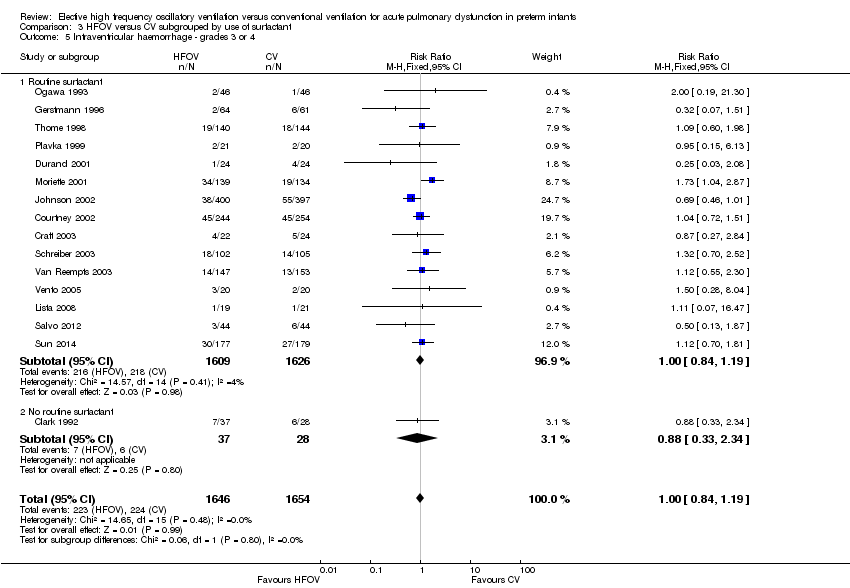
Comparison 3 HFOV versus CV subgrouped by use of surfactant, Outcome 5 Intraventricular haemorrhage ‐ grades 3 or 4.

Comparison 3 HFOV versus CV subgrouped by use of surfactant, Outcome 6 Periventricular leukomalacia.

Comparison 4 HFOV versus CV subgrouped by type of HFO ventilator, Outcome 1 Death by 36 to 37 weeks or discharge.

Comparison 4 HFOV versus CV subgrouped by type of HFO ventilator, Outcome 2 CLD at 36 to 37 weeks PMA or discharge in survivors.
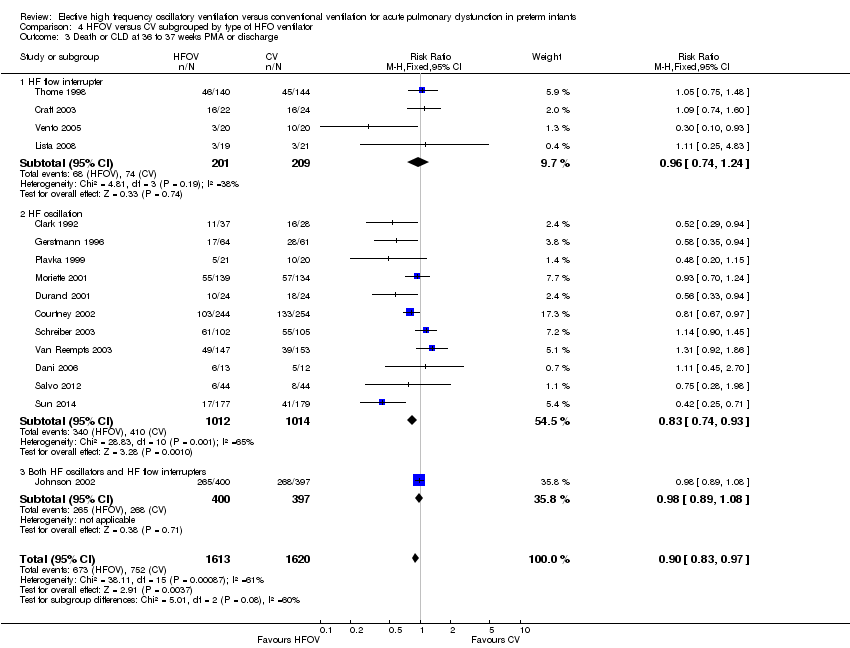
Comparison 4 HFOV versus CV subgrouped by type of HFO ventilator, Outcome 3 Death or CLD at 36 to 37 weeks PMA or discharge.
Comparison 4 HFOV versus CV subgrouped by type of HFO ventilator, Outcome 4 Gross pulmonary air leak.

Comparison 4 HFOV versus CV subgrouped by type of HFO ventilator, Outcome 5 Intraventricular haemorrhage ‐ grades 3 or 4.

Comparison 4 HFOV versus CV subgrouped by type of HFO ventilator, Outcome 6 Periventricular leukomalacia.

Comparison 5 HFOV versus CV subgrouped by lung protective (LPS) CV strategy, Outcome 1 Death by 36 to 37 weeks or discharge.
Comparison 5 HFOV versus CV subgrouped by lung protective (LPS) CV strategy, Outcome 2 CLD at 36 to 37 weeks PMA or discharge in survivors.

Comparison 5 HFOV versus CV subgrouped by lung protective (LPS) CV strategy, Outcome 3 Death or CLD at 36 to 37 weeks PMA or discharge.
Comparison 5 HFOV versus CV subgrouped by lung protective (LPS) CV strategy, Outcome 4 Gross pulmonary air leak.
Comparison 5 HFOV versus CV subgrouped by lung protective (LPS) CV strategy, Outcome 5 Intraventricular haemorrhage ‐ grades 3 or 4.
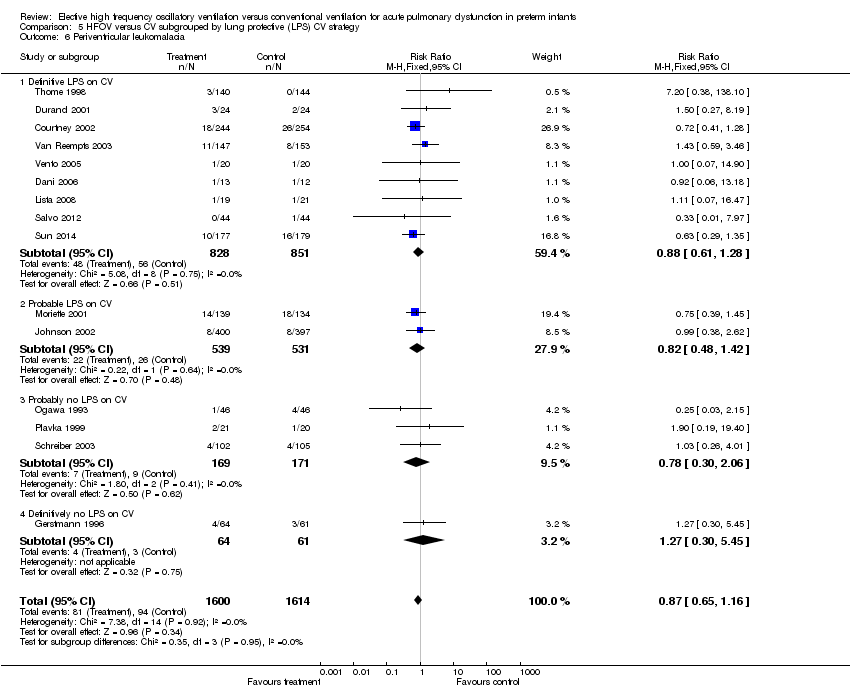
Comparison 5 HFOV versus CV subgrouped by lung protective (LPS) CV strategy, Outcome 6 Periventricular leukomalacia.

Comparison 6 HFOV versus CV subgrouped by age at randomisation, Outcome 1 Death by 36 to 37 weeks or discharge.

Comparison 6 HFOV versus CV subgrouped by age at randomisation, Outcome 2 CLD at 36 to 37 weeks PMA or discharge in survivors.
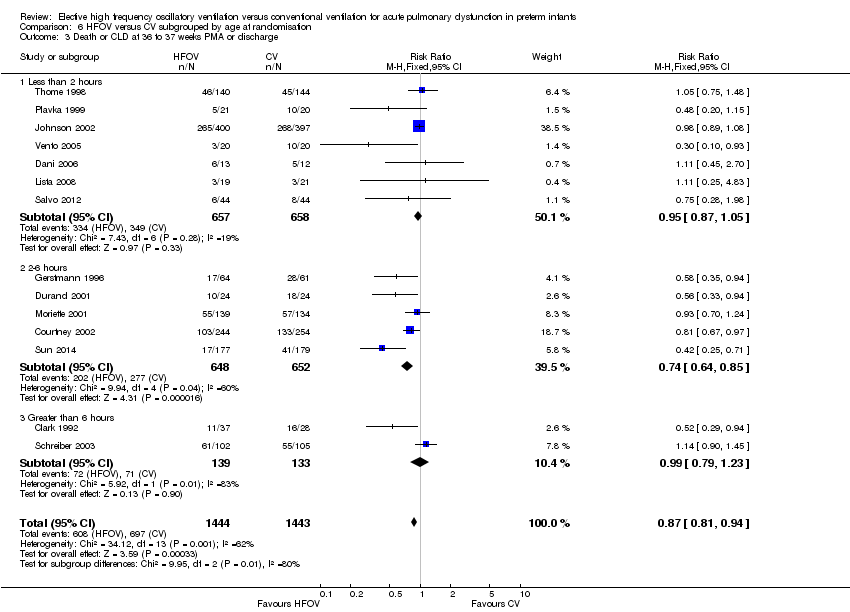
Comparison 6 HFOV versus CV subgrouped by age at randomisation, Outcome 3 Death or CLD at 36 to 37 weeks PMA or discharge.

Comparison 6 HFOV versus CV subgrouped by age at randomisation, Outcome 4 Gross pulmonary air leak.

Comparison 6 HFOV versus CV subgrouped by age at randomisation, Outcome 5 Intraventricular haemorrhage ‐ grades 3 or 4.

Comparison 6 HFOV versus CV subgrouped by age at randomisation, Outcome 6 Periventricular leukomalacia.

Comparison 7 HFOV versus CV subgrouped by I:E ratio on HFOV, Outcome 1 Death by 36 to 37 weeks or discharge.

Comparison 7 HFOV versus CV subgrouped by I:E ratio on HFOV, Outcome 2 CLD at 36 to 37 weeks PMA or discharge in survivors.

Comparison 7 HFOV versus CV subgrouped by I:E ratio on HFOV, Outcome 3 Death or CLD at 36 to 37 weeks PMA or discharge.

Comparison 7 HFOV versus CV subgrouped by I:E ratio on HFOV, Outcome 4 Gross pulmonary air leak.

Comparison 7 HFOV versus CV subgrouped by I:E ratio on HFOV, Outcome 5 Intraventricular haemorrhage ‐ grades 3 or 4.
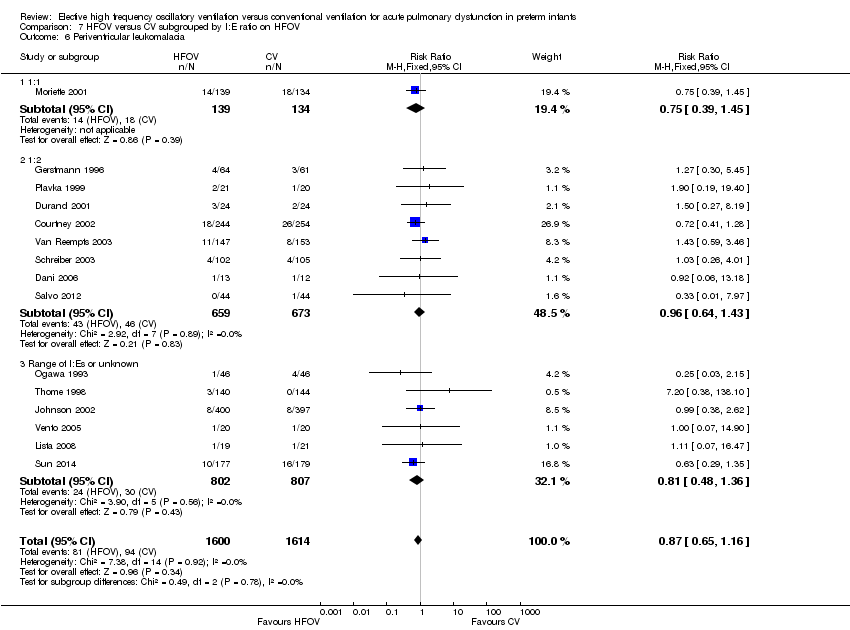
Comparison 7 HFOV versus CV subgrouped by I:E ratio on HFOV, Outcome 6 Periventricular leukomalacia.
| Outcome or subgroup title | No. of studies | No. of participants | Statistical method | Effect size |
| 1 Death by 28 to 30 days Show forest plot | 10 | 2148 | Risk Ratio (M‐H, Fixed, 95% CI) | 1.09 [0.88, 1.34] |
| 2 Mechanical ventilation at 28 to 30 days in survivors Show forest plot | 3 | 767 | Risk Ratio (M‐H, Fixed, 95% CI) | 1.08 [0.86, 1.35] |
| 3 Oxygen at 28 to 30 days in survivors Show forest plot | 6 | 1043 | Risk Ratio (M‐H, Fixed, 95% CI) | 0.98 [0.88, 1.10] |
| 4 CLD at 28 to 30 days (O2 + x‐ray) in survivors Show forest plot | 4 | 820 | Risk Ratio (M‐H, Fixed, 95% CI) | 0.86 [0.74, 1.01] |
| 5 Death or CLD at 28 to 30 days Show forest plot | 5 | 1160 | Risk Ratio (M‐H, Fixed, 95% CI) | 0.94 [0.85, 1.04] |
| 6 Death by 36 to 37 weeks or discharge Show forest plot | 17 | 3329 | Risk Ratio (M‐H, Fixed, 95% CI) | 0.95 [0.81, 1.10] |
| 7 CLD at 36 to 37 weeks PMA or discharge in survivors Show forest plot | 17 | 2786 | Risk Ratio (M‐H, Fixed, 95% CI) | 0.86 [0.78, 0.96] |
| 8 Death or CLD at 36 to 37 weeks PMA or discharge Show forest plot | 17 | 3329 | Risk Ratio (M‐H, Fixed, 95% CI) | 0.90 [0.84, 0.97] |
| 9 Any pulmonary air leak Show forest plot | 13 | 2854 | Risk Ratio (M‐H, Fixed, 95% CI) | 1.19 [1.05, 1.34] |
| 10 Gross pulmonary air leak Show forest plot | 11 | 2185 | Risk Ratio (M‐H, Fixed, 95% CI) | 1.13 [0.88, 1.45] |
| 11 Intraventricular haemorrhage ‐ all grades Show forest plot | 12 | 3084 | Risk Ratio (M‐H, Fixed, 95% CI) | 1.04 [0.95, 1.14] |
| 12 Intraventricular haemorrhage ‐ grades 3 or 4 Show forest plot | 18 | 4069 | Risk Ratio (M‐H, Fixed, 95% CI) | 1.10 [0.95, 1.27] |
| 13 Periventricular leukomalacia Show forest plot | 17 | 3983 | Risk Ratio (M‐H, Fixed, 95% CI) | 1.03 [0.81, 1.31] |
| 14 Retinopathy of prematurity (stage 2 or greater) in survivors Show forest plot | 12 | 2781 | Risk Ratio (M‐H, Fixed, 95% CI) | 0.81 [0.70, 0.93] |
| Outcome or subgroup title | No. of studies | No. of participants | Statistical method | Effect size |
| 1 Death by 36 to 37 weeks or discharge Show forest plot | 17 | 3329 | Risk Ratio (M‐H, Fixed, 95% CI) | 0.95 [0.81, 1.10] |
| 1.1 High volume strategy on HFOV with target FiO2 ≤ 0.30 | 8 | 1755 | Risk Ratio (M‐H, Fixed, 95% CI) | 0.87 [0.71, 1.08] |
| 1.2 High volume strategy on HFOV with target FiO2 > 0.30 or not specified | 8 | 1478 | Risk Ratio (M‐H, Fixed, 95% CI) | 1.02 [0.81, 1.28] |
| 1.3 No high volume strategy on HFOV | 1 | 96 | Risk Ratio (M‐H, Fixed, 95% CI) | 1.36 [0.39, 4.75] |
| 2 CLD at 36 to 37 weeks PMA or discharge in survivors Show forest plot | 17 | 2786 | Risk Ratio (M‐H, Fixed, 95% CI) | 0.86 [0.78, 0.96] |
| 2.1 High volume strategy on HFOV with target FiO2 ≤ 0.30 | 8 | 1483 | Risk Ratio (M‐H, Fixed, 95% CI) | 0.87 [0.76, 0.99] |
| 2.2 High volume strategy on HFOV with target FiO2 > 0.30 or not specified | 8 | 1216 | Risk Ratio (M‐H, Fixed, 95% CI) | 0.86 [0.73, 1.00] |
| 2.3 No high volume strategy of HFOV | 1 | 87 | Risk Ratio (M‐H, Fixed, 95% CI) | 0.0 [0.0, 0.0] |
| 3 Death or CLD at 36 to 37 weeks PMA or discharge Show forest plot | 17 | 3329 | Risk Ratio (M‐H, Fixed, 95% CI) | 0.90 [0.84, 0.97] |
| 3.1 High volume strategy on HFOV with target FiO2 ≤ 0.30 | 8 | 1755 | Risk Ratio (M‐H, Fixed, 95% CI) | 0.89 [0.81, 0.97] |
| 3.2 High volume strategy on HFOV with target FiO2 > 0.30 or not specified | 8 | 1478 | Risk Ratio (M‐H, Fixed, 95% CI) | 0.91 [0.81, 1.02] |
| 3.3 No high volume strategy on HFOV | 1 | 96 | Risk Ratio (M‐H, Fixed, 95% CI) | 1.36 [0.39, 4.75] |
| 4 Gross pulmonary air leak Show forest plot | 11 | 2185 | Risk Ratio (M‐H, Fixed, 95% CI) | 1.13 [0.88, 1.45] |
| 4.1 High volume strategy HFOV with target FiO2 ≤ 0.30 | 4 | 705 | Risk Ratio (M‐H, Fixed, 95% CI) | 0.96 [0.61, 1.51] |
| 4.2 High volume strategy on HFOV with target FiO2 > 0.30 or not specified | 6 | 1384 | Risk Ratio (M‐H, Fixed, 95% CI) | 1.26 [0.93, 1.71] |
| 4.3 No high volume strategy on HFOV | 1 | 96 | Risk Ratio (M‐H, Fixed, 95% CI) | 0.65 [0.17, 2.58] |
| 5 Intraventricular haemorrhage ‐ grades 3 or 4 Show forest plot | 18 | 4069 | Risk Ratio (M‐H, Fixed, 95% CI) | 1.10 [0.95, 1.27] |
| 5.1 High volume strategy on HFOV with target FiO2 ≤ 0.30 | 7 | 1730 | Risk Ratio (M‐H, Fixed, 95% CI) | 0.84 [0.65, 1.08] |
| 5.2 High volume strategy on HFOV with target FiO2 > 0.30 or not specified | 9 | 1570 | Risk Ratio (M‐H, Fixed, 95% CI) | 1.17 [0.92, 1.48] |
| 5.3 No high volume strategy on HFOV | 2 | 769 | Risk Ratio (M‐H, Fixed, 95% CI) | 1.45 [1.09, 1.93] |
| 6 Periventricular leukomalacia Show forest plot | 17 | 3983 | Risk Ratio (M‐H, Fixed, 95% CI) | 1.03 [0.81, 1.31] |
| 6.1 High volume strategy on HFOV with target FiO2 ≤ 0.30 | 8 | 1755 | Risk Ratio (M‐H, Fixed, 95% CI) | 0.91 [0.55, 1.48] |
| 6.2 High volume strategy with target FiO2 > 0.30 or not specified | 7 | 1459 | Risk Ratio (M‐H, Fixed, 95% CI) | 0.85 [0.60, 1.21] |
| 6.3 No high volume strategy on HFOV | 2 | 769 | Risk Ratio (M‐H, Fixed, 95% CI) | 1.64 [1.02, 2.64] |
| Outcome or subgroup title | No. of studies | No. of participants | Statistical method | Effect size |
| 1 Death by 36 to 37 weeks or discharge Show forest plot | 16 | 3233 | Risk Ratio (M‐H, Fixed, 95% CI) | 0.94 [0.80, 1.10] |
| 1.1 Routine surfactant | 15 | 3168 | Risk Ratio (M‐H, Fixed, 95% CI) | 0.94 [0.80, 1.10] |
| 1.2 No routine surfactant | 1 | 65 | Risk Ratio (M‐H, Fixed, 95% CI) | 1.01 [0.40, 2.58] |
| 2 CLD at 36 to 37 weeks PMA or discharge in survivors Show forest plot | 16 | 2699 | Risk Ratio (M‐H, Fixed, 95% CI) | 0.86 [0.78, 0.96] |
| 2.1 Routine surfactant | 15 | 2648 | Risk Ratio (M‐H, Fixed, 95% CI) | 0.88 [0.80, 0.97] |
| 2.2 No routine surfactant | 1 | 51 | Risk Ratio (M‐H, Fixed, 95% CI) | 0.23 [0.07, 0.73] |
| 3 Death or CLD at 36 to 37 weeks PMA or discharge Show forest plot | 16 | 3233 | Risk Ratio (M‐H, Fixed, 95% CI) | 0.90 [0.83, 0.97] |
| 3.1 Routine surfactant | 15 | 3168 | Risk Ratio (M‐H, Fixed, 95% CI) | 0.91 [0.84, 0.98] |
| 3.2 No routine surfactant | 1 | 65 | Risk Ratio (M‐H, Fixed, 95% CI) | 0.52 [0.29, 0.94] |
| 4 Gross pulmonary air leak Show forest plot | 10 | 2089 | Risk Ratio (M‐H, Fixed, 95% CI) | 1.15 [0.90, 1.49] |
| 4.1 Routine surfactant | 9 | 2024 | Risk Ratio (M‐H, Fixed, 95% CI) | 1.14 [0.87, 1.49] |
| 4.2 No routine surfactant | 1 | 65 | Risk Ratio (M‐H, Fixed, 95% CI) | 1.32 [0.65, 2.71] |
| 5 Intraventricular haemorrhage ‐ grades 3 or 4 Show forest plot | 16 | 3300 | Risk Ratio (M‐H, Fixed, 95% CI) | 1.00 [0.84, 1.19] |
| 5.1 Routine surfactant | 15 | 3235 | Risk Ratio (M‐H, Fixed, 95% CI) | 1.00 [0.84, 1.19] |
| 5.2 No routine surfactant | 1 | 65 | Risk Ratio (M‐H, Fixed, 95% CI) | 0.88 [0.33, 2.34] |
| 6 Periventricular leukomalacia Show forest plot | 15 | 3214 | Risk Ratio (M‐H, Fixed, 95% CI) | 0.87 [0.65, 1.16] |
| 6.1 Routine surfactant | 15 | 3214 | Risk Ratio (M‐H, Fixed, 95% CI) | 0.87 [0.65, 1.16] |
| 6.2 No routine surfactant | 0 | 0 | Risk Ratio (M‐H, Fixed, 95% CI) | 0.0 [0.0, 0.0] |
| Outcome or subgroup title | No. of studies | No. of participants | Statistical method | Effect size |
| 1 Death by 36 to 37 weeks or discharge Show forest plot | 16 | 3233 | Risk Ratio (M‐H, Fixed, 95% CI) | 0.94 [0.80, 1.10] |
| 1.1 Flow interrupter | 4 | 410 | Risk Ratio (M‐H, Fixed, 95% CI) | 0.94 [0.52, 1.69] |
| 1.2 HF oscillator | 11 | 2026 | Risk Ratio (M‐H, Fixed, 95% CI) | 0.93 [0.75, 1.16] |
| 1.3 Both HF oscillation and flow interruptors | 1 | 797 | Risk Ratio (M‐H, Fixed, 95% CI) | 0.95 [0.75, 1.20] |
| 2 CLD at 36 to 37 weeks PMA or discharge in survivors Show forest plot | 16 | 2699 | Risk Ratio (M‐H, Fixed, 95% CI) | 0.86 [0.78, 0.96] |
| 2.1 Flow interrupter | 4 | 370 | Risk Ratio (M‐H, Fixed, 95% CI) | 0.96 [0.70, 1.32] |
| 2.2 HF oscillator | 11 | 1737 | Risk Ratio (M‐H, Fixed, 95% CI) | 0.77 [0.67, 0.90] |
| 2.3 Both HF oscillators and flow interrupters | 1 | 592 | Risk Ratio (M‐H, Fixed, 95% CI) | 0.99 [0.85, 1.14] |
| 3 Death or CLD at 36 to 37 weeks PMA or discharge Show forest plot | 16 | 3233 | Risk Ratio (M‐H, Fixed, 95% CI) | 0.90 [0.83, 0.97] |
| 3.1 HF flow interrupter | 4 | 410 | Risk Ratio (M‐H, Fixed, 95% CI) | 0.96 [0.74, 1.24] |
| 3.2 HF oscillation | 11 | 2026 | Risk Ratio (M‐H, Fixed, 95% CI) | 0.83 [0.74, 0.93] |
| 3.3 Both HF oscillators and HF flow interrupters | 1 | 797 | Risk Ratio (M‐H, Fixed, 95% CI) | 0.98 [0.89, 1.08] |
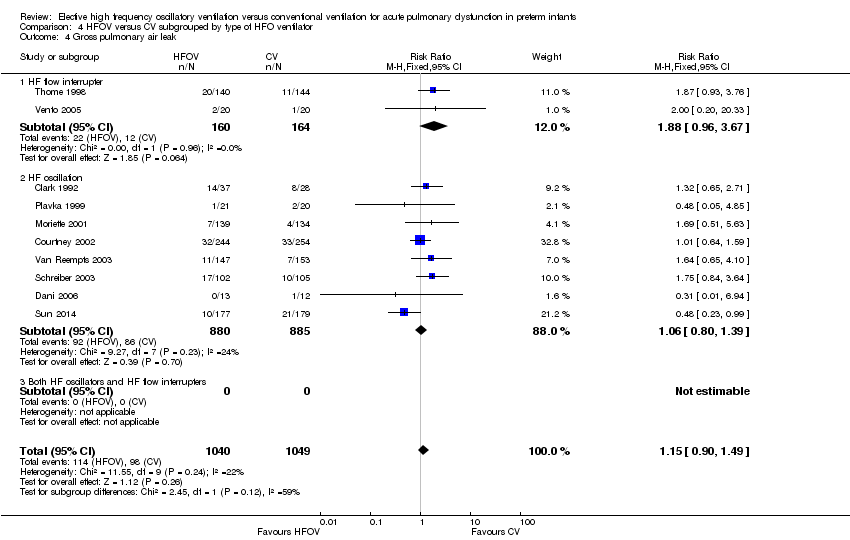
| 4 Gross pulmonary air leak Show forest plot | 10 | 2089 | Risk Ratio (M‐H, Fixed, 95% CI) | 1.15 [0.90, 1.49] |
| 4.1 HF flow interrupter | 2 | 324 | Risk Ratio (M‐H, Fixed, 95% CI) | 1.88 [0.96, 3.67] |
| 4.2 HF oscillation | 8 | 1765 | Risk Ratio (M‐H, Fixed, 95% CI) | 1.06 [0.80, 1.39] |
| 4.3 Both HF oscillators and HF flow interrupters | 0 | 0 | Risk Ratio (M‐H, Fixed, 95% CI) | 0.0 [0.0, 0.0] |
| 5 Intraventricular haemorrhage ‐ grades 3 or 4 Show forest plot | 16 | 3300 | Risk Ratio (M‐H, Fixed, 95% CI) | 1.00 [0.84, 1.19] |
| 5.1 HF flow interrupter | 4 | 410 | Risk Ratio (M‐H, Fixed, 95% CI) | 1.08 [0.65, 1.78] |
| 5.2 HF oscillator | 11 | 2093 | Risk Ratio (M‐H, Fixed, 95% CI) | 1.11 [0.90, 1.36] |
| 5.3 Both HF oscillators and HF flow interrupters | 1 | 797 | Risk Ratio (M‐H, Fixed, 95% CI) | 0.69 [0.46, 1.01] |
| 6 Periventricular leukomalacia Show forest plot | 16 | 3216 | Risk Ratio (M‐H, Fixed, 95% CI) | 0.87 [0.65, 1.16] |
| 6.1 HF flow interrupter | 3 | 364 | Risk Ratio (M‐H, Fixed, 95% CI) | 2.29 [0.52, 10.04] |
| 6.2 HF oscillator | 12 | 2055 | Risk Ratio (M‐H, Fixed, 95% CI) | 0.82 [0.60, 1.11] |
| 6.3 Both HF oscillators and HF flow interrupters | 1 | 797 | Risk Ratio (M‐H, Fixed, 95% CI) | 0.99 [0.38, 2.62] |
| Outcome or subgroup title | No. of studies | No. of participants | Statistical method | Effect size |
| 1 Death by 36 to 37 weeks or discharge Show forest plot | 16 | 3233 | Risk Ratio (M‐H, Fixed, 95% CI) | 0.94 [0.80, 1.10] |
| 1.1 Definitive LPS on CV | 9 | 1679 | Risk Ratio (M‐H, Fixed, 95% CI) | 0.91 [0.70, 1.18] |
| 1.2 Probable LPS on CV | 3 | 1116 | Risk Ratio (M‐H, Fixed, 95% CI) | 0.98 [0.80, 1.21] |
| 1.3 Probably no LPS on CV | 2 | 248 | Risk Ratio (M‐H, Fixed, 95% CI) | 0.89 [0.52, 1.53] |
| 1.4 Definitively no LPS on CV | 2 | 190 | Risk Ratio (M‐H, Fixed, 95% CI) | 0.79 [0.33, 1.88] |
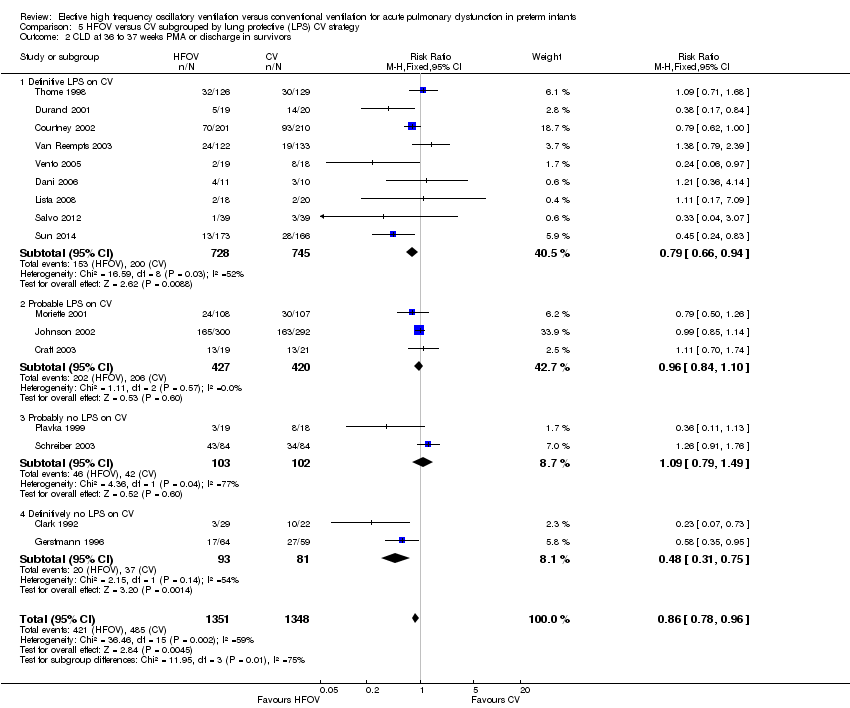
| 2 CLD at 36 to 37 weeks PMA or discharge in survivors Show forest plot | 16 | 2699 | Risk Ratio (M‐H, Fixed, 95% CI) | 0.86 [0.78, 0.96] |
| 2.1 Definitive LPS on CV | 9 | 1473 | Risk Ratio (M‐H, Fixed, 95% CI) | 0.79 [0.66, 0.94] |
| 2.2 Probable LPS on CV | 3 | 847 | Risk Ratio (M‐H, Fixed, 95% CI) | 0.96 [0.84, 1.10] |
| 2.3 Probably no LPS on CV | 2 | 205 | Risk Ratio (M‐H, Fixed, 95% CI) | 1.09 [0.79, 1.49] |
| 2.4 Definitively no LPS on CV | 2 | 174 | Risk Ratio (M‐H, Fixed, 95% CI) | 0.48 [0.31, 0.75] |
| 3 Death or CLD at 36 to 37 weeks PMA or discharge Show forest plot | 16 | 3235 | Risk Ratio (M‐H, Fixed, 95% CI) | 0.90 [0.83, 0.96] |
| 3.1 Definitive LPS on CV | 9 | 1679 | Risk Ratio (M‐H, Fixed, 95% CI) | 0.83 [0.72, 0.95] |
| 3.2 Probable LPS on CV | 3 | 1118 | Risk Ratio (M‐H, Fixed, 95% CI) | 0.97 [0.89, 1.07] |
| 3.3 Probably no LPS on CV | 2 | 248 | Risk Ratio (M‐H, Fixed, 95% CI) | 1.04 [0.82, 1.31] |
| 3.4 Definitively no LPS on CV | 2 | 190 | Risk Ratio (M‐H, Fixed, 95% CI) | 0.56 [0.38, 0.81] |
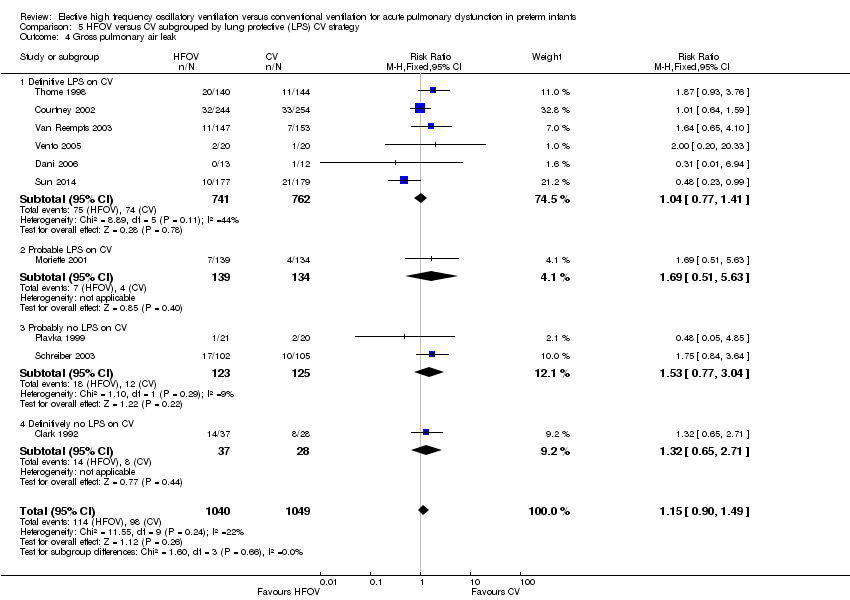
| 4 Gross pulmonary air leak Show forest plot | 10 | 2089 | Risk Ratio (M‐H, Fixed, 95% CI) | 1.15 [0.90, 1.49] |
| 4.1 Definitive LPS on CV | 6 | 1503 | Risk Ratio (M‐H, Fixed, 95% CI) | 1.04 [0.77, 1.41] |
| 4.2 Probable LPS on CV | 1 | 273 | Risk Ratio (M‐H, Fixed, 95% CI) | 1.69 [0.51, 5.63] |
| 4.3 Probably no LPS on CV | 2 | 248 | Risk Ratio (M‐H, Fixed, 95% CI) | 1.53 [0.77, 3.04] |
| 4.4 Definitively no LPS on CV | 1 | 65 | Risk Ratio (M‐H, Fixed, 95% CI) | 1.32 [0.65, 2.71] |
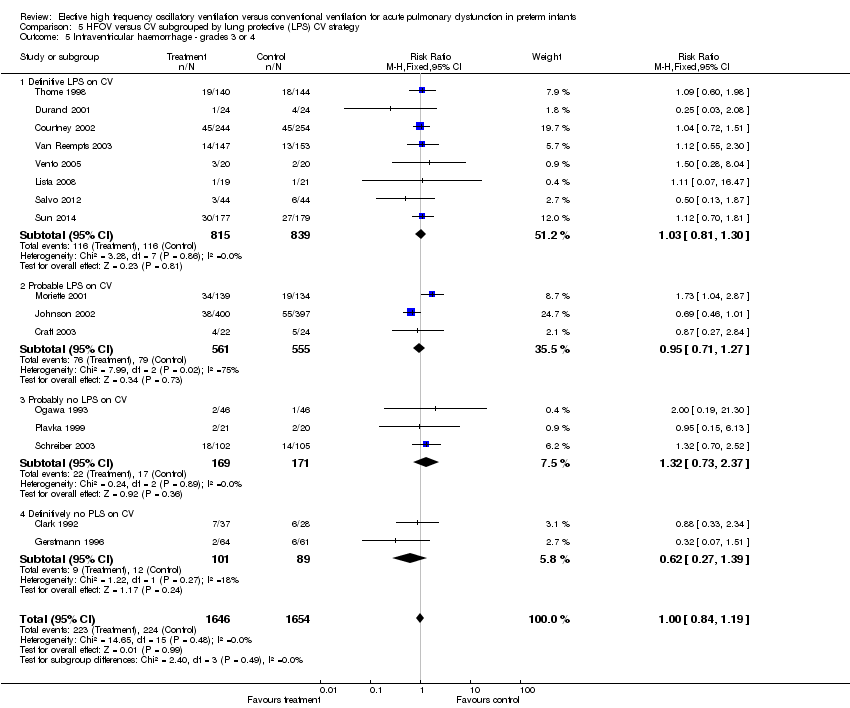
| 5 Intraventricular haemorrhage ‐ grades 3 or 4 Show forest plot | 16 | 3300 | Risk Ratio (M‐H, Fixed, 95% CI) | 1.00 [0.84, 1.19] |
| 5.1 Definitive LPS on CV | 8 | 1654 | Risk Ratio (M‐H, Fixed, 95% CI) | 1.03 [0.81, 1.30] |
| 5.2 Probable LPS on CV | 3 | 1116 | Risk Ratio (M‐H, Fixed, 95% CI) | 0.95 [0.71, 1.27] |
| 5.3 Probably no LPS on CV | 3 | 340 | Risk Ratio (M‐H, Fixed, 95% CI) | 1.32 [0.73, 2.37] |
| 5.4 Definitively no PLS on CV | 2 | 190 | Risk Ratio (M‐H, Fixed, 95% CI) | 0.62 [0.27, 1.39] |
| 6 Periventricular leukomalacia Show forest plot | 15 | 3214 | Risk Ratio (M‐H, Fixed, 95% CI) | 0.87 [0.65, 1.16] |
| 6.1 Definitive LPS on CV | 9 | 1679 | Risk Ratio (M‐H, Fixed, 95% CI) | 0.88 [0.61, 1.28] |
| 6.2 Probable LPS on CV | 2 | 1070 | Risk Ratio (M‐H, Fixed, 95% CI) | 0.82 [0.48, 1.42] |
| 6.3 Probably no LPS on CV | 3 | 340 | Risk Ratio (M‐H, Fixed, 95% CI) | 0.78 [0.30, 2.06] |
| 6.4 Definitively no LPS on CV | 1 | 125 | Risk Ratio (M‐H, Fixed, 95% CI) | 1.27 [0.30, 5.45] |
| Outcome or subgroup title | No. of studies | No. of participants | Statistical method | Effect size |
| 1 Death by 36 to 37 weeks or discharge Show forest plot | 14 | 2887 | Risk Ratio (M‐H, Fixed, 95% CI) | 0.91 [0.78, 1.07] |
| 1.1 Less than 2 hours | 7 | 1315 | Risk Ratio (M‐H, Fixed, 95% CI) | 0.95 [0.77, 1.18] |
| 1.2 2 to 6 hours | 5 | 1300 | Risk Ratio (M‐H, Fixed, 95% CI) | 0.85 [0.64, 1.14] |
| 1.3 Greater than 6 hours | 2 | 272 | Risk Ratio (M‐H, Fixed, 95% CI) | 0.91 [0.56, 1.48] |
| 2 CLD at 36 to 37 weeks PMA or discharge in survivors Show forest plot | 14 | 2404 | Risk Ratio (M‐H, Fixed, 95% CI) | 0.84 [0.75, 0.93] |
| 2.1 Less than 2 hours | 7 | 1058 | Risk Ratio (M‐H, Fixed, 95% CI) | 0.94 [0.82, 1.08] |
| 2.2 2 to 6 hours | 5 | 1127 | Risk Ratio (M‐H, Fixed, 95% CI) | 0.68 [0.56, 0.81] |
| 2.3 Greater than 6 hours | 2 | 219 | Risk Ratio (M‐H, Fixed, 95% CI) | 1.00 [0.74, 1.37] |
| 3 Death or CLD at 36 to 37 weeks PMA or discharge Show forest plot | 14 | 2887 | Risk Ratio (M‐H, Fixed, 95% CI) | 0.87 [0.81, 0.94] |
| 3.1 Less than 2 hours | 7 | 1315 | Risk Ratio (M‐H, Fixed, 95% CI) | 0.95 [0.87, 1.05] |
| 3.2 2‐6 hours | 5 | 1300 | Risk Ratio (M‐H, Fixed, 95% CI) | 0.74 [0.64, 0.85] |
| 3.3 Greater than 6 hours | 2 | 272 | Risk Ratio (M‐H, Fixed, 95% CI) | 0.99 [0.79, 1.23] |
| 4 Gross pulmonary air leak Show forest plot | 9 | 1789 | Risk Ratio (M‐H, Fixed, 95% CI) | 1.12 [0.86, 1.46] |
| 4.1 Less than 2 hours | 4 | 390 | Risk Ratio (M‐H, Fixed, 95% CI) | 1.54 [0.84, 2.82] |
| 4.2 2 ‐ 6 hours | 3 | 1127 | Risk Ratio (M‐H, Fixed, 95% CI) | 0.87 [0.60, 1.24] |
| 4.3 Greater than 6 hours | 2 | 272 | Risk Ratio (M‐H, Fixed, 95% CI) | 1.55 [0.92, 2.59] |
| 5 Intraventricular haemorrhage ‐ grades 3 or 4 Show forest plot | 15 | 3050 | Risk Ratio (M‐H, Fixed, 95% CI) | 1.01 [0.85, 1.21] |
| 5.1 less than 2 hours | 7 | 1382 | Risk Ratio (M‐H, Fixed, 95% CI) | 0.80 [0.59, 1.08] |
| 5.2 2 ‐ 6 hours | 6 | 1396 | Risk Ratio (M‐H, Fixed, 95% CI) | 1.15 [0.90, 1.46] |
| 5.3 Greater than 6 hours | 2 | 272 | Risk Ratio (M‐H, Fixed, 95% CI) | 1.18 [0.69, 2.01] |
| 6 Periventricular leukomalacia Show forest plot | 15 | 2916 | Risk Ratio (M‐H, Fixed, 95% CI) | 0.82 [0.61, 1.11] |
| 6.1 Less than 2 hours | 8 | 1407 | Risk Ratio (M‐H, Fixed, 95% CI) | 1.00 [0.52, 1.90] |
| 6.2 2 ‐ 6 hours | 5 | 1300 | Risk Ratio (M‐H, Fixed, 95% CI) | 0.76 [0.53, 1.08] |
| 6.3 Greater than 6 hours | 2 | 209 | Risk Ratio (M‐H, Fixed, 95% CI) | 1.03 [0.26, 4.01] |
| Outcome or subgroup title | No. of studies | No. of participants | Statistical method | Effect size |
| 1 Death by 36 to 37 weeks or discharge Show forest plot | 16 | 3233 | Risk Ratio (M‐H, Fixed, 95% CI) | 0.94 [0.80, 1.10] |
| 1.1 1:1 | 1 | 273 | Risk Ratio (M‐H, Fixed, 95% CI) | 1.11 [0.70, 1.75] |
| 1.2 1:2 | 9 | 1397 | Risk Ratio (M‐H, Fixed, 95% CI) | 0.97 [0.75, 1.25] |
| 1.3 Range of I:Es or unknown | 6 | 1563 | Risk Ratio (M‐H, Fixed, 95% CI) | 0.89 [0.71, 1.10] |
| 2 CLD at 36 to 37 weeks PMA or discharge in survivors Show forest plot | 16 | 2699 | Risk Ratio (M‐H, Fixed, 99% CI) | 0.86 [0.76, 0.99] |
| 2.1 1:1 | 1 | 215 | Risk Ratio (M‐H, Fixed, 99% CI) | 0.79 [0.43, 1.46] |
| 2.2 1:2 | 9 | 1183 | Risk Ratio (M‐H, Fixed, 99% CI) | 0.81 [0.66, 1.01] |
| 2.3 Range of I:Es or unknown | 6 | 1301 | Risk Ratio (M‐H, Fixed, 99% CI) | 0.92 [0.77, 1.09] |
| 3 Death or CLD at 36 to 37 weeks PMA or discharge Show forest plot | 16 | 3233 | Risk Ratio (M‐H, Fixed, 95% CI) | 0.90 [0.83, 0.97] |
| 3.1 1:1 | 1 | 273 | Risk Ratio (M‐H, Fixed, 95% CI) | 0.93 [0.70, 1.24] |
| 3.2 1:2 | 9 | 1397 | Risk Ratio (M‐H, Fixed, 95% CI) | 0.87 [0.77, 0.98] |
| 3.3 Range of I:Es or unknown | 6 | 1563 | Risk Ratio (M‐H, Fixed, 95% CI) | 0.92 [0.83, 1.01] |
| 4 Gross pulmonary air leak Show forest plot | 11 | 2185 | Risk Ratio (M‐H, Fixed, 95% CI) | 1.13 [0.88, 1.45] |
| 4.1 1:1 | 1 | 273 | Risk Ratio (M‐H, Fixed, 95% CI) | 1.69 [0.51, 5.63] |
| 4.2 1:2 | 7 | 1232 | Risk Ratio (M‐H, Fixed, 95% CI) | 1.17 [0.86, 1.58] |
| 4.3 Range of I:Es or unknown | 3 | 680 | Risk Ratio (M‐H, Fixed, 95% CI) | 0.99 [0.62, 1.57] |
| 5 Intraventricular haemorrhage ‐ grades 3 or 4 Show forest plot | 15 | 3259 | Risk Ratio (M‐H, Fixed, 95% CI) | 1.00 [0.84, 1.19] |
| 5.1 1:1 | 1 | 273 | Risk Ratio (M‐H, Fixed, 95% CI) | 1.73 [1.04, 2.87] |
| 5.2 1:2 | 7 | 1331 | Risk Ratio (M‐H, Fixed, 95% CI) | 0.97 [0.74, 1.26] |
| 5.3 Range of I:Es or unknown | 7 | 1655 | Risk Ratio (M‐H, Fixed, 95% CI) | 0.90 [0.70, 1.16] |
| 6 Periventricular leukomalacia Show forest plot | 15 | 3214 | Risk Ratio (M‐H, Fixed, 95% CI) | 0.87 [0.65, 1.16] |
| 6.1 1:1 | 1 | 273 | Risk Ratio (M‐H, Fixed, 95% CI) | 0.75 [0.39, 1.45] |
| 6.2 1:2 | 8 | 1332 | Risk Ratio (M‐H, Fixed, 95% CI) | 0.96 [0.64, 1.43] |
| 6.3 Range of I:Es or unknown | 6 | 1609 | Risk Ratio (M‐H, Fixed, 95% CI) | 0.81 [0.48, 1.36] |