| 1 Service utilisation: 1. Hospital admission Show forest plot | 14 | | Risk Ratio (M‐H, Fixed, 95% CI) | Subtotals only |
|
| 1.1 0‐6 months | 3 | 232 | Risk Ratio (M‐H, Fixed, 95% CI) | 0.85 [0.44, 1.66] |
| 1.2 7‐12 months | 9 | 532 | Risk Ratio (M‐H, Fixed, 95% CI) | 0.78 [0.63, 0.98] |
| 1.3 13‐18 months | 3 | 228 | Risk Ratio (M‐H, Fixed, 95% CI) | 0.46 [0.30, 0.69] |
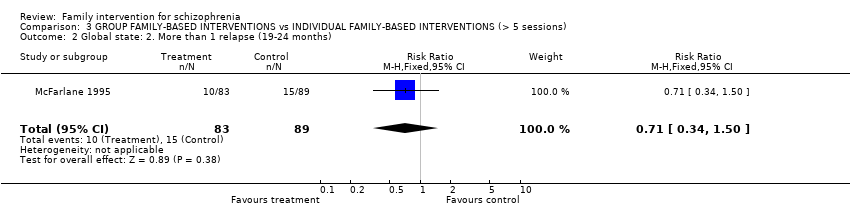
| 1.4 19‐24 months | 5 | 375 | Risk Ratio (M‐H, Fixed, 95% CI) | 0.83 [0.65, 1.07] |
| 1.5 25‐36 months | 2 | 205 | Risk Ratio (M‐H, Fixed, 95% CI) | 0.91 [0.72, 1.16] |
| 2 Service utilisation: 2. Days in hospital at 3 months Show forest plot | 1 | 48 | Mean Difference (IV, Fixed, 95% CI) | ‐6.67 [‐11.59, ‐1.75] |
|
| 3 Service utilisation: 3. Days in hospital at 1 year (skewed data) Show forest plot | | | Other data | No numeric data |
|
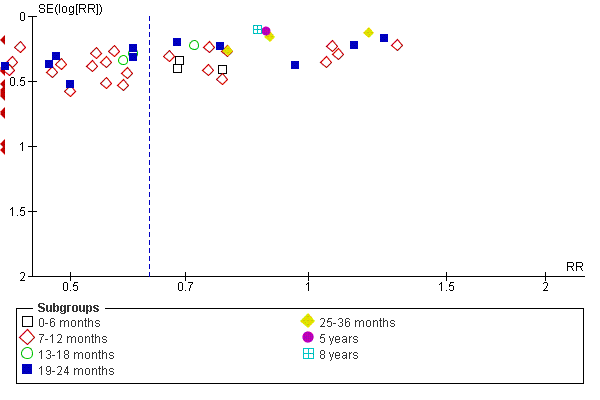
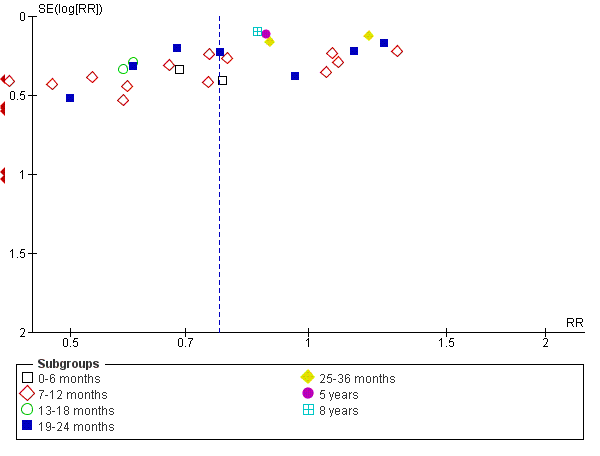
| 4 Global state: 1. Relapse Show forest plot | 36 | | Risk Ratio (M‐H, Fixed, 95% CI) | Subtotals only |
|
| 4.1 0‐6 months | 3 | 213 | Risk Ratio (M‐H, Fixed, 95% CI) | 0.71 [0.46, 1.09] |
| 4.2 7‐12 months | 32 | 2981 | Risk Ratio (M‐H, Fixed, 95% CI) | 0.55 [0.48, 0.62] |
| 4.3 13‐18 months | 3 | 181 | Risk Ratio (M‐H, Fixed, 95% CI) | 0.64 [0.47, 0.88] |
| 4.4 19‐24 months | 13 | 1019 | Risk Ratio (M‐H, Fixed, 95% CI) | 0.64 [0.55, 0.75] |
| 4.5 25‐36 months | 4 | 497 | Risk Ratio (M‐H, Fixed, 95% CI) | 0.89 [0.72, 1.10] |
| 4.6 5 years | 1 | 63 | Risk Ratio (M‐H, Fixed, 95% CI) | 0.88 [0.70, 1.11] |
| 4.7 8 years | 1 | 62 | Risk Ratio (M‐H, Fixed, 95% CI) | 0.86 [0.71, 1.05] |
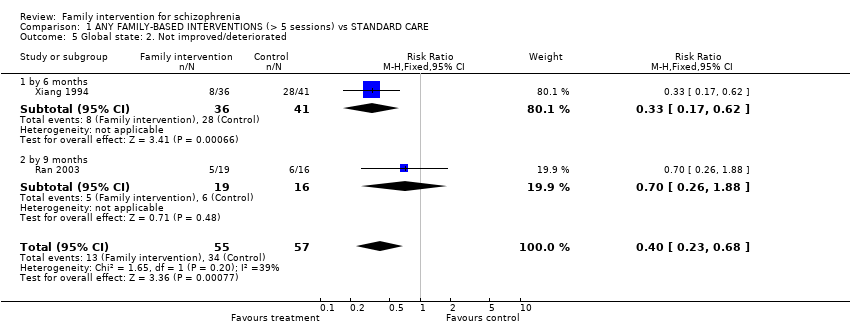
| 5 Global state: 2. Not improved/deteriorated Show forest plot | 2 | 112 | Risk Ratio (M‐H, Fixed, 95% CI) | 0.40 [0.23, 0.68] |
|
| 5.1 by 6 months | 1 | 77 | Risk Ratio (M‐H, Fixed, 95% CI) | 0.33 [0.17, 0.62] |
| 5.2 by 9 months | 1 | 35 | Risk Ratio (M‐H, Fixed, 95% CI) | 0.70 [0.26, 1.88] |
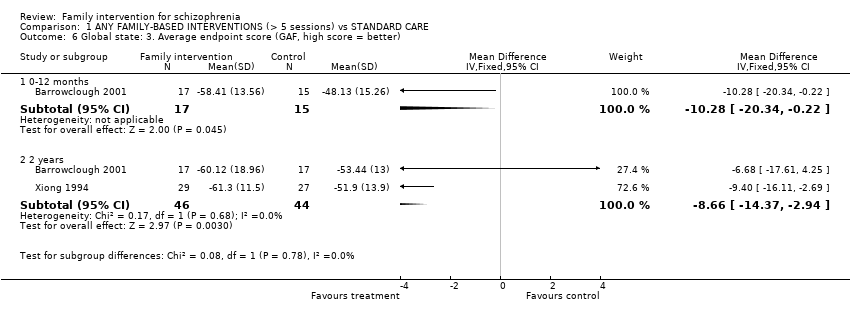
| 6 Global state: 3. Average endpoint score (GAF, high score = better) Show forest plot | 2 | | Mean Difference (IV, Fixed, 95% CI) | Subtotals only |
|
| 6.1 0‐12 months | 1 | 32 | Mean Difference (IV, Fixed, 95% CI) | ‐10.28 [‐20.34, ‐0.22] |
| 6.2 2 years | 2 | 90 | Mean Difference (IV, Fixed, 95% CI) | ‐8.66 [‐14.37, ‐2.94] |
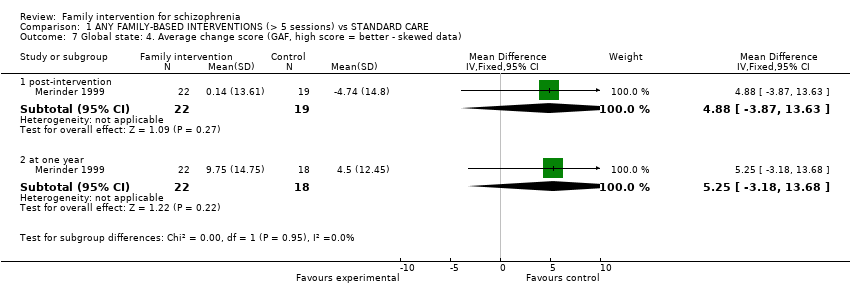
| 7 Global state: 4. Average change score (GAF, high score = better ‐ skewed data) Show forest plot | 1 | | Mean Difference (IV, Fixed, 95% CI) | Subtotals only |
|
| 7.1 post‐intervention | 1 | 41 | Mean Difference (IV, Fixed, 95% CI) | 4.88 [‐3.87, 13.63] |
| 7.2 at one year | 1 | 40 | Mean Difference (IV, Fixed, 95% CI) | 5.25 [‐3.18, 13.68] |
| 8 Global state: 5. Average endpoint score at 2 years (SCL‐90, high score = poor) Show forest plot | 1 | 80 | Mean Difference (IV, Fixed, 95% CI) | ‐22.01 [‐30.99, ‐13.03] |
|
| 9 Mental state: 1a. Average endpoint score (BPRS, high score = poor) Show forest plot | 4 | | Mean Difference (IV, Fixed, 95% CI) | Subtotals only |
|
| 9.1 total score at 1 year | 3 | 170 | Mean Difference (IV, Fixed, 95% CI) | ‐8.32 [‐10.92, ‐5.73] |
| 9.2 negative score at 6 months | 1 | 62 | Mean Difference (IV, Fixed, 95% CI) | ‐0.30 [‐0.90, 0.30] |
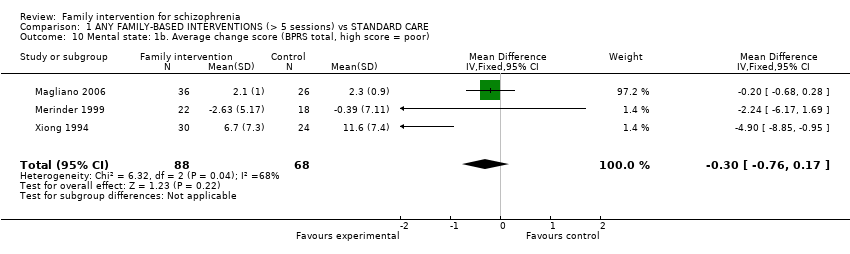
| 10 Mental state: 1b. Average change score (BPRS total, high score = poor) Show forest plot | 3 | 156 | Mean Difference (IV, Fixed, 95% CI) | ‐0.30 [‐0.76, 0.17] |
|
| 11 Mental state: 1c. Average change score (BPRS positive, high score = poor) Show forest plot | 1 | | Mean Difference (IV, Fixed, 95% CI) | Subtotals only |
|
| 11.1 post intervention 8 sessions | 1 | 41 | Mean Difference (IV, Fixed, 95% CI) | ‐2.72 [‐7.10, 1.66] |
| 12 Mental state: 2a. Average endpoint score (PANSS, 1 year, high score = poor) Show forest plot | 2 | | Mean Difference (IV, Fixed, 95% CI) | Subtotals only |
|
| 12.1 total | 2 | 174 | Mean Difference (IV, Fixed, 95% CI) | ‐7.90 [‐11.96, ‐3.83] |
| 12.2 positive subscore | 1 | 32 | Mean Difference (IV, Fixed, 95% CI) | ‐2.72 [‐6.27, 0.83] |
| 12.3 negative subscore | 1 | 32 | Mean Difference (IV, Fixed, 95% CI) | ‐2.02 [‐5.88, 1.84] |
| 12.4 general psychopathology | 1 | 142 | Mean Difference (IV, Fixed, 95% CI) | ‐3.60 [‐5.82, ‐1.38] |
| 13 Mental state: 2b. Average endpoint score (PANSS, 18 months, high score = poor) Show forest plot | 1 | | Mean Difference (IV, Fixed, 95% CI) | Subtotals only |
|
| 13.1 total | 1 | 29 | Mean Difference (IV, Fixed, 95% CI) | ‐6.30 [‐15.98, 3.38] |
| 13.2 positive subscore | 1 | 29 | Mean Difference (IV, Fixed, 95% CI) | 0.94 [‐2.16, 4.04] |
| 13.3 negative subscore | 1 | 29 | Mean Difference (IV, Fixed, 95% CI) | ‐5.23 [‐8.43, ‐2.03] |
| 14 Mental state: 2c. Average endpoint score (PANSS, 36 months, high score = poor) Show forest plot | 1 | | Mean Difference (IV, Fixed, 95% CI) | Subtotals only |
|
| 14.1 total | 1 | 149 | Mean Difference (IV, Fixed, 95% CI) | ‐10.20 [‐13.55, ‐6.85] |
| 14.2 positive subscore | 1 | 149 | Mean Difference (IV, Fixed, 95% CI) | ‐2.60 [‐4.12, ‐1.08] |
| 14.3 negative subscore | 1 | 149 | Mean Difference (IV, Fixed, 95% CI) | ‐3.70 [‐4.94, ‐2.46] |
| 15 Mental state: 2d. Average change score (PANSS, high score = worse) Show forest plot | 1 | | Mean Difference (IV, Fixed, 95% CI) | Subtotals only |
|
| 15.1 positive | 1 | 142 | Mean Difference (IV, Fixed, 95% CI) | ‐2.0 [‐3.49, ‐0.51] |
| 15.2 negative | 1 | 142 | Mean Difference (IV, Fixed, 95% CI) | ‐4.0 [‐5.81, ‐2.19] |
| 16 Mental state: 3. Average endpoint score (Positive and Negative Symptoms, skewed data) Show forest plot | | | Other data | No numeric data |
|
| 16.1 Scale for Assessment of Positive Symptoms (Chinese version) at 18 months | | | Other data | No numeric data |
| 16.2 Scale for Assessment of Negative Symptoms (Chinese version) at 18 months | | | Other data | No numeric data |
| 17 Mental state: 4. Average endpoint score (SANS high score = worse, skewed) Show forest plot | | | Other data | No numeric data |
|
| 18 Mental state: 5. Average change in insight (Insight Scale, high score = poor) Show forest plot | 1 | | Mean Difference (IV, Fixed, 95% CI) | Subtotals only |
|
| 18.1 post intervention ‐ 8 sessions | 1 | 37 | Mean Difference (IV, Fixed, 95% CI) | 0.02 [‐1.03, 1.07] |
| 18.2 at 1 year | 1 | 40 | Mean Difference (IV, Fixed, 95% CI) | 0.94 [‐0.50, 2.38] |
| 19 Mental state: 6. Average endpoint score (Frankfurt (FBF‐3 scale) 1 year, high score = poor, skewed data) Show forest plot | | | Other data | No numeric data |
|
| 20 Behaviour: 1. Average endpoint score (NOSIE, 1 year, high score = poor) Show forest plot | 1 | | Mean Difference (IV, Fixed, 95% CI) | Subtotals only |
|
| 20.1 total score | 1 | 142 | Mean Difference (IV, Fixed, 95% CI) | 59.10 [54.57, 63.63] |
| 20.2 positive factor score | 1 | 142 | Mean Difference (IV, Fixed, 95% CI) | 33.4 [30.52, 36.28] |
| 21 Behaviour: 2. Average endpoint score (NOSIE negative factor, 1 year, high score = poor) Show forest plot | | | Other data | No numeric data |
|
| 22 Compliance: 1. Leaving the study early Show forest plot | 28 | | Risk Ratio (M‐H, Fixed, 95% CI) | Subtotals only |
|
| 22.1 by between 3 and 6 months | 7 | 552 | Risk Ratio (M‐H, Fixed, 95% CI) | 0.92 [0.59, 1.42] |
| 22.2 by between 7 months and 1 year | 10 | 733 | Risk Ratio (M‐H, Fixed, 95% CI) | 0.74 [0.53, 1.03] |
| 22.3 by between 13 months and 2 years | 10 | 887 | Risk Ratio (M‐H, Fixed, 95% CI) | 0.74 [0.55, 1.00] |
| 22.4 by between 25 months and 3 years | 3 | 290 | Risk Ratio (M‐H, Fixed, 95% CI) | 0.42 [0.26, 0.67] |
| 22.5 by more than 3 years | 1 | 63 | Risk Ratio (M‐H, Fixed, 95% CI) | 1.72 [0.71, 4.16] |
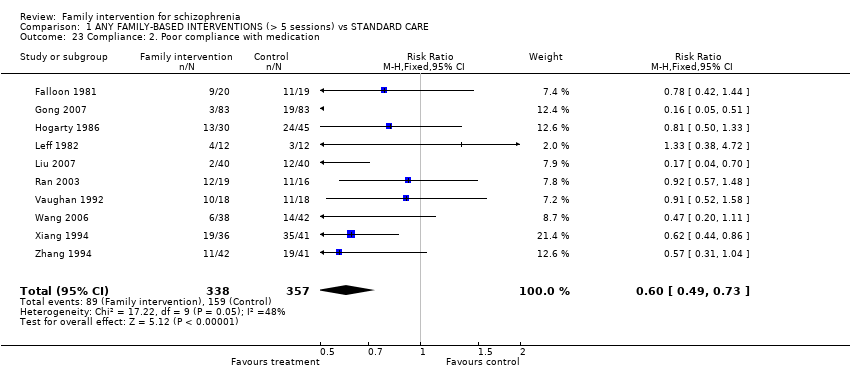
| 23 Compliance: 2. Poor compliance with medication Show forest plot | 10 | 695 | Risk Ratio (M‐H, Fixed, 95% CI) | 0.60 [0.49, 0.73] |
|
| 24 Compliance: 3. Poor compliance with standard community care Show forest plot | 1 | | Risk Ratio (M‐H, Fixed, 95% CI) | Subtotals only |
|
| 24.1 at 1 year | 1 | 51 | Risk Ratio (M‐H, Fixed, 95% CI) | 0.68 [0.41, 1.11] |
| 24.2 at 2 years | 1 | 51 | Risk Ratio (M‐H, Fixed, 95% CI) | 0.85 [0.55, 1.30] |
| 25 Compliance: 4. Months on medication Show forest plot | 1 | | Mean Difference (IV, Fixed, 95% CI) | Subtotals only |
|
| 25.1 by 6 months follow up | 1 | 63 | Mean Difference (IV, Fixed, 95% CI) | 0.40 [‐0.34, 1.14] |
| 25.2 by 12 months follow up | 1 | 61 | Mean Difference (IV, Fixed, 95% CI) | 1.10 [‐0.54, 2.74] |
| 25.3 by 18 months follow up | 1 | 60 | Mean Difference (IV, Fixed, 95% CI) | 1.60 [‐1.10, 4.30] |
| 26 Adverse events: Death Show forest plot | 8 | | Risk Ratio (M‐H, Fixed, 95% CI) | Subtotals only |
|
| 26.1 suicide | 7 | 377 | Risk Ratio (M‐H, Fixed, 95% CI) | 0.79 [0.35, 1.78] |
| 26.2 other cause | 4 | 176 | Risk Ratio (M‐H, Fixed, 95% CI) | 0.78 [0.19, 3.11] |
| 27 Social functioning: 1a. General ‐ socially impaired (0‐9 months) Show forest plot | 2 | 116 | Risk Ratio (M‐H, Fixed, 95% CI) | 0.51 [0.35, 0.72] |
|
| 28 Social functioning: 1b. General ‐ average endpoint score (Social Function Scale, 1 year, high score = good) Show forest plot | 3 | 90 | Mean Difference (IV, Fixed, 95% CI) | ‐8.05 [‐13.27, ‐2.83] |
|
| 29 Social functioning: 2a. Specific ‐ unemployed Show forest plot | 5 | | Risk Ratio (M‐H, Fixed, 95% CI) | Subtotals only |
|
| 29.1 at 6‐12 months follow up | 5 | 285 | Risk Ratio (M‐H, Fixed, 95% CI) | 1.06 [0.89, 1.25] |
| 29.2 at 2 years | 1 | 51 | Risk Ratio (M‐H, Fixed, 95% CI) | 1.33 [0.84, 2.10] |
| 29.3 at 3 years follow up | 1 | 99 | Risk Ratio (M‐H, Fixed, 95% CI) | 1.19 [0.92, 1.55] |
| 30 Social functioning: 2b. Specific ‐ unable to perform work activities Show forest plot | 2 | | Risk Ratio (M‐H, Fixed, 95% CI) | Subtotals only |
|
| 30.1 by 4 months | 1 | 77 | Risk Ratio (M‐H, Fixed, 95% CI) | 0.31 [0.09, 1.03] |
| 30.2 by 9 months | 1 | 35 | Risk Ratio (M‐H, Fixed, 95% CI) | 1.68 [0.17, 16.91] |
| 31 Social functioning: 2c. Specific ‐ time in employment at one year (skewed) Show forest plot | | | Other data | No numeric data |
|
| 32 Social functioning: 2d. Specific ‐ unable to live independently Show forest plot | 3 | | Risk Ratio (M‐H, Fixed, 95% CI) | Subtotals only |
|
| 32.1 by 1 year | 3 | 164 | Risk Ratio (M‐H, Fixed, 95% CI) | 0.83 [0.66, 1.03] |
| 32.2 by 3 years | 1 | 99 | Risk Ratio (M‐H, Fixed, 95% CI) | 0.82 [0.59, 1.14] |
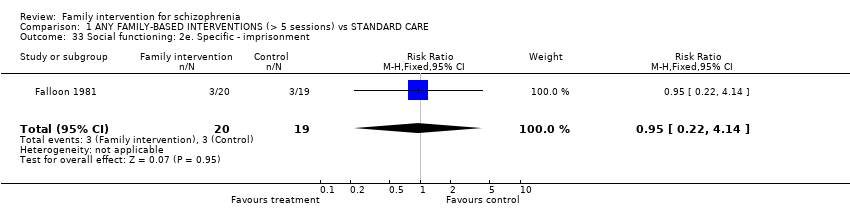
| 33 Social functioning: 2e. Specific ‐ imprisonment Show forest plot | 1 | 39 | Risk Ratio (M‐H, Fixed, 95% CI) | 0.95 [0.22, 4.14] |
|
| 34 Social functioning: 3. Disability Assessment Schedule (3 year, high score = poor) Show forest plot | | | Other data | No numeric data |
|
| 35 Social functioning: 4. Average endpoint score (SDSS, high score = poor) Show forest plot | 1 | | Mean Difference (IV, Fixed, 95% CI) | Subtotals only |
|
| 35.1 at two years | 1 | 150 | Mean Difference (IV, Fixed, 95% CI) | ‐0.51 [‐1.38, 0.36] |
| 35.2 at three years | 1 | 150 | Mean Difference (IV, Fixed, 95% CI) | ‐1.94 [‐2.90, ‐0.98] |
| 36 Social functioning: 5. Average SDSS endpoint score at one year (high score = poor, skewed) Show forest plot | | | Other data | No numeric data |
|
| 37 Social functioning: 6. Average endpoint score (HoNOS 1 year, high score = poor) Show forest plot | | | Other data | No numeric data |
|
| 38 Family outcome: 1a. Coping and understanding: general issues (dichotomised from WOC scale) Show forest plot | 2 | | Risk Ratio (M‐H, Fixed, 95% CI) | Subtotals only |
|
| 38.1 family not able to cope a lot better at 6 months | 1 | 63 | Risk Ratio (M‐H, Fixed, 95% CI) | 0.79 [0.60, 1.03] |
| 38.2 patient coping poorly with key relatives at 9 months | 1 | 39 | Risk Ratio (M‐H, Fixed, 95% CI) | 1.11 [0.45, 2.70] |
| 38.3 not understanding the patient a lot better at 6 months | 1 | 63 | Risk Ratio (M‐H, Fixed, 95% CI) | 0.58 [0.39, 0.87] |
| 39 Family outcome: 1b. Coping and understanding: insufficient care or maltreatment by family Show forest plot | 2 | 111 | Risk Ratio (M‐H, Fixed, 95% CI) | 0.49 [0.23, 1.04] |
|
| 39.1 by up to 6 months | 1 | 77 | Risk Ratio (M‐H, Fixed, 95% CI) | 0.53 [0.22, 1.24] |
| 39.2 by up to 9 months | 1 | 34 | Risk Ratio (M‐H, Fixed, 95% CI) | 0.39 [0.08, 1.87] |
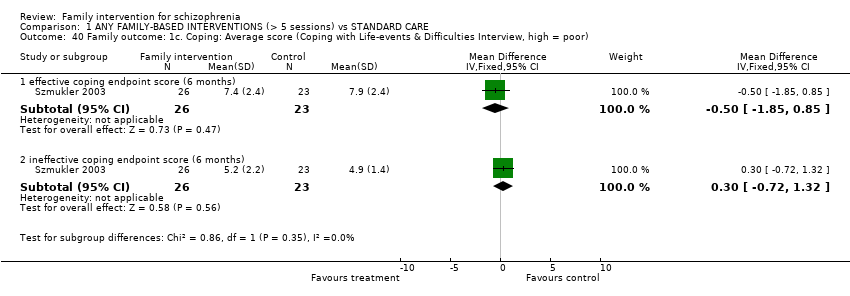
| 40 Family outcome: 1c. Coping: Average score (Coping with Life‐events & Difficulties Interview, high = poor) Show forest plot | 1 | | Mean Difference (IV, Fixed, 95% CI) | Subtotals only |
|
| 40.1 effective coping endpoint score (6 months) | 1 | 49 | Mean Difference (IV, Fixed, 95% CI) | ‐0.5 [‐1.85, 0.85] |
| 40.2 ineffective coping endpoint score (6 months) | 1 | 49 | Mean Difference (IV, Fixed, 95% CI) | 0.30 [‐0.72, 1.32] |
| 41 Family outcome: 2. Service usage: Family Support Service Index, 3 months (high scores = worse) Show forest plot | 1 | 48 | Mean Difference (IV, Fixed, 95% CI) | 0.86 [0.21, 1.51] |
|
| 42 Family outcome: 3. Functioning (Family Assessment Device, 3 months, high scores = worse) Show forest plot | 1 | 48 | Mean Difference (IV, Fixed, 95% CI) | ‐6.56 [‐10.50, ‐2.62] |
|
| 43 Family outcome: 4a. Burden (Family Burden Interview Schedule, 3 months, high score = worse) Show forest plot | 1 | 48 | Mean Difference (IV, Fixed, 95% CI) | ‐7.01 [‐10.77, ‐3.25] |
|
| 44 Family outcome: 4b. Burden endpoint score at 0‐18 months (high score = poor) Show forest plot | 1 | 60 | Mean Difference (IV, Fixed, 95% CI) | ‐0.40 [‐0.71, ‐0.09] |
|
| 45 Family outcome: 4c. Burden ‐ not improved/worse (objective burden related to self‐sufficiency) Show forest plot | 1 | | Risk Ratio (M‐H, Fixed, 95% CI) | Subtotals only |
|
| 45.1 12 months | 1 | 51 | Risk Ratio (M‐H, Fixed, 95% CI) | 0.53 [0.21, 1.37] |
| 45.2 2 years | 1 | 51 | Risk Ratio (M‐H, Fixed, 95% CI) | 1.92 [0.19, 19.90] |
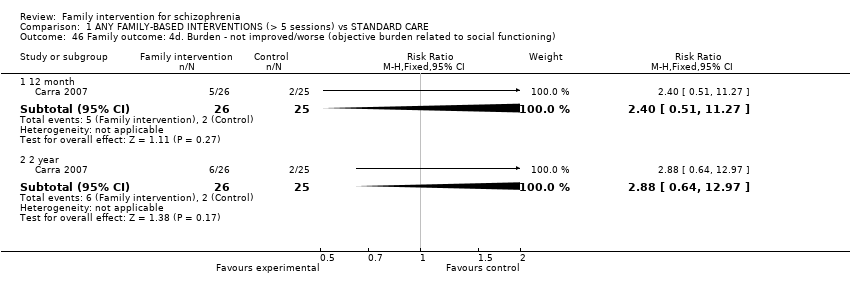
| 46 Family outcome: 4d. Burden ‐ not improved/worse (objective burden related to social functioning) Show forest plot | 1 | | Risk Ratio (M‐H, Fixed, 95% CI) | Subtotals only |
|
| 46.1 12 month | 1 | 51 | Risk Ratio (M‐H, Fixed, 95% CI) | 2.40 [0.51, 11.27] |
| 46.2 2 year | 1 | 51 | Risk Ratio (M‐H, Fixed, 95% CI) | 2.88 [0.64, 12.97] |
| 47 Family outcome: 4e. Burden ‐ not improved/worse (subjective burden) Show forest plot | 1 | | Risk Ratio (M‐H, Fixed, 95% CI) | Subtotals only |
|
| 47.1 12 months | 1 | 51 | Risk Ratio (M‐H, Fixed, 95% CI) | 1.44 [0.60, 3.46] |
| 47.2 2 years | 1 | 51 | Risk Ratio (M‐H, Fixed, 95% CI) | 0.58 [0.15, 2.16] |
| 48 Family outcome: 4f. Burden ‐ endpoint score (1 year, high score = worse, skewed) Show forest plot | | | Other data | No numeric data |
|
| 49 Family outcome: 5a. Expressed emotion Show forest plot | 4 | | Risk Ratio (M‐H, Fixed, 95% CI) | Subtotals only |
|
| 49.1 overall levels | 1 | 75 | Risk Ratio (M‐H, Fixed, 95% CI) | 0.9 [0.68, 1.19] |
| 49.2 over involvement | 1 | 63 | Risk Ratio (M‐H, Fixed, 95% CI) | 0.40 [0.22, 0.73] |
| 49.3 criticism | 1 | 63 | Risk Ratio (M‐H, Fixed, 95% CI) | 0.44 [0.24, 0.81] |
| 49.4 hostility | 2 | 87 | Risk Ratio (M‐H, Fixed, 95% CI) | 0.35 [0.18, 0.66] |
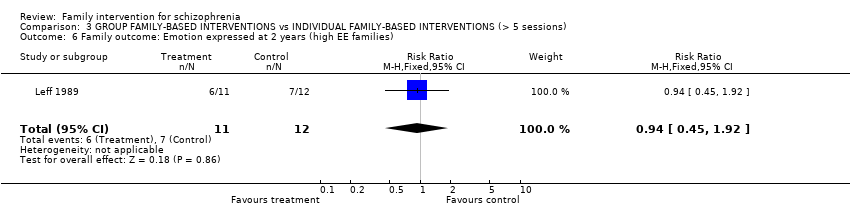
| 49.5 high EE family | 3 | 164 | Risk Ratio (M‐H, Fixed, 95% CI) | 0.68 [0.54, 0.86] |
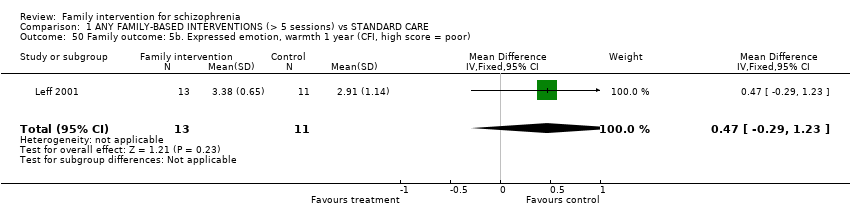
| 50 Family outcome: 5b. Expressed emotion, warmth 1 year (CFI, high score = poor) Show forest plot | 1 | 24 | Mean Difference (IV, Fixed, 95% CI) | 0.47 [‐0.29, 1.23] |
|
| 51 Family outcome: 5c. Expressed emotion (1 year, skewed) Show forest plot | | | Other data | No numeric data |
|
| 51.1 critical comments | | | Other data | No numeric data |
| 51.2 over‐involvement | | | Other data | No numeric data |
| 52 Family outcome: 6. Knowledge Score (1 year, skewed data) Show forest plot | | | Other data | No numeric data |
|
| 53 Family outcome: 7. Average endpoint score (Clinical Interview Schedule Revised, 6 months, skewed) Show forest plot | | | Other data | No numeric data |
|
| 54 Family outcome: 8. Average endpoint score (Experience of Caregiving Inventory, 6 months, skewed) Show forest plot | | | Other data | No numeric data |
|
| 55 Family outcome: 9. Average endpoint score (SESS, 6 months, skewed) Show forest plot | | | Other data | No numeric data |
|
| 55.1 general support | | | Other data | No numeric data |
| 55.2 confidant support | | | Other data | No numeric data |
| 56 Family outcome: 10. Average endpoint score (Stressor‐severity of caregiving difficulty, 6 months, skewed) Show forest plot | | | Other data | No numeric data |
|
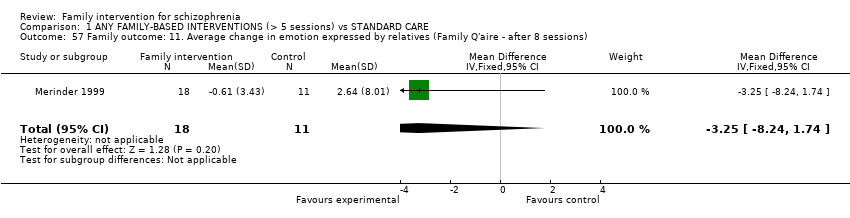
| 57 Family outcome: 11. Average change in emotion expressed by relatives (Family Q'aire ‐ after 8 sessions) Show forest plot | 1 | 29 | Mean Difference (IV, Fixed, 95% CI) | ‐3.25 [‐8.24, 1.74] |
|
| 58 Family outcome: 12a. Satisfaction ‐ average change in relatives' satisfaction (VSSS , 1 year, data skewed) Show forest plot | | | Other data | No numeric data |
|
| 59 Family outcome: 12b. Satisfaction ‐ relatives (VSSS ‐ post intervention at 8 sessions, skewed) Show forest plot | | | Other data | No numeric data |
|
| 60 Family outcome: 12c. Satisfaction ‐ patients (VSSS ‐ post intervention at 8 sessions, skewed) Show forest plot | | | Other data | No numeric data |
|
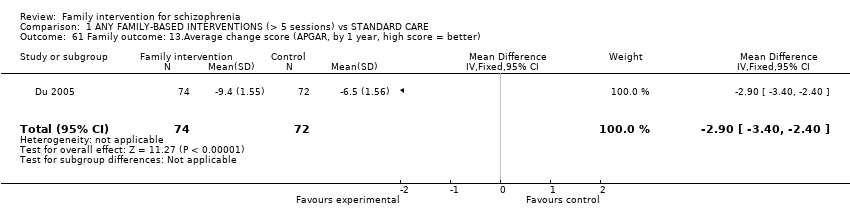
| 61 Family outcome: 13.Average change score (APGAR, by 1 year, high score = better) Show forest plot | 1 | 146 | Mean Difference (IV, Fixed, 95% CI) | ‐2.90 [‐3.40, ‐2.40] |
|
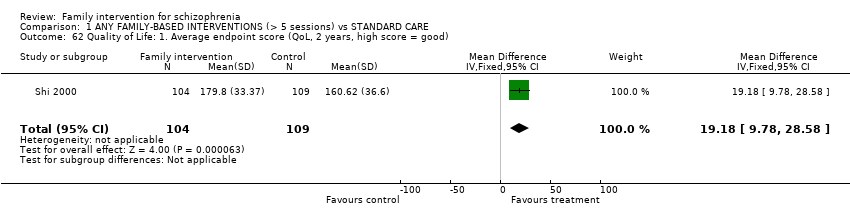
| 62 Quality of Life: 1. Average endpoint score (QoL, 2 years, high score = good) Show forest plot | 1 | 213 | Mean Difference (IV, Fixed, 95% CI) | 19.18 [9.78, 28.58] |
|
| 63 Quality of life: 2. Average endpoint change (QoL, 1 year, high score = good) Show forest plot | 1 | 50 | Mean Difference (IV, Fixed, 95% CI) | ‐5.05 [‐15.44, 5.34] |
|