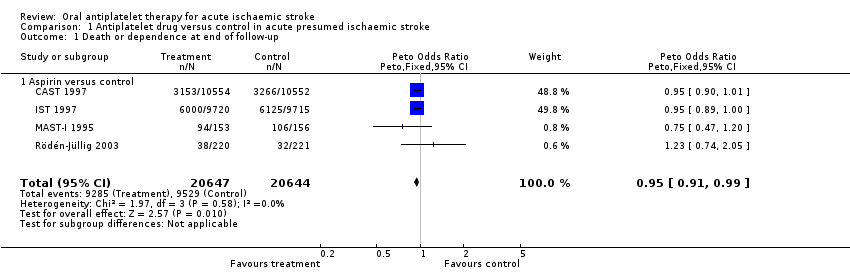
| 1 Death or dependence at end of follow‐up Show forest plot | 4 | 41291 | Peto Odds Ratio (Peto, Fixed, 95% CI) | 0.95 [0.91, 0.99] |
|
| 1.1 Aspirin versus control | 4 | 41291 | Peto Odds Ratio (Peto, Fixed, 95% CI) | 0.95 [0.91, 0.99] |
| 2 Deaths from all causes during treatment period Show forest plot | 8 | 41483 | Peto Odds Ratio (Peto, Fixed, 95% CI) | 0.92 [0.85, 1.00] |
|
| 2.1 Aspirin versus control | 4 | 41291 | Peto Odds Ratio (Peto, Fixed, 95% CI) | 0.92 [0.85, 1.00] |
| 2.2 Aspirin plus dipyridamole versus control | 1 | 80 | Peto Odds Ratio (Peto, Fixed, 95% CI) | 1.47 [0.43, 4.99] |
| 2.3 Ticlopidine versus control | 3 | 112 | Peto Odds Ratio (Peto, Fixed, 95% CI) | 0.12 [0.01, 1.20] |
| 3 Deaths from all causes during follow‐up Show forest plot | 8 | 41483 | Peto Odds Ratio (Peto, Fixed, 95% CI) | 0.92 [0.87, 0.98] |
|
| 3.1 Aspirin versus control | 4 | 41291 | Peto Odds Ratio (Peto, Fixed, 95% CI) | 0.92 [0.87, 0.98] |
| 3.2 Aspirin plus dipyridamole versus control | 1 | 80 | Peto Odds Ratio (Peto, Fixed, 95% CI) | 1.47 [0.43, 4.99] |
| 3.3 Ticlopidine versus control | 3 | 112 | Peto Odds Ratio (Peto, Fixed, 95% CI) | 0.12 [0.02, 0.88] |
| 4 Deep venous thrombosis during treatment period Show forest plot | 2 | 133 | Peto Odds Ratio (Peto, Fixed, 95% CI) | 0.78 [0.36, 1.67] |
|
| 4.1 Aspirin plus dipyridamole versus control | 1 | 80 | Peto Odds Ratio (Peto, Fixed, 95% CI) | 0.35 [0.13, 0.95] |
| 4.2 Ticlopidine versus control | 1 | 53 | Peto Odds Ratio (Peto, Fixed, 95% CI) | 2.37 [0.72, 7.73] |
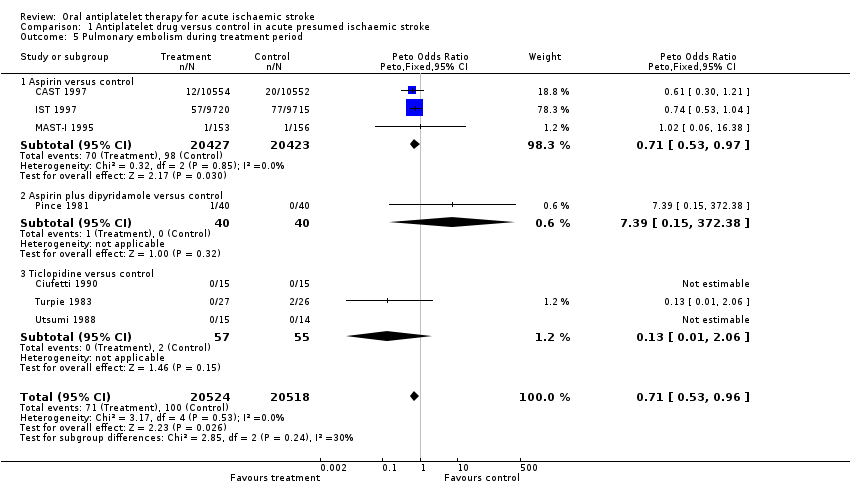
| 5 Pulmonary embolism during treatment period Show forest plot | 7 | 41042 | Peto Odds Ratio (Peto, Fixed, 95% CI) | 0.71 [0.53, 0.96] |
|
| 5.1 Aspirin versus control | 3 | 40850 | Peto Odds Ratio (Peto, Fixed, 95% CI) | 0.71 [0.53, 0.97] |
| 5.2 Aspirin plus dipyridamole versus control | 1 | 80 | Peto Odds Ratio (Peto, Fixed, 95% CI) | 7.39 [0.15, 372.38] |
| 5.3 Ticlopidine versus control | 3 | 112 | Peto Odds Ratio (Peto, Fixed, 95% CI) | 0.13 [0.01, 2.06] |
| 6 Recurrent ischaemic/unknown stroke during treatment period Show forest plot | 7 | 41042 | Peto Odds Ratio (Peto, Fixed, 95% CI) | 0.77 [0.69, 0.87] |
|
| 6.1 Aspirin versus control | 3 | 40850 | Peto Odds Ratio (Peto, Fixed, 95% CI) | 0.77 [0.69, 0.87] |
| 6.2 Aspirin plus dipyridamole versus control | 1 | 80 | Peto Odds Ratio (Peto, Fixed, 95% CI) | 0.0 [0.0, 0.0] |
| 6.3 Ticlopidine versus control | 3 | 112 | Peto Odds Ratio (Peto, Fixed, 95% CI) | 0.0 [0.0, 0.0] |
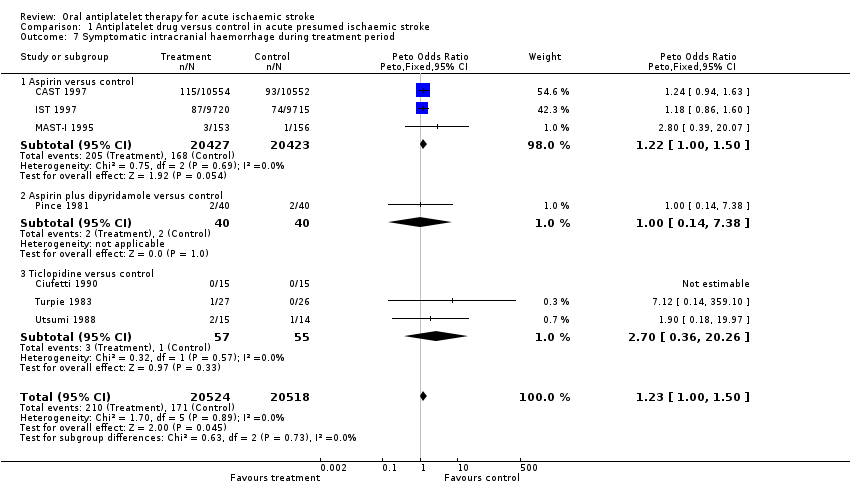
| 7 Symptomatic intracranial haemorrhage during treatment period Show forest plot | 7 | 41042 | Peto Odds Ratio (Peto, Fixed, 95% CI) | 1.23 [1.00, 1.50] |
|
| 7.1 Aspirin versus control | 3 | 40850 | Peto Odds Ratio (Peto, Fixed, 95% CI) | 1.22 [1.00, 1.50] |
| 7.2 Aspirin plus dipyridamole versus control | 1 | 80 | Peto Odds Ratio (Peto, Fixed, 95% CI) | 1.0 [0.14, 7.38] |
| 7.3 Ticlopidine versus control | 3 | 112 | Peto Odds Ratio (Peto, Fixed, 95% CI) | 2.70 [0.36, 20.26] |
| 8 Any recurrent stroke/intracranial haemorrhage during treatment period Show forest plot | 7 | 41042 | Peto Odds Ratio (Peto, Fixed, 95% CI) | 0.88 [0.79, 0.97] |
|
| 8.1 Aspirin versus control | 3 | 40850 | Peto Odds Ratio (Peto, Fixed, 95% CI) | 0.87 [0.79, 0.97] |
| 8.2 Aspirin plus dipyridamole versus control | 1 | 80 | Peto Odds Ratio (Peto, Fixed, 95% CI) | 1.0 [0.14, 7.38] |
| 8.3 Ticlopidine versus control | 3 | 112 | Peto Odds Ratio (Peto, Fixed, 95% CI) | 2.70 [0.36, 20.26] |
| 9 Major extracranial haemorrhage during treatment period Show forest plot | 7 | 41042 | Peto Odds Ratio (Peto, Fixed, 95% CI) | 1.69 [1.35, 2.11] |
|
| 9.1 Aspirin versus control | 3 | 40850 | Peto Odds Ratio (Peto, Fixed, 95% CI) | 1.69 [1.35, 2.11] |
| 9.2 Aspirin plus dipyridamole versus control | 1 | 80 | Peto Odds Ratio (Peto, Fixed, 95% CI) | 0.0 [0.0, 0.0] |
| 9.3 Ticlopidine versus control | 3 | 112 | Peto Odds Ratio (Peto, Fixed, 95% CI) | 0.0 [0.0, 0.0] |
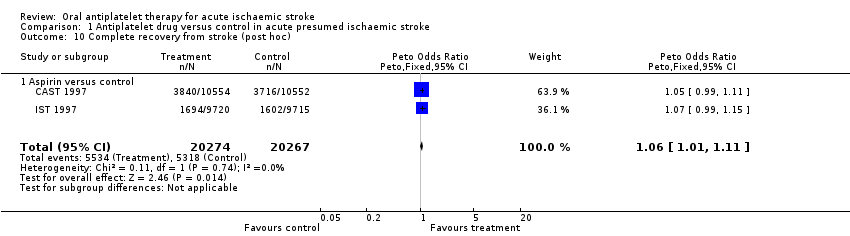
| 10 Complete recovery from stroke (post hoc) Show forest plot | 2 | 40541 | Peto Odds Ratio (Peto, Fixed, 95% CI) | 1.06 [1.01, 1.11] |
|
| 10.1 Aspirin versus control | 2 | 40541 | Peto Odds Ratio (Peto, Fixed, 95% CI) | 1.06 [1.01, 1.11] |