Immunotherapy for metastatic renal cell carcinoma
Abstract
Background
Since the mid‐2000s, the field of metastatic renal cell carcinoma (mRCC) has experienced a paradigm shift from non‐specific therapy with broad‐acting cytokines to specific regimens, which directly target the cancer, the tumour microenvironment, or both.
Current guidelines recommend targeted therapies with agents such as sunitinib, pazopanib or temsirolimus (for people with poor prognosis) as the standard of care for first‐line treatment of people with mRCC and mention non‐specific cytokines as an alternative option for selected patients.
In November 2015, nivolumab, a checkpoint inhibitor directed against programmed death‐1 (PD‐1), was approved as the first specific immunotherapeutic agent as second‐line therapy in previously treated mRCC patients.
Objectives
To assess the effects of immunotherapies either alone or in combination with standard targeted therapies for the treatment of metastatic renal cell carcinoma and their efficacy to maximize patient benefit.
Search methods
We searched the Cochrane Library, MEDLINE (Ovid), Embase (Ovid), ISI Web of Science and registers of ongoing clinical trials in November 2016 without language restrictions. We scanned reference lists and contacted experts in the field to obtain further information.
Selection criteria
We included randomized controlled trials (RCTs) and quasi‐RCTs with or without blinding involving people with mRCC.
Data collection and analysis
We collected and analyzed studies according to the published protocol. Summary statistics for the primary endpoints were risk ratios (RRs) and mean differences (MD) with their 95% confidence intervals (CIs). We rated the quality of evidence using GRADE methodology and summarized the quality and magnitude of relative and absolute effects for each primary outcome in our 'Summary of findings' tables.
Main results
We identified eight studies with 4732 eligible participants and an additional 13 ongoing studies. We categorized studies into comparisons, all against standard therapy accordingly as first‐line (five comparisons) or second‐line therapy (one comparison) for mRCC.
Interferon (IFN)‐α monotherapy probably increases one‐year overall mortality compared to standard targeted therapies with temsirolimus or sunitinib (RR 1.30, 95% CI 1.13 to 1.51; 2 studies; 1166 participants; moderate‐quality evidence), may lead to similar quality of life (QoL) (e.g. MD ‐5.58 points, 95% CI ‐7.25 to ‐3.91 for Functional Assessment of Cancer ‐ General (FACT‐G); 1 study; 730 participants; low‐quality evidence) and may slightly increase the incidence of adverse events (AEs) grade 3 or greater (RR 1.17, 95% CI 1.03 to 1.32; 1 study; 408 participants; low‐quality evidence).
There is probably no difference between IFN‐α plus temsirolimus and temsirolimus alone for one‐year overall mortality (RR 1.13, 95% CI 0.95 to 1.34; 1 study; 419 participants; moderate‐quality evidence), but the incidence of AEs of 3 or greater may be increased (RR 1.30, 95% CI 1.17 to 1.45; 1 study; 416 participants; low‐quality evidence). There was no information on QoL.
IFN‐α alone may slightly increase one‐year overall mortality compared to IFN‐α plus bevacizumab (RR 1.17, 95% CI 1.00 to 1.36; 2 studies; 1381 participants; low‐quality evidence). This effect is probably accompanied by a lower incidence of AEs of grade 3 or greater (RR 0.77, 95% CI 0.71 to 0.84; 2 studies; 1350 participants; moderate‐quality evidence). QoL could not be evaluated due to insufficient data.
Treatment with IFN‐α plus bevacizumab or standard targeted therapy (sunitinib) may lead to similar one‐year overall mortality (RR 0.37, 95% CI 0.13 to 1.08; 1 study; 83 participants; low‐quality evidence) and AEs of grade 3 or greater (RR 1.18, 95% CI 0.85 to 1.62; 1 study; 82 participants; low‐quality evidence). QoL could not be evaluated due to insufficient data.
Treatment with vaccines (e.g. MVA‐5T4 or IMA901) or standard therapy may lead to similar one‐year overall mortality (RR 1.10, 95% CI 0.91 to 1.32; low‐quality evidence) and AEs of grade 3 or greater (RR 1.16, 95% CI 0.97 to 1.39; 2 studies; 1065 participants; low‐quality evidence). QoL could not be evaluated due to insufficient data.
In previously treated patients, targeted immunotherapy (nivolumab) probably reduces one‐year overall mortality compared to standard targeted therapy with everolimus (RR 0.70, 95% CI 0.56 to 0.87; 1 study; 821 participants; moderate‐quality evidence), probably improves QoL (e.g. RR 1.51, 95% CI 1.28 to 1.78 for clinically relevant improvement of the FACT‐Kidney Symptom Index Disease Related Symptoms (FKSI‐DRS); 1 study, 704 participants; moderate‐quality evidence) and probably reduces the incidence of AEs grade 3 or greater (RR 0.51, 95% CI 0.40 to 0.65; 1 study; 803 participants; moderate‐quality evidence).
Authors' conclusions
Evidence of moderate quality demonstrates that IFN‐α monotherapy increases mortality compared to standard targeted therapies alone, whereas there is no difference if IFN is combined with standard targeted therapies. Evidence of low quality demonstrates that QoL is worse with IFN alone and that severe AEs are increased with IFN alone or in combination. There is low‐quality evidence that IFN‐α alone increases mortality but moderate‐quality evidence on decreased AEs compared to IFN‐α plus bevacizumab. Low‐quality evidence shows no difference for IFN‐α plus bevacizumab compared to sunitinib with respect to mortality and severe AEs. Low‐quality evidence demonstrates no difference of vaccine treatment compared to standard targeted therapies in mortality and AEs, whereas there is moderate‐quality evidence that targeted immunotherapies reduce mortality and AEs and improve QoL.
PICOs
Plain language summary
Immunotherapy for advanced kidney cancer
Review question
Kidney cancer is rarely curable once it has spread to other organs at the time of diagnosis. Targeted agents are currently considered as the standard treatment for advanced kidney cancer that has spread to other organs. This review examines clinical studies that have directly compared immunotherapies or combination therapies to current standard therapy.
Background
Prior to the use of the new targeted agents, drugs that boosted the immune response against the cancer in a non‐specific way (immunotherapies) were the most widely used treatment form for people with kidney cancer that had spread to other organs. Newer immunotherapeutic agents, including vaccines and so called 'checkpoint inhibitors,' have been developed to specifically target the body's immune system and enable it to recognize and attack cancer cells more specifically. In this review, we evaluated all types of immunotherapy or combination therapies by comparing it to the current standard therapy.
Study characteristics
A systematic search up to the end of October 2016 identified eight studies that looked at four different types of immunotherapy in 4732 people. Studies were only included if patients were randomized to a form of immunotherapy included in this review or a standard form of targeted therapy. One study was funded by a public institution whereas all the others were supported by drug companies.
The study participants were generally representative of people with advanced kidney cancer. The majority of people had their kidney cancer removed before starting treatment. We compared studies of people who had previously received standard medicine (821 participants) to those of people who had not (3911 participants). All studies reported our main outcome of interest; the chance of longer survival including the survival for one year. We also focused on the frequency of severe treatment side effects, quality of life and the delay in disease worsening.
Key results
Interferon‐α was the most commonly used therapy option prior to the era of targeted therapies. Two studies with 1166 participants compared interferon‐α alone (monotherapy) to targeted standard therapy. Interferon‐α is probably inferior to tested targeted therapies called sunitinib and temsirolimus. Patients with interferon‐α monotherapy probably have a shorter time to worsening of cancer. They may have similar quality of life and a slightly more severe treatment side effects.
Adding temsirolimus to interferon‐α probably does not improve survival compared to temsirolimus alone, but may result in more major side effects (one study).
Two studies compared interferon‐α to a combination of interferon‐α and bevacizumab in 1381 previously untreated participants. There was a slightly increased death rate with probably fewer major side effects for people treated with interferon‐α alone.
Two studies evaluated vaccines. Vaccines may lead to similar death rates and side effects in people with advanced kidney cancer.
For patients who had already undergone systemic treatment, one study with nivolumab, a novel checkpoint inhibitor, improved average survival by more than five months when compared to the targeted standard therapy, everolimus. The effects are probably accompanied by better quality of life and fewer major side effects.
Quality of the evidence
We had reduced confidence in the results of the studies we analyzed (moderate‐ or low‐quality evidence) because patients and treating physicians were often not blinded to the treatment and involved relatively few patients.
Authors' conclusions
Summary of findings
| IFN‐α alone versus standard targeted therapy for mRCC | ||||||
| Patient population: previously untreated patients with mRCC Settings: phase III, international, multicentre, open‐label Intervention: IFN‐α alone Comparison: standard targeted therapy (sunitinib or temsirolimus) | ||||||
| Outcomes | Illustrative comparative risks* (95% CI) | Relative effect | No of participants | Quality of the evidence | Comments | |
| Assumed risk | ||||||
| Risk with standard targeted therapy | Risk difference with IFN‐α alone (95% CI) | |||||
| 1‐year mortality | Lowa | RR 1.3 | 1166 | ⊕⊕⊕⊝ | ‐ | |
| 150 per 1000 | 45 more per 1000 | |||||
| Moderatea | ||||||
| 280 per 1000 | 84 more per 1000 | |||||
| Higha | ||||||
| 550 per 1000 | 165 more per 1000 | |||||
| QoL | The mean QoL in the control group was | MD 5.58 lower | ‐ | 730 | ⊕⊕⊝⊝ | ‐ |
| QoL | The mean QoL in the control group was | MD 3.27 lower (4.18 to 2.36 lower) | ‐ | 730 | ⊕⊕⊝⊝ | ‐ |
| QoL | The mean QoL in the control group was | MD 1.98 lower (2.51 to 1.46 lower) | ‐ | 730 | ⊕⊕⊝⊝ | ‐ |
| QoL | The mean QoL in the control group was | MD 0.06 lower (0.12 lower to 0 higher) | ‐ | 1002 (2 studies) | ⊕⊕⊝⊝ | ‐ |
| QoL | The mean QoL in the control groups was | MD 4.68 lower (6.53 to 2.83 lower) | ‐ | 1002 (2 studies) | ⊕⊕⊝⊝ | ‐ |
| Adverse events (grade ≥ 3) | 668 per 1000 | 114 more per 1000 | RR 1.17 | 408 | ⊕⊕⊝⊝ | ‐ |
| *The basis for the assumed risk (e.g. the median control group risk across studies) is provided in footnotes. The corresponding risk (and its 95% confidence interval) is based on the assumed risk in the comparison group and the relative effect of the intervention (and its 95% CI). | ||||||
| GRADE Working Group grades of evidence | ||||||
| 1 Downgraded for selection bias and performance bias due to cross‐over. | ||||||
| IFN‐α alone or combined with targeted therapy compared to standard targeted therapy in first‐line therapy of mRCC | ||||||
| Patient population: previously untreated patients with mRCC Setting: phase III, international, multicentre, open‐label Intervention: IFN‐α combined with targeted therapy Comparison: standard targeted therapy (temsirolimus) | ||||||
| Outcomes | Illustrative comparative risks* (95% CI) | Relative effect | No of participants | Quality of the evidence | Comments | |
| Assumed risk | ||||||
| Risk with standard targeted therapy | Risk difference with IFN‐α combined with targeted therapy (95% CI) | |||||
| 1‐year mortality | Lowa | RR 1.13 | 419 | ⊕⊕⊕⊝ | ‐ | |
| 150 per 1000 | 20 more per 1000 | |||||
| Moderatea | ||||||
| 280 per 1000 | 36 more per 1000 | |||||
| Higha | ||||||
| 550 per 1000 | 71 more per 1000 | |||||
| Quality of life | No evidence available | |||||
| Adverse events (grade ≥ 3) | 668 per 1000 | 200 more per 1000 | RR 1.30 | 416 | ⊕⊕⊝⊝ | ‐ |
| *The basis for the assumed risk (e.g. the median control group risk across studies) is provided in footnotes. The corresponding risk (and its 95% confidence interval) is based on the assumed risk in the comparison group and the relative effect of the intervention (and its 95% CI). | ||||||
| GRADE Working Group grades of evidence | ||||||
| 1 Downgraded for imprecision due to wide confidence intervals; clinical action would differ between lower and upper boundary of the confidence interval. | ||||||
| IFN‐α alone versus IFN‐α + bevacizumab in first‐line therapy of mRCC | ||||||
| Patient population: previously untreated patient with mRCC Setting: phase III, international, multicentre, Escudier 2007: double‐blind, placebo‐controlled; Rini 2010: open‐label Intervention: IFN‐α alone Comparison: IFN‐α alone + bevacizumab | ||||||
| Outcomes | Illustrative comparative risks* (95% CI) | Relative effect | No of participants | Quality of the evidence | Comments | |
| Assumed risk | ||||||
| Risk with standard therapy (IFN‐α + bevacizumab) | Risk difference with IFN‐α alone (95% CI) | |||||
| 1‐year mortality | Low | RR 1.17 | 1381 | ⊕⊕⊝⊝ | ‐ | |
| 150 per 1000 | 25 more per 1000 | |||||
| Moderate | ||||||
| 280 per 1000 | 48 more per 1000 | |||||
| High | ||||||
| 550 per 1000 | 93 more per 1000 | |||||
| Quality of life | No evidence available | |||||
| Adverse events (grade ≥ 3) Follow‐up: up to 28 days after last dose to 65 months | 705 per 1000 | 162 fewer per 1000 | RR 0.77 | 1350 | ⊕⊕⊕⊝ | ‐ |
| *The basis for the assumed risk (e.g. the median control group risk across studies) is provided in footnotes. The corresponding risk (and its 95% confidence interval) is based on the assumed risk in the comparison group and the relative effect of the intervention (and its 95% CI). | ||||||
| GRADE Working Group grades of evidence | ||||||
| 1 Downgraded for selection bias and performance bias due to substantial cross‐over. | ||||||
| IFN‐α + bevacizumab versus targeted therapies in first‐line therapy of mRCC | ||||||
| Patient population: previously untreated patients with mRCC Setting: phase II, national (France), multicentre, open‐label Intervention: IFN‐α + bevacizumab Comparison: standard targeted therapies (sunitinib) | ||||||
| Outcomes | Illustrative comparative risks* (95% CI) | Relative effect | No of participants | Quality of the evidence | Comments | |
| Assumed risk | ||||||
| Risk with standard targeted therapies | Risk difference with IFN‐α + bevacizumab (95% CI) | |||||
| 1‐year mortality Follow‐up: 23.2 months | Lowa | RR 0.37 | 83 | ⊕⊕⊝⊝ | ‐ | |
| 150 per 1000 | 95 fewer per 1000 | |||||
| Moderatea | ||||||
| 280 per 1000 | 176 fewer per 1000 | |||||
| Higha | ||||||
| 550 per 1000 | 347 fewer per 1000 | |||||
| Quality of life | No evidence available | |||||
| Adverse events (grade ≥ 3) Follow‐up: 48 weeks | 595 per 1000 | 107 more per 1000 | RR 1.18 | 82 | ⊕⊕⊝⊝ | ‐ |
| *The basis for the assumed risk (e.g. the median control group risk across studies) is provided in footnotes. The corresponding risk (and its 95% confidence interval) is based on the assumed risk in the comparison group and the relative effect of the intervention (and its 95% CI). | ||||||
| GRADE Working Group grades of evidence | ||||||
| 1 Downgraded for reporting and performance bias due to differences in second‐line treatment. | ||||||
| Vaccine treatment versus standard therapies in first‐line therapy of mRCC | ||||||
| Patient population: previously untreated patients with mRCC Setting: phase III, international, multicentre, double‐blind, placebo‐controlled (Amato 2010), open‐label (Rini 2015) Intervention: vaccine treatment (MVA‐5T4 or IMA0901) Comparison: placebo and standard therapies (IL‐2, IFN‐α and sunitinib) | ||||||
| Outcomes | Illustrative comparative risks* (95% CI) | Relative effect | No of participants | Quality of the evidence | Comments | |
| Assumed risk | ||||||
| Risk with standard therapies | Risk difference with vaccine treatment (95% CI) | |||||
| 1‐year mortality | Lowa | RR 1.10 | 1034 | ⊕⊕⊝⊝ | ‐ | |
| 150 per 1000 | 15 more per 1000 | |||||
| Moderatea | ||||||
| 280 per 1000 | 28 more per 1000 | |||||
| Higha | ||||||
| 550 per 1000 | 55 more per 1000 | |||||
| Quality of life | No evidence available | |||||
| Adverse events (grade ≥ 3) Follow‐up: not reported | 241 per 1000 | 39 more per 1000 | RR 1.16 | 1065 | ⊕⊕⊝⊝ | ‐ |
| *The basis for the assumed risk (e.g. the median control group risk across studies) is provided in footnotes. The corresponding risk (and its 95% confidence interval) is based on the assumed risk in the comparison group and the relative effect of the intervention (and its 95% CI). | ||||||
| GRADE Working Group grades of evidence | ||||||
| 1 Not downgraded for performance bias, borderline decision due to second‐line therapies in one study. | ||||||
| Targeted immunotherapy alone versus standard targeted therapies in previously treated patients with mRCC | ||||||
| Patient population: previously treated patients with mRCC Setting: phase III, international, multicentre, open‐label Intervention: targeted immunotherapy (nivolumab) alone Comparison: standard targeted therapies (everolimus) | ||||||
| Outcomes | Illustrative comparative risks* (95% CI) | Relative effect | No of participants | Quality of the evidence | Comments | |
| Assumed risk | ||||||
| Risk with standard targeted therapies | Risk difference with targeted immunotherapy alone (95% CI) | |||||
| 1‐year mortality | 341 per 1000 | 102 fewer per 1000 | RR 0.70 | 821 | ⊕⊕⊕⊝ | ‐ |
| Quality of life: Clinically relevant improvement in FKSI‐DRS | 367 per 1000 | 187 more per 1000 (from 103 more to 287 more) | RR 1.51 (1.28 to 1.78) | 704 | ⊕⊕⊕⊝ | ‐ |
| Quality of life: clinically relevant improvement in EQ‐5D VAS | 391 per 1000 | 145 more per 1000 (from 63 more to 238 more) | RR 1.37 (1.16‐1.61) | 703 (1 study) | ⊕⊕⊕⊝ | ‐ |
| Adverse events (grade ≥ 3) | 365 per 1000 | 179 fewer per 1000 | RR 0.51 | 803 | ⊕⊕⊕⊝ | ‐ |
| *The basis for the assumed risk (e.g. the median control group risk across studies) is provided in footnotes. The corresponding risk (and its 95% confidence interval) is based on the assumed risk in the comparison group and the relative effect of the intervention (and its 95% CI). | ||||||
| GRADE Working Group grades of evidence | ||||||
| 1 Downgraded for performance bias due to cross‐over. | ||||||
Background
Description of the condition
Kidney cancer is classified into renal cell carcinoma (RCC) and urothelial carcinoma of the renal pelvis. Kidney cancer is the 14th most common malignancy worldwide with approximately 337,800 new cases diagnosed in 2012 (Ferlay 2013). In 2012, 375,925 people had kidney and pelvis cancer in the US with an estimated 63,920 newly diagnosed cancer cases and 13,860 deaths in 2014 (Howlader 2015; Siegel 2014). Incidence is highest in Europe, North America and Australia and lowest in India, Japan, Africa and China (Ljungberg 2011). In the European Union, 85,215 new cases of kidney cancer occurred in 2012 with 35,134 patient deaths (Ferlay 2013).
RCC is the most common tumour of the kidney comprising 90% of cases. It is a heterogeneous cancer and is classified into three major histological RCC types; clear‐cell RCC (70% to 85% of cases), papillary RCC (7% to 15%) and chromophobe RCC (5% to 10%) (Escudier 2014).
In the Western world, RCC shows an age‐standardized incidence rate of 5.8 per 100,000 people and a mortality rate of 1.4 per 100,000 people. Despite advances in diagnosis, about 30% of people with RCC have already developed metastatic RCC (mRCC) at presentation (Gupta 2008), and another 20% of people with clinically localized RCC eventually develop metastases during the course of the disease despite treatment (Athar 2008; Motzer 1996; Zisman 2002). The annual incidence of mRCC was estimated at 8567 cases in the US and 3026 cases in Germany (2002 figures). These numbers correspond to incidence rates of 3.9 (US males), 2.1 (US females), 4.7 (German males) and 2.7 (German females) per 100,000 inhabitants in these countries (Gupta 2008). Prognosis of patients is directly related to the dissemination stage of the tumour. Therefore, the five‐year survival for people with localized RCC in the US is 92.1% decreasing to 65.4% for people with regional disease and down to 11.8% for people with mRCC (Howlader 2015). The estimated economic burden of mRCC has not been adequately studied and can only be estimated from incidences and costs for all types of RCC and kidney cancer. Annual healthcare costs and lost productivity accounted for between USD 107 million to USD 556 million spent in the US whereas the worldwide mRCC cost was estimated to lie between USD 1.1 billion and USD 1.6 billion (2006 figures) (Gupta 2008). In the case of metastatic disease, the central aim of treatment is to optimize improvement in quality and quantity of life. Therefore, the development of new agents with more effective antitumour activity is urgently required for the enhancement of quality of life (QoL) in people with mRCC.
Description of the intervention
RCC has been reported to be a highly immunogenic tumour, an observation that explains the rationale behind the application of immunotherapy to promote an antitumour effect (Michael 2003; Rayman 2004). Due to high levels of intratumoural immune cell infiltration and spontaneous remission rates, various immunotherapeutic approaches have been developed for the treatment of this disease. Most studies have focused on the implementation of non‐specific cytokines, such as interferon (IFN)‐α and interleukin (IL)‐2 and their combinations. Studies have so far produced inconsistent results and failed to define a globally recognized, standardized immunotherapy regimen for metastatic disease (Johannsen 2007). Since the mid‐2000s, the transformation of mRCC treatment following advances that led to improved understanding of RCC biology and the approval of targeted agents inhibiting the vascular endothelial growth factor (VEGF) and mammalian target of rapamycin (mTOR) signalling pathways. This has led to a switch from cytokine‐based therapies to targeted therapies in the treatment of mRCC, a change that is further highlighted by the omission of cytokine monotherapy from current evidence‐based guidelines of the European Association of Urology (Ljungberg 2015). For most people with metastatic disease, cytoreductive nephrectomy alone is merely palliative and thus, additional systemic treatments are necessary. Current guidelines recommend systemic treatment with targeted therapies (sunitinib, bevacizumab plus IFN‐α, pazopanib, temsirolimus, sorafenib, everolimus and axitinib) according to histology, patient risk stratification and treatment line (Ljungberg 2015). Despite remarkable improvements in progression‐free survival (PFS) and objective response rates (ORR) with targeted therapies, an increase in complete remission of mRCC has not been achieved perhaps due to intrinsic or acquired drug resistance of patients (Abe 2013).
The novel immune‐mediated therapeutic options block the immunosuppressive cancer mechanisms culminating in the stimulation of the host antitumour immune response leading to long‐term, persistent tumour destruction (Draube 2011; Postow 2015).
This review summarizes pivotal studies reported since the last version of this review that demonstrate the superiority of targeted agents over IFN‐α as first‐line treatment (Coppin 2007; Hudes 2007; Motzer 2007), including studies focusing on the possible synergy between therapeutic vaccines and antiangiogenic agents (Amato 2010; Rini 2015), personalized immunotherapy (Figlin 2014), or immune checkpoint inhibitors against current standard therapy options (Motzer 2015a).
How the intervention might work
The better understanding of the tumour microenvironment and of T‐cell responses has led to the development of specific immunotherapeutic strategies and as such, a new class of cancer immunotherapy agents, known as immune checkpoint inhibitors, is at the focus for clinical application (Bedke 2014; Postow 2015). These agents mainly comprise of antibodies that target inhibitory molecules such as the cytotoxic T‐lymphocyte‐associated antigen 4 (CTLA‐4), or the programmed death protein 1 pathway (PD‐1 and its ligand PD‐L1). The expression of these inhibitory co‐receptors on T lymphocytes can cause complete suppression or weakening of the antitumour T‐cell responses. It is now recognized that people with mRCC characterized by PD‐1‐positive cancer‐infiltrating lymphocytes often have larger and more aggressive tumours (Thompson 2007). Furthermore, PD‐L1 expression by RCC cancer cells is often associated with a worse clinical outcome of these patients.
Vaccines are another alternative in immunotherapy for the treatment of mRCC. The aim of vaccines is the activation of immune cells to recognize and destroy tumour cells. Vaccination of RCC patients with synthetic peptides representing epitopes derived from tumour‐associated antigens (TAA) and recognized by T‐cell receptors has been shown to induce a well‐defined T‐cell response (Brookman‐May 2011; Dutcher 2013). Different vaccination strategies are under development including cell‐based vaccines that utilize either tumour cells or dendritic cells and cell‐free vaccines that are based on the application of TAA. Furthermore, studies have proposed that the addition of immune‐modulator drugs such as cyclophosphamide can enhance the infiltration of vaccine‐induced effector T cells into tumours (Walter 2012).
Why it is important to do this review
This Cochrane Review serves as the latest update of the Cochrane Review first published in 2000 and previously updated in 2005 and 2007 (Coppin 2000; Coppin 2005; Coppin 2007). In summary, the old review indicates that no cytokine‐based immunotherapy is significantly effective for advanced RCC. IFN‐α and high‐dose interleukin‐2 (HD‐IL‐2) are of unknown survival benefit prior to current first‐line therapy of mRCC with targeted agents. HD‐IL‐2 has been associated with durable complete responses in a small number of patients, but it is of limited use due to its severe toxicity. Furthermore, no clinical factors or biomarkers exist to accurately predict a durable response in patients treated with HD‐IL‐2 (McDermott 2015a). The update will focus on the current role of non‐specific cytokines and implementation of new, specific immunotherapeutic approaches for treatment of people with mRCC. Comparisons were made against the current standard of care options (Ljungberg 2015).
Despite the availability of targeted therapies inhibiting angiogenesis or signal transduction pathways, progress with these agents has reached a plateau and therapy remains non‐curative. Stadler 2014 refers to the 'maturing' of RCC therapy suggesting little progress has been made beyond fine‐tuning the choice and order of the targeted agents.
As a result of this as well as an enhanced understanding of the complex interaction between cancer and host cells (e.g. of the ability of cancer cells to evade immune surveillance or the efficacy of checkpoint inhibitors, such as ipilimumab and nivolumab), interest in immunotherapy has rekindled. Novel therapeutic options are focusing on the possible synergy between standard targeted therapy and immunotherapeutic agents or vaccine approaches (Combe 2015).
The key aims of this review were: 1. to determine the role of non‐specific and new immunotherapies in the development of standard of care guidelines and their place in the current management of mRCC and 2. determine which immunotherapeutic approach, either alone or in combination with standard targeted therapies, is the most efficient to maximize patient benefit. We focused on the entire body of evidence for our clinical question, as well as on patient‐important outcomes and used the GRADE approach to rate quality of evidence (Guyatt 2011a).
Objectives
To assess the effects of immunotherapies either alone or in combination with standard targeted therapies for the treatment of metastatic renal cell carcinoma and their efficacy to maximize patient benefit.
Methods
Criteria for considering studies for this review
Types of studies
We included randomized controlled trials (RCTs) and quasi‐RCTs with or without blinding. Trials were included regardless of their publication status and language of publication. We excluded cross‐over trials and cluster‐randomized trials.
Types of participants
Participants diagnosed with all types of histologically confirmed mRCC including stage IV (T4 any N M0, any T any N M1) (Sobin 2009; Wittekind 2012).
On one occasion, we permitted inclusion of locally advanced cancer patients in a single study that mostly included people with metastatic disease but we excluded studies that focused on locally advanced disease. Studies of mixed solid tumours were eligible only if participants with RCC were stratified and reported separately from other tumour types. In studies where participants had received prior systemic therapy or prior nephrectomy, such prior interventions were documented in the Characteristics of included studies table. We expected that most studies would have been performed in participants with clear‐cell histology (Escudier 2014), but we also included studies investigating histology other than clear‐cell RCC.
Types of interventions
We investigated comparisons of experimental intervention versus comparator interventions utilizing at least one immunotherapeutic agent. We included only studies that compared protocol‐defined immunotherapeutic, experimental interventions to standard treatment options (comparator interventions) as defined in current, evidence‐based guidelines for systemic therapy in people with mRCC (e.g. Escudier 2014; German Guideline Programme in Oncology 2015; Ljungberg 2015). We included trials independently of who, when or by whom the intervention was delivered.
Experimental interventions
-
ILs alone or combined with other immunotherapy or targeted therapies.
-
IFN‐α alone or combined with other immunotherapy or targeted therapies.
-
Vaccine treatment (dentritic cell (DC)‐mediated, Bacillus Calmette‐Guérin (BCG) with tumour antigen, tumour‐associated peptides) alone or in combination with other immunotherapy or targeted therapies.
-
Adoptive T‐cell therapies.
-
Targeted immunotherapy (checkpoint inhibitors) either alone or in combination with other immunotherapy or targeted therapies.
-
Other immunotherapies identified from the searches.
Comparator interventions
Current standard therapy in the form of:
-
targeted therapies in first‐, second‐ or third‐line therapies;
-
immunotherapies and targeted therapies (IFN‐α plus bevacizumab) in first‐line therapy.
Comparisons
-
IFN‐α alone versus standard targeted therapy in first‐line therapy of mRCC.
-
IFN‐α combined with targeted therapies versus standard targeted therapy in first‐line therapy of mRCC.
-
IFN‐α alone versus IFN‐α plus bevacizumab in first‐line therapy of mRCC.
-
IFN‐α plus bevacizumab versus standard targeted therapies in first‐line therapy of mRCC.
-
Vaccine treatment versus standard therapies in first‐line therapy of mRCC.
-
Targeted immunotherapies versus standard targeted therapy in previously treated patients with mRCC.
We identified no studies comparing current standard therapies against adoptive T‐cell therapies (experimental intervention 4) and other immunotherapies (experimental intervention 6).
Types of outcome measures
We did not use measurement of outcomes assessed in this review as an eligibility criterion.
Primary outcomes
-
Overall survival (OS) including one‐year mortality.
-
Quality of life (QoL).
-
Adverse events (AEs) (grade 3 or greater).
Secondary outcomes
-
Progression‐free survival (PFS) (progression may have been measured using clinical or radiological indices).
-
Tumour remission (both partial and complete remission).
Method and timing of outcome measurement
-
QoL: measured by cancer‐specific instruments such as the Functional Assessment of Cancer ‐ General (FACT‐G) and FACT‐Kidney Symptom Index (FKSI) questionnaires.
-
AEs (e.g. vascular leak syndrome, severe infections, severe influenza‐like symptoms): measured by the US National Cancer Institute's (NCI) Common Terminology Criteria for Adverse Events (CTCAE) criteria as worst grade per patient during treatment and follow‐up.
-
PFS: measured by Response Evaluation Criteria In Solid Tumours (RECIST) criteria during treatment until disease progression (Eisenhauer 2009).
-
Tumour remission: measured by RECIST criteria during treatment (Eisenhauer 2009).
If we were unable to retrieve the necessary information to analyse time‐to‐event outcomes, we attempted to assess the number of events per total for dichotomized outcomes at 12 months after randomization.
'Summary of findings' tables
We presented 'Summary of findings' tables reporting the following outcomes listed according to priority:
-
OS (one‐year mortality);
-
QoL;
-
AEs (grade 3 or 4);
-
tumour remission (both partial and complete remission).
We could not perform analyses to estimate absolute effects on the basis of time‐to‐event outcomes and, therefore, we used a predefined approach and describe relative and absolute effects based on one‐year mortality rates.
Search methods for identification of studies
We performed a comprehensive search with no restrictions on the language of publication or publication status.
Electronic searches
We searched the following sources from inception of each database and re‐ran the database search three months prior to the date of review submission.
-
Cochrane Library (via wiley.com; for search strategy, see Appendix 1, 15 April 2015, 16 February 2016, 27 October 2016):
-
Cochrane Central Register of Controlled Trials (CENTRAL);
-
Cochrane Database of Systematic Reviews (CDSR);
-
Database of Abstracts of Reviews of Effects (DARE);
-
Health Technology Assessment Database (HTA);
-
-
MEDLINE (via Ovid; see Appendix 2, 14 April 2015, 7 March 2016, 27 October 2016);
-
Embase (via Ovid; see Appendix 3, 14 April 2015, 3 March 2016, 16 November 2016).
We applied the Cochrane sensitivity‐maximizing RCT filter (Lefebvre 2011) to the MEDLINE (Ovid) search strategy (Appendix 2), and adaptations of it to remaining databases, except the Cochrane Library (16 April 2015).
We also searched:
-
ClinicalTrials.gov (www.clinicaltrials.gov/; see Appendix 4); 27 September 2015, 21 March 2016 and 5 November 2016;
-
World Health Organization (WHO) International Clinical Trials Registry Platform (ICTRP) search portal (apps.who.int/trialsearch/; see Appendix 5), a meta‐register of studies with links to numerous other trials registers; 27 September 2015, 21 March 2016 and 5 November 2016;
-
EORTC database of clinical trials and trials in which EORTC has been/is participating (www.eortc.be/protoc/listprot.asp?kind=sites&site=24; see Appendix 6); 27 September 2015, 21 March 2016 and 5 November 2016;
-
Web of Science Core Collection ‐ Meeting Abstracts (apps.webofknowledge.com/; from 2011; see Appendix 7); 16 April 2015 and 27 October 2016.
No additional relevant key words were detected during any of the electronic or other searches, so there was no need to modify our search strategies or incorporate any changes.
Searching other resources
We tried to identify other potentially eligible trials or ancillary publications by searching the reference lists of retrieved included trials, reviews, meta‐analyses and health technology assessment reports. In addition, we contacted authors of included trials to identify any further published or unpublished studies (including grey literature) that we may have missed. We contacted drug manufacturers for ongoing or unpublished trials in February and March 2016.
Data collection and analysis
Selection of studies
We used reference management software (EndNote and Citavi) to identify and remove potential duplicate records. Two review authors (IM, DR) independently scanned the abstract or title, or both, of remaining records retrieved, to determine which studies should be assessed further. Two review authors (IM, DR) investigated all potentially relevant records as full text, mapped records to studies, and classified studies as included studies, excluded studies, studies awaiting classification or ongoing studies in accordance with the criteria in the Cochrane Handbook for Systematic Reviews of Interventions (Higgins 2011a). We resolved any discrepancies through consensus or recourse to a third review author (SU or BS). If resolution of a disagreement was not possible, we designated the study as 'awaiting classification' and we contacted trial authors for clarification. We documented reasons for exclusion of studies that may have reasonably been expected to be included in the Cochrane Review in the Characteristics of excluded studies table. We presented an adapted PRISMA flow diagram showing the process of study selection (Liberati 2009; Figure 1).

Study flow diagram.
Data extraction and management
We developed a dedicated data abstraction form that was pilot tested ahead of time.
For trials that fulfilled inclusion criteria, two review authors (two of SU, IM, DR, AVH and FP) independently abstracted the following information from individual studies, which were provided in the Characteristics of included studies tables:
-
study design;
-
study dates (if dates were not available then this was reported as such);
-
study settings and country;
-
participant inclusion and exclusion criteria;
-
participant details, baseline demographics;
-
number of participants by study and by study arm;
-
details of relevant experimental and comparator interventions such as dose, route, frequency and duration;
-
definitions of relevant outcomes, and method and timing of outcome measurement as well as any relevant subgroups;
-
study funding sources;
-
declarations of interest by primary investigators.
We extracted outcome data relevant to this Cochrane Review as needed for calculation of summary statistics and measures of variance. For dichotomous outcomes, we attempted to obtain numbers of events and totals for population of a 2 × 2 table, and summary statistics with corresponding measures of variance. For continuous outcomes, we attempted to obtain means and standard deviations or data necessary to calculate this information. For time‐to‐event outcomes, we attempted to obtain hazard ratios (HRs) with corresponding measures of variance or data necessary to calculate this information; HRs and their confidence intervals (CIs) were estimated directly or indirectly from the published data as from reported log rank Chi2, log rank P values, from observed and expected event ratios, or survival curves (Parmar 1998; Tierney 2007; Williamson 2002).
We resolved any disagreements by discussion, or, if required, by consultation with a third review author (SU or IM).
We provided information including trial identifier, about potentially relevant ongoing studies in the Characteristics of ongoing studies table. We added references of the most recent abstracts or notifications in ClinicalTrials.gov.
We attempted to contact authors of included trials to obtain key missing data as needed.
Dealing with duplicate and companion publications
In the event of duplicate publications, companion documents or multiple reports of a primary study, we tried to maximize yield of information by mapping all publications to unique studies and collating all available data. We used the most complete data‐set aggregated across all known publications. In case of doubt, we gave priority to the publication reporting the longest follow‐up associated with our primary or secondary outcomes.
Assessment of risk of bias in included studies
Two review authors (two of SU, IM, DR, AVH and FP) assessed the risk of bias of each included study independently. We resolved disagreements by consensus or by consultation with a third review author (SU or IM).
We assessed risk of bias using Cochrane's 'Risk of bias' assessment tool (Higgins 2011b). We assessed the following domains:
-
random sequence generation (selection bias);
-
allocation concealment (selection bias);
-
blinding of participants and personnel (performance bias);
-
blinding of outcome assessment (detection bias);
-
incomplete outcome data (attrition bias);
-
selective reporting (reporting bias);
-
other sources of bias.
We judged risk of bias domains as 'low risk', 'high risk' or 'unclear risk' and evaluated individual bias items as described in the Cochrane Handbook for Systematic Reviews of Interventions (Higgins 2011b). We presented a 'Risk of bias' summary figure to illustrate these findings.
For performance bias (blinding of participants and personnel) and detection bias (blinding of outcome assessment), we evaluated the risk of bias separately for each outcome. We grouped outcomes according to whether measured subjectively or objectively when reporting our findings in the 'Risk of bias' tables.
We also assessed attrition bias (incomplete outcome data) on an outcome‐specific basis, and grouped outcomes with like judgements when reporting our findings in the 'Risk of bias' tables.
We further summarized the risk of bias across domains for each outcome in each included study as well as across studies and domains for each outcome.
We defined the following endpoints as subjective outcomes:
-
QoL;
-
AEs (grade 3 and 4) (e.g. vascular leak syndrome, severe infections, severe influenza‐like symptoms);
-
PFS;
-
tumour remission.
We defined OS as an objective outcome.
Measures of treatment effect
We expressed dichotomous data as risk ratios (RRs) with 95% CIs and continuous data as mean differences (MDs) with 95% CIs unless different studies use different measures to assess the same outcome, in which case we used standardized mean differences (SMDs) with 95% CIs. We expressed time‐to‐event data as HRs with 95% CIs. We used results from analyses, stratified by randomization strata or unstratified analyses and most objective results of central or independent reviews.
We used the following threshold for minimal important differences (MIDs):
-
EuroQol 5‐Dimension Index (EQ‐5D): 0.06‐0.08 (Pickard 2007);
-
EuroQol Visual Analogue Scale (EQ‐VAS): 7 (Pickard 2007);
-
FACT‐G: 4 points for better rating and 8 points for worse rating (Ringash 2007);
-
Functional Assessment of Cancer Therapy ‐ Biologic Response Modifier (FACT‐BRM): 2 points (Cella 1997);
-
FACT‐Kidney Symptom Index FKSI‐15: 3 points (Cella 1997);
-
FACT‐Kidney Symptom Index Disease Related Symptoms (FKSI‐DRS): 2 points (Cella 1997).
We qualified MDs above these MIDs as clinically important.
Unit of analysis issues
The unit of analysis was the individual participant.
We included two studies with more than two intervention groups and included pairs of interventions into different comparisons (Hudes 2007), and selected one pair of interventions to create single‐wise comparisons (Negrier 2011), according to guidance provided in the Cochrane Handbook for Systematic Reviews of Interventions (Higgins 2011c).
Dealing with missing data
We tried to obtain missing data from trial authors, if feasible, and performed intention‐to‐treat (ITT) analyses if data were available; we otherwise performed available‐case analyses. We investigated attrition rates (e.g. dropouts, losses to follow‐up and withdrawals), and critically appraised issues of missing data. We did not impute missing data.
Assessment of heterogeneity
In the event of excessive heterogeneity unexplained by subgroup analyses, we did not report outcome results as the pooled effect estimate in a meta‐analysis but we provided a narrative description of the results of each study.
We identified heterogeneity (inconsistency) through visual inspection of the forest plots to assess the amount of overlap of CIs, and the I2 statistic, which quantifies inconsistency across studies to assess the impact of heterogeneity on the meta‐analysis (Higgins 2002; Higgins 2003); we interpreted the I2 statistic as follows:
-
0% to 40%: may not be important;
-
30% to 60%: may indicate moderate heterogeneity;
-
50% to 90%: may indicate substantial heterogeneity;
-
75% to 100%: considerable heterogeneity.
When there was heterogeneity, the possible reasons for it were determined by examining individual study and subgroup characteristics.
Assessment of reporting biases
We attempted to obtain study protocols to assess selective outcome reporting.
We did not include 10 trials or more investigating a particular outcome therefore no funnel plots to assess small‐study effects and explanations for their asymmetry were presented.
Data synthesis
Due to the diversity of studies, differing in participant selection, treatment regimens and comparison groups, we did not expect a single study effect and thus, summarized data using a random‐effects model. We interpreted random‐effects meta‐analyses with due consideration of the whole distribution of effects. In addition, statistical analysis was performed according to the statistical guidelines contained in the Cochrane Handbook for Systematic Reviews of Interventions (Higgins 2011a). For dichotomous outcomes, we used the Mantel‐Haenszel method; for continuous outcomes, we used the inverse variance method and for time‐to‐event outcomes, we used the generic inverse variance method. We performed analyses with Review Manager 5 (RevMan 2014).
Subgroup analysis and investigation of heterogeneity
Since following consistently reported and used characteristics to introduce clinical heterogeneity was expected, we carried out subgroup analyses for all primary outcomes with investigation of interactions:
-
prior nephrectomy (yes versus no);
-
prior systemic therapies (yes versus no);
-
performance status (Eastern Cooperative Oncology Group (ECOG) Performance Status 0 or 1 versus greater than 1) or Karnofsky Performance Status (KPS) (90% to 100%; 70% to 80%; less than 70%);
-
risk prognosis (good/favourable (0) versus intermediate (1 to 2) versus poor prognosis (3 or greater) from the Motzer criteria (good (0) versus intermediate (1 to 2) versus poor prognosis (greater than 3)) (Motzer 2002) or the International Metastatic RCC Database Consortium (IMDC) criteria (Heng 2009; Heng 2013).
We did not use the test for subgroup differences in Review Manager 5 to compare subgroup analyses due to the insufficient number of available studies with prospectively planned subgroup analyses (RevMan 2014).
Sensitivity analysis
We calculated HRs as sensitivity analyses. We additionally planned to perform sensitivity analyses to explore the influence of the following factor (when applicable) on effect sizes of all primary outcomes, but we did not perform these analyses due to the small number of studies.
-
Restricting the analysis by taking into account risk of bias, by excluding studies at 'high' risk of bias and 'unclear' risk of bias.
'Summary of findings' tables
We present the overall quality of the evidence for the primary outcomes and tumour remission according to the GRADE approach, having taken into account five criteria not only related to internal validity such as risk of bias (Guyatt 2011b), publication bias (Guyatt 2011c), imprecision (Guyatt 2011d), and inconsistency (Guyatt 2011e), but also to external validity, such as directness of results (Guyatt 2011f). For each comparison, two review authors (SU, MN) independently rated the quality of evidence for each outcome as 'high', 'moderate', 'low' or 'very low' using GRADEpro GDT. Any discrepancies were resolved by consensus, or, if needed, by arbitration by a third review author (IM). For each comparison, we presented a summary of the evidence in a 'Summary of findings' table, which provides key information about the best estimate of the magnitude of the effect in relative terms and absolute differences for each relevant comparison of alternative management strategies; numbers of participants and studies addressing these outcomes and the rating of the overall confidence in effect estimates for each outcome (Guyatt 2011a; Schünemann 2011). If meta‐analysis was not possible, we presented results in a narrative 'Summary of findings' table.
Results
Description of studies
Results of the search
The literature search identified 4723 records, 18 additional records were identified through other sources including handsearching of reference lists of included studies, congress abstracts and articles identified by contacted experts. After removal of 107 duplicate records, we screened 4634 records, and assessed 145 full‐text articles for eligibility. We excluded 113 studies. Detailed reasons for exclusion are summarized in the Figure 1.
We included 32 publications. Out of these 32 publications, eight were primary publications and included in the meta‐analysis (Amato 2010; Escudier 2007; Hudes 2007; Motzer 2007; Motzer 2015a; Negrier 2011; Rini 2010; Rini 2015). We identified 18 secondary (Bellmunt 2008; Bracarda 2013; Castellano 2009; Cella 2008; Cella 2010; Cella 2016; Dutcher 2009; Escudier 2010; Figlin 2009; Kim 2015; Kwitkowski 2010; Melichar 2008; Motzer 2009; Oudard 2011; Patil 2012; Pickering 2009; Summers 2010; Yang 2010) and six preliminary publications or published study protocols (Escudier 2011; Motzer 2015b; Reddy 2006; Rini 2004; Rini 2008; Sharma 2015).
We included eight studies into six comparisons to current evidence‐based standard therapy with targeted therapies or IFN‐α plus bevacizumab. They compared IFN‐α monotherapy or IFN‐α combined with targeted therapy versus targeted standard therapy (Hudes 2007; Motzer 2007), IFN‐α alone with IFN‐α combined with bevacizumab (Escudier 2007; Rini 2010), or IFN‐α combined with bevacizumab with standard targeted therapy (Negrier 2011). In addition, Amato 2010 and Rini 2015 compared vaccine treatment with standard targeted therapies and one study compared targeted immunotherapy with a standard targeted therapy (Motzer 2015a). According to the review protocol, we included only comparisons with standard of care options and most studies from the last versions of this review were excluded (Coppin 2005; Coppin 2007). We identified 13 ongoing studies (EudraCT2016‐002170‐13; Figlin 2014; Hammers 2015; NCT00930033; NCT01984242; NCT02014636; NCT02089685; NCT02210117; NCT02420821; NCT02432846; NCT02684006; NCT02781506; NCT02853331).
Included studies
Since the introduction of targeted agents in the mid‐2000s, clear‐cell and non‐clear‐cell renal cancers have been recognized as distinct entities, and studies have been stratified for or have exclusively recruited these types separately. Similarly, it is now recognized that the magnitude or even the direction of benefit (Armstrong 2015) may depend on prognostic/predictive variables as in the low‐/intermediate‐/high‐risk categories as defined by Motzer 2002 for cytokines, and modified by Heng 2013 for targeted agents. We have examined studies by histological type and prognostic category where possible, that is where these are exclusive or stratified patient inclusion criteria. Line of therapy is discussed for phase III trials recruiting since the introduction of targeted agents.
In this review, we presented the results in groups related to the type of immunotherapy: IFN‐α alone or combined with targeted therapy as comparator to current standard of care treatment (two included studies), IFN‐α plus bevacizumab as standard of care option with IFN‐α or targeted therapies (three included studies), vaccines (two included studies) and checkpoint inhibitor therapy (one included study).
We included studies based on six different comparisons. All major information of these studies may be found in the Characteristics of included studies table.
Comparison 1. Interferon‐α alone versus standard targeted therapies in first‐line therapy of metastatic renal cell carcinoma
We included two phase III studies (Hudes 2007; Motzer 2007). Both studies were conducted worldwide as multicentre international parallel‐group RCTs with two (Motzer 2007) or three (Hudes 2007) treatment arms. Altogether, 1166 mRCC patients with no previous systemic therapies were randomized. All participants in Motzer 2007 and 80% of participants in Hudes 2007 had mRCC with a clear‐cell component. Participants had a comparable median age of 62 years, two‐thirds of the participants were male. Motzer 2007 restricted inclusion to participants with ECOG Performance Status 1 or less, Hudes 2007 included 82% of participants with KPS 70% or less. Memorial Sloan‐Kettering Cancer Center (MSKCC) risk score was poor in 72% of participants included in Hudes 2007, but only in 6% of participants in Motzer 2007. Neither study allowed prior systemic therapies. Most RCC patients had prior nephrectomy (67% in Hudes 2007 and 90% in Motzer 2007). In both studies, altogether 582 participants were randomized to IFN‐α monotherapy. Participants in the control groups were treated with targeted drugs such as temsirolimus (209 participants in Hudes 2007) or sunitinib (375 participants in Motzer 2007). Participants in Motzer 2007 received IFN‐α at a dose of 9 milli‐International Units (MIU) given subcutaneously three times weekly. In Hudes 2007, temsirolimus was administered as a weekly intravenous infusion of 25 mg and IFN‐α 3 MIU (with an increase to 18 MIU) subcutaneously three times weekly.
Comparison 2. Interferon‐α combined with targeted therapies versus standard targeted therapies in first‐line therapy of metastatic renal cell carcinoma
We included one phase III study (Hudes 2007). The study was conducted worldwide as a multicentre international parallel‐group RCT with three treatment arms (Hudes 2007). One comparison was included into comparison 1, the second into comparison 2. The control group from Hudes 2007 was included in both comparisons. Altogether, 419 mRCC patients with no previous systemic therapies were randomized. See 'Comparison 1. IFN‐α alone versus standard targeted therapies in first‐line therapy of mRCC' for baseline characteristics of this study. A total of 210 participants were randomized to therapy with IFN‐α plus temsirolimus and 209 participants in the control group were treated with temsirolimus alone. The dose of temsirolimus for combination with IFN‐α (6 MIU) was 15 mg and therefore more than 40% lower than the dose of the monotherapy arm.
Comparison 3. Interferon‐α alone versus interferon‐α plus bevacizumab in first‐line therapy of metastatic renal cell carcinoma
We included two studies (Escudier 2007; Rini 2010). Both studies were conducted as two‐arm parallel‐group international and multicentre RCTs in Europe, Asia and Australia (Escudier 2007), or North America (Rini 2010). The studies randomized 1381 mRCC patients with no previous systemic therapy. All participants had clear‐cell mRCC with a comparable median age between 60 and 62 years and two‐thirds were male. Nearly all participants had good performance status (ECOG Performance Status 0 or 1) with favourable and intermediate‐risk score. In total, 690 participants were treated with IFN‐α alone and 691 participants were treated with IFN‐α plus bevacizumab. The studies were slightly different in design. The Escudier 2007 trial (AVOREN; Avastin and Roferon in Renal Cell Carcinoma) was designed as a double‐blind study and included a placebo control. Furthermore, all participants in AVOREN were post nephrectomy, whereas in the CALGB (Cancer and Leukemia Group B) trial, only 85% were nephrectomized.
Comparison 4. Interferon‐α plus bevacizumab versus standard targeted therapies in first‐line therapy of metastatic renal cell carcinoma
We included one study (Negrier 2011). This study was conducted as a parallel‐group, multicentre national RCT in France (Negrier 2011), mainly to evaluate the combination of temsirolimus plus bevacizumab to improve treatment efficacy. They randomized participants into three treatment arms (Negrier 2011), but only the comparisons of two of them met the inclusion criteria of our review and were included. In total, 83 mRCC patients with no previous systemic treatment for mRCC were randomized. Nearly all participants had clear‐cell mRCC. Participants had a comparable median age of about 62 years and 71% of them were male. Most participants (88%) had an ECOG Performance Status 0 or 1, had undergone nephrectomy (91%) and intermediate (47%) or favourable (31%) risk prognosis. Forty‐one participants received IFN‐α plus bevacizumab and 42 participants received targeted monotherapy with sunitinib (Negrier 2011).
Comparison 5. Vaccine treatment versus standard therapies in first‐line therapy of metastatic renal cell carcinoma
Two studies investigated the efficacy of two different vaccines in comparison to targeted therapy with standard‐of‐care in first‐line therapy of mRCC according to local practice including sunitinib (Amato 2010; Rini 2015). Both studies were conducted in Europe and the US as multicentre, international, two‐arm, parallel‐group RCTs and randomized 1071 mRCC patients with no previous systemic therapies. All participants had clear‐cell mRCC. Participants had a median age of 60 years, two‐thirds of the participants were male and most of them had undergone nephrectomy. Nearly all participants in Rini 2015 had favourable or intermediate‐risk prognosis and only 13% had a KPS of 80 or lower. However, 26% of participants had a poor‐risk prognosis in Amato 2010 and 30% had a KPS performance status of 80. In total, 365 participants were treated with MVA‐5T4 (Amato 2010), 204 participants with IMA901 (Rini 2015), and 502 participants with placebo or no additional treatment to standard‐of‐care according to local practice.
Comparison 6. Targeted immunotherapy alone versus targeted standard therapy in previously treated patients with metastatic renal cell carcinoma
We included one study (Motzer 2015a). This study was conducted worldwide as a parallel‐group, international, multicentre RCT. A total of 821 participants with advanced or metastatic RCC with a clear‐cell component and a median age of 62 years were included and 75% of them were male. Nearly all participants had a KPS of 70 or more and prior nephrectomy. All participants had prior systemic treatment for mRCC with sunitinib, pazopanib or axitinib. A total of 410 participants were treated with nivolumab and 411 with everolimus. Two additional studies assessed the dose‐response relationship, activity and safety of this targeted immunotherapy in phase I and phase II RCTs (Choueiri 2014; Motzer 2015c).
Excluded studies
We assessed 210 full‐text articles for eligibility and excluded 178 of them. Exclusion criteria are summarized in the Characteristics of excluded studies table and include:
-
not randomized trials (Amato 2009; Amin 2015; Bromwich 2002; Harlin 2004; Wang 2015; Yang 2007);
-
mostly no mRCC (stage IV) patients (including adjuvant studies) (Atzpodien 2005; Clark 2003; Fenton 1996; Galligioni 1996; Jocham 2004; Majhail 2006; Passalacqua 2014; Pizzocaro 2001; Messing 2003; Soret 1996; Wood 2008; Zhan 2012);
-
studies of mixed solid tumours with no separate analysis of mRCC patients (Dillman 2003; Du Bois 1997; Margolin 1997; Smith 2003);
-
no immunotherapeutic intervention (Keefe 2015; Negrier 2010; Powles 2015; Rini 2012; Sternberg 2013);
-
no comparison to current standard therapy as defined in review protocol (Aass 2005; Adler 1987; Atkins 1993; Atzpodien 2001; Atzpodien 2004; Atzpodien 2006; Boccardo 1998; Borden 1990; Bracarda 2013; Brinkmann 2004; Buzogany 2001; Choueiri 2014; Creagan 1991; De Mulder 1995; Dexeus 1989; Donskov 2006; Dudek 2008; Dutcher 2003; Edsmyr 1985; Elkord 2013; Escudier 2009; Figlin 1999; Flanigan 2001; Foon 1988; Fosså 1992; Fosså 2004; Fujita 1992; Gleave 1998; Gore 2010; Henriksson 1998; Jayson 1998; Jonasch 2010; Kempf 1986; Kinouchi 2004; Kirkwood 1985; Koretz 1991; Kriegmair 1995; Law 1995; Lissoni 1993; Lissoni 2000;Lissoni 2003; Liu 2012; Lummen 1996; McCabe 1991; McDermott 2005; Mickisch 2001; Motzer 2000; Motzer 2001; Motzer 2015c; MRCRCC 1999; Muss 1987; Naglieri 1998; NCT00352859; Negrier 1998; Negrier 2000; Negrier 2007; Negrier 2008; Neidhart 1991; Osband 1990; Otto 1988; Passalacqua 2010; Patel 2008; Pedersen 1980; Porzsolt 1988; Procopio 2011; Pyrhönen 1999; Quesada 1985; Radosavljevic 2000; Ravaud 2015; Rini 2014; Rosenberg 1993; Rossi 2010; Sagaster 1995; Scardino 1997; Schwaab 2000; Simons 1997; Steineck 1990; Tannir 2006; Tsavaris 2000; Walter 2012; Weiss 1992; Witte 1995; Yang 1995; Yang 2003; Zhao 2015);
-
stopped early due to slow accrual, no data analysis performed (NCT00678288).
Risk of bias in included studies
Risk of bias of all included studies is summarized in Figure 2 and Figure 3.

Risk of bias summary: review authors' judgements about each risk of bias item for each included study.

Risk of bias graph: review authors' judgements about each risk of bias item presented as percentages across all included studies.
Allocation
Random sequence generation
Sequence generation was at low risk of bias in five studies (Escudier 2007; Motzer 2007; Motzer 2015a; Negrier 2011; Rini 2010), and unclear risk of bias in three studies. Six studies described blocked randomization. All studies used a stratified randomization procedure stratified by region, prognostic risk group, prior therapy (nephrectomy or antiangiogenic therapies) or performance score.
Allocation concealment
Allocation concealment was at low risk of bias in four studies (Escudier 2007; Motzer 2015a; Negrier 2011;Rini 2015), and information was missing in four studies. These studies used central allocation based on an interactive voice recognition system (Hudes 2007), fax or email (Rini 2015), or reported no more detailed information.
Blinding
Blinding of participants and personnel
Two studies were double‐blind, placebo‐controlled trials with the same route and timing of administration of placebo and the intervention and blinding of participants and study personnel (Amato 2010; Escudier 2007). We judged these studies at low risk of performance and detection bias for subjective outcomes (QoL, AEs, PFS and tumour remission) and judged all remaining studies at high risk of bias. Of the three studies in this review that reported formal QoL assessment, none were double‐blind, making this outcomes of questionable reliability (Hudes 2007; Motzer 2007; Motzer 2015a).
We judged all studies at low risk of bias for objective outcomes (OS).
Blinding of outcome assessment
Four studies described blinded or independent outcome assessment of subjective outcomes (Amato 2010; Escudier 2007; Motzer 2007; Negrier 2011). These studies were at low risk of bias in respect to subjective outcomes. High risk of bias was judged if treatment effects of blinded assessment were not shown (Hudes 2007), and in non‐blinded studies without independent assessment of tumour remission and PFS (Motzer 2015a; Rini 2010; Rini 2015).
We considered a double‐blind design for subjective outcomes such as QoL. Of the three studies included in this review that reported formal QoL assessment, none were double‐blind making this outcome of questionable reliability; therefore, we discussed QoL outcomes separately.
We downgraded the quality of evidence for our subjective outcomes (e.g. QoL, AEs) for risk of bias due to no double blinding or blinded assessment of these outcomes in all comparisons (summary of findings Table for the main comparison; summary of findings Table 2; summary of findings Table 3; summary of findings Table 4; summary of findings Table 5; summary of findings Table 6).
We judged the assessment of objective outcomes (OS) in all studies at low risk of bias.
Incomplete outcome data
Treatment effects for OS and PFS were based on the analysis of all randomized participants according to randomization with high completeness and no differences in censoring between treatment groups and were judged as low risk of bias in all included studies.
Safety analysis was based in all studies on all treated participants.
Tumour remission was completely reported for all participants with measurable disease and postbaseline tumour assessment in four studies with no differences between groups (Amato 2010, Escudier 2007, Negrier 2011; Rini 2015). These studies were at low risk of bias. Three studies reported differences in the number of tumour assessments between treatment groups (Hudes 2007; Motzer 2007; Motzer 2015a). These studies were at high risk of bias. One study reported no numbers of participants with tumour assessment and we judged it at unclear risk of bias (Rini 2010).
Four studies of two trials reported QoL with low risk of bias due to high completion rates (greater than 90%) and small differences between treatment groups (Motzer 2007; Motzer 2015a). Risk of bias was unclear due to missing completion rates and differences in completion between groups in one study (Hudes 2007).
Selective reporting
Five studies stated no differences between outcomes planned in the protocol and those reported (Hudes 2007; Motzer 2007; Motzer 2015a; Rini 2010; Rini 2015). Therefore, these studies were at low risk of bias. We could not rule out high risk of bias due to selective reporting in two studies due to missing reports of preplanned outcomes as PFS (Amato 2010), long‐term OS (Negrier 2011), and QoL (Negrier 2011).
Other potential sources of bias
Four studies identified other potential sources of bias. These sources included the frequent use of second‐line therapies after progression (Amato 2010; Escudier 2007; Negrier 2011; Rini 2010), permitted cross‐over to the intervention group (Motzer 2007; Motzer 2015a), and the use of a blocked randomization in centres in an unblinded trial (Negrier 2011).
We downgraded the quality of evidence for one‐year mortality for risk of bias in all comparisons where participants with progressive disease frequently crossed over to the comparison arm, where a relevant amount of participants received second‐line systemic anticancer therapies subsequent to progression (summary of findings Table for the main comparison; summary of findings Table 3; summary of findings Table 5), or where studies were stopped for early benefit and participants were permitted to cross over from the control to the intervention groups during follow‐up for OS (summary of findings Table 6).
Effects of interventions
See: Summary of findings for the main comparison Interferon‐α alone versus standard targeted therapies (sunitinib or temsirolimus) in first‐line therapy of metastatic renal cell carcinoma; Summary of findings 2 Interferon‐α combined with targeted therapies versus standard targeted therapy in first‐line therapy of metastatic renal cell carcinoma; Summary of findings 3 Interferon‐α alone versus interferon‐α plus bevacizumab in first‐line therapy of metastatic renal cell carcinoma; Summary of findings 4 Interferon‐α plus bevacizumab versus standard targeted therapies in first‐line therapy of metastatic renal cell carcinoma; Summary of findings 5 Vaccine treatment versus standard therapies in first‐line therapy of metastatic renal cell carcinoma; Summary of findings 6 Targeted immunotherapy alone versus standard targeted therapies in previously treated patients with metastatic renal cell carcinoma
Comparison 1. Interferon‐α alone versus standard targeted therapies in first‐line therapy of metastatic renal cell carcinoma
Two studies with 1376 participants compared the efficacy and safety of IFN‐α monotherapy with targeted therapies (Hudes 2007; Motzer 2007). In this comparison, we evaluated 1166 participants. The intervention group received IFN‐α monotherapy and had 582 participants (Hudes 2007, 207 participants; Motzer 2007, 375 participants), and the control group received standard targeted therapies as sunitinib (Motzer 2007, 375 participants) and temsirolimus (Hudes 2007, 209 participants).
1.1. Overall survival
In total, 191/582 (33%) participants treated with IFN‐α alone died within one year after randomization compared to 149/584 (26%) participants with targeted therapies (RR 1.30, 95% CI 1.13 to 1.51; Figure 4). We applied this RR to participants with mRCC and low‐risk score (favourable) one‐year mortality rates of 150/1000 participants, moderate‐risk score of 280/1000 participants and high‐risk score of 550/1000 participants with standard targeted therapies. These numbers are probably increased by 45 deaths/1000 (from 20 more to 76 more) in low‐risk participants, 84 deaths/1000 (from 36 more to 143 more) in moderate‐risk participants and 165 deaths/1000 (from 71 more to 280 more) in high‐risk participants if they were treated with IFN‐α as monotherapy (summary of findings Table for the main comparison).

Forest plot of comparison: 1 Interferon‐α (IFN‐α) alone versus standard targeted therapy in first‐line therapy of metastatic renal cell carcinoma, outcome: 1.1 1‐year mortality.
Treatment effects of both studies were comparable with no important statistical heterogeneity (I2 = 0%), but the two trials varied in median survival and one‐year mortality rates. In Motzer 2007, median OS was 21.8 months with IFN‐α alone versus 26.6 months with targeted therapies and one‐year mortality was 12% with IFN‐α alone versus 10% with targeted therapies. In contrast, in Hudes 2007 who included participants with a worse risk prognosis, median OS was only 7.3 months with IFN‐α alone versus 10.9 months with temsirolimus with one‐year mortality of approximately 70% with IFN‐α alone versus 53% with temsirolimus (Table 1; Figure 4). Subgroup analyses in Hudes 2007 suggested a higher benefit from targeted therapies for participants with a low performance status (KPS 70 or less) or no prior nephrectomy (Table 2).
| Study ID | Comparison (group 1 vs group 0) | Median OS (95% CI) (months) | 1‐year mortality | Comments | ||
| Group 1 | Group 0 | Group 1 | Group 0 | |||
| 1 (IFN‐α alone vs standard targeted therapies) | 7.3 (6.1 to 8.8) | 10.9 (8.6 to 12.7) | 70% | 53% | From curves. | |
| 21.8 (17.9 to 26.9) | 26.4 (23.0 to 32.9) | 12.3% | 10.1% | Numbers reported. | ||
| 2 (IFN‐α + targeted therapies vs standard targeted therapies) | 8.4 (6.6 to 10.3) | 10.9 (8.6 to 12.7) | 60% | 53% | From curves. | |
| 3 (IFN‐α alone vs IFN‐α + bevacizumab) | 21.3 | 23.3 | 32% | 26% | From curves. | |
| 17.4 (14.4 to 20.0) | 18.3 (16.5 to 22.5) | 39% | 34% | From curves with numbers and censoring marks. | ||
| 4 (IFN‐α + bevacizumab vs standard targeted therapies) | Not reported | Not reported | 10% | 26% | Reported. | |
| 5 (Vaccine treatment vs standard therapies) | 19.2 | 20.1 | 35% | 33% | From curves with censoring. | |
| 33.1 | Not reached | 17% | 22% | Numbers reported. | ||
| 6 (Targeted immunotherapy alone vs targeted standard therapy) | 25.0 (21.8 to NE) | 19.6 (17.6 to 23.1) | 24% | 34% | From curves with numbers with censoring marks. | |
CI: confidence interval; IFN‐α: interferon‐α; NE: not estimable; OS: overall survival.
| Comparison (group 1 vs group 0) | Study | Subgroup | Sample size | Treatment effects (95% CI) or P values |
| 1 (IFN‐α alone vs standard targeted therapies) | Prior nephrectomy | 278 | HR 1.2 (0.9 to 1.6) | |
| Prior nephrectomy | 674 | HR 1.2 (0.95 to 1.5) | ||
| Pooled | Prior nephrectomy | 952 | HR 1.2 (1.0 to 1.43), I2 = 0% | |
| No prior nephrectomy | 138 | HR 1.7 (1.1 to 2.5) | ||
| No prior nephrectomy | 76 | HR 1.23 (0.8 to 2.1) | ||
| Pooled | No prior nephrectomy | 214 | HR 1.48 (1.1 to 2.0), I2 = 1% | |
| KPS ≤ 70 | 340 | HR 1.39 (1.11 to 1.75) | ||
| KPS > 70 | 75 | HR 0.93 (0.53 to 1.67) | ||
| With poor risk | 48 | HR 1.15 (0.83 to 2.78) | ||
| Intermediate risk | 421 | HR 1.27 (1.00 to 1.62) | ||
| ECOG Performance Status 0 | 460 | HR 1.1 (0.87 to 1.5) | ||
| ECOG Performance Status 1 | 290 | HR 1.4 (1.05 to 1.7) | ||
| 3 (IFN‐α alone vs IFN‐α + bevacizumab) | Favourable risk | 180 | HR 1.09 (0.73 to 1.61), P = 0.6798 | |
| Favourable risk | 192 | HR 1.11 (0.8 to 1.56), P = 0.5189 | ||
| Pooled | Favourable risk | 372 | HR 1.10 (0.85 to 1.43), I2 = 0% | |
| Intermediate risk | 392 | HR 1.20 (0.95 to 1.54), P = 0.1230 | ||
| Intermediate risk | 465 | HR 1.15 (0.94 to 1.41), P = 0.1688 | ||
| Pooled | Intermediate risk | 857 | HR 1.18 (1.01 to 1.37), I2 = 0% | |
| Poor risk | 59 | HR 1.18 (0.68 to 2.04), P = 0.5594 | ||
| Poor risk | 75 | HR 1.33 (0.82 to 2.17), P = 0.2439 | ||
| Pooled | Poor risk | 124 | HR 1.27 (0.88 to 1.82), I2 = 0% | |
| Prior nephrectomy | 620 | HR 1.10 (0.93 to 1.32), P = 0.2871 | ||
| No prior nephrectomy | 112 | HR 1.54 (1.02 to 2.27), P = 0.0381 | ||
| 5 (Vaccine treatment vs standard therapies) | Favourable risk, treated with IL‐2 (SOC) | 100 | HR 0.54 (0.30 to 0.98), P = 0.046 | |
| Favourable risk, treated with IFN‐α (SOC) | 206 | P > 0.05 | ||
| Good prognosis, treated with sunitinib (SOC) | 119 | P > 0.05 | ||
| Intermediate prognosis, treated with IL‐2 (SOC) | 70 | P > 0.05 | ||
| Intermediate prognosis, treated with IFN‐α (SOC) | 169 | P > 0.05 | ||
| Intermediate prognosis, treated with sunitinib (SOC) | 65 | P > 0.05 | ||
| Favourable risk (n = 92) | 92 | HR 0.82, P = 0.59 | ||
| Intermediate risk (n = 240) | 240 | HR 1.52, P < 0.05 | ||
| 6 (Targeted immunotherapy alone vs standard targeted therapies) | Favourable risk group (MSKCC risk group) | 293 | HR 0.89 (0.59 to 1.32) | |
| Intermediate risk group (MSKCC risk group) | 404 | HR 0.76 (0.58 to 0.99) | ||
| Poor risk group (MSKCC risk group) | 124 | HR 0.47 (0.30 to 0.73) | ||
| 1 previous antiangiogenic regimen | 591 | HR 0.71 (0.56 to 0.90) | ||
| 2 previous antiangiogenic regimens | 230 | HR 0.89 (0.61 to 1.29) |
CI: confidence interval; ECOG: Eastern Cooperative Oncology Group; HR: hazard ratio; IFN‐α: interferon‐α; IL: interleukin; KPS: Karnovsky Performance Score; MSKCC: Memorial Sloan‐Kettering Cancer Center; n: number of participants; SOC: standard of care.
The pooled HRs for OS of 1.28 (95% CI 1.10 to 1.49; Analysis 1.2) stated a better OS in participants treated with standard targeted therapies compared to IFN‐α alone.
1.2. Quality of life
Motzer 2007 reported QoL based on approximately 95% of 750 included participants. Participants in the IFN‐α arm reported similar QoL with no clinically important differences in all QoL assessments compared to standard targeted therapies during treatment.
FACT‐G assessment stated lower mean postbaseline scores by ‐5.58 points (95% CI ‐7.24 to ‐3.91). Across all treatment cycles, the overall MD in scores of FKSI assessments were slightly lower with IFN‐α compared to sunitinib by an MD of ‐3.27 points (95% CI ‐4.18 to ‐2.36) for FKSI‐15 and by an MD of ‐1.98 points (95% CI ‐2.51 to ‐1.46) for FKSI‐DRS (Motzer 2007). These differences were stated by EuroQol assessment with an overall MD of ‐0.0364 points (95% CI ‐0.0620 to ‐0.0109) in EQ‐5D score and ‐4.74 points (95% CI ‐6.87 to ‐2.60) for EQ‐VAS with lower values with IFN‐α alone.
In addition, treatment effects on the mean last score from Hudes 2007 stated a slightly lower (least favourable) score in all EQ‐5D assessments in the IFN‐α group compared to the temsirolimus group: the mean EQ‐5D index score at the last measure was lower in the IFN‐α arm compared to the temsirolimus arm by ‐0.099 points (95% CI ‐0.162 to ‐0.036) and the mean EQ‐VAS was lower by ‐4.50 points (95% CI ‐8.184 to ‐0.819).
Pooled treatment effects of EQ‐5D and EQ‐VAS stated similar QoL with IFN‐α and standard therapies (Table 3; Analysis 1.3).
| Comparison (group 1 vs group 0) | Study (reported in) | Measurement instrument | Group 1 | Group 0 | Favours | Difference (95% CI) or P values |
| 1 (IFN‐α alone vs standard targeted therapies) | Motzer 2007 (reported in Cella 2008) | FACT‐G total score, mean postbaseline score over 17 weeks | 76.8 (n = 357) | 82.3 (n = 373) | Group 0 | ‐5.58 (‐7.25 to ‐3.91) |
| Motzer 2007 (reported in Cella 2008) | FKSI‐15, mean postbaseline score over 17 weeks | 42.1 (n = 357) | 45.3 (n = 373) | Group 0 | ‐3.27 (‐4.18 to ‐2.36) | |
| Motzer 2007 (reported in Cella 2008) | FKSI‐DRS, mean postbaseline score over 17 weeks | 27.4 (n = 357) | 29.4 (n = 373) | Group 0 | ‐1.98 (‐2.51 to ‐1.46) | |
| Hudes 2007, (reported in Yang 2010) | EQ‐5D Index, mean score on treatment | 0.492 (n = 115) | 0.590 (n = 157) | Group 0 | ‐0.099 (95% CI ‐0.162 to ‐0.036) | |
| Motzer 2007 (reported in Cella 2008) | EQ‐5D Index, mean postbaseline score over 17 weeks | 0.725 (n = 357) | 0.762 (n = 373) | Group 0 | ‐0.0364 (‐0.0620 to ‐0.0109) | |
| Pooled EQ‐5D | 472 | 530 | Group 0 | ‐0.06 (‐0.12 to 0), I2 = 69% | ||
| Hudes 2007, (reported in Yang 2010) | EQ‐VAS, mean score on treatment | 58.83 (n = 115) | 63.33 (n = 157) | Group 0 | ‐4.50 (‐8.184 to ‐0.819) | |
| Motzer 2007, (reported in Cella 2008) | EQ‐VAS, mean postbaseline score over 17 weeks | 68.7 (n = 357) | 73.4 (n = 373) | Group 0 | ‐4.74 (‐6.87 to ‐2.60) | |
| Pooled EQ‐VAS | 472 | 530 | Group 0 | ‐4.68 (‐6.53 to ‐2.83), I2 = 0% | ||
| 6 (Targeted immunotherapy alone vs standard targeted therapies) | Motzer 2015a (reported in Cella 2016) | FKSI‐DRS, mean score at baseline | 30.2 ± 4.4 (n = 362) | 30.1 ± 4.8 (n = 344) | ‐ | Difference in mean change 1.6 (1.4 to 1.9), P < 0.0001 |
| FKSI‐DRS, mean change from baseline to week 28 | 0.4 ± 5 (n = 164) | ‐1.2 ± 4 (n = 122) | Group 1 | |||
| FKSI‐DRS, mean change from baseline to week 52 | 1.6 ± 4 (n = 97) | ‐1.0 ± 6 (n = 63) | Group 1 | |||
| FKSI‐DRS, mean change from baseline to week 104 | 3.5 ± 4.1 (n = 20) | 0.2 ± 6 (n = 9) | Group 1 | |||
| Clinically important improvement from baseline by ≥ 2 FKSI‐DRS points | 200 (55%)/361 | 126 (37%)/343 | Group 1 | RR 1.51 (1.28 to 1.78); P < 0.0001 | ||
| Time to clinically important improvement ≥ 2 FKSI‐DRS points | Median: 4.7 months (3.7 to 7.5) | Median not reached | Group 1 | HR 1.66 (1.33 to 2.08); P < 0.0001 | ||
| Clinically important improvement from baseline by ≥ 3 FKSI‐DRS points | 148 (41%)/361 | 95 (28%)/343 | Group 1 | RR 1.48 (1.20 to 1.83); P = 0.0002 | ||
| Time to clinically important improvement ≥ 3 FKSI‐DRS points | Median not estimable | Median not estimable | Group 1 | HR 1.61 (1.24 to 2.09); P < 0.0003 | ||
| EQ‐5D utility index, mean score at baseline | 0.78 ± 0.24 (n = 362) | 0.78 ± 0.21 (n = 344) | ‐ | No significant differences in proportion of participants with clinical important improvements (P = 0.070) or time to improvement (P = 0.86). | ||
| EQ‐5D utility index, mean change from baseline to week 28 | 0.052 ± 0.22 (n = 164) | ‐0.03 ± 0.2 (n = 122) | Group 1 | |||
| EQ‐5D utility index, mean change from baseline to week 52 | 0.06 ± 0.1 (n = 98) | ‐0.01 ± 0.2 (n = 63) | Group 1 | |||
| EQ‐5D utility index, mean change from baseline to week 104 | 0.13 ± 0.7 (n = 20) | ‐0.02 ± 0.15 (n = 9) | Group 1 | |||
| EQ‐5D VAS, mean score at baseline | 73.3 ± 18.5 (n = 362) | 72.5 ± 18.7 (n = 344) | ‐ | ‐ | ||
| EQ‐5D VAS, mean change from baseline to week 28 | 5 ± 13 (n = 164) | ‐3 ± 11 (n = 122) | Group 1 | ‐ | ||
| EQ‐5D VAS, mean change from baseline to week 52 | 7 ± 15 (n = 98) | ‐2 ± 16 (n = 63) | Group 1 | ‐ | ||
| EQ‐5D VAS, mean change from baseline to week 104 | 9 ± 9 (n = 20) | 1 ± 18 (n = 9) | Group 1 | ‐ | ||
| Clinically important improvement from baseline by ≥ 7 EQ‐5D VAS points | 192 (53%)/360 | 134(39%)/343 | ‐ | RR 1.37 (1.16 to 1.61); P = 0.0001 | ||
| Time to clinically important improvement | Median: 6.5 months (3.9 to 12.2) | Median: 23.1 months (15.4 to not estimated) | ‐ | HR 1.37 (1.10 to 1.71) |
CI: confidence interval; EQ‐5D Index: EuroQol 5‐Dimension (MID 0.06 to 0.08, Pickard 2007); EQ‐VAS: EuroQol Visual Analog Scale (MID 7, Pickard 2007); FACT‐G: Functional Assessment of Cancer Therapy ‐ General (MID 4 points for better rating and 8 points for worse rating, Ringash 2007); FKSI‐15: FACT‐Kidney Symptom Index (MID 3 points, Cella 1997); FKSI‐DRS: FACT‐Kidney Symptom Index Disease Related Symptoms (MID 2 points, Cella 1997); HR: hazard ratio; MID: minimal important difference; n: number of participants.
Summarizing these results, the treatment options may lead to similar QoL.
1.3. Adverse events (grade 3 or greater)
One study reported the total number of participants with AEs (grade 3 or greater) based on 408 participants (Hudes 2007). AEs occurred in 78% of participants with IFN‐α alone compared to 67% of participants with temsirolimus alone (RR 1.17, 95% CI 1.03 to 1.32; Analysis 1.4). We applied these RRs to participants with mRCC with a mean risk of AEs (grade 3 or greater) in 668/1000 participants in the temsirolimus group. These number may be slightly increased by 114/1000 participants (from 20 more to 214 more), if they are treated with IFN‐α alone instead of standard targeted therapies (summary of findings Table for the main comparison).
Asthenia was the most common AE grade 3 or greater. Similar numbers of participants reported dyspnoea, diarrhoea, nausea or vomiting, but more participants with temsirolimus had mild‐to‐moderate rash (0% with IFN‐α alone versus 4% with temsirolimus alone), peripheral oedema, hyperglycaemia and hyperlipidaemia (Hudes 2007).
Motzer 2007 reported higher proportions of participants with treatment‐related fatigue (grade 3 or greater) in the IFN‐α group than in the sunitinib group (12% with IFN‐α versus 7% with sunitinib). In contrast, participants in the sunitinib group had higher rates of grade 3 diarrhoea (0% with IFN‐α versus 5% with sunitinib), vomiting (1% with IFN‐α versus 4% with sunitinib), hypertension (1% with IFN‐α versus 8% with sunitinib), hand‐foot syndrome (0% with IFN‐α versus 5% with sunitinib), leukopenia (7% with IFN‐α versus 12% with sunitinib), neutropenia (2% with IFN‐α versus 5% with sunitinib) and thrombocytopenia (0% with IFN‐α versus 8% with sunitinib).
1.4. Progression‐free survival
PFS was inferior with IFN‐α compared to targeted therapies with no important heterogeneity between studies (HR 2.23, 95% CI 1.79 to 2.77; Analysis 1.5). Hudes 2007 also compared IFN‐α plus temsirolimus versus temsirolimus alone and there were no differences between groups (HR 1.09, 95% CI 0.90 to 1.31).
1.5. Tumour remission
Both studies reported tumour remission based on 1007 participants. Fewer participants showed treatment response with IFN‐α compared to targeted therapies in both studies with a pooled RR of 0.30 (95% CI 0.12 to 0.75); there was substantial heterogeneity between studies (I2 = 73%). In Motzer 2007, 6% of RCC participants showed response with IFN‐α versus 31% with sunitinib whereas the overall response rates were much lower in Hudes 2007 with 5% of participants treated with IFN‐α versus 9% with temsirolimus.
Comparison 2. Interferon‐α combined with targeted therapies versus standard targeted therapies in first‐line therapy of metastatic renal cell carcinoma
One study with 419 participants (210 in the intervention group and 209 in the control group) compared the efficacy of IFN‐α plus temsirolimus with temsirolimus alone (Hudes 2007).
2.1. Overall survival
A total of 126/210 participants treated with IFN‐α plus temsirolimus died compared to 111/209 participants treated with temsirolimus alone (RR 1.13, 95% CI 0.95 to 1.34; Analysis 2.1). We applied this RR to participants with mRCC and low‐risk score (favourable) one‐year mortality rates of 150/1000 participants, moderate‐risk score of 280/1000 participants and high‐risk score of 550/1000 participants with standard targeted therapies, respectively. These numbers are probably not changed (summary of findings Table 2).
The median OS was 8.4 months with IFN‐α plus temsirolimus and 10.9 months with temsirolimus alone with one‐year mortality of approximately 60% for IFN‐α plus temsirolimus and 53% for temsirolimus alone in Hudes 2007, who included participants with a worse risk prognosis (Table 1; Figure 4).
These results corresponded to no difference of a combined therapy with IFN‐α as combined therapy compared to standard targeted therapy on mortality (HR 1.20, 95% CI 0.97 to 1.49; Analysis 2.1).
2.2 Quality of life
QoL was not reported for participants treated with IFN‐α plus temsirolimus, because no survival advantage was observed.
2.3. Adverse events (grade 3 or greater)
The total number of participants with AEs (grade 3 or greater) was reported based on 416 participants. AEs occurred in 87% of participants in the IFN‐α plus temsirolimus group compared to 67% of participants in the temsirolimus group (RR 1.30, 95% CI 1.17 to 1.45; Analysis 2.3). We applied these RRs to participants with mRCC with a mean risk of AEs (grade 3 or greater) in 668/1000 participants in the temsirolimus alone group. These numbers may be increased by 200 (from 114 more to 301 more) with AEs (grade 3 or greater) if they are treated with combination therapy instead of temsirolimus alone (summary of findings Table 2).
2.4. Progression‐free survival
There were no differences in PFS between IFN‐α plus temsirolimus and temsirolimus alone (HR 1.09, 95% CI 0.90 to 1.31; Analysis 2.4).
2.5. Tumour remission
Tumour remission was reported based on 357 participants. There were no differences between IFN‐α plus temsirolimus and temsirolimus (RR 0.92, 95% CI 0.46 to 1.83; Analysis 2.5). The overall response rates were low in Hudes 2007 with 8% of participants treated with IFN‐α plus temsirolimus versus 9% with temsirolimus alone.
Comparison 3. Interferon‐α alone versus interferon‐α plus bevacizumab in first‐line therapy of metastatic renal cell carcinoma
Two studies with 1381 participants compared the efficacy and safety of IFN‐α alone versus IFN‐α plus bevacizumab (Escudier 2007; Rini 2010). OS and PFS were reported in both included studies on all participants, the frequency of AEs (grade 3 or greater) was reported based on all treated participants and tumour remission was assessed in both studies for 1205 participants.
3.1. Overall survival
In total, 244/685 (36%) participants with IFN‐α alone died within one year after randomization compared to 212/696 (30%) participants treated with IFN‐α plus bevacizumab (RR 1.17, 95% CI 1.00 to 1.36) with no important statistical heterogeneity (I2 = 0%) (Figure 5). We applied this RR to participants with mRCC and low‐risk score (favourable) with one‐year mortality rates of 150/1000 participants, moderate‐risk score of 280/1000 participants and high‐risk score of 550/1000 participants with standard therapies. These numbers may be slightly increased by 25 deaths/1000 (from 0 to 54 more) in low‐risk participants, 48 deaths/1000 (from 0 to 101 more) in moderate‐risk participants and 93 deaths/1000 (from 0 more to 198 more) in high‐risk participants if they are treated with IFN‐α as monotherapy (summary of findings Table 3). Small differences in median OS of 21.3 months with IFN‐α alone versus 23.3 months with IFN‐α plus bevacizumab (Escudier 2007) and 17.4 months with IFN‐α alone versus 18.3 months with IFN‐α plus bevacizumab (Rini 2010) were consistent with these results. Furthermore, their efficacy might depend on prognostic scores with highest benefit in participants with intermediate‐risk score and no prior nephrectomy (Table 2).

Forest plot of comparison: 3 Interferon (IFN‐α) alone versus IFN‐α plus bevacizumab in first‐line therapy of metastatic renal cell carcinoma, outcome: 3.1 1‐year mortality.
The primary endpoint for both studies was OS, which was not different in either study alone, but the pooled HR of 1.13 (95% CI 1.00 to 1.28) demonstrated a disadvantage of IFN‐α alone compared to IFN‐α plus bevacizumab with respect to survival with no important heterogeneity (I2 = 0%) (Analysis 3.2).
3.2. Quality of life
Neither study evaluated QoL.
3.3. Adverse events (grade 3 or greater)
AEs (grade 3 or greater) occurred in both studies less frequently in participants treated with IFN‐α alone compared to IFN‐α plus bevacizumab (RR 0.77, 95% CI 0.71 to 0.84) with no important heterogeneity (I2 = 0%) (Analysis 3.3). We applied this RR to participants with mRCC with a mean risk of AEs (grade 3 or greater) in 705/1000 participants in the IFN‐α alone group. This number is probably decreased by 162/1000 participants (from 113 to 205 fewer) with AEs grade 3 or 4 if they are treated with IFN‐α plus bevacizumab (summary of findings Table 3).
The number of participants with AEs grade 3 or greater was higher in Rini 2010 where 63% of participants receiving IFN‐α lone experienced grade 3 toxicity compared to 80% of participants receiving IFN‐α plus bevacizumab.
However, Escudier 2007 reported 203 AEs grade 3 or greater in participants who received one or more doses of bevacizumab compared to 137 AEs in participants who did not receive bevacizumab. Therefore, a maximum 137/304 (45%) participants with IFN‐α alone and 203/337 (60%) participants with IFN‐α plus bevacizumab had an AE with grade 3 or greater. In both studies, participants treated with IFN‐α plus bevacizumab reported AEs grade 3 or greater in established IFN‐α‐related toxicities (e.g. fatigue and neutropenia) and an increase in bevacizumab‐related toxicities (most common were bleeding/haemorrhage, hypertension, proteinuria and thromboembolic events).
3.4. Progression‐free survival
The pooled HR of 1.53 (95% CI 1.36 to 1.73) demonstrated a clear disadvantage for participants of IFN‐α monotherapy compared to IFN‐α plus bevacizumab with respect to PFS with no important heterogeneity (I2 = 0%) (Analysis 3.4).
3.5. Tumour remission
In total, 85/639 (13%) participants with IFN‐α alone compared to 190/566 (34%) participants with IFN‐α plus bevacizumab showed a response. Tumour remission showed a high disadvantage for participants treated with IFN‐α monotherapy compared to IFN‐α plus bevacizumab (RR 0.39, 95% CI 0.31 to 0.50) with no important heterogeneity (I2 = 0%) (Analysis 3.5).
Comparison 4. Interferon‐α plus bevacizumab versus standard targeted therapy in first‐line therapy of metastatic renal cell carcinoma
One study compared the efficacy and safety of the combination standard first‐line therapy with IFN‐α plus bevacizumab with standard targeted therapy (sunitinib) (Negrier 2011). One‐year mortality and PFS were reported based on 83 participants and AEs and tumour remission based on 82 participants who received treatment.
4.1. Overall survival
In total, 4/41 participants (10%) treated with IFN‐α plus bevacizumab died within one year after randomization compared to 11/42 (26%) participants with standard targeted therapy. This result demonstrated similar mortality with both treatment options (RR 0.37, 95% CI 0.13 to 1.08; Analysis 4.1).
We applied this RR to participants with mRCC with low‐risk score (favourable) with one‐year mortality rates of 150/1000 participants, moderate‐risk score of 280/1000 participants and high‐risk scores of 550/1000 participants with standard targeted therapy. The numbers of deaths may be similar with IFN‐α plus bevacizumab and standard targeted therapy (summary of findings Table 4).
4.2. Quality of life
We found no data.
4.3. Adverse events (grade 3 or greater)
There was uncertainty if AEs (grade 3 or greater) occur more frequently in participants treated with IFN‐α plus bevacizumab compared to participants with targeted therapy (70% with IFN‐α plus bevacizumab versus 60% with targeted therapy; RR 1.18, 95% CI 0.85 to 1.62; Analysis 4.2). We applied this RR to participants with mRCC with a mean risk that AEs (grade 3 or greater) occur in 595/1000 participants in the control group. The treatment options may lead to similar numbers of participants with AEs (grade 3 or greater) (summary of findings Table 4).
4.4. Progression‐free survival
There was uncertainty surrounding the effects of IFN‐α plus bevacizumab compared to targeted therapy on PFS (HR 0.66, 95% CI 0.38 to 1.14; Analysis 4.3). This is the only head‐to‐head comparison for both established first‐line therapies.
4.5. Tumour remission
There was uncertainty surrounding the effects of IFN‐α and bevacizumab compared to standard targeted therapy on tumour remission (RR 1.49, 95% CI 0.82 to 2.71; Analysis 4.4). In total, 17/40 (43%) participants with IFN‐α plus bevacizumab compared to 12/42 (29%) participants with targeted therapy showed remission. Negrier 2011 reported a very high response rate of 43% for the IFN‐α plus bevacizumab group compared to response rates of 29% with the standard targeted therapy group.
Comparison 5. Vaccine treatment versus standard targeted therapies in first‐line therapy of metastatic renal cell carcinoma
Two studies compared the efficacy and safety of vaccine treatment (MVA‐5T4 or IMA901) with standard targeted therapies based on 1071 participants. A total of 365 participants received treatment with a modified vaccinia Ankara encoding the tumour antigen 5T4 (MVA‐5T4) in combination with sunitinib, IL‐2 or IFN‐α. Participants in the control groups received sunitinib, IL‐2 or IFN‐α alone (Amato 2010). Another 204 participants received treatment with IMA901 in addition to standard therapy and 135 participants with a targeted monotherapy with sunitinib (Rini 2015).
OS and tumour remission were reported in both studies on 1071 participants and AEs were reported based on all 1065 treated participants. PFS was evaluated in one included study on 339 participants (Rini 2015).
5.1. Overall survival
A total of 165/546 (30.2%) participants treated with the vaccine in addition to standard therapy died within one year after randomization compared to 140/488 (28.7%) participants with standard therapy. This result demonstrated similar mortality (RR 1.10, 95% CI 0.91 to 1.32) with no important heterogeneity (I2 = 0%) (Figure 6). We applied this RR to participants with mRCC and low‐risk score (favourable) with one‐year mortality rates of 150/1000 participants, moderate‐risk score of 280/1000 participants and high‐risk scores of 550/1000 participants with standard targeted therapies. The numbers of deaths may be similar between treatments (summary of findings Table 5).
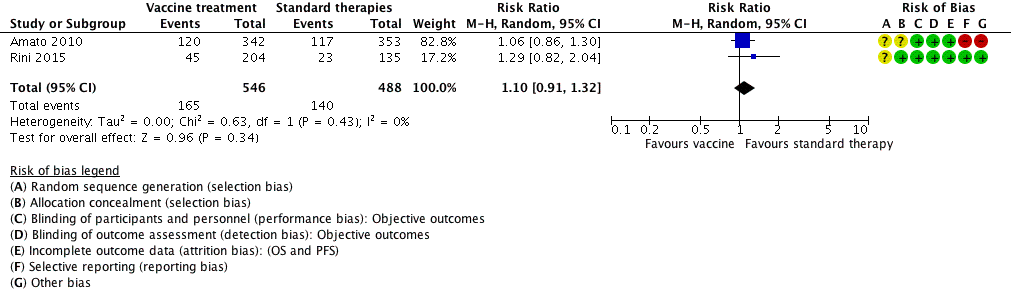
Forest plot of comparison: 5 Vaccine treatment versus standard therapies in first‐line therapy of metastatic renal cell carcinoma, outcome: 5.1 1‐year mortality.
Different inclusion criteria on performance status and prognosis in both included studies resulted in different median OS. Amato 2010 reported median OS of 19.2 with vaccine versus 20.1 months with standard targeted therapy and one‐year mortality rates of 35% with vaccine versus 33% with standard targeted therapy, whereas Rini 2015 reported median OS of more than 33 months for vaccine versus 'not reached' for standard targeted therapy and one‐year mortality rates of 17% with vaccine and 22% with standard targeted therapy. Both studies reported a higher benefit of vaccine treatment for participants with favourable risk (Table 2).
These results corresponded to similar OS (HR of 1.14, 95% CI 0.96 to 1.37) with no important heterogeneity (I2 = 22%) (Analysis 5.2).
5.2. Quality of life
Neither study evaluated QoL.
5.3. Adverse events (grade 3 or greater)
There was uncertainty if AEs (grade 3 or greater) were increased in participants treated with vaccine compared to standard targeted therapy (RR 1.16, 95% CI 0.97 to 1.39) with no important heterogeneity (I2 = 0%) (Analysis 5.3). We applied this RR to participants with mRCC with a risk of AEs (grade 3 or greater) in 241/1000 participants in the control group with standard targeted therapies. The treatment options may lead to a similar number of AEs (summary of findings Table 5).
Amato 2010 reported treatment‐emergent AEs (grade 3 or greater) in 59/365 (16%) participants with SOC/MVA‐5T4 compared to 58/367 (16%) participants with SOC/placebo. MVA‐5T4 was well tolerated with each regimen with no significant difference in the incidence of AEs. There were no clinically relevant MVA‐5T4‐specific AEs observed. Participants with an intermediate prognosis experienced thrombocytosis more frequently compared with participants of favourable prognosis (39% with intermediate versus 8% with favourable). Rini 2015 reported AEs grade 3 or greater in 116/220 (53%) participants who were treated with IMA901 compared to 62/132 (47%) participants with no IMA901. IMA901 was generally well tolerated with no differences between treatment groups and transient injection‐site reactions related to IMA901.
5.4. Progression‐free survival
The HR of 1.05 (95% CI 0.87 to 1.27) demonstrated no influence of vaccines (Analysis 5.4).
5.5. Tumour remission
Tumour remission showed no benefit from vaccine treatment (RR 0.93, 95% CI 0.76 to 1.13) with no important heterogeneity (I2 = 0%) of treatment effects, but with high differences in tumour remission of around 13% in Amato 2010 and 45% in Rini 2015 but no differences depending on vaccine treatment in both studies (Analysis 5.5).
Comparison 6. Targeted immunotherapies versus standard targeted therapies in previously treated patients with metastatic renal cell carcinoma
One study compared efficacy and safety of targeted immunotherapy with nivolumab with standard targeted therapy with everolimus based on 821 participants (Motzer 2015a). Of them, 410 were randomized to treatment with the PD‐1 inhibitor nivolumab and 411 were randomized to treatment with everolimus. OS and PFS were evaluated for all randomized participants, safety was evaluated for all treated 803 participants and tumour remission in 750 participants.
6.1. Overall survival
A total of 98/410 (24%) participants randomly assigned to receive nivolumab and 140/411 (34%) participants randomly assigned to receive everolimus died within one year of randomization (RR 0.70, 95% CI 0.56 to 0.87; Analysis 6.1). We applied this RR to participants with mRCC with a mean risk to die within one year after the start of second‐line therapy in the control group, in which 341/1000 participants died. This number is probably reduced by 102 deaths out of 1000 participants (from 44 to 150 fewer) if they were treated with targeted immunotherapy (summary of findings Table 6). The median OS were 25.0 months with nivolumab and 19.6 months with everolimus after a minimum follow‐up of 14 months.
This benefit in OS was observed across prespecified subgroups with slightly better results in participants with poor prognostic score and no differences depending on the number of previous antiangiogenic regimens (Table 2). A posthoc subgroup analysis demonstrated the prognostic influence of PD‐L1 expression. Participants with PD‐L1 expression of 1% or greater demonstrated a median OS of 21.8 months for nivolumab versus 18.8 months for everolimus. In participants with PD‐L1 expression of 1% or less, median OS was 27.4 months for nivolumab versus 21.2 months for everolimus.
OS showed the superiority of nivolumab over everolimus (HR 0.73, 95% CI 0.60 to 0.89; Analysis 6.2).
6.2. Quality of life
Mean health‐related QoL scores (FKSI‐DRS and EQ‐5D) were comparable at baseline. Clinically relevant differences in improvements FKSI‐DRS by at least 2 FKSI‐DRS points were more frequently observed in participants treated with nivolumab. They were reported in 200/361 (55%) participants with nivolumab compared to 126/343 (37%) participants with everolimus (RR 1.51, 95% CI 1.28 to 1.78). Similar proportions were reported in clinically relevant improvements in EQ‐VAS by at least 7 EQ‐VAS points. A total of 192/360 (53%) participants treated with nivolumab and 134/343 (39%) participants treated with everolimus showed relevant QoL improvements (RR 1.37, 95% CI 1.16 to 1.61), but there were no important or significant differences reported for EQ utility score (Table 3; summary of findings Table 6).
We applied these RRs to participants with mRCC with a mean chance of a clinically relevant improvement in FKSI‐DRS in 367/1000 participants who received standard targeted therapies. This number is probably increased by 187/1000 participants (from 103 more to 287 more) for FKSI‐DRS if they are treated with IFN‐α monotherapy.
Furthermore, there was clinically relevant improvement in EQ‐5D VAS in 391/1000 participants treated with standard targeted therapies. This number is probably increased by 145/1000 participants (from 63 more to 238 more) for EQ‐5D VAS if they are treated with IFN‐α monotherapy.
6.3. Adverse events (grade 3 or greater)
AEs (grade 3 or greater) were less frequent for nivolumab and occurred in 76/406 (19%) participants compared to 145/397 (37%) participants treated with everolimus (RR 0.51, 95% CI 0.40 to 0.65; Analysis 6.4).
We applied this RR to participants with mRCC in second‐line treatment in the control group with a risk of AEs (grade 3 or greater) in 365/1000 participants. This number is probably decreased by 179/1000 participants who might experience AEs grade 3 or 4 (from 128 to 219 fewer) if they are treated with targeted immunotherapy (summary of findings Table 6).
The most common grade 3 or 4 AEs were anaemia (2% with nivolumab versus 8% with everolimus), fatigue (2% with nivolumab versus 3% with everolimus), hyperglycaemia (1% with nivolumab versus 4% with everolimus), hypertriglyceridaemia (0% with nivolumab versus 5% with everolimus) and stomatitis (0% with nivolumab versus 4% with everolimus). Clinical manifestations of a potentially fatal pneumonitis described in 4% (nivolumab) versus 15% (everolimus).
6.4. Progression‐free survival
The HR of 0.88 (95% CI 0.75 to 1.03) demonstrated a slight benefit for participants treated with nivolumab compared to everolimus with respect to PFS (Analysis 6.5).
6.5. Tumour remission
Partial or complete response occurred in 103/387 (25%) participants treated with nivolumab and 22/363 (5%) participants treated with everolimus. Tumour remission was higher with nivolumab compared to everolimus (RR 4.39, 95% CI 2.84 to 6.80; Analysis 6.6).
Discussion
Summary of main results
Cytokines in the era of targeted therapies
Several pivotal phase III trials have been reported since the previous version of this review (Coppin 2007), demonstrating superiority in first‐line therapy for targeted agents as sunitinib, bevacizumab plus IFN‐α or temsirolimus over IFN‐α.
Summarizing the evidence, IFN‐α monotherapy is probably inferior to standard targeted therapies with temsirolimus or sunitinib with respect to OS (HR 1.28, 95% CI 1.11 to 1.49) with a higher one‐year mortality (RR 1.30, 95% CI 1.13 to 1.51). Patients with IFN‐α monotherapy may have similar QoL and may experience slightly more AEs grade 3 or greater (RR 1.17, 95% CI 1.03 to 1.32). These results support the recommendations in the treatment guidelines of sunitinib as the first‐line treatment option for patients regardless of prognostic factors and temsirolimus in poor‐risk mRCC patients (Escudier 2014; German Guideline Programme in Oncology 2015; Ljungberg 2015).
The combined treatment of temsirolimus plus IFN‐α may result in greater toxicity with a higher frequency of patients with AEs grade 3 or 4 (RR 1.30, 95% CI 1.17 to 1.45), but there is probably no difference on the effects on OS when compared with temsirolimus alone (HR 1.20, 95% CI 0.97 to 1.49) or IFN monotherapy (HR 0.96, 95% CI 0.76 to 1.20) (Hudes 2007), perhaps, at least partially, due to lower administered doses of temsirolimus and IFN‐α.
Treatment with IFN‐α alone may slightly increase mortality in comparison to IFN‐α plus intravenous bevacizumab, a humanized monoclonal antibody directed against VEGF in treatment‐naive, low‐ and intermediate‐risk patients (Escudier 2007; Rini 2010). This effect is probably accompanied by a lower incidence of AEs grade 3 or greater.
All trials that evaluated sunitinib and IFN‐α plus bevacizumab enrolled a small proportion of participants (less than 10%) with poor risk classification. In the case of sunitinib, subgroup analysis of the pivotal phase III trial demonstrated efficacy and feasibility of treatment in people with high‐risk disease and thus, sunitinib remains a therapeutic option for this group of patients. Treatment with IFN‐α plus bevacizumab or targeted monotherapy sunitinib may lead to similar one‐year mortality (RR 0.37, 95% CI 0.13 to 1.08) and incidence of AEs grade 3 or greater (Negrier 2011).
New immunotherapy approaches ‐ vaccines
Amato 2010 conducted a large placebo‐controlled study of the addition of MVA‐5T4 vaccine to three different standard‐of‐care first‐line options (rd‐IL‐2, or IFN‐α, or sunitinib) in use at the participating centres in the US and Europe. Despite the induction of a strong immune response to MVA‐5T4 in some participants, survival outcomes were comparable to standard of care alone (HR 1.07, 95% CI 0.86 to 1.32).
Results of a phase III trial with IMA901 showed no beneficial effect on OS when added to sunitinib in first‐line mRCC patients (HR 1.34, 95% CI 0.97 to 1.86) (IMPRINT study; Rini 2015). There was no clear association between T‐cell responses and clinical outcomes.
Summarizing these effects, the outcomes may be similar in mRCC. The uncertainty includes the effect of vaccine treatment with MVA‐5T4 or IMA901 in addition to sunitinib compared to standard therapies on overall mortality (HR 1.14, 95% CI 0.96 to 1.37), one‐year mortality (RR 1.10, 95% CI 0.91 to 1.32) and AEs grade 3 or greater (RR 1.16, 95% CI 0.97 to 1.39).
New immunotherapy ‐ targeted immunotherapy (immune checkpoint inhibitors)
Immune checkpoint inhibitors exploit new understanding of the molecular mechanisms of interaction between tumour cells and host immune cells such as antigen‐presenting cells and immune effector cells (Postow 2015). Nivolumab is the first of these therapies to be validated for mRCC, specifically the clear‐cell histological subtype, and the first therapy to demonstrate improved OS (HR 0.73, 95% CI 0.60 to 0.89) as part of the second‐line treatment for patients in this group (Motzer 2015a). Poor‐ and intermediate‐risk patients treated with nivolumab experienced the greatest OS benefit compared with patients of favourable risk. Nivolumab reduced mortality by 27% (95% CI ‐43% to ‐7%) compared to everolimus, a previously validated second‐line standard of care. The incidence of AEs grade 3 or 4 was lower with nivolumab (RR 0.51, 95% CI 0.40 to 0.65), but the types of AEs observed were also different. In particular, nivolumab may result in severe autoimmune illness such as pneumonitis or colitis that can be rapidly progressive and potentially fatal if not quickly recognized and treated (Weber 2015). No treatment‐related deaths occurred in the large pivotal study of 821 participants (Motzer 2015a). Patients treated with nivolumab experienced an improvement in their health‐related QoL in this unblinded study and had significantly lower symptom burden throughout treatment compared to patients receiving everolimus.
Overall completeness and applicability of evidence
We identified no studies comparing current standard therapies against adoptive T‐cell therapies (comparison 4) during the literature search. Furthermore, we found no studies comparing other immunotherapies (comparison 6) than defined in comparisons 1 to 5 against standard therapies. Given that we identified no studies devoted to or stratified for participants with non‐clear‐cell RCC, our conclusions can only be applied to clear‐cell RCC. There are multiple uncommon subtypes of non‐clear‐cell RCC, and only international efforts can identify the most efficient and preferred therapy for these patients.
Quality of the evidence
We identified eight eligible studies with 4732 participants. We categorized these included studies into six comparisons against current evidence‐based standard therapy with either targeted therapies or IFN‐α plus bevacizumab: four as first‐line and one as second‐line therapy of mRCC. Effect estimates for our primary outcomes (OS, QoL, AEs grade 3 or 4) in these six comparisons were based on the results obtained from one to three RCTs. All available RCTs were of moderate size (between 171 and 821 participants). Seven out of eight studies were funded by the drug manufacturers and one by a government agency (Rini 2010). This may raise the possibility of publication bias, but the number of studies was insufficient to meet rigorous criteria to create funnel plots.
Quality of evidence from RCTs is generally considered to be high but was downgraded in cases of relevant risk of bias, inconsistency, imprecision or publication bias. We downgraded quality of evidence for the following outcomes for study limitations (risk of bias) as recommended in Guyatt 2011b:
-
OS: downgraded when patients were allowed to cross‐over to targeted therapy or when a relevant number of participants received second‐line systemic anticancer therapies subsequent to progression of disease;
-
QoL: downgraded because of no blinding of participants, physicians or blinded assessment of this subjective outcome;
-
adverse events, grade 3 or 4: downgraded because of no double blinding or blinded assessment of this subjective outcome if participant‐reported outcomes were included.
We generally downgraded the quality of evidence for all outcomes for imprecision if the CI included a possible benefit from both therapeutic approaches (Guyatt 2011d). We strongly suspected reporting bias and downgraded quality of evidence when assessment of outcomes were planned in the protocol but not reported (Guyatt 2011c).
Comparison 1: IFN‐α alone versus standard targeted therapy with temsirolimus or sunitinib in first‐line therapy of mRCC: we judged the quality of evidence for one‐year mortality as moderate, downgrading for study limitations because participants with progressive disease and randomized to IFN‐α monotherapy in Motzer 2007 were allowed to cross‐over to targeted therapy with sunitinib. We judged the quality of evidence on QoL as low, downgrading for imprecision and study limitations with a high risk of bias due to performance and detection bias given lack of blinding of participants, physicians and outcome assessors. We judged the quality of evidence on AEs as low and downgraded the evidence for imprecision and lack of blinding of participants, physicians and outcome assessors of AEs in both studies (summary of findings Table for the main comparison).
Comparison 2: IFN‐α combined with temsirolimus versus standard targeted therapies with temsirolimus in first‐line therapy of mRCC: the evidence for one‐year mortality was downgraded to moderate by one point for imprecision. QoL could not be evaluated due to insufficient data. We judged the evidence on AEs to be low quality and downgraded for imprecision and lack of blinding in both studies (summary of findings Table 2).
Comparison 3: IFN‐α alone versus IFN‐α plus bevacizumab in first‐line therapy of mRCC: we judged the quality of evidence for one‐year mortality to be low and downgraded for risk of bias and imprecision. We found study limitations due to a high risk of selection bias and performance bias due to substantial cross‐over due to the use of second‐line systemic anticancer therapies subsequent to progression in more than 50% of participants in Rini 2010 and approximately 20% in Escudier 2007. QoL could not be evaluated due to insufficient data. We judged the evidence on AEs to be of moderate quality and downgraded due to high risk of performance and detection bias on subjective outcomes in Rini 2010 with no blinding of participants, physicians and outcome assessors (summary of findings Table 3).
Comparison 4: IFN‐α plus bevacizumab versus targeted therapies in first‐line therapy of mRCC: we judged the quality of the evidence to be low for one‐year mortality, downgrading for non‐reporting of information on long‐term OS and imprecision. QoL could not be evaluated due to insufficient data. We judged the evidence on AEs to be of low quality and downgraded for lack of blinding and imprecision (summary of findings Table 4).
Comparison 5: vaccine treatment versus standard therapies in first‐line therapy of mRCC: we downgraded the quality of evidence for one‐year mortality to low and downgraded by one point for indirectness due to the use of present‐day non‐standard therapies (low‐dose IL‐2, IFN‐α) in 75% of participants in both treatment groups (Amato 2010), and by additional point for imprecision. We decided not to downgrade for risk of bias due to the use of additional second‐line therapies in one‐third of participants in this study. QoL could not be evaluated due to insufficient data. We judged the evidence on AEs to be of low quality and downgraded it by one point for imprecision and one point for risk of bias due to the absence of double blinding or blinded assessment of AEs (summary of findings Table 5), and decided not to downgrade due to the use of present‐day non‐standard therapies in Amato 2010.
Comparison 6: targeted immunotherapies versus standard targeted therapy in previously treated patients with mRCC: we judged the evidence to be of moderate quality for one‐year mortality and downgraded by one point for risk of bias due to permitted cross‐over during follow‐up for OS. The evidence for AEs and QoL was of moderate quality and was downgraded for lack of blinding (summary of findings Table 6).
Potential biases in the review process
We have searched all available English‐language databases for published studies of immunotherapy but recognize there is a potential for publication bias that would have excluded any unpublished studies or studies published in unlisted journals. Missed studies can be expected to be negative, and consequently the magnitude of observed effects might be overestimated. In addition, unlike previous editions of this review, we have not attempted to systematically conduct a manual search for meeting abstracts but instead, searched in the Web of Science Core Collection for meeting abstracts.
The number of studies per comparisons was insufficient to generate funnel plots and the risk of reporting bias was based on comparisons between protocol and reported results thus, might be underestimated. We included one study where participants were assigned by their physician to one standard‐of‐care regimens consistent with local practice (low‐dose IL‐2, IFN‐α or sunitinib) (Amato 2010). Only one of these arms with 185/732 randomized participants was consistent with standard therapies in this review.
Agreements and disagreements with other studies or reviews
Since the mid‐2000s, we have experienced a transition from non‐specific therapy with cytokines to rather specific immunotherapy regimens, which directly target the RCC cancer cell and the tumour microenvironment. To the best of our knowledge this is the first systematic review that focuses on the potential of immunotherapy in mRCC following the dismissal of non‐specific cytokines as potential therapeutic agents by current guidelines.
Reviews have reflected on the role of targeted therapies in the current management of mRCC after their approval at the beginning of 2005. Their conclusions are in line with our results. In general, these targeted agents have replaced non‐specific immunotherapy in the majority of patients (Abe 2013; Albiges 2015; Coppin 2008; Dutcher 2013; Jonasch 2014; Takyar 2016; Xu 2015). The combination of bevacizumab plus IFN‐α is the only remaining therapy that involves a non‐specific cytokine and is still currently recommended as first‐line treatment for people with RCC with good or intermediate prognosis, despite this, most experts do not routinely use this regimen (Rothermundt 2015).
Other immunotherapy reviews and overview articles have mainly focused on the future potential of immunotherapy (Bedke 2015; Grünwald 2015; Yang 2016), and highlighted possible further investigations to enhance the effectiveness of new immunotherapeutic agents exploring the use of combination therapy with PD‐1 or PD‐L1 blockade (Lee 2016; Massari 2015), or combination of vaccines with targeted therapies (Combe 2015; Figlin 2015), as key areas of research. These research topics are also reflected in the many ongoing studies that our review identified.
Data from Weber 2015 and Ciccarese 2016 focused on the toxicity profile of novel immunotherapeutic agents, including nivolumab and are consistent with our present findings on the safety profile of nivolumab. In general, AEs of immune checkpoint inhibitors are mostly mild to moderate in severity with fewer AEs compared with currently used targeted therapies.
Risk of bias summary: review authors' judgements about each risk of bias item for each included study.
Risk of bias graph: review authors' judgements about each risk of bias item presented as percentages across all included studies.
Forest plot of comparison: 1 Interferon‐α (IFN‐α) alone versus standard targeted therapy in first‐line therapy of metastatic renal cell carcinoma, outcome: 1.1 1‐year mortality.
Forest plot of comparison: 3 Interferon (IFN‐α) alone versus IFN‐α plus bevacizumab in first‐line therapy of metastatic renal cell carcinoma, outcome: 3.1 1‐year mortality.
Forest plot of comparison: 5 Vaccine treatment versus standard therapies in first‐line therapy of metastatic renal cell carcinoma, outcome: 5.1 1‐year mortality.

Comparison 1 Interferon‐α (IFN‐α) alone versus standard targeted therapies in first‐line therapy of metastatic renal cell carcinoma, Outcome 1 1‐year mortality.
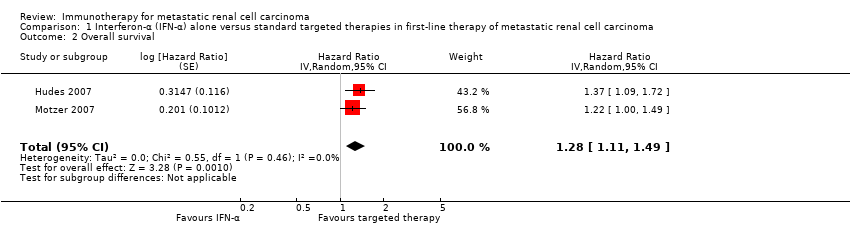
Comparison 1 Interferon‐α (IFN‐α) alone versus standard targeted therapies in first‐line therapy of metastatic renal cell carcinoma, Outcome 2 Overall survival.

Comparison 1 Interferon‐α (IFN‐α) alone versus standard targeted therapies in first‐line therapy of metastatic renal cell carcinoma, Outcome 3 Quality of life.
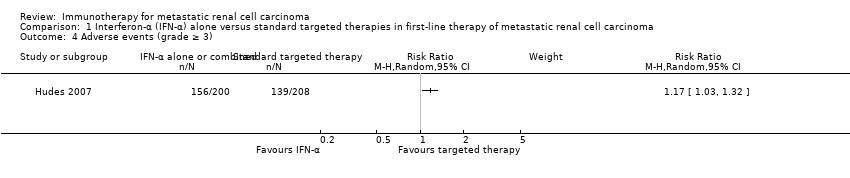
Comparison 1 Interferon‐α (IFN‐α) alone versus standard targeted therapies in first‐line therapy of metastatic renal cell carcinoma, Outcome 4 Adverse events (grade ≥ 3).

Comparison 1 Interferon‐α (IFN‐α) alone versus standard targeted therapies in first‐line therapy of metastatic renal cell carcinoma, Outcome 5 Progression‐free survival.
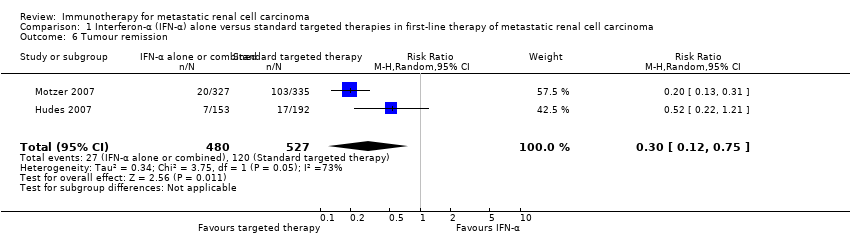
Comparison 1 Interferon‐α (IFN‐α) alone versus standard targeted therapies in first‐line therapy of metastatic renal cell carcinoma, Outcome 6 Tumour remission.
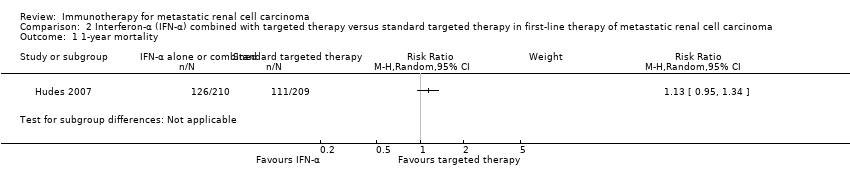
Comparison 2 Interferon‐α (IFN‐α) combined with targeted therapy versus standard targeted therapy in first‐line therapy of metastatic renal cell carcinoma, Outcome 1 1‐year mortality.
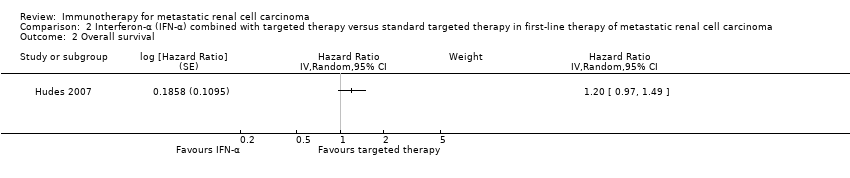
Comparison 2 Interferon‐α (IFN‐α) combined with targeted therapy versus standard targeted therapy in first‐line therapy of metastatic renal cell carcinoma, Outcome 2 Overall survival.
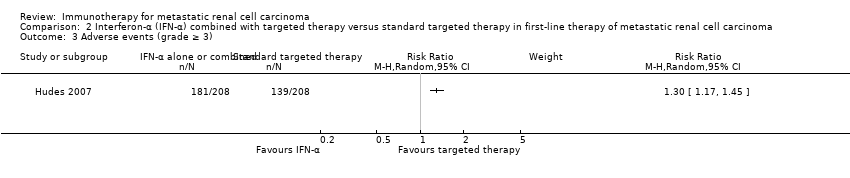
Comparison 2 Interferon‐α (IFN‐α) combined with targeted therapy versus standard targeted therapy in first‐line therapy of metastatic renal cell carcinoma, Outcome 3 Adverse events (grade ≥ 3).
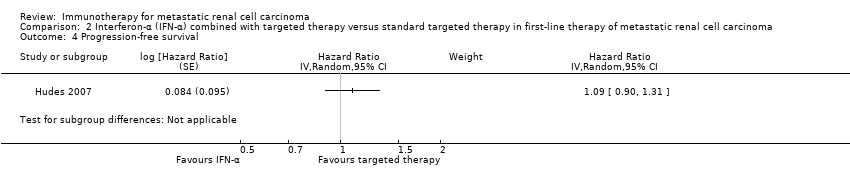
Comparison 2 Interferon‐α (IFN‐α) combined with targeted therapy versus standard targeted therapy in first‐line therapy of metastatic renal cell carcinoma, Outcome 4 Progression‐free survival.

Comparison 2 Interferon‐α (IFN‐α) combined with targeted therapy versus standard targeted therapy in first‐line therapy of metastatic renal cell carcinoma, Outcome 5 Tumour remission.

Comparison 3 Interferon (IFN‐α) alone versus IFN‐α plus bevacizumab in first‐line therapy of metastatic renal cell carcinoma, Outcome 1 1‐year mortality.

Comparison 3 Interferon (IFN‐α) alone versus IFN‐α plus bevacizumab in first‐line therapy of metastatic renal cell carcinoma, Outcome 2 Overall survival.

Comparison 3 Interferon (IFN‐α) alone versus IFN‐α plus bevacizumab in first‐line therapy of metastatic renal cell carcinoma, Outcome 3 Adverse events (grade ≥ 3).

Comparison 3 Interferon (IFN‐α) alone versus IFN‐α plus bevacizumab in first‐line therapy of metastatic renal cell carcinoma, Outcome 4 Progression‐free survival.
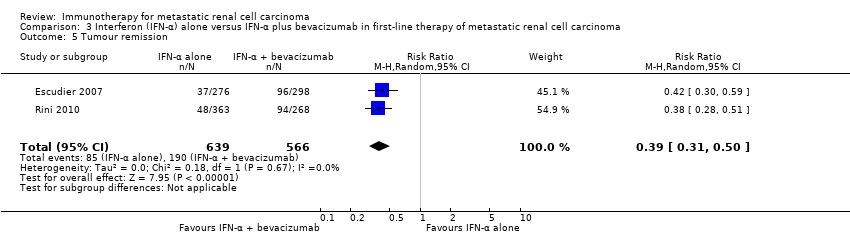
Comparison 3 Interferon (IFN‐α) alone versus IFN‐α plus bevacizumab in first‐line therapy of metastatic renal cell carcinoma, Outcome 5 Tumour remission.

Comparison 4 Interferon‐α (IFN‐α) plus bevacizumab versus standard targeted therapies in first‐line therapy of metastatic renal cell carcinoma, Outcome 1 1‐year mortality.

Comparison 4 Interferon‐α (IFN‐α) plus bevacizumab versus standard targeted therapies in first‐line therapy of metastatic renal cell carcinoma, Outcome 2 Adverse events (grade ≥ 3).

Comparison 4 Interferon‐α (IFN‐α) plus bevacizumab versus standard targeted therapies in first‐line therapy of metastatic renal cell carcinoma, Outcome 3 Progression‐free survival.

Comparison 4 Interferon‐α (IFN‐α) plus bevacizumab versus standard targeted therapies in first‐line therapy of metastatic renal cell carcinoma, Outcome 4 Tumour remission.

Comparison 5 Vaccine treatment versus standard therapies in first‐line therapy of metastatic renal cell carcinoma, Outcome 1 1‐year mortality.

Comparison 5 Vaccine treatment versus standard therapies in first‐line therapy of metastatic renal cell carcinoma, Outcome 2 Overall survival.

Comparison 5 Vaccine treatment versus standard therapies in first‐line therapy of metastatic renal cell carcinoma, Outcome 3 Adverse events (grade ≥ 3).

Comparison 5 Vaccine treatment versus standard therapies in first‐line therapy of metastatic renal cell carcinoma, Outcome 4 Progression‐free survival.

Comparison 5 Vaccine treatment versus standard therapies in first‐line therapy of metastatic renal cell carcinoma, Outcome 5 Tumour remission.

Comparison 6 Targeted immunotherapy alone versus standard targeted therapies in previously treated patients with metastatic renal cell carcinoma, Outcome 1 1‐year mortality.

Comparison 6 Targeted immunotherapy alone versus standard targeted therapies in previously treated patients with metastatic renal cell carcinoma, Outcome 2 Overall survival.

Comparison 6 Targeted immunotherapy alone versus standard targeted therapies in previously treated patients with metastatic renal cell carcinoma, Outcome 3 Quality of life.

Comparison 6 Targeted immunotherapy alone versus standard targeted therapies in previously treated patients with metastatic renal cell carcinoma, Outcome 4 Adverse events (grade ≥ 3).
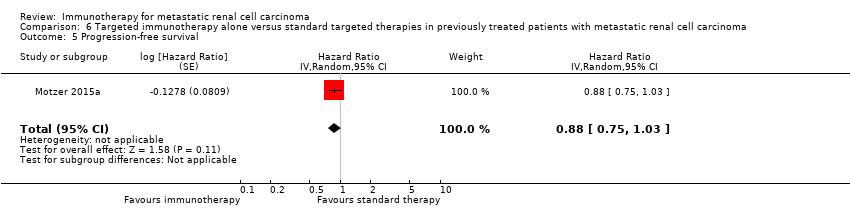
Comparison 6 Targeted immunotherapy alone versus standard targeted therapies in previously treated patients with metastatic renal cell carcinoma, Outcome 5 Progression‐free survival.

Comparison 6 Targeted immunotherapy alone versus standard targeted therapies in previously treated patients with metastatic renal cell carcinoma, Outcome 6 Tumour remission.
| IFN‐α alone versus standard targeted therapy for mRCC | ||||||
| Patient population: previously untreated patients with mRCC Settings: phase III, international, multicentre, open‐label Intervention: IFN‐α alone Comparison: standard targeted therapy (sunitinib or temsirolimus) | ||||||
| Outcomes | Illustrative comparative risks* (95% CI) | Relative effect | No of participants | Quality of the evidence | Comments | |
| Assumed risk | ||||||
| Risk with standard targeted therapy | Risk difference with IFN‐α alone (95% CI) | |||||
| 1‐year mortality | Lowa | RR 1.3 | 1166 | ⊕⊕⊕⊝ | ‐ | |
| 150 per 1000 | 45 more per 1000 | |||||
| Moderatea | ||||||
| 280 per 1000 | 84 more per 1000 | |||||
| Higha | ||||||
| 550 per 1000 | 165 more per 1000 | |||||
| QoL | The mean QoL in the control group was | MD 5.58 lower | ‐ | 730 | ⊕⊕⊝⊝ | ‐ |
| QoL | The mean QoL in the control group was | MD 3.27 lower (4.18 to 2.36 lower) | ‐ | 730 | ⊕⊕⊝⊝ | ‐ |
| QoL | The mean QoL in the control group was | MD 1.98 lower (2.51 to 1.46 lower) | ‐ | 730 | ⊕⊕⊝⊝ | ‐ |
| QoL | The mean QoL in the control group was | MD 0.06 lower (0.12 lower to 0 higher) | ‐ | 1002 (2 studies) | ⊕⊕⊝⊝ | ‐ |
| QoL | The mean QoL in the control groups was | MD 4.68 lower (6.53 to 2.83 lower) | ‐ | 1002 (2 studies) | ⊕⊕⊝⊝ | ‐ |
| Adverse events (grade ≥ 3) | 668 per 1000 | 114 more per 1000 | RR 1.17 | 408 | ⊕⊕⊝⊝ | ‐ |
| *The basis for the assumed risk (e.g. the median control group risk across studies) is provided in footnotes. The corresponding risk (and its 95% confidence interval) is based on the assumed risk in the comparison group and the relative effect of the intervention (and its 95% CI). | ||||||
| GRADE Working Group grades of evidence | ||||||
| 1 Downgraded for selection bias and performance bias due to cross‐over. | ||||||
| IFN‐α alone or combined with targeted therapy compared to standard targeted therapy in first‐line therapy of mRCC | ||||||
| Patient population: previously untreated patients with mRCC Setting: phase III, international, multicentre, open‐label Intervention: IFN‐α combined with targeted therapy Comparison: standard targeted therapy (temsirolimus) | ||||||
| Outcomes | Illustrative comparative risks* (95% CI) | Relative effect | No of participants | Quality of the evidence | Comments | |
| Assumed risk | ||||||
| Risk with standard targeted therapy | Risk difference with IFN‐α combined with targeted therapy (95% CI) | |||||
| 1‐year mortality | Lowa | RR 1.13 | 419 | ⊕⊕⊕⊝ | ‐ | |
| 150 per 1000 | 20 more per 1000 | |||||
| Moderatea | ||||||
| 280 per 1000 | 36 more per 1000 | |||||
| Higha | ||||||
| 550 per 1000 | 71 more per 1000 | |||||
| Quality of life | No evidence available | |||||
| Adverse events (grade ≥ 3) | 668 per 1000 | 200 more per 1000 | RR 1.30 | 416 | ⊕⊕⊝⊝ | ‐ |
| *The basis for the assumed risk (e.g. the median control group risk across studies) is provided in footnotes. The corresponding risk (and its 95% confidence interval) is based on the assumed risk in the comparison group and the relative effect of the intervention (and its 95% CI). | ||||||
| GRADE Working Group grades of evidence | ||||||
| 1 Downgraded for imprecision due to wide confidence intervals; clinical action would differ between lower and upper boundary of the confidence interval. | ||||||
| IFN‐α alone versus IFN‐α + bevacizumab in first‐line therapy of mRCC | ||||||
| Patient population: previously untreated patient with mRCC Setting: phase III, international, multicentre, Escudier 2007: double‐blind, placebo‐controlled; Rini 2010: open‐label Intervention: IFN‐α alone Comparison: IFN‐α alone + bevacizumab | ||||||
| Outcomes | Illustrative comparative risks* (95% CI) | Relative effect | No of participants | Quality of the evidence | Comments | |
| Assumed risk | ||||||
| Risk with standard therapy (IFN‐α + bevacizumab) | Risk difference with IFN‐α alone (95% CI) | |||||
| 1‐year mortality | Low | RR 1.17 | 1381 | ⊕⊕⊝⊝ | ‐ | |
| 150 per 1000 | 25 more per 1000 | |||||
| Moderate | ||||||
| 280 per 1000 | 48 more per 1000 | |||||
| High | ||||||
| 550 per 1000 | 93 more per 1000 | |||||
| Quality of life | No evidence available | |||||
| Adverse events (grade ≥ 3) Follow‐up: up to 28 days after last dose to 65 months | 705 per 1000 | 162 fewer per 1000 | RR 0.77 | 1350 | ⊕⊕⊕⊝ | ‐ |
| *The basis for the assumed risk (e.g. the median control group risk across studies) is provided in footnotes. The corresponding risk (and its 95% confidence interval) is based on the assumed risk in the comparison group and the relative effect of the intervention (and its 95% CI). | ||||||
| GRADE Working Group grades of evidence | ||||||
| 1 Downgraded for selection bias and performance bias due to substantial cross‐over. | ||||||
| IFN‐α + bevacizumab versus targeted therapies in first‐line therapy of mRCC | ||||||
| Patient population: previously untreated patients with mRCC Setting: phase II, national (France), multicentre, open‐label Intervention: IFN‐α + bevacizumab Comparison: standard targeted therapies (sunitinib) | ||||||
| Outcomes | Illustrative comparative risks* (95% CI) | Relative effect | No of participants | Quality of the evidence | Comments | |
| Assumed risk | ||||||
| Risk with standard targeted therapies | Risk difference with IFN‐α + bevacizumab (95% CI) | |||||
| 1‐year mortality Follow‐up: 23.2 months | Lowa | RR 0.37 | 83 | ⊕⊕⊝⊝ | ‐ | |
| 150 per 1000 | 95 fewer per 1000 | |||||
| Moderatea | ||||||
| 280 per 1000 | 176 fewer per 1000 | |||||
| Higha | ||||||
| 550 per 1000 | 347 fewer per 1000 | |||||
| Quality of life | No evidence available | |||||
| Adverse events (grade ≥ 3) Follow‐up: 48 weeks | 595 per 1000 | 107 more per 1000 | RR 1.18 | 82 | ⊕⊕⊝⊝ | ‐ |
| *The basis for the assumed risk (e.g. the median control group risk across studies) is provided in footnotes. The corresponding risk (and its 95% confidence interval) is based on the assumed risk in the comparison group and the relative effect of the intervention (and its 95% CI). | ||||||
| GRADE Working Group grades of evidence | ||||||
| 1 Downgraded for reporting and performance bias due to differences in second‐line treatment. | ||||||
| Vaccine treatment versus standard therapies in first‐line therapy of mRCC | ||||||
| Patient population: previously untreated patients with mRCC Setting: phase III, international, multicentre, double‐blind, placebo‐controlled (Amato 2010), open‐label (Rini 2015) Intervention: vaccine treatment (MVA‐5T4 or IMA0901) Comparison: placebo and standard therapies (IL‐2, IFN‐α and sunitinib) | ||||||
| Outcomes | Illustrative comparative risks* (95% CI) | Relative effect | No of participants | Quality of the evidence | Comments | |
| Assumed risk | ||||||
| Risk with standard therapies | Risk difference with vaccine treatment (95% CI) | |||||
| 1‐year mortality | Lowa | RR 1.10 | 1034 | ⊕⊕⊝⊝ | ‐ | |
| 150 per 1000 | 15 more per 1000 | |||||
| Moderatea | ||||||
| 280 per 1000 | 28 more per 1000 | |||||
| Higha | ||||||
| 550 per 1000 | 55 more per 1000 | |||||
| Quality of life | No evidence available | |||||
| Adverse events (grade ≥ 3) Follow‐up: not reported | 241 per 1000 | 39 more per 1000 | RR 1.16 | 1065 | ⊕⊕⊝⊝ | ‐ |
| *The basis for the assumed risk (e.g. the median control group risk across studies) is provided in footnotes. The corresponding risk (and its 95% confidence interval) is based on the assumed risk in the comparison group and the relative effect of the intervention (and its 95% CI). | ||||||
| GRADE Working Group grades of evidence | ||||||
| 1 Not downgraded for performance bias, borderline decision due to second‐line therapies in one study. | ||||||
| Targeted immunotherapy alone versus standard targeted therapies in previously treated patients with mRCC | ||||||
| Patient population: previously treated patients with mRCC Setting: phase III, international, multicentre, open‐label Intervention: targeted immunotherapy (nivolumab) alone Comparison: standard targeted therapies (everolimus) | ||||||
| Outcomes | Illustrative comparative risks* (95% CI) | Relative effect | No of participants | Quality of the evidence | Comments | |
| Assumed risk | ||||||
| Risk with standard targeted therapies | Risk difference with targeted immunotherapy alone (95% CI) | |||||
| 1‐year mortality | 341 per 1000 | 102 fewer per 1000 | RR 0.70 | 821 | ⊕⊕⊕⊝ | ‐ |
| Quality of life: Clinically relevant improvement in FKSI‐DRS | 367 per 1000 | 187 more per 1000 (from 103 more to 287 more) | RR 1.51 (1.28 to 1.78) | 704 | ⊕⊕⊕⊝ | ‐ |
| Quality of life: clinically relevant improvement in EQ‐5D VAS | 391 per 1000 | 145 more per 1000 (from 63 more to 238 more) | RR 1.37 (1.16‐1.61) | 703 (1 study) | ⊕⊕⊕⊝ | ‐ |
| Adverse events (grade ≥ 3) | 365 per 1000 | 179 fewer per 1000 | RR 0.51 | 803 | ⊕⊕⊕⊝ | ‐ |
| *The basis for the assumed risk (e.g. the median control group risk across studies) is provided in footnotes. The corresponding risk (and its 95% confidence interval) is based on the assumed risk in the comparison group and the relative effect of the intervention (and its 95% CI). | ||||||
| GRADE Working Group grades of evidence | ||||||
| 1 Downgraded for performance bias due to cross‐over. | ||||||
| Study ID | Comparison (group 1 vs group 0) | Median OS (95% CI) (months) | 1‐year mortality | Comments | ||
| Group 1 | Group 0 | Group 1 | Group 0 | |||
| 1 (IFN‐α alone vs standard targeted therapies) | 7.3 (6.1 to 8.8) | 10.9 (8.6 to 12.7) | 70% | 53% | From curves. | |
| 21.8 (17.9 to 26.9) | 26.4 (23.0 to 32.9) | 12.3% | 10.1% | Numbers reported. | ||
| 2 (IFN‐α + targeted therapies vs standard targeted therapies) | 8.4 (6.6 to 10.3) | 10.9 (8.6 to 12.7) | 60% | 53% | From curves. | |
| 3 (IFN‐α alone vs IFN‐α + bevacizumab) | 21.3 | 23.3 | 32% | 26% | From curves. | |
| 17.4 (14.4 to 20.0) | 18.3 (16.5 to 22.5) | 39% | 34% | From curves with numbers and censoring marks. | ||
| 4 (IFN‐α + bevacizumab vs standard targeted therapies) | Not reported | Not reported | 10% | 26% | Reported. | |
| 5 (Vaccine treatment vs standard therapies) | 19.2 | 20.1 | 35% | 33% | From curves with censoring. | |
| 33.1 | Not reached | 17% | 22% | Numbers reported. | ||
| 6 (Targeted immunotherapy alone vs targeted standard therapy) | 25.0 (21.8 to NE) | 19.6 (17.6 to 23.1) | 24% | 34% | From curves with numbers with censoring marks. | |
| CI: confidence interval; IFN‐α: interferon‐α; NE: not estimable; OS: overall survival. | ||||||
| Comparison (group 1 vs group 0) | Study | Subgroup | Sample size | Treatment effects (95% CI) or P values |
| 1 (IFN‐α alone vs standard targeted therapies) | Prior nephrectomy | 278 | HR 1.2 (0.9 to 1.6) | |
| Prior nephrectomy | 674 | HR 1.2 (0.95 to 1.5) | ||
| Pooled | Prior nephrectomy | 952 | HR 1.2 (1.0 to 1.43), I2 = 0% | |
| No prior nephrectomy | 138 | HR 1.7 (1.1 to 2.5) | ||
| No prior nephrectomy | 76 | HR 1.23 (0.8 to 2.1) | ||
| Pooled | No prior nephrectomy | 214 | HR 1.48 (1.1 to 2.0), I2 = 1% | |
| KPS ≤ 70 | 340 | HR 1.39 (1.11 to 1.75) | ||
| KPS > 70 | 75 | HR 0.93 (0.53 to 1.67) | ||
| With poor risk | 48 | HR 1.15 (0.83 to 2.78) | ||
| Intermediate risk | 421 | HR 1.27 (1.00 to 1.62) | ||
| ECOG Performance Status 0 | 460 | HR 1.1 (0.87 to 1.5) | ||
| ECOG Performance Status 1 | 290 | HR 1.4 (1.05 to 1.7) | ||
| 3 (IFN‐α alone vs IFN‐α + bevacizumab) | Favourable risk | 180 | HR 1.09 (0.73 to 1.61), P = 0.6798 | |
| Favourable risk | 192 | HR 1.11 (0.8 to 1.56), P = 0.5189 | ||
| Pooled | Favourable risk | 372 | HR 1.10 (0.85 to 1.43), I2 = 0% | |
| Intermediate risk | 392 | HR 1.20 (0.95 to 1.54), P = 0.1230 | ||
| Intermediate risk | 465 | HR 1.15 (0.94 to 1.41), P = 0.1688 | ||
| Pooled | Intermediate risk | 857 | HR 1.18 (1.01 to 1.37), I2 = 0% | |
| Poor risk | 59 | HR 1.18 (0.68 to 2.04), P = 0.5594 | ||
| Poor risk | 75 | HR 1.33 (0.82 to 2.17), P = 0.2439 | ||
| Pooled | Poor risk | 124 | HR 1.27 (0.88 to 1.82), I2 = 0% | |
| Prior nephrectomy | 620 | HR 1.10 (0.93 to 1.32), P = 0.2871 | ||
| No prior nephrectomy | 112 | HR 1.54 (1.02 to 2.27), P = 0.0381 | ||
| 5 (Vaccine treatment vs standard therapies) | Favourable risk, treated with IL‐2 (SOC) | 100 | HR 0.54 (0.30 to 0.98), P = 0.046 | |
| Favourable risk, treated with IFN‐α (SOC) | 206 | P > 0.05 | ||
| Good prognosis, treated with sunitinib (SOC) | 119 | P > 0.05 | ||
| Intermediate prognosis, treated with IL‐2 (SOC) | 70 | P > 0.05 | ||
| Intermediate prognosis, treated with IFN‐α (SOC) | 169 | P > 0.05 | ||
| Intermediate prognosis, treated with sunitinib (SOC) | 65 | P > 0.05 | ||
| Favourable risk (n = 92) | 92 | HR 0.82, P = 0.59 | ||
| Intermediate risk (n = 240) | 240 | HR 1.52, P < 0.05 | ||
| 6 (Targeted immunotherapy alone vs standard targeted therapies) | Favourable risk group (MSKCC risk group) | 293 | HR 0.89 (0.59 to 1.32) | |
| Intermediate risk group (MSKCC risk group) | 404 | HR 0.76 (0.58 to 0.99) | ||
| Poor risk group (MSKCC risk group) | 124 | HR 0.47 (0.30 to 0.73) | ||
| 1 previous antiangiogenic regimen | 591 | HR 0.71 (0.56 to 0.90) | ||
| 2 previous antiangiogenic regimens | 230 | HR 0.89 (0.61 to 1.29) | ||
| CI: confidence interval; ECOG: Eastern Cooperative Oncology Group; HR: hazard ratio; IFN‐α: interferon‐α; IL: interleukin; KPS: Karnovsky Performance Score; MSKCC: Memorial Sloan‐Kettering Cancer Center; n: number of participants; SOC: standard of care. | ||||
| Comparison (group 1 vs group 0) | Study (reported in) | Measurement instrument | Group 1 | Group 0 | Favours | Difference (95% CI) or P values |
| 1 (IFN‐α alone vs standard targeted therapies) | Motzer 2007 (reported in Cella 2008) | FACT‐G total score, mean postbaseline score over 17 weeks | 76.8 (n = 357) | 82.3 (n = 373) | Group 0 | ‐5.58 (‐7.25 to ‐3.91) |
| Motzer 2007 (reported in Cella 2008) | FKSI‐15, mean postbaseline score over 17 weeks | 42.1 (n = 357) | 45.3 (n = 373) | Group 0 | ‐3.27 (‐4.18 to ‐2.36) | |
| Motzer 2007 (reported in Cella 2008) | FKSI‐DRS, mean postbaseline score over 17 weeks | 27.4 (n = 357) | 29.4 (n = 373) | Group 0 | ‐1.98 (‐2.51 to ‐1.46) | |
| Hudes 2007, (reported in Yang 2010) | EQ‐5D Index, mean score on treatment | 0.492 (n = 115) | 0.590 (n = 157) | Group 0 | ‐0.099 (95% CI ‐0.162 to ‐0.036) | |
| Motzer 2007 (reported in Cella 2008) | EQ‐5D Index, mean postbaseline score over 17 weeks | 0.725 (n = 357) | 0.762 (n = 373) | Group 0 | ‐0.0364 (‐0.0620 to ‐0.0109) | |
| Pooled EQ‐5D | 472 | 530 | Group 0 | ‐0.06 (‐0.12 to 0), I2 = 69% | ||
| Hudes 2007, (reported in Yang 2010) | EQ‐VAS, mean score on treatment | 58.83 (n = 115) | 63.33 (n = 157) | Group 0 | ‐4.50 (‐8.184 to ‐0.819) | |
| Motzer 2007, (reported in Cella 2008) | EQ‐VAS, mean postbaseline score over 17 weeks | 68.7 (n = 357) | 73.4 (n = 373) | Group 0 | ‐4.74 (‐6.87 to ‐2.60) | |
| Pooled EQ‐VAS | 472 | 530 | Group 0 | ‐4.68 (‐6.53 to ‐2.83), I2 = 0% | ||
| 6 (Targeted immunotherapy alone vs standard targeted therapies) | Motzer 2015a (reported in Cella 2016) | FKSI‐DRS, mean score at baseline | 30.2 ± 4.4 (n = 362) | 30.1 ± 4.8 (n = 344) | ‐ | Difference in mean change 1.6 (1.4 to 1.9), P < 0.0001 |
| FKSI‐DRS, mean change from baseline to week 28 | 0.4 ± 5 (n = 164) | ‐1.2 ± 4 (n = 122) | Group 1 | |||
| FKSI‐DRS, mean change from baseline to week 52 | 1.6 ± 4 (n = 97) | ‐1.0 ± 6 (n = 63) | Group 1 | |||
| FKSI‐DRS, mean change from baseline to week 104 | 3.5 ± 4.1 (n = 20) | 0.2 ± 6 (n = 9) | Group 1 | |||
| Clinically important improvement from baseline by ≥ 2 FKSI‐DRS points | 200 (55%)/361 | 126 (37%)/343 | Group 1 | RR 1.51 (1.28 to 1.78); P < 0.0001 | ||
| Time to clinically important improvement ≥ 2 FKSI‐DRS points | Median: 4.7 months (3.7 to 7.5) | Median not reached | Group 1 | HR 1.66 (1.33 to 2.08); P < 0.0001 | ||
| Clinically important improvement from baseline by ≥ 3 FKSI‐DRS points | 148 (41%)/361 | 95 (28%)/343 | Group 1 | RR 1.48 (1.20 to 1.83); P = 0.0002 | ||
| Time to clinically important improvement ≥ 3 FKSI‐DRS points | Median not estimable | Median not estimable | Group 1 | HR 1.61 (1.24 to 2.09); P < 0.0003 | ||
| EQ‐5D utility index, mean score at baseline | 0.78 ± 0.24 (n = 362) | 0.78 ± 0.21 (n = 344) | ‐ | No significant differences in proportion of participants with clinical important improvements (P = 0.070) or time to improvement (P = 0.86). | ||
| EQ‐5D utility index, mean change from baseline to week 28 | 0.052 ± 0.22 (n = 164) | ‐0.03 ± 0.2 (n = 122) | Group 1 | |||
| EQ‐5D utility index, mean change from baseline to week 52 | 0.06 ± 0.1 (n = 98) | ‐0.01 ± 0.2 (n = 63) | Group 1 | |||
| EQ‐5D utility index, mean change from baseline to week 104 | 0.13 ± 0.7 (n = 20) | ‐0.02 ± 0.15 (n = 9) | Group 1 | |||
| EQ‐5D VAS, mean score at baseline | 73.3 ± 18.5 (n = 362) | 72.5 ± 18.7 (n = 344) | ‐ | ‐ | ||
| EQ‐5D VAS, mean change from baseline to week 28 | 5 ± 13 (n = 164) | ‐3 ± 11 (n = 122) | Group 1 | ‐ | ||
| EQ‐5D VAS, mean change from baseline to week 52 | 7 ± 15 (n = 98) | ‐2 ± 16 (n = 63) | Group 1 | ‐ | ||
| EQ‐5D VAS, mean change from baseline to week 104 | 9 ± 9 (n = 20) | 1 ± 18 (n = 9) | Group 1 | ‐ | ||
| Clinically important improvement from baseline by ≥ 7 EQ‐5D VAS points | 192 (53%)/360 | 134(39%)/343 | ‐ | RR 1.37 (1.16 to 1.61); P = 0.0001 | ||
| Time to clinically important improvement | Median: 6.5 months (3.9 to 12.2) | Median: 23.1 months (15.4 to not estimated) | ‐ | HR 1.37 (1.10 to 1.71) | ||
| CI: confidence interval; EQ‐5D Index: EuroQol 5‐Dimension (MID 0.06 to 0.08, Pickard 2007); EQ‐VAS: EuroQol Visual Analog Scale (MID 7, Pickard 2007); FACT‐G: Functional Assessment of Cancer Therapy ‐ General (MID 4 points for better rating and 8 points for worse rating, Ringash 2007); FKSI‐15: FACT‐Kidney Symptom Index (MID 3 points, Cella 1997); FKSI‐DRS: FACT‐Kidney Symptom Index Disease Related Symptoms (MID 2 points, Cella 1997); HR: hazard ratio; MID: minimal important difference; n: number of participants. | ||||||
| Outcome or subgroup title | No. of studies | No. of participants | Statistical method | Effect size |
| 1 1‐year mortality Show forest plot | 2 | 1166 | Risk Ratio (M‐H, Random, 95% CI) | 1.30 [1.13, 1.51] |
| 2 Overall survival Show forest plot | 2 | Hazard Ratio (Random, 95% CI) | 1.28 [1.11, 1.49] | |
| 3 Quality of life Show forest plot | 2 | Mean Difference (Random, 95% CI) | Subtotals only | |
| 3.1 FACT‐G | 1 | 730 | Mean Difference (Random, 95% CI) | ‐5.58 [‐7.25, ‐3.91] |
| 3.2 FKSI‐15 | 1 | 730 | Mean Difference (Random, 95% CI) | ‐3.27 [‐4.18, ‐2.36] |
| 3.3 FKSI‐DRS | 1 | 730 | Mean Difference (Random, 95% CI) | ‐1.98 [‐2.51, ‐1.45] |
| 3.4 EQ‐5D | 2 | 1000 | Mean Difference (Random, 95% CI) | ‐0.06 [‐0.12, ‐0.00] |
| 3.5 EQ‐VAS | 2 | 1000 | Mean Difference (Random, 95% CI) | ‐4.68 [‐6.53, ‐2.83] |
| 4 Adverse events (grade ≥ 3) Show forest plot | 1 | Risk Ratio (M‐H, Random, 95% CI) | Subtotals only | |
| 5 Progression‐free survival Show forest plot | 2 | Hazard Ratio (Random, 95% CI) | 2.23 [1.79, 2.77] | |
| 6 Tumour remission Show forest plot | 2 | 1007 | Risk Ratio (M‐H, Random, 95% CI) | 0.30 [0.12, 0.75] |
| Outcome or subgroup title | No. of studies | No. of participants | Statistical method | Effect size |
| 1 1‐year mortality Show forest plot | 1 | Risk Ratio (M‐H, Random, 95% CI) | Subtotals only | |
| 2 Overall survival Show forest plot | 1 | Hazard Ratio (Random, 95% CI) | Subtotals only | |
| 3 Adverse events (grade ≥ 3) Show forest plot | 1 | Risk Ratio (M‐H, Random, 95% CI) | Subtotals only | |
| 4 Progression‐free survival Show forest plot | 1 | Hazard Ratio (Random, 95% CI) | Subtotals only | |
| 5 Tumour remission Show forest plot | 1 | Risk Ratio (M‐H, Random, 95% CI) | Subtotals only | |
| Outcome or subgroup title | No. of studies | No. of participants | Statistical method | Effect size |
| 1 1‐year mortality Show forest plot | 2 | 1381 | Risk Ratio (M‐H, Random, 95% CI) | 1.17 [1.00, 1.36] |
| 2 Overall survival Show forest plot | 2 | Hazard Ratio (Random, 95% CI) | 1.13 [1.00, 1.28] | |
| 3 Adverse events (grade ≥ 3) Show forest plot | 2 | 1350 | Risk Ratio (M‐H, Random, 95% CI) | 0.77 [0.71, 0.84] |
| 4 Progression‐free survival Show forest plot | 2 | Hazard Ratio (Random, 95% CI) | 1.53 [1.36, 1.73] | |
| 5 Tumour remission Show forest plot | 2 | 1205 | Risk Ratio (M‐H, Random, 95% CI) | 0.39 [0.31, 0.50] |
| Outcome or subgroup title | No. of studies | No. of participants | Statistical method | Effect size |
| 1 1‐year mortality Show forest plot | 1 | Risk Ratio (M‐H, Random, 95% CI) | Subtotals only | |
| 2 Adverse events (grade ≥ 3) Show forest plot | 1 | Risk Ratio (M‐H, Random, 95% CI) | Subtotals only | |
| 3 Progression‐free survival Show forest plot | 1 | Hazard Ratio (Random, 95% CI) | Subtotals only | |
| 4 Tumour remission Show forest plot | 1 | Risk Ratio (M‐H, Random, 95% CI) | Subtotals only | |
| Outcome or subgroup title | No. of studies | No. of participants | Statistical method | Effect size |
| 1 1‐year mortality Show forest plot | 2 | 1034 | Risk Ratio (M‐H, Random, 95% CI) | 1.10 [0.91, 1.32] |
| 2 Overall survival Show forest plot | 2 | 1071 | Hazard Ratio (Fixed, 95% CI) | 1.14 [0.96, 1.37] |
| 3 Adverse events (grade ≥ 3) Show forest plot | 2 | 1065 | Risk Ratio (M‐H, Random, 95% CI) | 1.16 [0.97, 1.39] |
| 4 Progression‐free survival Show forest plot | 1 | 339 | Hazard Ratio (Random, 95% CI) | 1.05 [0.87, 1.27] |
| 5 Tumour remission Show forest plot | 2 | 1071 | Risk Ratio (M‐H, Random, 95% CI) | 0.93 [0.76, 1.13] |
| Outcome or subgroup title | No. of studies | No. of participants | Statistical method | Effect size |
| 1 1‐year mortality Show forest plot | 1 | 821 | Risk Ratio (M‐H, Random, 95% CI) | 0.70 [0.56, 0.87] |
| 2 Overall survival Show forest plot | 1 | Hazard Ratio (Random, 95% CI) | 0.73 [0.60, 0.89] | |
| 3 Quality of life Show forest plot | 1 | Risk Ratio (M‐H, Random, 95% CI) | Subtotals only | |
| 3.1 Clinical important MID in FKSI‐DRS | 1 | 704 | Risk Ratio (M‐H, Random, 95% CI) | 1.51 [1.28, 1.78] |
| 3.2 Clinical important MID in EQ‐5D‐VAS | 1 | 703 | Risk Ratio (M‐H, Random, 95% CI) | 1.37 [1.16, 1.61] |
| 4 Adverse events (grade ≥ 3) Show forest plot | 1 | 803 | Risk Ratio (M‐H, Random, 95% CI) | 0.51 [0.40, 0.65] |
| 5 Progression‐free survival Show forest plot | 1 | Hazard Ratio (Random, 95% CI) | 0.88 [0.75, 1.03] | |
| 6 Tumour remission Show forest plot | 1 | 750 | Risk Ratio (M‐H, Random, 95% CI) | 4.39 [2.84, 6.80] |