Immunotherapy for metastatic renal cell carcinoma
Information
- DOI:
- https://doi.org/10.1002/14651858.CD011673.pub2Copy DOI

- Database:
-
- Cochrane Database of Systematic Reviews
- Version published:
-
- 15 May 2017see what's new
- Type:
-
- Intervention
- Stage:
-
- Review
- Cochrane Editorial Group:
-
Cochrane Urology Group
- Copyright:
-
- Copyright © 2017 The Cochrane Collaboration. Published by John Wiley & Sons, Ltd.
Article metrics
Altmetric:
Cited by:
Authors
Contributions of authors
SU: wrote the protocol, contributed to search strategy development, performed the systematic search, extracted data, judged risk of bias and quality of evidence, summarized treatment effects and wrote the review.
IM: wrote the protocol, contributed to search strategy development, scanned the abstract or title, read all potentially relevant records as full text, screened ongoing trials, extracted data, judged risk of bias and wrote the review.
MN: graded the evidence and critically commented the review.
DR: scanned the abstract or title, read all potentially relevant records as full text, extracted data and judged risk of bias.
AVH: extracted data, judged risk of bias and critically commented the review.
FP: extracted data, judged risk of bias and critically commented the review.
FG: wrote the protocol and screened ongoing trials.
BS: wrote the protocol, contributed to search strategy development and critically commented the review.
Sources of support
Internal sources
-
Wilhelm‐Roux‐Programme, Martin Luther University Halle‐Wittenberg, Germany.
Financial support (grant number 26/18)
External sources
-
Federal Ministry of Education and Research, Germany.
Financial support (grant number: 01KG1402)
Declarations of interest
SU: reported the following financial activities related to the submitted work: institution received support from the Federal Ministry of Education and Research, Germany (grant number: 01KG1024) and from the Wilhelm‐Roux‐Program, Martin Luther University Halle‐Wittenberg, Germany, to write this review.
IM: reported the following financial activities related to the submitted work: institution received support from the Wilhelm‐Roux‐Program, Martin Luther University Halle‐Wittenberg, Germany, for travel to meetings for this review.
MN: none known.
DR: reported the following financial activities related to the submitted work: institution received support from the Wilhelm‐Roux‐Program, Martin Luther University Halle‐Wittenberg, Germany, for travel to meetings for this review.
AVH: none known.
FP: none known.
FG: none known.
BS: none known.
Acknowledgements
We appreciate the excellent support from the Cochrane Urology Group, its trials search co‐ordinator team and Chris Coppin.
Version history
| Published | Title | Stage | Authors | Version |
| 2017 May 15 | Immunotherapy for metastatic renal cell carcinoma | Review | Susanne Unverzagt, Ines Moldenhauer, Monika Nothacker, Dorothea Roßmeißl, Andreas V Hadjinicolaou, Frank Peinemann, Francesco Greco, Barbara Seliger | |
| 2015 Apr 30 | Immunotherapy for metastatic renal cell carcinoma | Protocol | Susanne Unverzagt, Ines Moldenhauer, Chris Coppin, Francesco Greco, Barbara Seliger | |
Differences between protocol and review
This review was based on a published protocol (Unverzagt 2015), with differences as described here.
We included only studies that compared protocol‐defined immunotherapeutic interventions (experimental interventions) to standard treatment options as defined in current guidelines for systemic therapy in people with mRCC (e.g. Escudier 2014; German Guideline Programme in Oncology 2015; Ljungberg 2015). While working on the review, the comparator interventions were adapted accordingly.
We omitted tumour remission from our 'Summary of Findings' tables due to determining its low patient‐importance during the editorial process.
We corrected the outcome serious adverse effects (grade 3 or greater) to adverse events (grade 3 or greater).
We adapted the definition of stage IV RCC patients according to updated TNM classification to T4 any N M0 and any T, any N M1 (Sobin 2009; Wittekind 2012).
Notes
We have based parts of the Methods section of this review on a standard template developed by the Cochrane Metabolic and Endocrine Disorders Group, which has been modified and adapted for use by the Cochrane Urology Group.
Keywords
MeSH
Medical Subject Headings (MeSH) Keywords
- Antineoplastic Agents [adverse effects, *therapeutic use];
- Bevacizumab [therapeutic use];
- Cancer Vaccines [therapeutic use];
- Carcinoma, Renal Cell [mortality, secondary, *therapy];
- Clinical Trials, Phase III as Topic;
- Immunologic Factors [adverse effects, *therapeutic use];
- Immunotherapy [adverse effects, *methods];
- Indoles [therapeutic use];
- Interferon‐alpha [therapeutic use];
- Kidney Neoplasms [mortality, pathology, *therapy];
- Longevity [drug effects];
- Pyrroles [therapeutic use];
- Quality of Life;
- Randomized Controlled Trials as Topic;
- Sirolimus [analogs & derivatives, therapeutic use];
- Sunitinib;
Medical Subject Headings Check Words
Humans;
PICOs


Risk of bias summary: review authors' judgements about each risk of bias item for each included study.

Risk of bias graph: review authors' judgements about each risk of bias item presented as percentages across all included studies.

Forest plot of comparison: 1 Interferon‐α (IFN‐α) alone versus standard targeted therapy in first‐line therapy of metastatic renal cell carcinoma, outcome: 1.1 1‐year mortality.

Forest plot of comparison: 3 Interferon (IFN‐α) alone versus IFN‐α plus bevacizumab in first‐line therapy of metastatic renal cell carcinoma, outcome: 3.1 1‐year mortality.
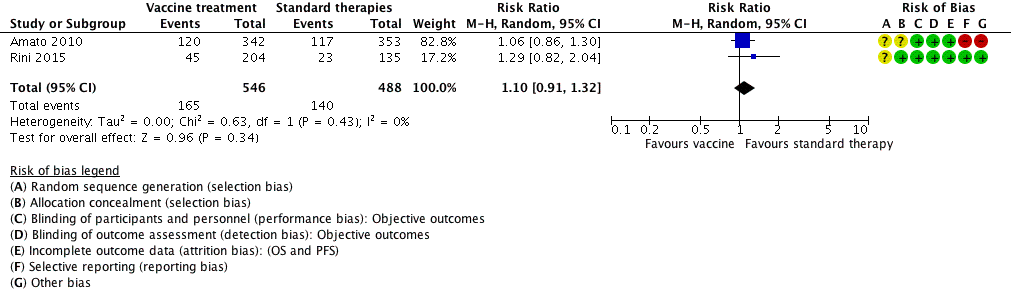
Forest plot of comparison: 5 Vaccine treatment versus standard therapies in first‐line therapy of metastatic renal cell carcinoma, outcome: 5.1 1‐year mortality.

Comparison 1 Interferon‐α (IFN‐α) alone versus standard targeted therapies in first‐line therapy of metastatic renal cell carcinoma, Outcome 1 1‐year mortality.
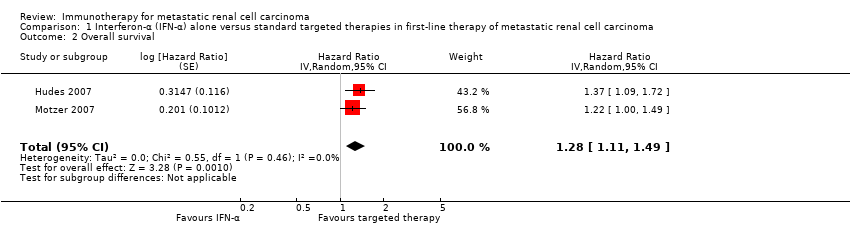
Comparison 1 Interferon‐α (IFN‐α) alone versus standard targeted therapies in first‐line therapy of metastatic renal cell carcinoma, Outcome 2 Overall survival.

Comparison 1 Interferon‐α (IFN‐α) alone versus standard targeted therapies in first‐line therapy of metastatic renal cell carcinoma, Outcome 3 Quality of life.
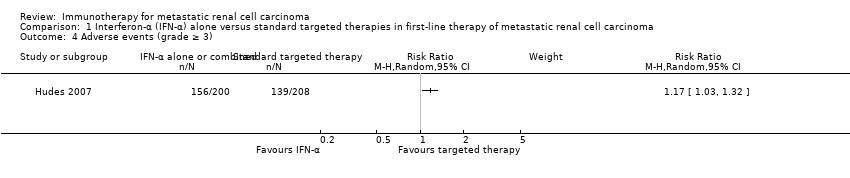
Comparison 1 Interferon‐α (IFN‐α) alone versus standard targeted therapies in first‐line therapy of metastatic renal cell carcinoma, Outcome 4 Adverse events (grade ≥ 3).

Comparison 1 Interferon‐α (IFN‐α) alone versus standard targeted therapies in first‐line therapy of metastatic renal cell carcinoma, Outcome 5 Progression‐free survival.
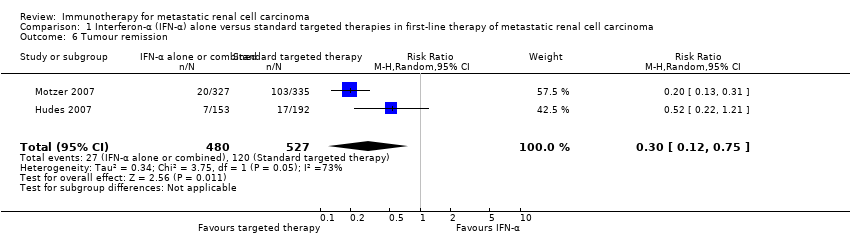
Comparison 1 Interferon‐α (IFN‐α) alone versus standard targeted therapies in first‐line therapy of metastatic renal cell carcinoma, Outcome 6 Tumour remission.
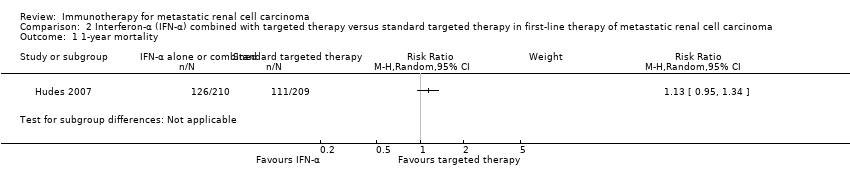
Comparison 2 Interferon‐α (IFN‐α) combined with targeted therapy versus standard targeted therapy in first‐line therapy of metastatic renal cell carcinoma, Outcome 1 1‐year mortality.
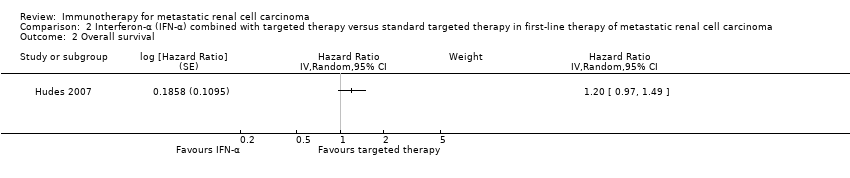
Comparison 2 Interferon‐α (IFN‐α) combined with targeted therapy versus standard targeted therapy in first‐line therapy of metastatic renal cell carcinoma, Outcome 2 Overall survival.
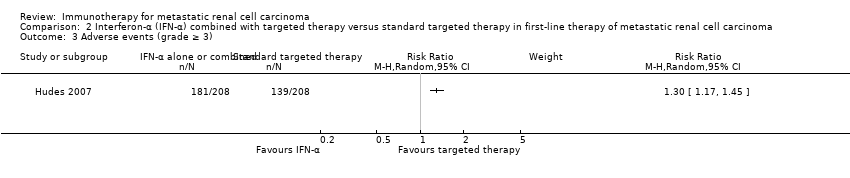
Comparison 2 Interferon‐α (IFN‐α) combined with targeted therapy versus standard targeted therapy in first‐line therapy of metastatic renal cell carcinoma, Outcome 3 Adverse events (grade ≥ 3).
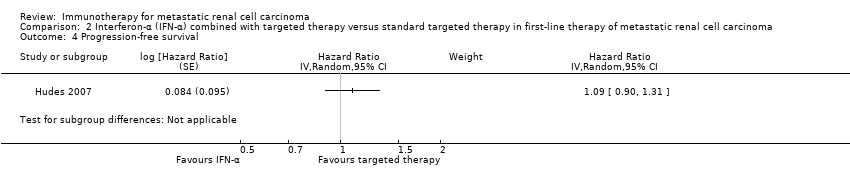
Comparison 2 Interferon‐α (IFN‐α) combined with targeted therapy versus standard targeted therapy in first‐line therapy of metastatic renal cell carcinoma, Outcome 4 Progression‐free survival.

Comparison 2 Interferon‐α (IFN‐α) combined with targeted therapy versus standard targeted therapy in first‐line therapy of metastatic renal cell carcinoma, Outcome 5 Tumour remission.

Comparison 3 Interferon (IFN‐α) alone versus IFN‐α plus bevacizumab in first‐line therapy of metastatic renal cell carcinoma, Outcome 1 1‐year mortality.

Comparison 3 Interferon (IFN‐α) alone versus IFN‐α plus bevacizumab in first‐line therapy of metastatic renal cell carcinoma, Outcome 2 Overall survival.

Comparison 3 Interferon (IFN‐α) alone versus IFN‐α plus bevacizumab in first‐line therapy of metastatic renal cell carcinoma, Outcome 3 Adverse events (grade ≥ 3).

Comparison 3 Interferon (IFN‐α) alone versus IFN‐α plus bevacizumab in first‐line therapy of metastatic renal cell carcinoma, Outcome 4 Progression‐free survival.
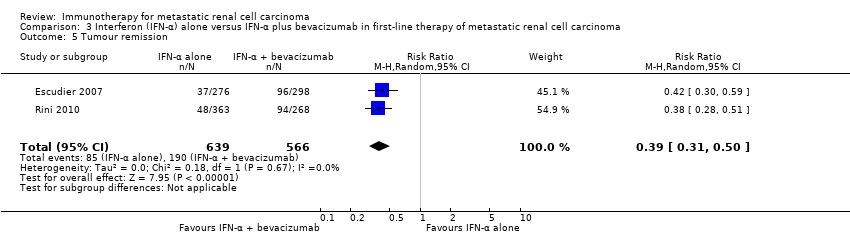
Comparison 3 Interferon (IFN‐α) alone versus IFN‐α plus bevacizumab in first‐line therapy of metastatic renal cell carcinoma, Outcome 5 Tumour remission.

Comparison 4 Interferon‐α (IFN‐α) plus bevacizumab versus standard targeted therapies in first‐line therapy of metastatic renal cell carcinoma, Outcome 1 1‐year mortality.

Comparison 4 Interferon‐α (IFN‐α) plus bevacizumab versus standard targeted therapies in first‐line therapy of metastatic renal cell carcinoma, Outcome 2 Adverse events (grade ≥ 3).

Comparison 4 Interferon‐α (IFN‐α) plus bevacizumab versus standard targeted therapies in first‐line therapy of metastatic renal cell carcinoma, Outcome 3 Progression‐free survival.

Comparison 4 Interferon‐α (IFN‐α) plus bevacizumab versus standard targeted therapies in first‐line therapy of metastatic renal cell carcinoma, Outcome 4 Tumour remission.

Comparison 5 Vaccine treatment versus standard therapies in first‐line therapy of metastatic renal cell carcinoma, Outcome 1 1‐year mortality.

Comparison 5 Vaccine treatment versus standard therapies in first‐line therapy of metastatic renal cell carcinoma, Outcome 2 Overall survival.

Comparison 5 Vaccine treatment versus standard therapies in first‐line therapy of metastatic renal cell carcinoma, Outcome 3 Adverse events (grade ≥ 3).

Comparison 5 Vaccine treatment versus standard therapies in first‐line therapy of metastatic renal cell carcinoma, Outcome 4 Progression‐free survival.

Comparison 5 Vaccine treatment versus standard therapies in first‐line therapy of metastatic renal cell carcinoma, Outcome 5 Tumour remission.

Comparison 6 Targeted immunotherapy alone versus standard targeted therapies in previously treated patients with metastatic renal cell carcinoma, Outcome 1 1‐year mortality.

Comparison 6 Targeted immunotherapy alone versus standard targeted therapies in previously treated patients with metastatic renal cell carcinoma, Outcome 2 Overall survival.

Comparison 6 Targeted immunotherapy alone versus standard targeted therapies in previously treated patients with metastatic renal cell carcinoma, Outcome 3 Quality of life.

Comparison 6 Targeted immunotherapy alone versus standard targeted therapies in previously treated patients with metastatic renal cell carcinoma, Outcome 4 Adverse events (grade ≥ 3).
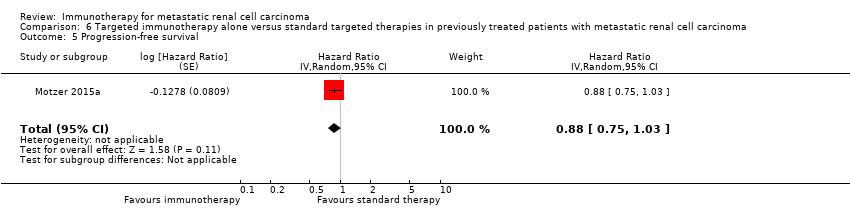
Comparison 6 Targeted immunotherapy alone versus standard targeted therapies in previously treated patients with metastatic renal cell carcinoma, Outcome 5 Progression‐free survival.

Comparison 6 Targeted immunotherapy alone versus standard targeted therapies in previously treated patients with metastatic renal cell carcinoma, Outcome 6 Tumour remission.
| IFN‐α alone versus standard targeted therapy for mRCC | ||||||
| Patient population: previously untreated patients with mRCC Settings: phase III, international, multicentre, open‐label Intervention: IFN‐α alone Comparison: standard targeted therapy (sunitinib or temsirolimus) | ||||||
| Outcomes | Illustrative comparative risks* (95% CI) | Relative effect | No of participants | Quality of the evidence | Comments | |
| Assumed risk | ||||||
| Risk with standard targeted therapy | Risk difference with IFN‐α alone (95% CI) | |||||
| 1‐year mortality | Lowa | RR 1.3 | 1166 | ⊕⊕⊕⊝ | ‐ | |
| 150 per 1000 | 45 more per 1000 | |||||
| Moderatea | ||||||
| 280 per 1000 | 84 more per 1000 | |||||
| Higha | ||||||
| 550 per 1000 | 165 more per 1000 | |||||
| QoL | The mean QoL in the control group was | MD 5.58 lower | ‐ | 730 | ⊕⊕⊝⊝ | ‐ |
| QoL | The mean QoL in the control group was | MD 3.27 lower (4.18 to 2.36 lower) | ‐ | 730 | ⊕⊕⊝⊝ | ‐ |
| QoL | The mean QoL in the control group was | MD 1.98 lower (2.51 to 1.46 lower) | ‐ | 730 | ⊕⊕⊝⊝ | ‐ |
| QoL | The mean QoL in the control group was | MD 0.06 lower (0.12 lower to 0 higher) | ‐ | 1002 (2 studies) | ⊕⊕⊝⊝ | ‐ |
| QoL | The mean QoL in the control groups was | MD 4.68 lower (6.53 to 2.83 lower) | ‐ | 1002 (2 studies) | ⊕⊕⊝⊝ | ‐ |
| Adverse events (grade ≥ 3) | 668 per 1000 | 114 more per 1000 | RR 1.17 | 408 | ⊕⊕⊝⊝ | ‐ |
| *The basis for the assumed risk (e.g. the median control group risk across studies) is provided in footnotes. The corresponding risk (and its 95% confidence interval) is based on the assumed risk in the comparison group and the relative effect of the intervention (and its 95% CI). | ||||||
| GRADE Working Group grades of evidence | ||||||
| 1 Downgraded for selection bias and performance bias due to cross‐over. | ||||||
| IFN‐α alone or combined with targeted therapy compared to standard targeted therapy in first‐line therapy of mRCC | ||||||
| Patient population: previously untreated patients with mRCC Setting: phase III, international, multicentre, open‐label Intervention: IFN‐α combined with targeted therapy Comparison: standard targeted therapy (temsirolimus) | ||||||
| Outcomes | Illustrative comparative risks* (95% CI) | Relative effect | No of participants | Quality of the evidence | Comments | |
| Assumed risk | ||||||
| Risk with standard targeted therapy | Risk difference with IFN‐α combined with targeted therapy (95% CI) | |||||
| 1‐year mortality | Lowa | RR 1.13 | 419 | ⊕⊕⊕⊝ | ‐ | |
| 150 per 1000 | 20 more per 1000 | |||||
| Moderatea | ||||||
| 280 per 1000 | 36 more per 1000 | |||||
| Higha | ||||||
| 550 per 1000 | 71 more per 1000 | |||||
| Quality of life | No evidence available | |||||
| Adverse events (grade ≥ 3) | 668 per 1000 | 200 more per 1000 | RR 1.30 | 416 | ⊕⊕⊝⊝ | ‐ |
| *The basis for the assumed risk (e.g. the median control group risk across studies) is provided in footnotes. The corresponding risk (and its 95% confidence interval) is based on the assumed risk in the comparison group and the relative effect of the intervention (and its 95% CI). | ||||||
| GRADE Working Group grades of evidence | ||||||
| 1 Downgraded for imprecision due to wide confidence intervals; clinical action would differ between lower and upper boundary of the confidence interval. | ||||||
| IFN‐α alone versus IFN‐α + bevacizumab in first‐line therapy of mRCC | ||||||
| Patient population: previously untreated patient with mRCC Setting: phase III, international, multicentre, Escudier 2007: double‐blind, placebo‐controlled; Rini 2010: open‐label Intervention: IFN‐α alone Comparison: IFN‐α alone + bevacizumab | ||||||
| Outcomes | Illustrative comparative risks* (95% CI) | Relative effect | No of participants | Quality of the evidence | Comments | |
| Assumed risk | ||||||
| Risk with standard therapy (IFN‐α + bevacizumab) | Risk difference with IFN‐α alone (95% CI) | |||||
| 1‐year mortality | Low | RR 1.17 | 1381 | ⊕⊕⊝⊝ | ‐ | |
| 150 per 1000 | 25 more per 1000 | |||||
| Moderate | ||||||
| 280 per 1000 | 48 more per 1000 | |||||
| High | ||||||
| 550 per 1000 | 93 more per 1000 | |||||
| Quality of life | No evidence available | |||||
| Adverse events (grade ≥ 3) Follow‐up: up to 28 days after last dose to 65 months | 705 per 1000 | 162 fewer per 1000 | RR 0.77 | 1350 | ⊕⊕⊕⊝ | ‐ |
| *The basis for the assumed risk (e.g. the median control group risk across studies) is provided in footnotes. The corresponding risk (and its 95% confidence interval) is based on the assumed risk in the comparison group and the relative effect of the intervention (and its 95% CI). | ||||||
| GRADE Working Group grades of evidence | ||||||
| 1 Downgraded for selection bias and performance bias due to substantial cross‐over. | ||||||
| IFN‐α + bevacizumab versus targeted therapies in first‐line therapy of mRCC | ||||||
| Patient population: previously untreated patients with mRCC Setting: phase II, national (France), multicentre, open‐label Intervention: IFN‐α + bevacizumab Comparison: standard targeted therapies (sunitinib) | ||||||
| Outcomes | Illustrative comparative risks* (95% CI) | Relative effect | No of participants | Quality of the evidence | Comments | |
| Assumed risk | ||||||
| Risk with standard targeted therapies | Risk difference with IFN‐α + bevacizumab (95% CI) | |||||
| 1‐year mortality Follow‐up: 23.2 months | Lowa | RR 0.37 | 83 | ⊕⊕⊝⊝ | ‐ | |
| 150 per 1000 | 95 fewer per 1000 | |||||
| Moderatea | ||||||
| 280 per 1000 | 176 fewer per 1000 | |||||
| Higha | ||||||
| 550 per 1000 | 347 fewer per 1000 | |||||
| Quality of life | No evidence available | |||||
| Adverse events (grade ≥ 3) Follow‐up: 48 weeks | 595 per 1000 | 107 more per 1000 | RR 1.18 | 82 | ⊕⊕⊝⊝ | ‐ |
| *The basis for the assumed risk (e.g. the median control group risk across studies) is provided in footnotes. The corresponding risk (and its 95% confidence interval) is based on the assumed risk in the comparison group and the relative effect of the intervention (and its 95% CI). | ||||||
| GRADE Working Group grades of evidence | ||||||
| 1 Downgraded for reporting and performance bias due to differences in second‐line treatment. | ||||||
| Vaccine treatment versus standard therapies in first‐line therapy of mRCC | ||||||
| Patient population: previously untreated patients with mRCC Setting: phase III, international, multicentre, double‐blind, placebo‐controlled (Amato 2010), open‐label (Rini 2015) Intervention: vaccine treatment (MVA‐5T4 or IMA0901) Comparison: placebo and standard therapies (IL‐2, IFN‐α and sunitinib) | ||||||
| Outcomes | Illustrative comparative risks* (95% CI) | Relative effect | No of participants | Quality of the evidence | Comments | |
| Assumed risk | ||||||
| Risk with standard therapies | Risk difference with vaccine treatment (95% CI) | |||||
| 1‐year mortality | Lowa | RR 1.10 | 1034 | ⊕⊕⊝⊝ | ‐ | |
| 150 per 1000 | 15 more per 1000 | |||||
| Moderatea | ||||||
| 280 per 1000 | 28 more per 1000 | |||||
| Higha | ||||||
| 550 per 1000 | 55 more per 1000 | |||||
| Quality of life | No evidence available | |||||
| Adverse events (grade ≥ 3) Follow‐up: not reported | 241 per 1000 | 39 more per 1000 | RR 1.16 | 1065 | ⊕⊕⊝⊝ | ‐ |
| *The basis for the assumed risk (e.g. the median control group risk across studies) is provided in footnotes. The corresponding risk (and its 95% confidence interval) is based on the assumed risk in the comparison group and the relative effect of the intervention (and its 95% CI). | ||||||
| GRADE Working Group grades of evidence | ||||||
| 1 Not downgraded for performance bias, borderline decision due to second‐line therapies in one study. | ||||||
| Targeted immunotherapy alone versus standard targeted therapies in previously treated patients with mRCC | ||||||
| Patient population: previously treated patients with mRCC Setting: phase III, international, multicentre, open‐label Intervention: targeted immunotherapy (nivolumab) alone Comparison: standard targeted therapies (everolimus) | ||||||
| Outcomes | Illustrative comparative risks* (95% CI) | Relative effect | No of participants | Quality of the evidence | Comments | |
| Assumed risk | ||||||
| Risk with standard targeted therapies | Risk difference with targeted immunotherapy alone (95% CI) | |||||
| 1‐year mortality | 341 per 1000 | 102 fewer per 1000 | RR 0.70 | 821 | ⊕⊕⊕⊝ | ‐ |
| Quality of life: Clinically relevant improvement in FKSI‐DRS | 367 per 1000 | 187 more per 1000 (from 103 more to 287 more) | RR 1.51 (1.28 to 1.78) | 704 | ⊕⊕⊕⊝ | ‐ |
| Quality of life: clinically relevant improvement in EQ‐5D VAS | 391 per 1000 | 145 more per 1000 (from 63 more to 238 more) | RR 1.37 (1.16‐1.61) | 703 (1 study) | ⊕⊕⊕⊝ | ‐ |
| Adverse events (grade ≥ 3) | 365 per 1000 | 179 fewer per 1000 | RR 0.51 | 803 | ⊕⊕⊕⊝ | ‐ |
| *The basis for the assumed risk (e.g. the median control group risk across studies) is provided in footnotes. The corresponding risk (and its 95% confidence interval) is based on the assumed risk in the comparison group and the relative effect of the intervention (and its 95% CI). | ||||||
| GRADE Working Group grades of evidence | ||||||
| 1 Downgraded for performance bias due to cross‐over. | ||||||
| Study ID | Comparison (group 1 vs group 0) | Median OS (95% CI) (months) | 1‐year mortality | Comments | ||
| Group 1 | Group 0 | Group 1 | Group 0 | |||
| 1 (IFN‐α alone vs standard targeted therapies) | 7.3 (6.1 to 8.8) | 10.9 (8.6 to 12.7) | 70% | 53% | From curves. | |
| 21.8 (17.9 to 26.9) | 26.4 (23.0 to 32.9) | 12.3% | 10.1% | Numbers reported. | ||
| 2 (IFN‐α + targeted therapies vs standard targeted therapies) | 8.4 (6.6 to 10.3) | 10.9 (8.6 to 12.7) | 60% | 53% | From curves. | |
| 3 (IFN‐α alone vs IFN‐α + bevacizumab) | 21.3 | 23.3 | 32% | 26% | From curves. | |
| 17.4 (14.4 to 20.0) | 18.3 (16.5 to 22.5) | 39% | 34% | From curves with numbers and censoring marks. | ||
| 4 (IFN‐α + bevacizumab vs standard targeted therapies) | Not reported | Not reported | 10% | 26% | Reported. | |
| 5 (Vaccine treatment vs standard therapies) | 19.2 | 20.1 | 35% | 33% | From curves with censoring. | |
| 33.1 | Not reached | 17% | 22% | Numbers reported. | ||
| 6 (Targeted immunotherapy alone vs targeted standard therapy) | 25.0 (21.8 to NE) | 19.6 (17.6 to 23.1) | 24% | 34% | From curves with numbers with censoring marks. | |
| CI: confidence interval; IFN‐α: interferon‐α; NE: not estimable; OS: overall survival. | ||||||
| Comparison (group 1 vs group 0) | Study | Subgroup | Sample size | Treatment effects (95% CI) or P values |
| 1 (IFN‐α alone vs standard targeted therapies) | Prior nephrectomy | 278 | HR 1.2 (0.9 to 1.6) | |
| Prior nephrectomy | 674 | HR 1.2 (0.95 to 1.5) | ||
| Pooled | Prior nephrectomy | 952 | HR 1.2 (1.0 to 1.43), I2 = 0% | |
| No prior nephrectomy | 138 | HR 1.7 (1.1 to 2.5) | ||
| No prior nephrectomy | 76 | HR 1.23 (0.8 to 2.1) | ||
| Pooled | No prior nephrectomy | 214 | HR 1.48 (1.1 to 2.0), I2 = 1% | |
| KPS ≤ 70 | 340 | HR 1.39 (1.11 to 1.75) | ||
| KPS > 70 | 75 | HR 0.93 (0.53 to 1.67) | ||
| With poor risk | 48 | HR 1.15 (0.83 to 2.78) | ||
| Intermediate risk | 421 | HR 1.27 (1.00 to 1.62) | ||
| ECOG Performance Status 0 | 460 | HR 1.1 (0.87 to 1.5) | ||
| ECOG Performance Status 1 | 290 | HR 1.4 (1.05 to 1.7) | ||
| 3 (IFN‐α alone vs IFN‐α + bevacizumab) | Favourable risk | 180 | HR 1.09 (0.73 to 1.61), P = 0.6798 | |
| Favourable risk | 192 | HR 1.11 (0.8 to 1.56), P = 0.5189 | ||
| Pooled | Favourable risk | 372 | HR 1.10 (0.85 to 1.43), I2 = 0% | |
| Intermediate risk | 392 | HR 1.20 (0.95 to 1.54), P = 0.1230 | ||
| Intermediate risk | 465 | HR 1.15 (0.94 to 1.41), P = 0.1688 | ||
| Pooled | Intermediate risk | 857 | HR 1.18 (1.01 to 1.37), I2 = 0% | |
| Poor risk | 59 | HR 1.18 (0.68 to 2.04), P = 0.5594 | ||
| Poor risk | 75 | HR 1.33 (0.82 to 2.17), P = 0.2439 | ||
| Pooled | Poor risk | 124 | HR 1.27 (0.88 to 1.82), I2 = 0% | |
| Prior nephrectomy | 620 | HR 1.10 (0.93 to 1.32), P = 0.2871 | ||
| No prior nephrectomy | 112 | HR 1.54 (1.02 to 2.27), P = 0.0381 | ||
| 5 (Vaccine treatment vs standard therapies) | Favourable risk, treated with IL‐2 (SOC) | 100 | HR 0.54 (0.30 to 0.98), P = 0.046 | |
| Favourable risk, treated with IFN‐α (SOC) | 206 | P > 0.05 | ||
| Good prognosis, treated with sunitinib (SOC) | 119 | P > 0.05 | ||
| Intermediate prognosis, treated with IL‐2 (SOC) | 70 | P > 0.05 | ||
| Intermediate prognosis, treated with IFN‐α (SOC) | 169 | P > 0.05 | ||
| Intermediate prognosis, treated with sunitinib (SOC) | 65 | P > 0.05 | ||
| Favourable risk (n = 92) | 92 | HR 0.82, P = 0.59 | ||
| Intermediate risk (n = 240) | 240 | HR 1.52, P < 0.05 | ||
| 6 (Targeted immunotherapy alone vs standard targeted therapies) | Favourable risk group (MSKCC risk group) | 293 | HR 0.89 (0.59 to 1.32) | |
| Intermediate risk group (MSKCC risk group) | 404 | HR 0.76 (0.58 to 0.99) | ||
| Poor risk group (MSKCC risk group) | 124 | HR 0.47 (0.30 to 0.73) | ||
| 1 previous antiangiogenic regimen | 591 | HR 0.71 (0.56 to 0.90) | ||
| 2 previous antiangiogenic regimens | 230 | HR 0.89 (0.61 to 1.29) | ||
| CI: confidence interval; ECOG: Eastern Cooperative Oncology Group; HR: hazard ratio; IFN‐α: interferon‐α; IL: interleukin; KPS: Karnovsky Performance Score; MSKCC: Memorial Sloan‐Kettering Cancer Center; n: number of participants; SOC: standard of care. | ||||
| Comparison (group 1 vs group 0) | Study (reported in) | Measurement instrument | Group 1 | Group 0 | Favours | Difference (95% CI) or P values |
| 1 (IFN‐α alone vs standard targeted therapies) | Motzer 2007 (reported in Cella 2008) | FACT‐G total score, mean postbaseline score over 17 weeks | 76.8 (n = 357) | 82.3 (n = 373) | Group 0 | ‐5.58 (‐7.25 to ‐3.91) |
| Motzer 2007 (reported in Cella 2008) | FKSI‐15, mean postbaseline score over 17 weeks | 42.1 (n = 357) | 45.3 (n = 373) | Group 0 | ‐3.27 (‐4.18 to ‐2.36) | |
| Motzer 2007 (reported in Cella 2008) | FKSI‐DRS, mean postbaseline score over 17 weeks | 27.4 (n = 357) | 29.4 (n = 373) | Group 0 | ‐1.98 (‐2.51 to ‐1.46) | |
| Hudes 2007, (reported in Yang 2010) | EQ‐5D Index, mean score on treatment | 0.492 (n = 115) | 0.590 (n = 157) | Group 0 | ‐0.099 (95% CI ‐0.162 to ‐0.036) | |
| Motzer 2007 (reported in Cella 2008) | EQ‐5D Index, mean postbaseline score over 17 weeks | 0.725 (n = 357) | 0.762 (n = 373) | Group 0 | ‐0.0364 (‐0.0620 to ‐0.0109) | |
| Pooled EQ‐5D | 472 | 530 | Group 0 | ‐0.06 (‐0.12 to 0), I2 = 69% | ||
| Hudes 2007, (reported in Yang 2010) | EQ‐VAS, mean score on treatment | 58.83 (n = 115) | 63.33 (n = 157) | Group 0 | ‐4.50 (‐8.184 to ‐0.819) | |
| Motzer 2007, (reported in Cella 2008) | EQ‐VAS, mean postbaseline score over 17 weeks | 68.7 (n = 357) | 73.4 (n = 373) | Group 0 | ‐4.74 (‐6.87 to ‐2.60) | |
| Pooled EQ‐VAS | 472 | 530 | Group 0 | ‐4.68 (‐6.53 to ‐2.83), I2 = 0% | ||
| 6 (Targeted immunotherapy alone vs standard targeted therapies) | Motzer 2015a (reported in Cella 2016) | FKSI‐DRS, mean score at baseline | 30.2 ± 4.4 (n = 362) | 30.1 ± 4.8 (n = 344) | ‐ | Difference in mean change 1.6 (1.4 to 1.9), P < 0.0001 |
| FKSI‐DRS, mean change from baseline to week 28 | 0.4 ± 5 (n = 164) | ‐1.2 ± 4 (n = 122) | Group 1 | |||
| FKSI‐DRS, mean change from baseline to week 52 | 1.6 ± 4 (n = 97) | ‐1.0 ± 6 (n = 63) | Group 1 | |||
| FKSI‐DRS, mean change from baseline to week 104 | 3.5 ± 4.1 (n = 20) | 0.2 ± 6 (n = 9) | Group 1 | |||
| Clinically important improvement from baseline by ≥ 2 FKSI‐DRS points | 200 (55%)/361 | 126 (37%)/343 | Group 1 | RR 1.51 (1.28 to 1.78); P < 0.0001 | ||
| Time to clinically important improvement ≥ 2 FKSI‐DRS points | Median: 4.7 months (3.7 to 7.5) | Median not reached | Group 1 | HR 1.66 (1.33 to 2.08); P < 0.0001 | ||
| Clinically important improvement from baseline by ≥ 3 FKSI‐DRS points | 148 (41%)/361 | 95 (28%)/343 | Group 1 | RR 1.48 (1.20 to 1.83); P = 0.0002 | ||
| Time to clinically important improvement ≥ 3 FKSI‐DRS points | Median not estimable | Median not estimable | Group 1 | HR 1.61 (1.24 to 2.09); P < 0.0003 | ||
| EQ‐5D utility index, mean score at baseline | 0.78 ± 0.24 (n = 362) | 0.78 ± 0.21 (n = 344) | ‐ | No significant differences in proportion of participants with clinical important improvements (P = 0.070) or time to improvement (P = 0.86). | ||
| EQ‐5D utility index, mean change from baseline to week 28 | 0.052 ± 0.22 (n = 164) | ‐0.03 ± 0.2 (n = 122) | Group 1 | |||
| EQ‐5D utility index, mean change from baseline to week 52 | 0.06 ± 0.1 (n = 98) | ‐0.01 ± 0.2 (n = 63) | Group 1 | |||
| EQ‐5D utility index, mean change from baseline to week 104 | 0.13 ± 0.7 (n = 20) | ‐0.02 ± 0.15 (n = 9) | Group 1 | |||
| EQ‐5D VAS, mean score at baseline | 73.3 ± 18.5 (n = 362) | 72.5 ± 18.7 (n = 344) | ‐ | ‐ | ||
| EQ‐5D VAS, mean change from baseline to week 28 | 5 ± 13 (n = 164) | ‐3 ± 11 (n = 122) | Group 1 | ‐ | ||
| EQ‐5D VAS, mean change from baseline to week 52 | 7 ± 15 (n = 98) | ‐2 ± 16 (n = 63) | Group 1 | ‐ | ||
| EQ‐5D VAS, mean change from baseline to week 104 | 9 ± 9 (n = 20) | 1 ± 18 (n = 9) | Group 1 | ‐ | ||
| Clinically important improvement from baseline by ≥ 7 EQ‐5D VAS points | 192 (53%)/360 | 134(39%)/343 | ‐ | RR 1.37 (1.16 to 1.61); P = 0.0001 | ||
| Time to clinically important improvement | Median: 6.5 months (3.9 to 12.2) | Median: 23.1 months (15.4 to not estimated) | ‐ | HR 1.37 (1.10 to 1.71) | ||
| CI: confidence interval; EQ‐5D Index: EuroQol 5‐Dimension (MID 0.06 to 0.08, Pickard 2007); EQ‐VAS: EuroQol Visual Analog Scale (MID 7, Pickard 2007); FACT‐G: Functional Assessment of Cancer Therapy ‐ General (MID 4 points for better rating and 8 points for worse rating, Ringash 2007); FKSI‐15: FACT‐Kidney Symptom Index (MID 3 points, Cella 1997); FKSI‐DRS: FACT‐Kidney Symptom Index Disease Related Symptoms (MID 2 points, Cella 1997); HR: hazard ratio; MID: minimal important difference; n: number of participants. | ||||||
| Outcome or subgroup title | No. of studies | No. of participants | Statistical method | Effect size |
| 1 1‐year mortality Show forest plot | 2 | 1166 | Risk Ratio (M‐H, Random, 95% CI) | 1.30 [1.13, 1.51] |
| 2 Overall survival Show forest plot | 2 | Hazard Ratio (Random, 95% CI) | 1.28 [1.11, 1.49] | |
| 3 Quality of life Show forest plot | 2 | Mean Difference (Random, 95% CI) | Subtotals only | |
| 3.1 FACT‐G | 1 | 730 | Mean Difference (Random, 95% CI) | ‐5.58 [‐7.25, ‐3.91] |
| 3.2 FKSI‐15 | 1 | 730 | Mean Difference (Random, 95% CI) | ‐3.27 [‐4.18, ‐2.36] |
| 3.3 FKSI‐DRS | 1 | 730 | Mean Difference (Random, 95% CI) | ‐1.98 [‐2.51, ‐1.45] |
| 3.4 EQ‐5D | 2 | 1000 | Mean Difference (Random, 95% CI) | ‐0.06 [‐0.12, ‐0.00] |
| 3.5 EQ‐VAS | 2 | 1000 | Mean Difference (Random, 95% CI) | ‐4.68 [‐6.53, ‐2.83] |
| 4 Adverse events (grade ≥ 3) Show forest plot | 1 | Risk Ratio (M‐H, Random, 95% CI) | Subtotals only | |
| 5 Progression‐free survival Show forest plot | 2 | Hazard Ratio (Random, 95% CI) | 2.23 [1.79, 2.77] | |
| 6 Tumour remission Show forest plot | 2 | 1007 | Risk Ratio (M‐H, Random, 95% CI) | 0.30 [0.12, 0.75] |
| Outcome or subgroup title | No. of studies | No. of participants | Statistical method | Effect size |
| 1 1‐year mortality Show forest plot | 1 | Risk Ratio (M‐H, Random, 95% CI) | Subtotals only | |
| 2 Overall survival Show forest plot | 1 | Hazard Ratio (Random, 95% CI) | Subtotals only | |
| 3 Adverse events (grade ≥ 3) Show forest plot | 1 | Risk Ratio (M‐H, Random, 95% CI) | Subtotals only | |
| 4 Progression‐free survival Show forest plot | 1 | Hazard Ratio (Random, 95% CI) | Subtotals only | |
| 5 Tumour remission Show forest plot | 1 | Risk Ratio (M‐H, Random, 95% CI) | Subtotals only | |
| Outcome or subgroup title | No. of studies | No. of participants | Statistical method | Effect size |
| 1 1‐year mortality Show forest plot | 2 | 1381 | Risk Ratio (M‐H, Random, 95% CI) | 1.17 [1.00, 1.36] |
| 2 Overall survival Show forest plot | 2 | Hazard Ratio (Random, 95% CI) | 1.13 [1.00, 1.28] | |
| 3 Adverse events (grade ≥ 3) Show forest plot | 2 | 1350 | Risk Ratio (M‐H, Random, 95% CI) | 0.77 [0.71, 0.84] |
| 4 Progression‐free survival Show forest plot | 2 | Hazard Ratio (Random, 95% CI) | 1.53 [1.36, 1.73] | |
| 5 Tumour remission Show forest plot | 2 | 1205 | Risk Ratio (M‐H, Random, 95% CI) | 0.39 [0.31, 0.50] |
| Outcome or subgroup title | No. of studies | No. of participants | Statistical method | Effect size |
| 1 1‐year mortality Show forest plot | 1 | Risk Ratio (M‐H, Random, 95% CI) | Subtotals only | |
| 2 Adverse events (grade ≥ 3) Show forest plot | 1 | Risk Ratio (M‐H, Random, 95% CI) | Subtotals only | |
| 3 Progression‐free survival Show forest plot | 1 | Hazard Ratio (Random, 95% CI) | Subtotals only | |
| 4 Tumour remission Show forest plot | 1 | Risk Ratio (M‐H, Random, 95% CI) | Subtotals only | |
| Outcome or subgroup title | No. of studies | No. of participants | Statistical method | Effect size |
| 1 1‐year mortality Show forest plot | 2 | 1034 | Risk Ratio (M‐H, Random, 95% CI) | 1.10 [0.91, 1.32] |
| 2 Overall survival Show forest plot | 2 | 1071 | Hazard Ratio (Fixed, 95% CI) | 1.14 [0.96, 1.37] |
| 3 Adverse events (grade ≥ 3) Show forest plot | 2 | 1065 | Risk Ratio (M‐H, Random, 95% CI) | 1.16 [0.97, 1.39] |
| 4 Progression‐free survival Show forest plot | 1 | 339 | Hazard Ratio (Random, 95% CI) | 1.05 [0.87, 1.27] |
| 5 Tumour remission Show forest plot | 2 | 1071 | Risk Ratio (M‐H, Random, 95% CI) | 0.93 [0.76, 1.13] |
| Outcome or subgroup title | No. of studies | No. of participants | Statistical method | Effect size |
| 1 1‐year mortality Show forest plot | 1 | 821 | Risk Ratio (M‐H, Random, 95% CI) | 0.70 [0.56, 0.87] |
| 2 Overall survival Show forest plot | 1 | Hazard Ratio (Random, 95% CI) | 0.73 [0.60, 0.89] | |
| 3 Quality of life Show forest plot | 1 | Risk Ratio (M‐H, Random, 95% CI) | Subtotals only | |
| 3.1 Clinical important MID in FKSI‐DRS | 1 | 704 | Risk Ratio (M‐H, Random, 95% CI) | 1.51 [1.28, 1.78] |
| 3.2 Clinical important MID in EQ‐5D‐VAS | 1 | 703 | Risk Ratio (M‐H, Random, 95% CI) | 1.37 [1.16, 1.61] |
| 4 Adverse events (grade ≥ 3) Show forest plot | 1 | 803 | Risk Ratio (M‐H, Random, 95% CI) | 0.51 [0.40, 0.65] |
| 5 Progression‐free survival Show forest plot | 1 | Hazard Ratio (Random, 95% CI) | 0.88 [0.75, 1.03] | |
| 6 Tumour remission Show forest plot | 1 | 750 | Risk Ratio (M‐H, Random, 95% CI) | 4.39 [2.84, 6.80] |