Adjunctive steroid therapy for managing pulmonary tuberculosis
Abstract
Background
Tuberculosis causes approximately 8.6 million disease episodes and 1.3 million deaths worldwide per year. Although curable with standardized treatment, outcomes for some forms of tuberculosis are improved with adjunctive corticosteroid therapy. Whether corticosteroid therapy would be beneficial in treating people with pulmonary tuberculosis is unclear.
Objectives
To evaluate whether adjunctive corticosteroid therapy reduces mortality, accelerates clinical recovery or accelerates microbiological recovery in people with pulmonary tuberculosis.
Search methods
We identified studies indexed from 1966 up to May 2014 by searching: Cochrane Infectious Diseases Group's trials register, Cochrane Central Register of Controlled Trials, MEDLINE, EMBASE and LILACS using comparative search terms. We handsearched reference lists of all identified studies and previous reviews and contacted relevant researchers, organizations and companies to identify grey literature.
Selection criteria
Randomized controlled trials and quasi‐randomized control trials of recognized antimicrobial combination regimens and corticosteroid therapy of any dose or duration compared with either no corticosteroid therapy or placebo in people with pulmonary tuberculosis were included.
Data collection and analysis
At least two investigators independently assessed trial quality and collected data using pre‐specified data extraction forms. Findings were reported as narrative or within tables. If appropriate, Mantel‐Haenszel meta‐analyses models were used to calculate risk ratios.
Main results
We identified 18 trials, including 3816 participants, that met inclusion criteria. When compared to taking placebo or no steroid, corticosteroid use was not shown to to reduce all‐cause mortality, or result in higher sputum conversion at 2 months or at 6 months (mortality: RR 0.77, 95%CI 0.51 to 1.15, 3815 participants, 18 studies, low quality evidence; sputum conversion at 2 months RR 1.03, 95%CI 0.97 to 1.09, 2750 participants, 12 studies; at 6 months; RR1.01, 95%CI 1.01, 95%CI 0.98 to 1.04, 2150 participants, 9 studies, both low quality evidence). However, corticosteroid use was found to increase weight gain (data not pooled, eight trials, 1203 participants, low quality evidence), decrease length of hospital stay (data not pooled, three trials, participants 379, very low quality of evidence) and increase clinical improvement within one month (RR 1.16, 95% CI 1.09 to 1.24; five trials, 497 participants, low quality evidence).
Authors' conclusions
It is unlikely that adjunctive corticosteroid treatment provides major benefits for people with pulmonary tuberculosis. Short term clinical benefits found did not appear to be maintained in the long term. However, evidence available to date is of low quality. In order to evaluate whether adjunctive corticosteroids reduce mortality, or accelerate clinical or microbiological recovery in people with pulmonary tuberculosis further large randomized control trials sufficiently powered to detect changes in such outcomes are needed.
PICOs
Plain language summary
Adjunctive steroid therapy for managing pulmonary tuberculosis
Pulmonary tuberculosis is a common infectious disease. Although curable with standard anti‐pulmonary tuberculosis drugs, it has been reported that an individuals recovery could be improved by adding corticosteroids to their treatment. Current clinical guidelines advise the use of corticosteroids for treatment of other types of tuberculosis; tuberculosis meningitis and tuberculosis pericarditis. Whether corticosteroids would be beneficial in the treatment of pulmonary tuberculosis remains unclear. After reviewing the evidence available to date we found that there was not enough high quality data to support or reject corticosteroid use alongside anti‐pulmonary tuberculosis drugs.
Authors' conclusions
Summary of findings
| Steroid therapy comparative to either no therapy or placebo for managing pulmonary tuberculosis | ||||||
| Patient or population: patients with managing pulmonary tuberculosis | ||||||
| Outcomes | Illustrative comparative risks* (95% CI) | Relative effect | No of Participants | Quality of the evidence | Comments | |
| Assumed risk | Corresponding risk | |||||
| Control | Steroid therapy comparative to either no therapy or placebo | |||||
| All‐cause mortality | 27 per 1000 | 21 per 1000 | RR 0.77 | 3815 | ⊕⊕⊝⊝ | |
| Sputum Conversion by 2 months | 656 per 1000 | 722 per 1000 | RR 1.1 | 1475 | ⊕⊕⊝⊝ | |
| Sputum conversion at 6 months | Study population | RR 1.01 | 875 | ⊕⊕⊕⊝ | ||
| 911 per 1000 | 920 per 1000 | |||||
| Clinical Improvement at 1 month | Study population | RR 1.16 | 497 | ⊕⊝⊝⊝ | ||
| 794 per 1000 | 921 per 1000 | |||||
| *The assumed risk is the mean control group risk across studies. The corresponding risk (and its 95% confidence interval) is based on the assumed risk in the comparison group and the relative effect of the intervention (and its 95% CI). | ||||||
| GRADE Working Group grades of evidence | ||||||
| 1 Not downgraded for risk of bias: Most of these studies were conducted in the 1960s and provided minimal detail on trial methods. However, the most recent trial from 2005 was well conducted and showed no evidence of clinical benefit with steroids. | ||||||
Background
Tuberculosis (TB) is a chronic infectious disease which causes a high mortality and morbidity burden worldwide. In 2012, approximately 1.3 million deaths and 8.6 million disease episodes were due to TB (WHO 2013). It spreads, most commonly, via horizontal transmission when an individual inhales respiratory droplets containing Mycobacterium tuberculosis which have been expelled by someone with active TB. TB is broadly classified as being pulmonary or extra‐pulmonary dependent upon the site of infection. Pulmonary tuberculosis (PTB) affects the lung or lymph nodes at the site of primary infection (usually the lung and upper respiratory tract) while extra‐pulmonary TB describes TB disease which affects other areas of the body (WHO NOV 2010).
Although effective treatments are available, TB remains the seventh largest cause of mortality worldwide. Within the UK incident case numbers have increased by approximately one fifth over the past decade (PHE 2013). Standard TB treatment regimens are comprised of a combination of drugs which most often includes rifampicin. They are usually given daily, sometimes intermittently (for example three days per week), for at least six months (Garner 2003).
TB infection initiates an inflammatory immune response that itself causes considerable tissue damage. Adjunctive steroid therapy may be used to counteract this, especially where inflammatory disease complicates recovery. Clinical guidance advises the use of adjunctive steroid therapy for treatment of TB meningitis and TB pericarditis (NICE 2006; WHO 2009). However, when given without anti‐TB treatment, steroids can actually promote the activation of TB disease (Cisneros 1996). There is also evidence that concurrent administration of anti‐TB drugs and steroids causes pharmacokinetic interactions that hinder efficacy of both drugs thus impairing clinical outcomes (Edwards 1974; Sarma 1980; Bergrem 1983; Wagay 1990; Kaojarern 1991).
Three Cochrane reviews have examined the use of steroids as an adjunctive therapy in relieving the complications of TB: pleurisy (Engel 2007), pericarditis (Mayosi 2002) and meningitis (Prasad 2008). Most of the trials included in these reviews were small, and although some benefits were observed, results were often inconclusive.
Approximately 79% of global TB cases are pulmonary, as such it is important to know whether or not there is a benefit from using steroids in treatment of PTB. An earlier systematic review (Smego 2003) examined the use of steroids as an adjunctive therapy for PTB identifying eleven studies, all of which showed significant improvement in at least one PTB outcome amongst steroid users. This review updates the former review (Smego 2003), with searches up until May 2014, and refines the outcomes assessed to further evaluate the benefit of adjunctive corticosteroid therapy for the management of PTB.
Objectives
To evaluate whether adjunctive corticosteroids reduce mortality, improve quality of life or accelerate clinical or microbiological recovery in people with PTB.
Methods
Criteria for considering studies for this review
Types of studies
Both Randomized Control Trials (RCTs) and quasi‐RCTs were included in this review regardless of setting and publication language.
Types of participants
Participants with PTB, defined either clinically or microbiologically, were included. There were no exclusion criteria for studies regarding participants age group or co‐morbidities.
Types of interventions
In each study participants were treated with the same antimicrobial regimen for PTB and given the same care other than as follows:
Intervention group
Also given a corticosteroid of any dose, duration or mode of administration as an adjunct to standard PTB treatment.
Control group
Given either standard PTB treatment alone or in combination with a placebo.
Types of outcome measures
Primary
All‐cause mortality
Deaths due to any cause during treatment and trial follow‐up.
Secondary
Microbiological Outcomes
Microbiological outcomes are assessed, when possible, using numbers reaching WHO defined TB outcomes within each trial arm.
Conversion
Number of participants whose sputum smear or culture became negative by specified time‐points (only data for monthly time‐point intervals, not weekly, is presented).
Cure
Number of participants whose sputum smear or culture was positive at the beginning of the treatment but who had become smear or culture negative in the last month of treatment and on at least one prior occasion.
Treatment failure
Number of participants whose sputum smear or culture is positive after 5 months or more of treatment.
Relapse
Number of patients newly diagnosed with bacteriologically positive TB who have previously been treated for TB and declared cured or treatment completed.
Where available microbiological data on study specific indicators were also extracted.
Clinical improvement
Mean change in clinician defined symptom scores or study specific indicators of clinical improvement.
Fever
Change in average temperature since baseline or number of participants becoming afebrile since baseline.
Weight change
Mean weight change from baseline and where available indicators of variation.
Length of hospital stay
Mean time spent as an inpatient and where available indicators of variation.
Functional disability
Mean change from baseline in trial specific measures of pulmonary function and where available indicators of variation.
Adverse events
Counts of each adverse event as specified within each trial. Where possible presented as numbers occurring in each trial arm, when only reported for steroid arm presented separately.
Search methods for identification of studies
Databases
The following databases were searched using the search terms and strategy described in Appendix 1
-
Cochrane Infectious Diseases Group's trials register (1993 to May 2014)
-
Cochrane Central Register of Controlled Trials (CENTRAL), published in The Cochrane Library (Issue 5, May 2014)
-
MEDLINE (1966 to May 2014)
-
EMBASE (1974 to May 2014) and
-
LILACS (1982 to May 2014)
Reference lists
The reference lists of all studies identified by the above methods and of the previously published reviews were hand searched for further relevant non‐indexed publications.
Researchers, organizations and pharmaceutical companies
Individual researchers working in the field and those within pertinent organizations including the International Union Against Tuberculosis and Lung Disease, World Health Organization (WHO), Centers for Disease Control and Prevention (CDC), National Institutes of Health, European and Developing Countries Clinical Trials Directive, Research Institute of Tuberculosis (Kiyose, Japan), National Tuberculosis Institute (Bangalore, India) and the Tuberculosis Research Centre (Chennai, India) were contacted.
All relevant studies were included regardless of language.
Data collection and analysis
Selection of studies
Three authors (JC, LO and FP) scanned the citations retrieved by the search strategy. For non‐English language papers, the assistance of translators was used. Study eligibility was assessed using a pre‐specified eligibility form based on the review inclusion criteria. The reasons for excluding potentially relevant trials are given in the 'Characteristics of excluded studies' section. Any disagreements on study inclusion were resolved by discussion between JC, LO and FP. Where necessary authors of studies were contacted for clarification.
Data extraction and management
JC obtained full text articles published on potentially relevant studies. At least two investigators (JC, LO or FP) extracted relevant data from included papers using a pre‐agreed extraction form. Any disagreements in data extraction were resolved by discussion, consultation of a Cochrane Infectious Disease Group editor or by contacting authors for further clarification of specific points.
Assessment of risk of bias in included studies
At least two investigators assessed the methodological quality of each trial in terms of generation of allocation sequence, allocation concealment and blinding. The risk that methods of allocation sequence, allocation concealment and blinding were introducing bias into each study were assessed as either low risk, high risk or unclear (if inadequate, detail was given). The decisions made on the risk methods were introducing bias and the reasoning for them is recorded within the 'Characteristics of included studies' section and within Figure 1. Funnel plots were generated for outcomes for which data were pooled and used to assess the risk of publication bias.
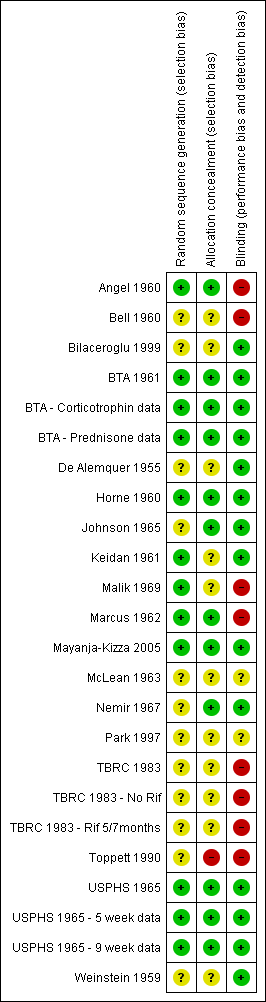
Risk of bias summary: review authors' judgements regarding each risk of bias item for each included study.
Data synthesis
Extracted data was analysed using Review Manager (RevMan). Heterogeneity amongst trials was assessed using the Chi2 test with a 10% level of statistical significance and the I2 statistic. Since heterogeneity was, in general, modest for most comparisons we used the Mantel‐Haenszel fixed‐effect risk ratio with 95% confidence intervals (CI) to pool and summarise dichotomous outcomes reported in trials. In sensitivity analyses, trials were excluded in which the assessed methodological items were judged as creating a high risk of bias. Since many of the included trials were carried out some time ago, where feasible we also carried out sensitivity analyses including only trials utilising a more effective rifampicin‐containing anti‐TB chemotherapy. Sensitivity analyses were also completed excluding trials where bias assessment criteria were judged to be at high risk of introducing bias.
All data available on the secondary outcomes assessed by this review are presented in the additional tables (Table 1; Table 2; Table 3; Table 4; Table 5; Table 6; Table 7; Table 8; Table 9; Table 10). Of the secondary outcomes assessed, it was only appropriate to pool data on clinical improvement at 1 month and microbiological outcomes. Data for all other secondary outcomes were not pooled as there was great heterogeneity in study specific indicators recorded for each trial. A narrative summary of all findings is given (for further details see 'Effects of interventions' section)
| Study ID | Outcome Definition | Culture or Smear (if culture not reported) Negative | ||||
| Time point (month) | Steroid | Control | Reported Statistical Significance | |||
| Culture negative; three samples of sputum or gastric washings were sent for culture at start of treatment then at monthly intervals. | Baseline | 0/54 | 0/50 | No significant difference | ||
| 1 | 7/34 | 12/38 | ||||
| 2 | 25/42 | 32/47 | ||||
| 3 | 29/46 | 39/42 | P < 0.001 significantly greater among controls | |||
| 4 | 39/45 | 41/45 | No significant difference | |||
| 5 | 40/44 | 38/40 | ||||
| 6 | 45/47 | 43/46 | ||||
| Culture negative; 24 hour specimens of sputum were collected until treatment started, then collected monthly. Concentrates prepared by tri‐sodium phosphate method and incubated for 12 weeks. | Baseline | 0/45 | 0/46 | No significant difference | ||
| 1 | 16/44 | 11/45 | ||||
| 2 | 27/42 | 25/46 | ||||
| 3 | 31/41 | 35/43 | ||||
| Culture conversion rate (Sputum taken twice weekly) | Reported as 'comparable' | P = 0.0794 | ||||
| Culture negative; direct smear and culture exam taken monthly and analysed using local lab facilities | Baseline | 9/111 | 5/118 | Not reported | ||
| 1 | 36/100 | 31/109 | ||||
| 3 | 70/89 | 77/104 | ||||
| 6 | 86/87 | 91/95 | ||||
| 9 | 67/67 | 74/74 | ||||
| 12 | 40/40 | 39/40 | ||||
| Culture negative; direct smear and culture exam taken monthly and analysed using local lab facilities | Baseline | 4/115 | 5/118 | |||
| 1 | 36/109 | 31/109 | ||||
| 3 | 80/104 | 77/104 | ||||
| 6 | 93/95 | 91/95 | ||||
| 9 | 80/80 | 74/74 | ||||
| 12 | 45/45 | 39/40 | ||||
| Culture negative; direct sputum smear, gastric lavage or laryngeal swabs | 1 | 40/87 | 28/91 | No significant difference | ||
| 2 | 64/87 | 45/91 | P < 0.01 | |||
| 3 | 67/87 | 62/91 | No significant difference | |||
| 4 | 75/87 | 75/91 | ||||
| 5 | 80/87 | 82/91 | ||||
| 6 | 86/87 | 91/91 | ||||
| 9 | 75/77 | 80/80 | ||||
| 12 | 77/77 | 80/80 | ||||
| Specimens of sputum were collected every two weeks for four months and then every month thereafter Reversal of infectiousness; the first of three consecutive monthly specimens negative for tubercle bacilli on microscopy and culture | 2 | 18/52 | 11/50 | No significant difference | ||
| 4 | 30/52 | 31/50 | ||||
| 6 | 38/52 | 37/50 | ||||
| 8 | 46/52 | 42/50 | ||||
| 10 | 49/52 | 44/50 | ||||
| 12 | 48/52 | 46/50 | ||||
| Sputum negative; disappearance of sputum in bacilli was monitored for monthly | 1 | 11/46 | 14/58 | No significant difference | ||
| 2 | 26/46 | 20/58 | P < 0.05 | |||
| 3 | 28/46 | 28/58 | P < 0.05 | |||
| 6 | 35/46 | 46/58 | No significant difference | |||
| Culture negative; specimens of sputum were collected every two weeks until 2 months then at 3 months and 6 months | 1 | 35/49 | 31/51 | Not reported | ||
| 2 | 40/49 | 45/51 | ||||
| 3 | 45/49 | 45/51 | ||||
| 6 | 48/49 | 48/51 | ||||
| Culture negative; sputum cultures obtained at month 1 and 2 and examined for AFB | 1 | 58/93 | 35/94 | P = 0.001 | ||
| 2 | 80/93 | 80/94 | No significant difference | |||
| Smear or sputum negative; Smear or culture of sputum or gastric aspirate | 1 | 0/13 | 0/14 | No significant difference | ||
| 2 | 3/12 | 4/14 | ||||
| 3 | 5/11 | 8/14 | ||||
| 4 | 8/12 | 11/14 | ||||
| 5 | 8/11 | 13/13 | ||||
| 6 | 9/9 | 10/11 | ||||
| Culture from bronchial aspiration and gastric washings on 3 successive morning on admission; culture positive after therapy | During therapy | 4/58 | 2/59 | Not reported | ||
| After therapy | 2/58 | 2/59 | Not reported | |||
| Culture negative; Sputum smears examined by fluorescence microscopy and cultured using a modification of Petroffs method. TB chemotherapeutic with rifampicin for either 5 or 7 months. | 1 | 59/132 | 70/129 | No significant difference | ||
| 2 | 121/132 | 120/129 | ||||
| 3 | 1284/132 | 123/129 | ||||
| Culture negative; Sputum smears examined by fluorescence microscopy and cultured using a modification of Petroffs method.TB chemotherapeutic regimen without rifampicin. | 1 | 46/129 | 36/140 | No significant difference | ||
| 2 | 97/129 | 104/140 | ||||
| 3 | 116/129 | 123/140 | ||||
| Culture negative | 1 | 121/426 | 101/424 | Not reported | ||
| 2 | 208/426 | 220/424 | Not reported | |||
| 3 | 316/426 | 308/424 | Not reported | |||
| 4 | 365/426 | 342/424 | Not reported | |||
| 5 | 387/426 | 374/424 | Not reported | |||
| 6 | 389/426 | 372/424 | Not reported | |||
| 8 | 410/426 | 392/424 | Not reported | |||
| Culture negative | 1 | 107/425 | 101/424 | Not reported | ||
| 2 | 202/425 | 220/424 | Not reported | |||
| 3 | 263/425 | 308/424 | Not reported | |||
| 4 | 330/425 | 342/424 | Not reported | |||
| 5 | 368/425 | 374/424 | Not reported | |||
| 6 | 395/425 | 372/424 | Not reported | |||
| 8 | 389/425 | 392/424 | Not reported | |||
| Sputum negative; Cumulative sputum conversion | Baseline | 16/38 | 6/33 | Not reported | ||
| 2 | 20/38 | 8/33 | ||||
| 8 | 33/38 | 25/33 | ||||
| Study ID | Outcome Definition | Steroid | Control | Reported Statistical Significance | |
| Culture positive at 5 months | 4/44 | 2/40 | Not reported | ||
| Culture positive at 6 months | 1/87 | 4/95 | |||
| Culture positive at 6 months | 2/95 | 4/95 | |||
| Culture positive at 5 months | 7/87 | 9/91 | |||
| Culture or smear positive at 6 months | 8/50 | 8/52 | |||
| Study specific indicator, failure to convert by 12 months | 2/50 | 4/52 | |||
| Culture or smear positive at 6 months | 11/46 | 12/58 | |||
| Culture or smear positive at 6 months | 1/49 | 3/51 | |||
| Study specific indicator, not described further | 1/93 | 1/94 | No significant difference | ||
| Culture positive at 6 months | 0/9 | 1/11 | Not reported | ||
| Sputum positive at end of study (6 to 16 months) | 2/38 | 6/33 | |||
| Study ID | Method | Steroid | Control | Reported Statistical Significance | |
| Smear or culture positive TB within 3 years follow up | 0/91 | 0/87 | Not reported | ||
| Number readmitted for TB during up to five years of follow up | 3/50 | 10/50 | P < 0.05 | ||
| Those needing re‐treatment up to two years after first regimen of anti‐tuberculous therapy. | 8/93 | 11/94 | No difference | ||
| Two or more of six cultures positive in any three consecutive monthly exams | 4/132 | 3/129 | No difference | ||
| 3/129 | 6/140 | ||||
| Study ID | Outcome Definition | Time Point (months) | Steroid Group | Control Group | Reported Statstical Significance | |
| Immediate and pronounced non‐specific improvement in general condition reported by nurses and patients | N/A, described as being immeasurable numerically | |||||
| Number of participants judged by treating physician to be in 'fair' or 'good' condition as opposed to 'severely ill' or 'poor' condition. | 1 | 44/44 | 39/46 | Improvement from baseline greater in steroid group P < 0.01 | ||
| 2 | 42/42 | 46/46 | No difference | |||
| Number of patients judged by treating physician to have had 'considerable', 'moderate' or 'slight improvement' as opposed to 'no change' or 'deterioration' | 1 | 96/99 | 100/114 | Not reported | ||
| 3 | 91/92 | 102/107 | ||||
| 6 | 85/86 | 94/95 | ||||
| Number of patients judged by treating physician to have had considerable, moderate or slight improvement | 1 | 113/116 | 100/114 | |||
| 3 | 107/108 | 102/107 | ||||
| 6 | 98/98 | 94/95 | ||||
| Participants initially with; any degree of cough or sputum, or moderate to severe symptoms, who saw moderate to marked improvement in condition. | 10 weeks | 39/48 | 28/46 | P < 0.05 | ||
| Participants showing definite‐striking improvement | 1 | 8/8 | 0/8 | Not reported | ||
| Improvement in 'well‐being and strength' | 7 weeks | 49/49 | 48/51 | Not reported | ||
| 'Rapid symptom response'; method of assessment unclear | Not reported | 13/13 | 1/14 | P < 0.0001 | ||
| 'Improved'; Method of assessment unclear. | 1 | 23/31 | 14/31 | No difference | ||
| 2 | 10/16 | 9/18 | ||||
| 3 | 5/6 | 3/4 | ||||
| 6 | 0/1 | 0/2 | ||||
| 7 | 0/1 | 0/1 | ||||
| time point unclear | 39/58 | 27/59 | P < 0.05 | |||
| Author | Outcome Definition | Steroid Group | Control Group | Reported Statistical Significance | |
| Mean time till patients afebrile, temperature not specified | 5 days | 19.4 days | Not reported | ||
| Mean time till patients afebrile (<37.5°C) | 25 days | 47 days | Not reported | ||
| Mean temperature change 72 hours after treatment initiation | ‐1.2 ºC | + 0.2ºC | P = 0.003 | ||
| Patients with an average temperature of 99°F or more (1 month) | 23/100 | 52/113 | Not reported | ||
| 17/113 | 52/113 | ||||
| Patients with an average temperature of 99°F or more (3 months) | 12/92 | 24/104 | |||
| 36/106 | 24/104 | ||||
| Patients with an average temperature of 99°F or more (6 months) | 7/92 | 10/104 | |||
| 7/106 | 10/104 | ||||
| Median fever duration | 1 day | 6 days | Not reported | ||
| Mean fever duration | 1 day | 13 days | |||
| Mean number of days for temperature to permanently drop below 100°F | 1 day | 26 day | Not reported | ||
| Mean number of febrile days | 2.9 days | 10.2 days | Not reported | ||
| Study ID | Outcome | Time Point | Steroid Group | Control Group | Reported Statistical Significance | |
| Mean gain in weight from baseline (lbs)* | 1 months | 13 | 4 | Not reported | ||
| 2 months | 19 | 8 | ||||
| 3 months | 24 | 11 | P < 0.001 | |||
| 4 months | 25 | 13 | Not reported | |||
| 5 months | 26 | 15 | ||||
| 6 months | 27 | 17 | P < 0.001 | |||
| Mean gain in weight from baseline (lbs) | 1 month | 2.75 | 2.13 | No statistically significant differences in mean weight of trial arms at any time point. | ||
| 2 months | 7.56 | 4.93 | ||||
| 3 months | 8.05 | 8.09 | ||||
| Mean gain in weight (kg) | from day 18 to 70 | 7.2 | 4.2 | P = 0.0022 | ||
| Mean gain in weight from baseline (lbs) | 1 month | 12 | 6 | Not reported | ||
| 3 months | 21 | 11 | ||||
| 6 months | 24 | 17 | P = 0.1 | |||
| 12 months | 23 | 21 | ||||
| Mean gain in weight from baseline (lbs) | 1 month | 9 | 6 | P = 0.1 | ||
| 3 months | 26 | 11 | ||||
| 6 months | 24 | 17 | No statistically significant difference | |||
| 12 months | 21 | 21 | ||||
| Mean gain in weight from baseline(lbs) | 1 month | 8 | 6 | Not reported | ||
| 2 months | 17 | 11 | ||||
| 3 months | 21 | 15 | ||||
| 4 months | 21 | 15 | ||||
| 5 months | 21 | 16 | ||||
| 6 months | 21 | 16 | ||||
| Patients initially under 130 lbs who gained 15 lbs or more (n) | 2 months | 8/23 | 0/17 | P<0.025 | ||
| Number of patients initially 15 lbs or more under ideal weight who gained 15 lbs or more by | 2 months | 9/24 | 2/21 | P<0.05 | ||
| Number of patients initially more than 20 lbs under ideal weight who gained 15 lbs or more by | 2 months | 9/24 | 2/19 | |||
| Mean gain in weight from baseline (lbs) | 1 month | 8.6 | 4.4 | Not significant | ||
| 2 months | 12.3 | 5.1 | P<0.05 | |||
| 3 months | 13.3 | 7.2 | ||||
| 6 months | 16.51 | 11.74 | Not significant | |||
| Mean gain in weight from baseline (lbs) | 6 months | 25 | 16 | P<0.01 | ||
*Read from graph,
| Author | Outcome definition | Steroid Group | Control Group | Statistical Significance |
| Average length of stay for those discharged | 53.4 +/‐ 3.1 days | 71.3 +/‐ 5.6 days | P=0.0284 | |
| Average length of stay for those discharged | 10 months | 11 months | Not reported | |
| Average length of stay for those discharged | 188.7 days | 207.4 days | Not reported |
| Study ID | Outcome definition | Time point (months) | Steroid | Control | Statistical Significance Reported |
| Max expiratory flow rate (body temperature and pressure saturated; litres/minute) | Baseline | 189.8 (SD 101.7) | 205.1 (SD 114.4) | Significantly higher in the corticotrophin group, no value given | |
| 3 | 241.1 (SD 137.7) | 227.3 (SD 115.4) | |||
| 6 | 238.7 (SD 125.2) | 228.4 (SD 100.2) | |||
| Mean vital capacity (maximal inhalation; standard temperature and pressure dry) | Baseline | 2,649 (SD 751) | 2,523 (SD 838) | Increased to the same extent in both groups, no value given | |
| 3 | 2,940 (SD 757) | 2,728 (SD 790) | |||
| 6 | 2,995 (SD 817) | 2,874 (SD 786) | |||
| Max breathing capacity (body temperature and pressure saturated; litres/minute) | Baseline | 88.6 (SD 36.3) | 82.0 (SD 26.5) | Increased to the same extent in both groups, no value given | |
| 3 | 102.6 (SD 25.6) | 97.8 (SD 32.3) | |||
| 6 | 100.4 (SD 28.7) | 99.1 (SD 31.2) | |||
| Abnormal maximal voluntary ventilation | 6 | 12/46 | 20/58 | P < 0.05 | |
| 12 | 19/46 | 20/58 | No significant difference | ||
| Abnormal vital capacity | 6 | 14/46 | 12/58 | ||
| 12 | 19/46 | 24/58 | |||
| Abnormal maximal expiratory flow | 6 | 17/46 | 21/58 | ||
| 12 | 19/46 | 24/58 | |||
| Diffusion capacity normal | 1 | 34/49 | 35/51 | No significant difference | |
| 2 | 34/49 | 35/51 | |||
| 3 | 34/49 | 36/51 | |||
| 6 | 34/49 | 37/51 | |||
| Maximal Mid expiratory flow rate (1/sec) | 1 | 2 | 2 | No significant difference | |
| 2 | 2.1 | 2.1 | |||
| 3 | 2.1 | 2.3 | |||
| 6 | 2.2 | 2.3 | |||
| Vital capacity normal | 1 | 35/49 | 36/51 | No significant difference | |
| 2 | 36/49 | 37/51 | |||
| 3 | 36/49 | 37/51 | |||
| 6 | 39/49 | 40/51 | |||
| Lung volumes (6 variables measured) | Not reported | Data not extracted | No significant difference in any of the measures | ||
| Ventilation Effects (6 variables measured) | |||||
| Perfusion Effects (6 variables measured) | |||||
| Diffusion Effects (3 variables measured) | |||||
| Mean improvement in forced vital capacity (%) | 2 | 9.2 | 10.4 | No significant difference | |
| Mean improvement in forced expiratory capacity (%) | 13.1 | 9.4 | No significant difference | ||
| Author | Outcome definition | Steroid | Control | Statistical significance |
| Sepsis, venous thrombosis, mental changes, and partial deafness | Numbers not given, stated equal in each treatment arm. | Not reported | ||
| Hypersensitivity reactions | 4/54 | 8/54 | ||
| Hypertension | 1/45 | 0/46 | ||
| Toxicity | 0/45 | 0/46 | ||
| Drug resistance | 18/91 | Not reported | ||
| Developed co‐morbidities | 28/275 | 13/133 | ||
| Chemotherapy regimen changed due to PAS intolerance | 3/275 | 0/133 | ||
| Chemotherapy regimen changed due to streptomycin toxicity | 6/275 | 6/133 | ||
| Chemotherapy regimen changed due to hypersensitivity reactions | 7/275 | 9/133 | ||
| Vestibular disturbance | 2/87 | 5/91 | ||
| Hypersensitivity | 5/87 | 4/91 | ||
| Hypertension, diabetes, peptic ulcer, psychosis and infections | Incidence equal in each treatment arm (6%, 4%, 0%, 0%, and 4% respectively) | |||
| Changes to chemo regimen due to hypersensitivity, intolerance, drug resistance and ineffectiveness | 29/52 | 24/50 | P < 0.05 | |
| Related respiratory illness (5 years follow up) | 11/52 | 15/50 | Not reported | |
| Acne | 23/52 | 9/50 | ||
| Mooning of the face | 34/52 | 8.5/50 | ||
| Bronchitis, pneumonia or respiratory insufficiency | 4/52 | 11/50 | Not reported | |
| Hypersensitivity reactions | 19/52 | 7/50 | P < 0.025 | |
| Hypersensitivity reactions | 1/49 | 4/51 | Not reported | |
| ≥ 1 adverse event | 87/93 | 82/94 | P = 0.38 | |
| ≥ 1 severe or life threatening event within 3 years | 22/93 | 18/94 | P = 0.19 | |
| Candidiasis | 32/93 | 36/94 | Not reported | |
| Hyperglycemia | 9/93 | 3/94 | P = 0.036 | |
| Abdominal pain | 17/93 | 13/94 | P = 0.47 | |
| Hepatitis | 12/93 | 6/94 | P = 0.09 | |
| Fluid retention | 28/93 | 4/94 | P < 0.001 | |
| Pruritis | 33/93 | 33/94 | P = 0.95 | |
| Herpes simplex | 10/93 | 4/94 | Not reported | |
| Herpes Zoster | 16/93 | 17/94 | P = 0.99 | |
| Kaposi sarcoma | 0/93 | 2/94 | P = 0.49 | |
| Pneumonia | 16/93 | 16/94 | P = 0.93 | |
| Urinary tract infection | 14/93 | 7/94 | P = 0.19 | |
| Hypertension | 12/93 | 4/94 | P = 0.039 | |
| Number of complications | 1/14 | 5/13 | Not reported | |
| Number of side effects | 3/14 | 13/13 | ||
| Rebound phenomena ‐ fever | 8/13 | 0/14 | ||
| Infectious disease | 1/19 | 5/29 | ||
| Viral disease | 2/19 | 9/29 | ||
| bacterial disease | 2/19 | 3/29 | ||
| Incidence of adverse events | Figures not reported, stated no difference between groups | |||
| Athralgia | Figures not reported, stated no difference between groups | |||
| Swelling of feet or face | 62/344 | 3/339 | P = 0.00001 | |
| GI disturbances | 21/344 | 1/339 | P = 0.00001 | |
| Induced hyperglycaemia | 2/344 | 0/339 | Not reported | |
| Severe adverse event requiring discontinuation | 2/851 | 1/424 | Not reported | |
| Hepatitis | 4/851 | 2/424 | Not reported | |
| Sensitivity to Streptomycin‐Pyrazinamide | 68/851 | 22/424 | More patients showed intolerance in steroid groups | |
| Senstivity to Isoniazid‐PAS | 38/851 | 26/424 | Not reported | |
| Blood pressure | No differences in mean SBP or DBP at any time point | |||
| Fasting plasma glucose | No differences at any time points | |||
| Acne | 14/426 | 11/424 | Not reported | |
| Moonface | 10/426 | 3/424 | Not reported | |
| Euphoria | 6/426 | 4/424 | Not reported | |
| Oedema | 3/426 | 9/424 | Not reported | |
| Acne | 17/425 | 11/424 | Not reported | |
| Moonface | 11/425 | 3/424 | Not reported | |
| Euphoria | 11/425 | 4/424 | Not reported | |
| Oedema | 8/425 | 9/424 | Not reported | |
| Author | Outcome definition | Steroid | |
| Acne | 11/54 | ||
| Mooning of face | 22/54 | ||
| Fluid retention | 7/54 | ||
| Transient diabetes mellitus | 6/54 | ||
| DBP over 100 mm | 2/54 | ||
| Paroxysmal nocturnal dyspnoea | 1/54 | ||
| Withdrawal phenomena | None | ||
| Mooning of face | None | ||
| Steroid side effects | None | ||
| Steroid therapy changed or stopped | 15/111 | ||
| Mooning of the face | 7/72 | ||
| Rebound Phenomena | 6/111 | ||
| Hypertension | 7/111 | ||
| Pyschiatric disturbance | 6/111 | ||
| Steroid therapy changed or stopped | 7/116 | ||
| Mooning of the face | 30/116 | ||
| Rebound Phenomena | 34/116 | ||
| Hypertension | 6/116 | ||
| Glycosuria | 10/116 | ||
| Pyschiatric problems | 2/116 | ||
| Marked obesity | 3/87 | ||
| Hypertension | 11/87 | ||
| Mooning of the face | 18/87 | ||
| Hirsuitism | 1/87 | ||
| Transient glycosuria | 6/87 | ||
| Transient rash on prednisolone withdrawal | 17/87 | ||
| Withdrawn from prednisolone therapy | 2/87 | ||
| Acute thrombophlebitis | 1 | ||
| Herpes Zoster | 1 | ||
| Diabetes | 1 | ||
| Marked weight gain (23lb) | 1 | ||
| Moderate Acne | 1 | ||
| Temporary elevation of blood pressure | 3 | ||
| Abdominal distension | 7 | ||
| Steroid therapy suspended | 2 | ||
| Adverse events | None | ||
| Increased infection rate | None | ||
Results
Description of studies
Please also refer to the following sections: ‘Characteristics of included studies’ and ‘Characteristics of excluded studies’.
We identified 123 papers following searches. Eighteen of these studies met the inclusion criteria and 105 studies were excluded (refer to ‘Characteristics of excluded studies’ for further details). The 18 included studies were conducted between 1955 and 2005 with the majority undertaken over 20 years ago before TB regimens as used today were implemented. The trials included 3816 participants in total, with three trials having over 100 participants (USPHS 1965; BTA 1961; TBRC 1983). Only five of these trials (1087 participants) were completed during a time period when more effective rifampicin‐containing multi‐drug treatment regimens were being used (TBRC 1983; Toppett 1990; Park 1997; Bilaceroglu 1999; Mayanja‐Kizza 2005). One of these five studies enrolled only patients who were HIV positive (Mayanja‐Kizza 2005).
Trials were conducted in a variety of geographical settings including the USA (Weinstein 1959; Angel 1960; USPHS 1965; Marcus 1962; McLean 1963; Johnson 1965; Nemir 1967; Malik 1969), UK (Horne 1960; Keidan 1961; BTA 1961), Belgium (Toppett 1990), Italy (De Alemquer 1955), Turkey (Bilaceroglu 1999), South India (TBRC 1983), South Korea (Park 1997), Uganda (Mayanja‐Kizza 2005) and Ghana (Bell 1960). As such, trial participants when grouped became a very diverse population.
We summarized the specific steroid interventions the trials utilised and reported upon in the ‘Characteristics of included studies’ table. There was large heterogeneity not only in the adjunctive steroid therapy trials used but also in the chemotherapeutic regimens used especially amongst trials conducted before the 1980's when more effective short‐course, rifampicin containing therapy became treatment main‐stay.
All trials reported on all‐cause mortality, 13 studies reported on indicators of microbiological resolution, eight studies on clinical improvement, six on fever, eight on weight change, three on length of time spent in hospital, five studies on functional disability, and 12 studies on adverse events.
Risk of bias in included studies
Methods of allocation generation, allocation concealment and blinding within trials were used as indicators of methodological quality. Although methodological quality of included trials is shown to have differed substantially, it is unlikely that it caused inherent bias within any of the trials (for details on individual trials see ‘Characteristics of included studies’ section). Often descriptions of allocation generation, allocation concealment and blinding were missing from publications meaning that a judgement of unclear was given to the trial for its methodological quality rather than this judgement being made as an unsuitable method had been used. Six trials (Angel 1960; Bell 1960; Malik 1969; Marcus 1962; TBRC 1983; Toppett 1990) had a single indicator judged as being at high risk of causing bias, a summary of methodological assessments is given in Figure 1.
Funnel plots were constructed for each meta‐analysis, most showed no inherent risk of publication bias within the trials included in meta‐analyses. However, asymmetry was seen in funnel plots for the following outcomes; sputum conversion at two months (Figure 2) and clinical improvement at 1 month (Figure 3) indicating a potential risk of publication bias.

Funnel plot of comparison: 1 Steroid therapy comparative to either no therapy or placebo, outcome: 1.2 Sputum conversion by 2 months.

Funnel plot of comparison: 1 Steroid therapy comparative to either no therapy or placebo, outcome: 1.6 Clinical Improvement at 1 month.
Effects of interventions
All‐cause mortality
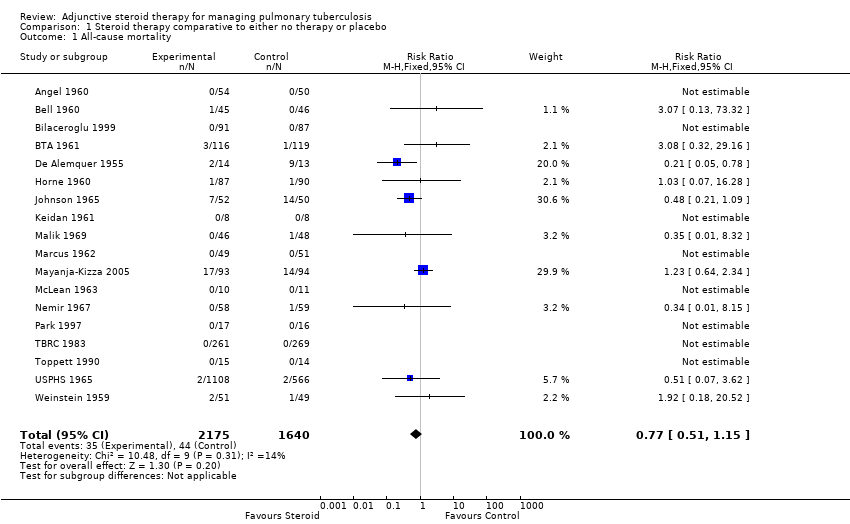
All 18 trials identified, including 3816 participants, reported on all‐cause mortality. Pooled results showed a 23% non significant decrease in all‐cause mortality amongst the intervention group (RR 0.77, 95% CI 0.51 to 1.15; 18 trials, 3816 participants, low quality evidence; Analysis 1.1, Figure 4).

Forest plot of comparison: 1 Steroid therapy comparative to either no therapy or placebo, outcome: 1.1 All‐cause mortality.
Of the included trials, only five trials were carried out after the introduction of rifampicin containing regimens (TBRC 1983; Toppett 1990; Park 1997; Bilaceroglu 1999; Mayanja‐Kizza 2005) and of these five trials only one trial amongst HIV positive PTB participants reported any deaths (Mayanja‐Kizza 2005). The risk ratio of mortality from this trial was RR 1.23, 95% CI 0.64 to 2.34; one trial, 187 participants. A sensitivity analysis pooling only data from these five trials found no difference in mortality amongst individuals taking steroids compared to those taking no steroid or placebo (RR 1.23, 95% CI 0.64 to 2.34; five trials, 957 participants, very low quality evidence). However, pooling the older trials which used non‐rifampicin containing regimens showed a statistically significant 43% decrease in all‐cause mortality amongst the intervention group (RR 0.57, 95% CI 0.34 to 0.97; 13 trials, 2858 participants, very low quality evidence).
We undertook a sensitivity analysis,only pooling studies where bias assessment criteria were judged not to be at high risk of introducing bias (Figure 1). A negligible difference in RR was found (RR 0.76, 95% CI 0.50 to 1.14; 12 trials, 2794 participants).
Secondary outcomes
Microbiological improvement
The WHO lists the following as standardised microbiological outcomes for TB:
-
Cure ‐ a patient initially smear‐positive who becomes smear‐negative by the last month of treatment and was smear negative on at least one previous occasion.
-
Failure ‐ a patient who was initially smear‐positive and who remained smear‐positive at month 5 or later during treatment.
-
Completed treatment ‐ a patient who completed treatment but did not meet the criteria for cure or failure.
-
Successfully treated ‐ a patient who was cured or who completed treatment.
-
Relapse ‐ a patient previously declared cured but with a new episode of bacteriologically positive (sputum smear or culture) tuberculosis.
Data was available amongst the 18 identified trials on sputum conversion, failure and relapse but not on cure, numbers completing treatment, or successfully treated.
Sputum conversion
Thirteen trials reported upon study‐specific indicators of sputum and culture clearance (Weinstein 1959; Angel 1960; Bell 1960; Horne 1960; BTA 1961; USPHS 1965; Marcus 1962; McLean 1963; Johnson 1965; Malik 1969; TBRC 1983; Bilaceroglu 1999; Mayanja‐Kizza 2005), just two of which were undertaken after the introduction of rifampicin‐containing TB regimens (TBRC 1983; Mayanja‐Kizza 2005) (Table 1).
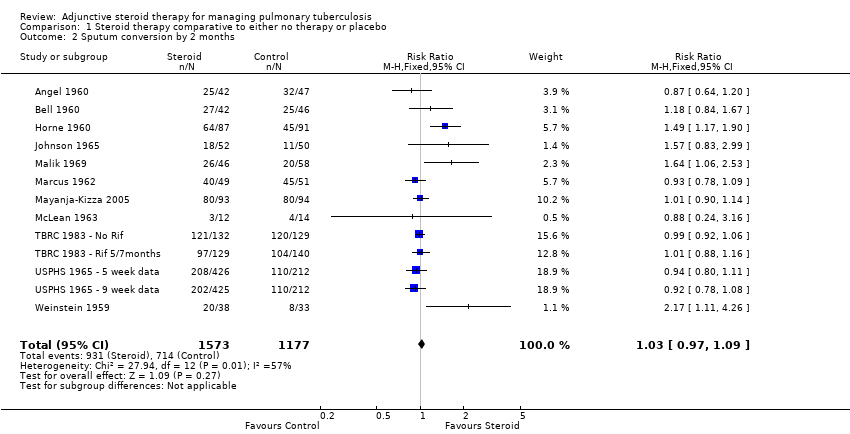
Pooled results showed no difference in sputum conversion both at two months after treatment initiation (RR 1.03, 95% CI 0.97 to 1.09; 12 trials, 2750 participants, Analysis 1.2, Figure 5, low quality evidence) and in the longer term (at six months after treatment initiation) (nine trials, 2150 participants, Analysis 1.3, Figure 6, low quality evidence).

Forest plot of comparison: 1 Steroid therapy comparative to either no therapy or placebo, outcome: 1.2 Sputum conversion by 2 months.

Forest plot of comparison: 1 Steroid therapy comparative to either no therapy or placebo, outcome: 1.3 Sputum conversion at 6 months.
In sensitivity analysis only data from studies where bias assessment criteria were judged not to be at high risk of introducing bias were pooled, a negligible difference in RR was found at both 2 months (RR 1.15, 95% CI 1.05 to 1.24; seven trials, 1232 participants) and 6 months (Figure 1).
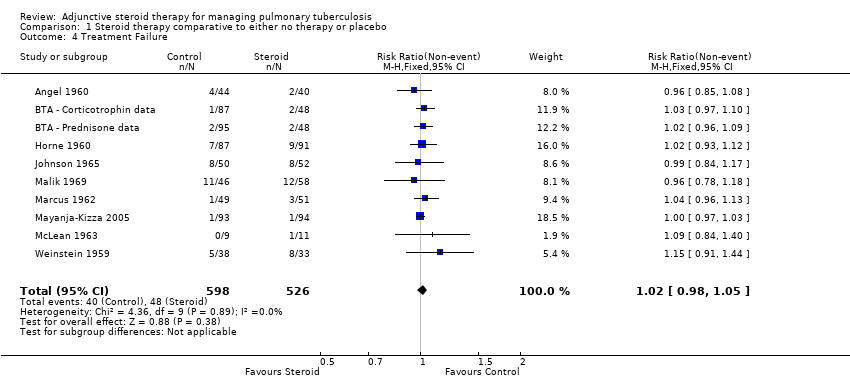
Treatment Failure
The WHO defines TB patients as 'failed' if they were initially smear positive and remained so beyond their 5th month of treatment. Nine trials (Weinstein 1959; Angel 1960; Horne 1960; BTA 1961; Marcus 1962; McLean 1963; Johnson 1965; Malik 1969; TBRC 1983) reported on treatment failure, only one of which was completed after the introduction of rifampicin‐containing treatments.
Amongst the nine trials study‐specific definitions of treatment failure differed substantially (for example 'failure to clear susceptible AFB after five consecutive months of anti‐tuberculous therapy’ and ‘those needing re‐treatment up to two years after first regimen of anti‐tuberculous therapy’, see Table 2) and, as such, it was not appropriate to pool these results. However, it was possible to pool results extracted using the WHO definition as a guide, no difference in failure rate was found between those taking steroids comparative to those taking no steroid or placebo (9 trials, participants 1124, Analysis 1.4, Figure 7, very low quality evidence).

Forest plot of comparison: 1 Steroid therapy comparative to either no therapy or placebo, outcome: 1.4 Treatment Failure.
Sensitivity analyses only including studies where bias assessment criteria were judged not to be at high risk of introducing bias made negligible difference (five trials, 558 participants) (Figure 1).
Treatment Relapse
Four trials (Johnson 1965; TBRC 1983; Bilaceroglu 1999; Mayanja‐Kizza 2005) reported on study specific indicators of treatment relapse (see Characteristics of included studies), no trials reported on relapse as defined by the WHO (see Table 3). Three of the four studies were completed after the introduction of rifampicin‐containing treatments (TBRC 1983; Bilaceroglu 1999; Mayanja‐Kizza 2005). No difference in relapse rates were found between those taking steroids comparative to those taking no steroid or placebo (four trials, 995 participants, Analysis 1.5, Figure 8, very low quality evidence).
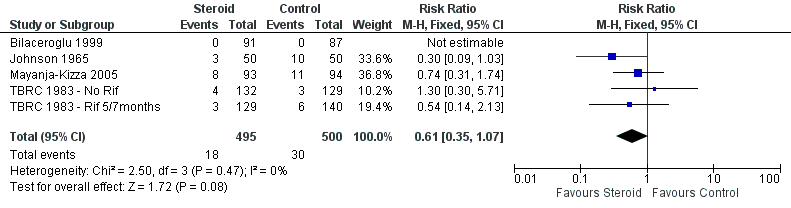
Forest plot of comparison: 1 Steroid therapy comparative to either no therapy or placebo, outcome: 1.5 Relapse.
In sensitivity analyses removing the single study that did not utilise rifampicin made little difference to the results (three trials, 634 participants) as did only including studies where bias assessment criteria were judged not to be at high risk of introducing bias (three trials, 178 participants) (Figure 1) .
Clinical improvement
We identified seven trials (Bell 1960; BTA 1961; Marcus 1962; McLean 1963; Johnson 1965; Keidan 1961; Nemir 1967) which reported numeric data for study specific indicators of clinical progress and a single study (Angel 1960) which commented narratively upon this outcome (Table 4). None of these trials were carried out after the introduction of rifampicin‐containing TB regimens (Table 4). Four trials reported upon clinical improvement at one month following treatment (Marcus 1962; BTA 1961; McLean 1963; Nemir 1967; Table 4) with pooled results showing a statistically significant 16% increase in clinical improvement amongst those taking steroids comparative to those taking no steroids or taking placebo (RR 1.16, 95% CI 1.09 to 1.24; four trials, 497 participants, Analysis 1.6, Figure 9, low quality of evidence).

Forest plot of comparison: 1 Steroid therapy comparative to either no therapy or placebo, outcome: 1.6 Clinical Improvement at 1 month.
In sensitivity analyses including only studies where bias assessment criteria were judged to be at low risk of introducing bias (three trials, 178 participants, low quality evidence) the difference in RR was negligible .
Fever
Six trials (Angel 1960; BTA 1961; Marcus 1962; McLean 1963; Johnson 1965; Bilaceroglu 1999) reported upon study specific indicators of fever. Only one of the trials was carried out after the introduction of rifampicin‐containing TB regimens (Bilaceroglu 1999) (Table 5). Five of the six studies (Angel 1960; Marcus 1962; McLean 1963; Johnson 1965; Bilaceroglu 1999) saw an improvement in fever reduction or time to fever reduction amongst the intervention group. Study‐specific indicators of fever abatement differed substantially so it was not appropriate to pool results. For two of the trials (Angel 1960; Marcus 1962) a single indicator of bias assessment is deemed to be at high risk of causing bias (Figure 1).
Weight change
Seven trials (Angel 1960; Bell 1960; Horne 1960; BTA 1961; Marcus 1962; Johnson 1965; Malik 1969; Bilaceroglu 1999) reported upon weight change at different time‐points since baseline (Table 6). Only one of these trials was carried out after the introduction of rifampicin‐containing TB regimens (Bilaceroglu 1999) (Table 6).
In seven of the eight trials reporting upon weight change it is significantly increased (during at least one time‐point) amongst individuals taking steroids compared to those taking no steroid or placebo (data not pooled, seven trials, 1203 participants, low quality evidence). For four of the trials (Angel 1960; Bell 1960; Malik 1969; Marcus 1962) an indicator of bias assessment is deemed to be at high risk of causing bias (Figure 1).
Length of hospital stay
Three trials reported study‐specific indicators of hospital stay length, all demonstrating statistically significant and potentially important reductions in length of stay (ranging from an average of 18 to 30 days) in the steroid group (Weinstein 1959; Johnson 1965; Bilaceroglu 1999), (data not pooled, three trials, participants 379, very low quality evidence). However the relevance of this finding is limited as most TB patients no longer remain inpatients whilst on treatment. Study‐specific indicators for length of stay differed substantially so it was not appropriate to pool results (Table 7).
Only one of these trials was carried out after the introduction of rifampicin‐containing TB regimens (Bilaceroglu 1999) (Table 7). For all three trials, bias assessment criteria were judged to be at low risk of introducing bias (Figure 1).
Functional disability
Five studies (Angel 1960; Marcus 1962; McLean 1963; Malik 1969; Park 1997) reported upon changes in specific indicators of lung function, only one of which was carried out after the introduction of rifampicin‐containing TB regimens (Park 1997).
No differences were found between the control and steroid groups for any indicator of lung function in three of the five trials (Marcus 1962; McLean 1963; Park 1997). Two studies (Angel 1960; Malik 1969) reported a significant difference in one of the three recorded indicators of lung function (Table 8). Amongst all five trials the majority of multiple measures of functional disability are unaffected by steroid use (data not pooled, five trials, participants 363, very low quality evidence).
For three of the five trials, bias assessment criteria were judged to be at high risk of introducing bias (Figure 1).
Adverse Events
There was considerable variation in the way adverse events were reported (Table 9; Table 10). Some studies reported adverse events only amongst the intervention group. It appeared that there was no increase in the number of adverse events amongst the intervention group excluding side effects that would be associated with steroid usage, the majority of which were minor (Table 10, very low quality evidence). However, reporting of adverse events was not consistent and it seems unlikely that all such events were captured by the trials.
Discussion
We identified 18 trials which met review inclusion criteria, published between 1955 and 2005, with a total of 3816 participants.
Corticosteroids did not reduce mortality from pulmonary tuberculosis (18 trials, 3816 participants, low quality evidence). We attempted to stratify all‐cause mortality results according to whether or not more effective rifampicin‐containing regimens had been used. However, in practice this was inconclusive as these more recent trials were generally very small and reported no deaths, apart from one single trial among people who were HIV positive (Mayanja‐Kizza 2005). For other outcomes, sensitivity analyses also made negligible differences to findings as trials excluded were again few and small.
Compared to placebo or no steroid adjunctive steroid therapy was associated with a significant 16% increase in clinical improvement at one month (RR 1.16, 95% CI 1.09 to 1.24; four trials, 497 participants, Analysis 1.6, Figure 9low quality evidence). However, these was no difference in sputum conversion at two months (RR 1.03, 95% CI 0.97 to 1.09; 12 trials, 2170 participants). Significant, short term clinical benefits of corticosteroid use were not maintained in the long term. Neither sputum conversion at 6 months (RR 1.01, CI 0.98 to 1.04; nine trials, 2150 participants), failure rate (RR 1.02, CI 0.98 to 1.05; 10 trials, 1124 participants) or relapse rate (RR 0.61, CI 0.35 to 1.07; four trials, 995 participants) were found to differ amongst those taking corticosteroid compared to those taking no steroid or placebo.
Corticosteroid use was also found to: reduce the duration of fever (data not pooled, six trials, 851 participants, very low quality evidence), increase weight gain during differing study specific time points (data not pooled, eight trials, 1203 participants, low quality evidence), and to decrease length of hospital stay (data not pooled, three trials, participants 379, very low quality evidence) when compared with no steroid treatment or placebo. No differences in functional disability were found (data not pooled, five trials, participants 363, low quality evidence) between those taking corticosteroids and those taking no steroids or placebo. The reporting of adverse events amongst both the intervention and control groups was poor in the majority of studies reviewed. However, amongst those treated with adjunctive steroid therapy in the most recent study (completed amongst HIV patients) hyperglycaemia, fluid retention, and hypertension were all reported as being significantly more common.
Although improvement of symptoms, signs, clinical and microbiological outcomes amongst those taking corticosteroid are continually reported within publication text and narrative reviews and our findings support such comment, they should be interpreted with caution as the evidence behind these findings is of poor quality. Findings are often based upon few trials with low participant numbers. In this review, three trials included were completed amongst children (Keidan 1961; Nemir 1967; Toppett 1990) who are known to react differently to TB infection and treatment. There is also great heterogeneity within intervention and control treatment regimens utilised in included trials, as well as in methodology of included trials. How findings from trials utilising historic treatment regimens can be extrapolated to modern short‐course rifampicin including treatment regimens is unknown. As such, we were unable to draw any robust conclusions upon whether adjunctive corticosteroids reduce mortality or accelerate microbiological or clinical recovery in people with PTB based upon current evidence.
There is limited evidence from older trials (not using modern multi‐drug rifampicin‐containing treatment regimens) that steroids could improve clinical symptoms, particularly in the short term. Corticosteroids may have some clinical benefits for those with PTB, but the trials published to date are too few, too small and too old to demonstrate any statistically significant and clinically relevant effects (Critchley 2013).
TB incidence has remained high in some parts of the world. One of the key drivers of TB rates over recent decades has been the HIV epidemic, yet only one trial identified was carried out amongst HIV positive PTB patients. Corticosteroids are a very cheap intervention, and might have the potential to improve TB treatment outcomes amongst those with advanced disease especially in resource poor settings, where PTB case‐fatality remains high. However, it should also be noted that corticosteroids can cause severe adverse effects, and the benefit to risk ratio of their use for PTB remains unclear. Further adequately powered, well‐designed RCTs for adjunctive steroid use in HIV positive, immuno‐compromised and immuno‐competent patients are needed before robust conclusions upon the potential benefits of this intervention can be made. Such trials should report on patient quality of life and cost‐effectiveness, as well as more standard TB treatment outcomes.
Risk of bias summary: review authors' judgements regarding each risk of bias item for each included study.
Funnel plot of comparison: 1 Steroid therapy comparative to either no therapy or placebo, outcome: 1.2 Sputum conversion by 2 months.
Funnel plot of comparison: 1 Steroid therapy comparative to either no therapy or placebo, outcome: 1.6 Clinical Improvement at 1 month.
Forest plot of comparison: 1 Steroid therapy comparative to either no therapy or placebo, outcome: 1.1 All‐cause mortality.
Forest plot of comparison: 1 Steroid therapy comparative to either no therapy or placebo, outcome: 1.2 Sputum conversion by 2 months.
Forest plot of comparison: 1 Steroid therapy comparative to either no therapy or placebo, outcome: 1.3 Sputum conversion at 6 months.
Forest plot of comparison: 1 Steroid therapy comparative to either no therapy or placebo, outcome: 1.4 Treatment Failure.
Forest plot of comparison: 1 Steroid therapy comparative to either no therapy or placebo, outcome: 1.5 Relapse.
Forest plot of comparison: 1 Steroid therapy comparative to either no therapy or placebo, outcome: 1.6 Clinical Improvement at 1 month.
Comparison 1 Steroid therapy comparative to either no therapy or placebo, Outcome 1 All‐cause mortality.
Comparison 1 Steroid therapy comparative to either no therapy or placebo, Outcome 2 Sputum conversion by 2 months.

Comparison 1 Steroid therapy comparative to either no therapy or placebo, Outcome 3 Sputum conversion at 6 months.
Comparison 1 Steroid therapy comparative to either no therapy or placebo, Outcome 4 Treatment Failure.

Comparison 1 Steroid therapy comparative to either no therapy or placebo, Outcome 5 Relapse.

Comparison 1 Steroid therapy comparative to either no therapy or placebo, Outcome 6 Clinical Improvement at 1 month.
| Steroid therapy comparative to either no therapy or placebo for managing pulmonary tuberculosis | ||||||
| Patient or population: patients with managing pulmonary tuberculosis | ||||||
| Outcomes | Illustrative comparative risks* (95% CI) | Relative effect | No of Participants | Quality of the evidence | Comments | |
| Assumed risk | Corresponding risk | |||||
| Control | Steroid therapy comparative to either no therapy or placebo | |||||
| All‐cause mortality | 27 per 1000 | 21 per 1000 | RR 0.77 | 3815 | ⊕⊕⊝⊝ | |
| Sputum Conversion by 2 months | 656 per 1000 | 722 per 1000 | RR 1.1 | 1475 | ⊕⊕⊝⊝ | |
| Sputum conversion at 6 months | Study population | RR 1.01 | 875 | ⊕⊕⊕⊝ | ||
| 911 per 1000 | 920 per 1000 | |||||
| Clinical Improvement at 1 month | Study population | RR 1.16 | 497 | ⊕⊝⊝⊝ | ||
| 794 per 1000 | 921 per 1000 | |||||
| *The assumed risk is the mean control group risk across studies. The corresponding risk (and its 95% confidence interval) is based on the assumed risk in the comparison group and the relative effect of the intervention (and its 95% CI). | ||||||
| GRADE Working Group grades of evidence | ||||||
| 1 Not downgraded for risk of bias: Most of these studies were conducted in the 1960s and provided minimal detail on trial methods. However, the most recent trial from 2005 was well conducted and showed no evidence of clinical benefit with steroids. | ||||||
| Study ID | Outcome Definition | Culture or Smear (if culture not reported) Negative | ||||
| Time point (month) | Steroid | Control | Reported Statistical Significance | |||
| Culture negative; three samples of sputum or gastric washings were sent for culture at start of treatment then at monthly intervals. | Baseline | 0/54 | 0/50 | No significant difference | ||
| 1 | 7/34 | 12/38 | ||||
| 2 | 25/42 | 32/47 | ||||
| 3 | 29/46 | 39/42 | P < 0.001 significantly greater among controls | |||
| 4 | 39/45 | 41/45 | No significant difference | |||
| 5 | 40/44 | 38/40 | ||||
| 6 | 45/47 | 43/46 | ||||
| Culture negative; 24 hour specimens of sputum were collected until treatment started, then collected monthly. Concentrates prepared by tri‐sodium phosphate method and incubated for 12 weeks. | Baseline | 0/45 | 0/46 | No significant difference | ||
| 1 | 16/44 | 11/45 | ||||
| 2 | 27/42 | 25/46 | ||||
| 3 | 31/41 | 35/43 | ||||
| Culture conversion rate (Sputum taken twice weekly) | Reported as 'comparable' | P = 0.0794 | ||||
| Culture negative; direct smear and culture exam taken monthly and analysed using local lab facilities | Baseline | 9/111 | 5/118 | Not reported | ||
| 1 | 36/100 | 31/109 | ||||
| 3 | 70/89 | 77/104 | ||||
| 6 | 86/87 | 91/95 | ||||
| 9 | 67/67 | 74/74 | ||||
| 12 | 40/40 | 39/40 | ||||
| Culture negative; direct smear and culture exam taken monthly and analysed using local lab facilities | Baseline | 4/115 | 5/118 | |||
| 1 | 36/109 | 31/109 | ||||
| 3 | 80/104 | 77/104 | ||||
| 6 | 93/95 | 91/95 | ||||
| 9 | 80/80 | 74/74 | ||||
| 12 | 45/45 | 39/40 | ||||
| Culture negative; direct sputum smear, gastric lavage or laryngeal swabs | 1 | 40/87 | 28/91 | No significant difference | ||
| 2 | 64/87 | 45/91 | P < 0.01 | |||
| 3 | 67/87 | 62/91 | No significant difference | |||
| 4 | 75/87 | 75/91 | ||||
| 5 | 80/87 | 82/91 | ||||
| 6 | 86/87 | 91/91 | ||||
| 9 | 75/77 | 80/80 | ||||
| 12 | 77/77 | 80/80 | ||||
| Specimens of sputum were collected every two weeks for four months and then every month thereafter Reversal of infectiousness; the first of three consecutive monthly specimens negative for tubercle bacilli on microscopy and culture | 2 | 18/52 | 11/50 | No significant difference | ||
| 4 | 30/52 | 31/50 | ||||
| 6 | 38/52 | 37/50 | ||||
| 8 | 46/52 | 42/50 | ||||
| 10 | 49/52 | 44/50 | ||||
| 12 | 48/52 | 46/50 | ||||
| Sputum negative; disappearance of sputum in bacilli was monitored for monthly | 1 | 11/46 | 14/58 | No significant difference | ||
| 2 | 26/46 | 20/58 | P < 0.05 | |||
| 3 | 28/46 | 28/58 | P < 0.05 | |||
| 6 | 35/46 | 46/58 | No significant difference | |||
| Culture negative; specimens of sputum were collected every two weeks until 2 months then at 3 months and 6 months | 1 | 35/49 | 31/51 | Not reported | ||
| 2 | 40/49 | 45/51 | ||||
| 3 | 45/49 | 45/51 | ||||
| 6 | 48/49 | 48/51 | ||||
| Culture negative; sputum cultures obtained at month 1 and 2 and examined for AFB | 1 | 58/93 | 35/94 | P = 0.001 | ||
| 2 | 80/93 | 80/94 | No significant difference | |||
| Smear or sputum negative; Smear or culture of sputum or gastric aspirate | 1 | 0/13 | 0/14 | No significant difference | ||
| 2 | 3/12 | 4/14 | ||||
| 3 | 5/11 | 8/14 | ||||
| 4 | 8/12 | 11/14 | ||||
| 5 | 8/11 | 13/13 | ||||
| 6 | 9/9 | 10/11 | ||||
| Culture from bronchial aspiration and gastric washings on 3 successive morning on admission; culture positive after therapy | During therapy | 4/58 | 2/59 | Not reported | ||
| After therapy | 2/58 | 2/59 | Not reported | |||
| Culture negative; Sputum smears examined by fluorescence microscopy and cultured using a modification of Petroffs method. TB chemotherapeutic with rifampicin for either 5 or 7 months. | 1 | 59/132 | 70/129 | No significant difference | ||
| 2 | 121/132 | 120/129 | ||||
| 3 | 1284/132 | 123/129 | ||||
| Culture negative; Sputum smears examined by fluorescence microscopy and cultured using a modification of Petroffs method.TB chemotherapeutic regimen without rifampicin. | 1 | 46/129 | 36/140 | No significant difference | ||
| 2 | 97/129 | 104/140 | ||||
| 3 | 116/129 | 123/140 | ||||
| Culture negative | 1 | 121/426 | 101/424 | Not reported | ||
| 2 | 208/426 | 220/424 | Not reported | |||
| 3 | 316/426 | 308/424 | Not reported | |||
| 4 | 365/426 | 342/424 | Not reported | |||
| 5 | 387/426 | 374/424 | Not reported | |||
| 6 | 389/426 | 372/424 | Not reported | |||
| 8 | 410/426 | 392/424 | Not reported | |||
| Culture negative | 1 | 107/425 | 101/424 | Not reported | ||
| 2 | 202/425 | 220/424 | Not reported | |||
| 3 | 263/425 | 308/424 | Not reported | |||
| 4 | 330/425 | 342/424 | Not reported | |||
| 5 | 368/425 | 374/424 | Not reported | |||
| 6 | 395/425 | 372/424 | Not reported | |||
| 8 | 389/425 | 392/424 | Not reported | |||
| Sputum negative; Cumulative sputum conversion | Baseline | 16/38 | 6/33 | Not reported | ||
| 2 | 20/38 | 8/33 | ||||
| 8 | 33/38 | 25/33 | ||||
| Study ID | Outcome Definition | Steroid | Control | Reported Statistical Significance | |
| Culture positive at 5 months | 4/44 | 2/40 | Not reported | ||
| Culture positive at 6 months | 1/87 | 4/95 | |||
| Culture positive at 6 months | 2/95 | 4/95 | |||
| Culture positive at 5 months | 7/87 | 9/91 | |||
| Culture or smear positive at 6 months | 8/50 | 8/52 | |||
| Study specific indicator, failure to convert by 12 months | 2/50 | 4/52 | |||
| Culture or smear positive at 6 months | 11/46 | 12/58 | |||
| Culture or smear positive at 6 months | 1/49 | 3/51 | |||
| Study specific indicator, not described further | 1/93 | 1/94 | No significant difference | ||
| Culture positive at 6 months | 0/9 | 1/11 | Not reported | ||
| Sputum positive at end of study (6 to 16 months) | 2/38 | 6/33 | |||
| Study ID | Method | Steroid | Control | Reported Statistical Significance | |
| Smear or culture positive TB within 3 years follow up | 0/91 | 0/87 | Not reported | ||
| Number readmitted for TB during up to five years of follow up | 3/50 | 10/50 | P < 0.05 | ||
| Those needing re‐treatment up to two years after first regimen of anti‐tuberculous therapy. | 8/93 | 11/94 | No difference | ||
| Two or more of six cultures positive in any three consecutive monthly exams | 4/132 | 3/129 | No difference | ||
| 3/129 | 6/140 | ||||
| Study ID | Outcome Definition | Time Point (months) | Steroid Group | Control Group | Reported Statstical Significance | |
| Immediate and pronounced non‐specific improvement in general condition reported by nurses and patients | N/A, described as being immeasurable numerically | |||||
| Number of participants judged by treating physician to be in 'fair' or 'good' condition as opposed to 'severely ill' or 'poor' condition. | 1 | 44/44 | 39/46 | Improvement from baseline greater in steroid group P < 0.01 | ||
| 2 | 42/42 | 46/46 | No difference | |||
| Number of patients judged by treating physician to have had 'considerable', 'moderate' or 'slight improvement' as opposed to 'no change' or 'deterioration' | 1 | 96/99 | 100/114 | Not reported | ||
| 3 | 91/92 | 102/107 | ||||
| 6 | 85/86 | 94/95 | ||||
| Number of patients judged by treating physician to have had considerable, moderate or slight improvement | 1 | 113/116 | 100/114 | |||
| 3 | 107/108 | 102/107 | ||||
| 6 | 98/98 | 94/95 | ||||
| Participants initially with; any degree of cough or sputum, or moderate to severe symptoms, who saw moderate to marked improvement in condition. | 10 weeks | 39/48 | 28/46 | P < 0.05 | ||
| Participants showing definite‐striking improvement | 1 | 8/8 | 0/8 | Not reported | ||
| Improvement in 'well‐being and strength' | 7 weeks | 49/49 | 48/51 | Not reported | ||
| 'Rapid symptom response'; method of assessment unclear | Not reported | 13/13 | 1/14 | P < 0.0001 | ||
| 'Improved'; Method of assessment unclear. | 1 | 23/31 | 14/31 | No difference | ||
| 2 | 10/16 | 9/18 | ||||
| 3 | 5/6 | 3/4 | ||||
| 6 | 0/1 | 0/2 | ||||
| 7 | 0/1 | 0/1 | ||||
| time point unclear | 39/58 | 27/59 | P < 0.05 | |||
| Author | Outcome Definition | Steroid Group | Control Group | Reported Statistical Significance | |
| Mean time till patients afebrile, temperature not specified | 5 days | 19.4 days | Not reported | ||
| Mean time till patients afebrile (<37.5°C) | 25 days | 47 days | Not reported | ||
| Mean temperature change 72 hours after treatment initiation | ‐1.2 ºC | + 0.2ºC | P = 0.003 | ||
| Patients with an average temperature of 99°F or more (1 month) | 23/100 | 52/113 | Not reported | ||
| 17/113 | 52/113 | ||||
| Patients with an average temperature of 99°F or more (3 months) | 12/92 | 24/104 | |||
| 36/106 | 24/104 | ||||
| Patients with an average temperature of 99°F or more (6 months) | 7/92 | 10/104 | |||
| 7/106 | 10/104 | ||||
| Median fever duration | 1 day | 6 days | Not reported | ||
| Mean fever duration | 1 day | 13 days | |||
| Mean number of days for temperature to permanently drop below 100°F | 1 day | 26 day | Not reported | ||
| Mean number of febrile days | 2.9 days | 10.2 days | Not reported | ||
| Study ID | Outcome | Time Point | Steroid Group | Control Group | Reported Statistical Significance | |
| Mean gain in weight from baseline (lbs)* | 1 months | 13 | 4 | Not reported | ||
| 2 months | 19 | 8 | ||||
| 3 months | 24 | 11 | P < 0.001 | |||
| 4 months | 25 | 13 | Not reported | |||
| 5 months | 26 | 15 | ||||
| 6 months | 27 | 17 | P < 0.001 | |||
| Mean gain in weight from baseline (lbs) | 1 month | 2.75 | 2.13 | No statistically significant differences in mean weight of trial arms at any time point. | ||
| 2 months | 7.56 | 4.93 | ||||
| 3 months | 8.05 | 8.09 | ||||
| Mean gain in weight (kg) | from day 18 to 70 | 7.2 | 4.2 | P = 0.0022 | ||
| Mean gain in weight from baseline (lbs) | 1 month | 12 | 6 | Not reported | ||
| 3 months | 21 | 11 | ||||
| 6 months | 24 | 17 | P = 0.1 | |||
| 12 months | 23 | 21 | ||||
| Mean gain in weight from baseline (lbs) | 1 month | 9 | 6 | P = 0.1 | ||
| 3 months | 26 | 11 | ||||
| 6 months | 24 | 17 | No statistically significant difference | |||
| 12 months | 21 | 21 | ||||
| Mean gain in weight from baseline(lbs) | 1 month | 8 | 6 | Not reported | ||
| 2 months | 17 | 11 | ||||
| 3 months | 21 | 15 | ||||
| 4 months | 21 | 15 | ||||
| 5 months | 21 | 16 | ||||
| 6 months | 21 | 16 | ||||
| Patients initially under 130 lbs who gained 15 lbs or more (n) | 2 months | 8/23 | 0/17 | P<0.025 | ||
| Number of patients initially 15 lbs or more under ideal weight who gained 15 lbs or more by | 2 months | 9/24 | 2/21 | P<0.05 | ||
| Number of patients initially more than 20 lbs under ideal weight who gained 15 lbs or more by | 2 months | 9/24 | 2/19 | |||
| Mean gain in weight from baseline (lbs) | 1 month | 8.6 | 4.4 | Not significant | ||
| 2 months | 12.3 | 5.1 | P<0.05 | |||
| 3 months | 13.3 | 7.2 | ||||
| 6 months | 16.51 | 11.74 | Not significant | |||
| Mean gain in weight from baseline (lbs) | 6 months | 25 | 16 | P<0.01 | ||
| *Read from graph, | ||||||
| Author | Outcome definition | Steroid Group | Control Group | Statistical Significance |
| Average length of stay for those discharged | 53.4 +/‐ 3.1 days | 71.3 +/‐ 5.6 days | P=0.0284 | |
| Average length of stay for those discharged | 10 months | 11 months | Not reported | |
| Average length of stay for those discharged | 188.7 days | 207.4 days | Not reported |
| Study ID | Outcome definition | Time point (months) | Steroid | Control | Statistical Significance Reported |
| Max expiratory flow rate (body temperature and pressure saturated; litres/minute) | Baseline | 189.8 (SD 101.7) | 205.1 (SD 114.4) | Significantly higher in the corticotrophin group, no value given | |
| 3 | 241.1 (SD 137.7) | 227.3 (SD 115.4) | |||
| 6 | 238.7 (SD 125.2) | 228.4 (SD 100.2) | |||
| Mean vital capacity (maximal inhalation; standard temperature and pressure dry) | Baseline | 2,649 (SD 751) | 2,523 (SD 838) | Increased to the same extent in both groups, no value given | |
| 3 | 2,940 (SD 757) | 2,728 (SD 790) | |||
| 6 | 2,995 (SD 817) | 2,874 (SD 786) | |||
| Max breathing capacity (body temperature and pressure saturated; litres/minute) | Baseline | 88.6 (SD 36.3) | 82.0 (SD 26.5) | Increased to the same extent in both groups, no value given | |
| 3 | 102.6 (SD 25.6) | 97.8 (SD 32.3) | |||
| 6 | 100.4 (SD 28.7) | 99.1 (SD 31.2) | |||
| Abnormal maximal voluntary ventilation | 6 | 12/46 | 20/58 | P < 0.05 | |
| 12 | 19/46 | 20/58 | No significant difference | ||
| Abnormal vital capacity | 6 | 14/46 | 12/58 | ||
| 12 | 19/46 | 24/58 | |||
| Abnormal maximal expiratory flow | 6 | 17/46 | 21/58 | ||
| 12 | 19/46 | 24/58 | |||
| Diffusion capacity normal | 1 | 34/49 | 35/51 | No significant difference | |
| 2 | 34/49 | 35/51 | |||
| 3 | 34/49 | 36/51 | |||
| 6 | 34/49 | 37/51 | |||
| Maximal Mid expiratory flow rate (1/sec) | 1 | 2 | 2 | No significant difference | |
| 2 | 2.1 | 2.1 | |||
| 3 | 2.1 | 2.3 | |||
| 6 | 2.2 | 2.3 | |||
| Vital capacity normal | 1 | 35/49 | 36/51 | No significant difference | |
| 2 | 36/49 | 37/51 | |||
| 3 | 36/49 | 37/51 | |||
| 6 | 39/49 | 40/51 | |||
| Lung volumes (6 variables measured) | Not reported | Data not extracted | No significant difference in any of the measures | ||
| Ventilation Effects (6 variables measured) | |||||
| Perfusion Effects (6 variables measured) | |||||
| Diffusion Effects (3 variables measured) | |||||
| Mean improvement in forced vital capacity (%) | 2 | 9.2 | 10.4 | No significant difference | |
| Mean improvement in forced expiratory capacity (%) | 13.1 | 9.4 | No significant difference | ||
| Author | Outcome definition | Steroid | Control | Statistical significance |
| Sepsis, venous thrombosis, mental changes, and partial deafness | Numbers not given, stated equal in each treatment arm. | Not reported | ||
| Hypersensitivity reactions | 4/54 | 8/54 | ||
| Hypertension | 1/45 | 0/46 | ||
| Toxicity | 0/45 | 0/46 | ||
| Drug resistance | 18/91 | Not reported | ||
| Developed co‐morbidities | 28/275 | 13/133 | ||
| Chemotherapy regimen changed due to PAS intolerance | 3/275 | 0/133 | ||
| Chemotherapy regimen changed due to streptomycin toxicity | 6/275 | 6/133 | ||
| Chemotherapy regimen changed due to hypersensitivity reactions | 7/275 | 9/133 | ||
| Vestibular disturbance | 2/87 | 5/91 | ||
| Hypersensitivity | 5/87 | 4/91 | ||
| Hypertension, diabetes, peptic ulcer, psychosis and infections | Incidence equal in each treatment arm (6%, 4%, 0%, 0%, and 4% respectively) | |||
| Changes to chemo regimen due to hypersensitivity, intolerance, drug resistance and ineffectiveness | 29/52 | 24/50 | P < 0.05 | |
| Related respiratory illness (5 years follow up) | 11/52 | 15/50 | Not reported | |
| Acne | 23/52 | 9/50 | ||
| Mooning of the face | 34/52 | 8.5/50 | ||
| Bronchitis, pneumonia or respiratory insufficiency | 4/52 | 11/50 | Not reported | |
| Hypersensitivity reactions | 19/52 | 7/50 | P < 0.025 | |
| Hypersensitivity reactions | 1/49 | 4/51 | Not reported | |
| ≥ 1 adverse event | 87/93 | 82/94 | P = 0.38 | |
| ≥ 1 severe or life threatening event within 3 years | 22/93 | 18/94 | P = 0.19 | |
| Candidiasis | 32/93 | 36/94 | Not reported | |
| Hyperglycemia | 9/93 | 3/94 | P = 0.036 | |
| Abdominal pain | 17/93 | 13/94 | P = 0.47 | |
| Hepatitis | 12/93 | 6/94 | P = 0.09 | |
| Fluid retention | 28/93 | 4/94 | P < 0.001 | |
| Pruritis | 33/93 | 33/94 | P = 0.95 | |
| Herpes simplex | 10/93 | 4/94 | Not reported | |
| Herpes Zoster | 16/93 | 17/94 | P = 0.99 | |
| Kaposi sarcoma | 0/93 | 2/94 | P = 0.49 | |
| Pneumonia | 16/93 | 16/94 | P = 0.93 | |
| Urinary tract infection | 14/93 | 7/94 | P = 0.19 | |
| Hypertension | 12/93 | 4/94 | P = 0.039 | |
| Number of complications | 1/14 | 5/13 | Not reported | |
| Number of side effects | 3/14 | 13/13 | ||
| Rebound phenomena ‐ fever | 8/13 | 0/14 | ||
| Infectious disease | 1/19 | 5/29 | ||
| Viral disease | 2/19 | 9/29 | ||
| bacterial disease | 2/19 | 3/29 | ||
| Incidence of adverse events | Figures not reported, stated no difference between groups | |||
| Athralgia | Figures not reported, stated no difference between groups | |||
| Swelling of feet or face | 62/344 | 3/339 | P = 0.00001 | |
| GI disturbances | 21/344 | 1/339 | P = 0.00001 | |
| Induced hyperglycaemia | 2/344 | 0/339 | Not reported | |
| Severe adverse event requiring discontinuation | 2/851 | 1/424 | Not reported | |
| Hepatitis | 4/851 | 2/424 | Not reported | |
| Sensitivity to Streptomycin‐Pyrazinamide | 68/851 | 22/424 | More patients showed intolerance in steroid groups | |
| Senstivity to Isoniazid‐PAS | 38/851 | 26/424 | Not reported | |
| Blood pressure | No differences in mean SBP or DBP at any time point | |||
| Fasting plasma glucose | No differences at any time points | |||
| Acne | 14/426 | 11/424 | Not reported | |
| Moonface | 10/426 | 3/424 | Not reported | |
| Euphoria | 6/426 | 4/424 | Not reported | |
| Oedema | 3/426 | 9/424 | Not reported | |
| Acne | 17/425 | 11/424 | Not reported | |
| Moonface | 11/425 | 3/424 | Not reported | |
| Euphoria | 11/425 | 4/424 | Not reported | |
| Oedema | 8/425 | 9/424 | Not reported | |
| Author | Outcome definition | Steroid | |
| Acne | 11/54 | ||
| Mooning of face | 22/54 | ||
| Fluid retention | 7/54 | ||
| Transient diabetes mellitus | 6/54 | ||
| DBP over 100 mm | 2/54 | ||
| Paroxysmal nocturnal dyspnoea | 1/54 | ||
| Withdrawal phenomena | None | ||
| Mooning of face | None | ||
| Steroid side effects | None | ||
| Steroid therapy changed or stopped | 15/111 | ||
| Mooning of the face | 7/72 | ||
| Rebound Phenomena | 6/111 | ||
| Hypertension | 7/111 | ||
| Pyschiatric disturbance | 6/111 | ||
| Steroid therapy changed or stopped | 7/116 | ||
| Mooning of the face | 30/116 | ||
| Rebound Phenomena | 34/116 | ||
| Hypertension | 6/116 | ||
| Glycosuria | 10/116 | ||
| Pyschiatric problems | 2/116 | ||
| Marked obesity | 3/87 | ||
| Hypertension | 11/87 | ||
| Mooning of the face | 18/87 | ||
| Hirsuitism | 1/87 | ||
| Transient glycosuria | 6/87 | ||
| Transient rash on prednisolone withdrawal | 17/87 | ||
| Withdrawn from prednisolone therapy | 2/87 | ||
| Acute thrombophlebitis | 1 | ||
| Herpes Zoster | 1 | ||
| Diabetes | 1 | ||
| Marked weight gain (23lb) | 1 | ||
| Moderate Acne | 1 | ||
| Temporary elevation of blood pressure | 3 | ||
| Abdominal distension | 7 | ||
| Steroid therapy suspended | 2 | ||
| Adverse events | None | ||
| Increased infection rate | None | ||
| Outcome or subgroup title | No. of studies | No. of participants | Statistical method | Effect size |
| 1 All‐cause mortality Show forest plot | 18 | 3815 | Risk Ratio (M‐H, Fixed, 95% CI) | 0.77 [0.51, 1.15] |
| 2 Sputum conversion by 2 months Show forest plot | 13 | 2750 | Risk Ratio (M‐H, Fixed, 95% CI) | 1.03 [0.97, 1.09] |
| 3 Sputum conversion at 6 months Show forest plot | 10 | 2150 | Risk Ratio (M‐H, Fixed, 95% CI) | 1.01 [0.98, 1.04] |
| 4 Treatment Failure Show forest plot | 10 | 1124 | Risk Ratio (M‐H, Fixed, 95% CI) | 1.02 [0.98, 1.05] |
| 5 Relapse Show forest plot | 5 | 995 | Risk Ratio (M‐H, Fixed, 95% CI) | 0.61 [0.35, 1.07] |
| 6 Clinical Improvement at 1 month Show forest plot | 5 | 497 | Risk Ratio (M‐H, Fixed, 95% CI) | 1.16 [1.09, 1.24] |