| Study ID | Outcome Definition | Culture or Smear (if culture not reported) Negative |
| Time point (month) | Steroid | Control | Reported Statistical Significance |
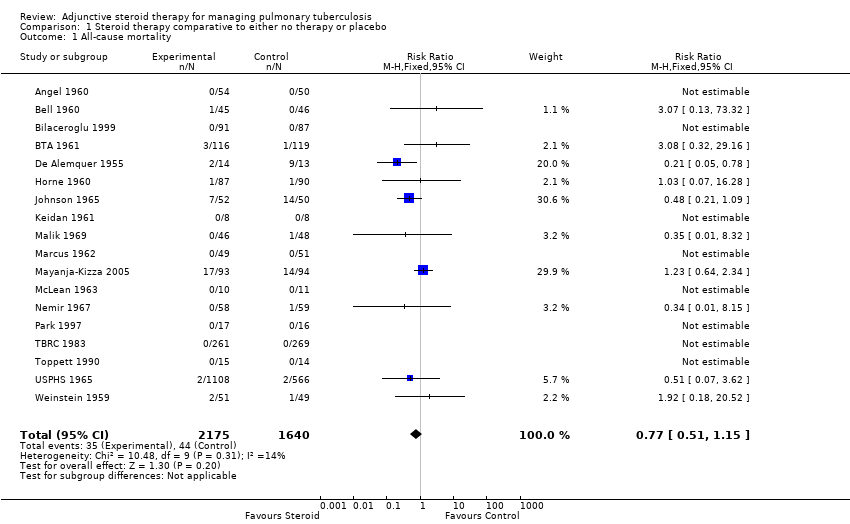
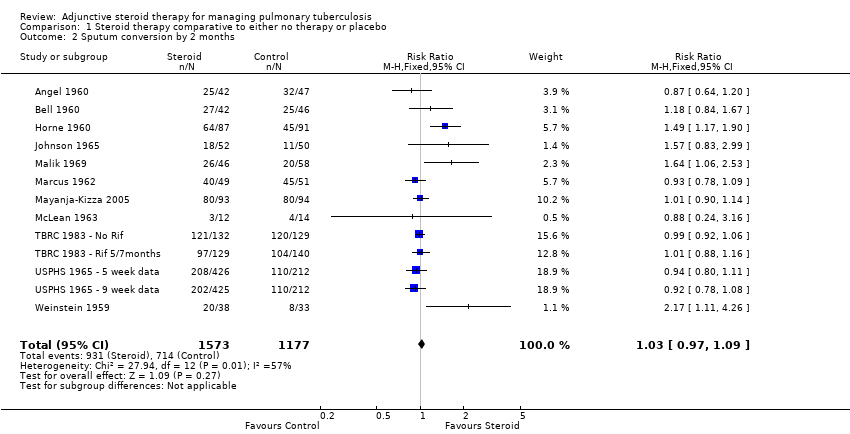
| Angel 1960 | Culture negative; three samples of sputum or gastric washings were sent for culture at start of treatment then at monthly intervals. | Baseline | 0/54 | 0/50 | No significant difference |
| 1 | 7/34 | 12/38 |
| 2 | 25/42 | 32/47 |
| 3 | 29/46 | 39/42 | P < 0.001 significantly greater among controls |
| 4 | 39/45 | 41/45 | No significant difference |
| 5 | 40/44 | 38/40 |
| 6 | 45/47 | 43/46 |
| Bell 1960 | Culture negative; 24 hour specimens of sputum were collected until treatment started, then collected monthly. Concentrates prepared by tri‐sodium phosphate method and incubated for 12 weeks. | Baseline | 0/45 | 0/46 | No significant difference |
| 1 | 16/44 | 11/45 |
| 2 | 27/42 | 25/46 |
| 3 | 31/41 | 35/43 |
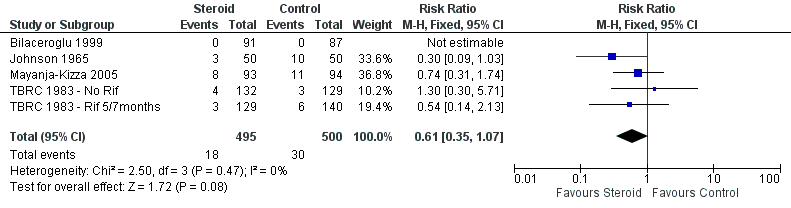
| Bilaceroglu 1999 | Culture conversion rate (Sputum taken twice weekly) | Reported as 'comparable' | P = 0.0794 |
| BTA 1961 | BTA ‐ Corticotrophin data | Culture negative; direct smear and culture exam taken monthly and analysed using local lab facilities | Baseline | 9/111 | 5/118 | Not reported |
| 1 | 36/100 | 31/109 |
| 3 | 70/89 | 77/104 |
| 6 | 86/87 | 91/95 |
| 9 | 67/67 | 74/74 |
| 12 | 40/40 | 39/40 |
| BTA ‐ Prednisone data | Culture negative; direct smear and culture exam taken monthly and analysed using local lab facilities | Baseline | 4/115 | 5/118 |
| 1 | 36/109 | 31/109 |
| 3 | 80/104 | 77/104 |
| 6 | 93/95 | 91/95 |
| 9 | 80/80 | 74/74 |
| 12 | 45/45 | 39/40 |
| Horne 1960 | Culture negative; direct sputum smear, gastric lavage or laryngeal swabs | 1 | 40/87 | 28/91 | No significant difference |
| 2 | 64/87 | 45/91 | P < 0.01 |
| 3 | 67/87 | 62/91 | No significant difference |
| 4 | 75/87 | 75/91 |
| 5 | 80/87 | 82/91 |
| 6 | 86/87 | 91/91 |
| 9 | 75/77 | 80/80 |
| 12 | 77/77 | 80/80 |
| Johnson 1965 | Specimens of sputum were collected every two weeks for four months and then every month thereafter Reversal of infectiousness; the first of three consecutive monthly specimens negative for tubercle bacilli on microscopy and culture | 2 | 18/52 | 11/50 | No significant difference |
| 4 | 30/52 | 31/50 |
| 6 | 38/52 | 37/50 |
| 8 | 46/52 | 42/50 |
| 10 | 49/52 | 44/50 |
| 12 | 48/52 | 46/50 |
| Malik 1969 | Sputum negative; disappearance of sputum in bacilli was monitored for monthly | 1 | 11/46 | 14/58 | No significant difference |
| 2 | 26/46 | 20/58 | P < 0.05 |
| 3 | 28/46 | 28/58 | P < 0.05 |
| 6 | 35/46 | 46/58 | No significant difference |
| Marcus 1962 | Culture negative; specimens of sputum were collected every two weeks until 2 months then at 3 months and 6 months | 1 | 35/49 | 31/51 | Not reported |
| 2 | 40/49 | 45/51 |
| 3 | 45/49 | 45/51 |
| 6 | 48/49 | 48/51 |
| Mayanja‐Kizza 2005 | Culture negative; sputum cultures obtained at month 1 and 2 and examined for AFB | 1 | 58/93 | 35/94 | P = 0.001 |
| 2 | 80/93 | 80/94 | No significant difference |
| McLean 1963 | Smear or sputum negative; Smear or culture of sputum or gastric aspirate | 1 | 0/13 | 0/14 | No significant difference |
| 2 | 3/12 | 4/14 |
| 3 | 5/11 | 8/14 |
| 4 | 8/12 | 11/14 |
| 5 | 8/11 | 13/13 |
| 6 | 9/9 | 10/11 |
| Nemir 1967 | Culture from bronchial aspiration and gastric washings on 3 successive morning on admission; culture positive after therapy | During therapy | 4/58 | 2/59 | Not reported |
| After therapy | 2/58 | 2/59 | Not reported |
| TBRC 1983 | TBRC 1983 ‐ Rif 5/7months | Culture negative; Sputum smears examined by fluorescence microscopy and cultured using a modification of Petroffs method. TB chemotherapeutic with rifampicin for either 5 or 7 months. | 1 | 59/132 | 70/129 | No significant difference |
| 2 | 121/132 | 120/129 |
| 3 | 1284/132 | 123/129 |
| TBRC 1983 ‐ No Rif | Culture negative; Sputum smears examined by fluorescence microscopy and cultured using a modification of Petroffs method.TB chemotherapeutic regimen without rifampicin. | 1 | 46/129 | 36/140 | No significant difference |
| 2 | 97/129 | 104/140 |
| 3 | 116/129 | 123/140 |
| USPHS 1965 ‐ 5 week data | USPHS 1965 | Culture negative | 1 | 121/426 | 101/424 | Not reported |
| 2 | 208/426 | 220/424 | Not reported |
| 3 | 316/426 | 308/424 | Not reported |
| 4 | 365/426 | 342/424 | Not reported |
| 5 | 387/426 | 374/424 | Not reported |
| 6 | 389/426 | 372/424 | Not reported |
| 8 | 410/426 | 392/424 | Not reported |
| USPHS 1965 ‐ 9 week data | Culture negative | 1 | 107/425 | 101/424 | Not reported |
| 2 | 202/425 | 220/424 | Not reported |
| 3 | 263/425 | 308/424 | Not reported |
| 4 | 330/425 | 342/424 | Not reported |
| 5 | 368/425 | 374/424 | Not reported |
| 6 | 395/425 | 372/424 | Not reported |
| 8 | 389/425 | 392/424 | Not reported |
| Weinstein 1959 | Sputum negative; Cumulative sputum conversion | Baseline | 16/38 | 6/33 | Not reported |
| 2 | 20/38 | 8/33 |
| 8 | 33/38 | 25/33 |