Exercise for haemophilia
Abstract
Background
Haemophilia is a bleeding disorder associated with haemorrhaging into joints and muscles. Exercise is often used to aid recovery after bleeds, and to improve joint function in the presence of arthropathy.
Objectives
Our objective was to systematically review the available evidence on the safety and effectiveness of exercise for people with haemophilia.
Search methods
We searched the Cochrane Cystic Fibrosis and Genetic Disorders Group's Coagulopathies Trials Register and electronic databases PubMed, OVID‐Embase, and CINAHL. We hand searched abstracts from congresses of the World Federation of Hemophilia and the European Hematology Association, trial registries and the reference lists of relevant articles.
Date of the last search of the Cochrane Cystic Fibrosis and Genetic Disorders Group's Coagulopathies Trials Register: 14 December 2016.
Selection criteria
Randomized or quasi‐randomized controlled studies comparing any exercise intervention considered relevant in haemophilia management including supervised, unsupervised, aquatic, strengthening, aerobic or cardiovascular, stretching, proprioceptive and balance training exercise programs in males of any age with haemophilia A or B of any severity (those with co‐morbidities were not excluded).
Data collection and analysis
Two authors reviewed the identified abstracts to determine their eligibility. For studies meeting the inclusion criteria, full articles were obtained. The two authors extracted data and assessed the risk of bias. Any disagreements were resolved by discussion. The authors contacted study investigators to obtain any missing data.
Main results
Eight studies were included, which represented 233 males with all severities of haemophilia A and B, ranging in age from eight years to 49 years. Study duration ranged from four to 12 weeks. Exercise interventions varied greatly and included resistance exercises, isometric exercises, bicycle ergometry, treadmill walking and hydrotherapy; therefore, comparison between studies was difficult.
None of the studies measured or reported adverse effects from the interventions. None of the studies reported outcomes regarding bleed frequency, quality of life or aerobic activity. Overall risk of bias across all studies was assessed as unclear.
Very few studies provided sufficient information for comparison. None of the studies reported data that favoured the control group. One study reported that six weeks of resistance training improved joint health status (Colorado score) compared to controls. The addition of pulsed electromagnetic fields also improved ankle scores compared to exercises alone, but this was not seen in the elbows or knees.
Two studies reported statistically significant improvements in pain intensity after exercise interventions compared to controls. Hydrotherapy exercises produced significant decreases in pain compared to controls and land‐based exercise groups.
Two studies found improvement in joint motion in the exercise group compared to controls. One study compared land‐ and water‐based exercises; there was no difference in the range of motion between the two groups; however, the water‐based exercise group did show improvement over the control group.
One study, comparing joint traction and proprioceptive neuromuscular facilitation for the elbow to a control group, showed no differences in biceps girth or strength after 12 weeks of intervention.
Some studies reported comparisons between interventions. In one study, treadmill training significantly improved balance in children compared to bicycle ergometry. Another study added partial weight bearing exercises to quadriceps exercises and showed improved walking tolerance.
Four studies evaluated quadriceps or hamstring strength (or both). The addition of bicycle ergometry and exercises with weights was more effective than static exercises and treadmill walking for strengthening knee flexors and extensors. Partial weight‐bearing exercises through range were more effective than static and short arc exercises for improving knee extensor strength. The addition of treadmill walking to ultrasound, stretching and strengthening exercises showed increased peak torque of knee flexors and extensors and decrease in knee effusion.
The results should be interpreted with caution due to the quality of evidence (GRADE) as outlined in the summary of findings tables, which demonstrates that all but one of the outcomes assessed were rated as low or very low due to the small sample sizes and potential bias.
Authors' conclusions
These results must be considered with caution. There is a lack of confidence in the results due to the small number of included studies and the inability to pool the results due to the heterogeneity of outcome measures. Most exercise interventions produced improvement in one or more of the measured outcomes including pain, range of motion, strength and walking tolerance. Hydrotherapy may be more effective than land exercises for pain relief in adults. Functional exercises such as treadmill walking and partial weight bearing exercises seem to be more effective than static or short arc exercises for improving muscle strength. These findings are consistent with the many non‐controlled intervention reports in the haemophilia literature. No adverse effects were reported as a result of any of the interventions. However, some groups used prophylactic factor prior to exercise and other groups studied only subjects with moderate haemophilia. Therefore, the safety of these techniques for persons with severe haemophilia remains unclear.
PICOs
Plain language summary
Exercise for people with haemophilia
Review question
We reviewed the evidence about the safety and usefulness of exercise for men with haemophilia.
Background
Haemophilia is a group of disorders in which one of the blood clotting proteins does not work properly. It mainly affects men, although women can also be affected. People with haemophilia bleed into their joints and muscles which can lead to painful chronic arthritis.
Exercise is often used during recovery from a joint or muscle bleed and to maintain or improve a person's ability to function and participate in daily activities despite joint damage.
We wanted to know if exercise was safe (that is, exercise does not cause additional bleeding) and whether exercise was able to improve muscle strength, joint mobility, pain, balance, gait, fitness, and overall functioning.
Search date
The evidence is current to: 14 December 2016.
Study characteristics
We included eight studies with 233 male participants with haemophilia A or B (of any severity), aged eight to 49 years. Length of study ranged from four to 12 weeks.
Key results
Several types of exercise programs were studied, including stretching, strengthening with weights, exercise in water, treadmill walking, and exercise bicycle. Some studies compared participants who did one type of exercise with those who did another type of exercise; other studies compared an exercise group with a control group that did no exercise.
There were no data relating to our primary outcomes which indicated whether bleed frequency changed after an exercise program. There were no adverse effects measured or reported. Quality of life was not measured.
Regarding our secondary outcomes, improvements were seen in balance, joint health, and pain. Walking distance was the only functional status measured.
In an unplanned additional analysis, improvements were seen in the range of motion, biceps perimeter; strength, and knee circumference.
These small studies showed more improvements in pain, muscle strength and joint range of motion in exercise groups than in control groups. Studies that included functional activity, such as walking on a treadmill, showed more improvement than exercise alone. Exercise in water seems to be more effective than land exercise in relieving joint pain in adults.
Quality of the evidence
Four studies included only males with moderate haemophilia. Three studies included all severities of haemophilia and in one, participants used clotting factor prior to participating. Two studies included males with both haemophilia A and B; three studies did not specify type. Only one study limited their participants to those with severe haemophilia, and these also had osteoporosis. It is not clear whether the same results would be achieved if only males with severe haemophilia A were studied.
The results should be interpreted with caution due to the quality of the evidence; we judged that all but one of the outcomes assessed were low or very low quality, due to small sample sizes and potential bias.
Authors' conclusions
Summary of findings
| Exercise compared with no intervention for haemophilia | ||||||
| Patient or population: participants with haemophilia Settings: outpatients Intervention: exercise Comparison: no intervention | ||||||
| Outcomes | Illustrative comparative risks* (95% CI) | Relative effect | No of Participants | Quality of the evidence | Comments | |
| Assumed risk | Corresponding risk | |||||
| No intervention | Exercise | |||||
| Adverse events | Outcome not reported | NA | ||||
| Quality of life | Outcome not reported | NA | ||||
| Joint health: Modified Colorado Score Follow up: 6 weeks | See comment | See comment | NA | 25 (1 study) | ⊕⊕⊝⊝ | Statistically significant improvements were demonstrated in the exercise group compared to the no intervention group in the joint health status of the elbows, MD ‐1.21 points (95% CI ‐2.14 to ‐0.28 points), knees, MD ‐3.42 points (95% CI ‐4.82 to ‐2.02 points) and ankles, MD ‐1.65 points (95% CI ‐2.51 to ‐0.79). |
| Pain: reduction of pain intensity by visual analogue scale Follow up: 12 weeks | See comment | See comment | NA | 18 (1 study) | ⊕⊝⊝⊝ | Data were presented as number of joints (n = 30) rather than number of participants so could not be entered into the analysis. There was "observed improvement (P < 0.05)" in pain perception of the elbow in exercise group compared to the no intervention group. |
| Functional Status | Outcome not reported | NA | ||||
| Range of Motion: joint flexion and joint extension Follow up: 12 weeks | See comment | See comment | NA | 18 (1 study) | ⊕⊝⊝⊝ | Data were presented as number of joints (n = 30) rather than number of participants so could not be entered into the analysis. There was "observed improvement (P < 0.05)" in flexion of the elbow in exercise group compared to the no intervention group but no statistically significant difference between treatment groups for joint extension. |
| Strength: bicep strength Follow up: 12 weeks | See comment | See comment | NA | 18 (1 study) | ⊕⊝⊝⊝ | Data were presented as number of joints (n = 30) rather than number of participants so could not be entered into the analysis. There was no statistically significant difference between treatment groups. |
| *The basis for the assumed risk is provided in the comments. The corresponding risk (and its 95% confidence interval) is based on the assumed risk in the comparison group and the relative effect of the intervention (and its 95% CI). | ||||||
| GRADE Working Group grades of evidence | ||||||
| 1. Downgraded once due to potential risk of bias: limited details of study design provided making assessment of study quality difficult; presence of bias cannot be ruled out. 2. Downgraded once due to imprecision: evidence available from only a single study recruiting a small sample of participants. 3. Downgraded once due to applicability: the single study contributing evidence recruits only participants with severe haemophilia; results are not applicable to participants with mild or moderate haemophilia | ||||||
| Exercise A compared with Exercise B for haemophilia | ||||||
| Patient or population: participants with haemophilia Settings: outpatients Intervention: Exercise A Comparison: Exercise B | ||||||
| Outcomes | Illustrative comparative risks* (95% CI) | Relative effect | No of Participants | Quality of the evidence | Comments | |
| Assumed risk | Corresponding risk | |||||
| Exercise B | Exercise A | |||||
| Adverse events | Outcome not reported | |||||
| Quality of life | Outcome not reported | |||||
| Balance: Biodex stability parameters Follow up: 12 weeks | See comment | See comment | NA | 30 (1 study) | ⊕⊝⊝⊝ | Exercise B group (treadmill) significantly improved compared to Exercise A group (bicycle) in terms of overall stability index, MD 0.25 points (95% CI 0.19 to 0.31 points), anterior‐posterior stability index, MD 0.35 points (95% CI 0.27 to 0.43 points) and medio‐lateral stability index, MD 0.24 points (CI 95% 0.17 to 0.31 points). |
| Pain: reduction of pain intensity by visual analogue scale Follow up: 4 weeks | The mean reduction in pain from baseline was 1.7 on the VAS scale in the Exercise B group. | The mean reduction in pain from baseline was 0.8 lower (0.41 to 1.19 lower) on the VAS scale in the Exercise A group. | NA | 27 (1 study) | ⊕⊕⊝⊝ | Exercise A is a land‐based exercise program and Excerise B is an aquatic‐based exercise program. |
| Functional Status: 6MWT (metres) Follow up: 6 weeks | The mean 6MWT was 32 metres in Exercise group B. | The mean 6MWT was 2.6 metres greater (0.08 metres to 5.12 metres greater) in Exercise group A. | NA | 30 (1 study) | ⊕⊝⊝⊝ | Exercise A is a partial weight bearing exercise program plus a quadriceps exercise training program and Exercise B is a quadriceps exercise training program alone. |
| Range of Motion: flexion and extension Follow up: 4 weeks | See comment | See comment | NA | 27 (1 study) | ⊕⊕⊝⊝ | Exercise A is a land‐based exercise program and Excerise B is an aquatic‐based exercise program. No significant difference was demonstrated between the treatment groups; flexion, MD 0.20 degrees (95% CI ‐5.61 to 6.01 degrees) and extension MD ‐0.10 (95% CI ‐1.59 to 1.39). |
| Strength: flexors and extensors Follow up: 12 weeks | See comment | See comment | NA | 90 (3 studies) | ⊕⊕⊕⊝ | Strength outcomes demonstrated a significant improvement for the study groups over the control groups in all outcome measures of strength including knee extensor and flexor strength.4 |
| *The basis for the assumed risk is the mean control group risk or provided in the comments. The corresponding risk (and its 95% confidence interval) is based on the assumed risk in the comparison group and the relative effect of the intervention (and its 95% CI). | ||||||
| GRADE Working Group grades of evidence | ||||||
| 1. Downgraded once due to potential risk of bias: limited details of study design provided making assessment of study quality difficult; presence of bias cannot be ruled out. 2. Downgraded once due to imprecision: evidence available from only a single study recruiting a small sample of participants. 3. Downgraded once due to applicability: the single studies contributing evidence recruit only individuals with mild or moderate haemophilia; results are not applicable to participants with severe haemophilia. 4. Comparisons were partial weight bearing exercise program plus a quadriceps exercise training program (study group) compared to quadriceps exercise training program alone (control group), physical therapy program of stretching, strengthening and aerobic activity (control group) compared to the same program with the addition of bicycle ergometry (study group) and weight resistance and exercise therapy program including ultrasound, stretching and strengthening exercises (control group) compared to the same program plus treadmill training (study group). Also see Table 2 for further details of interventions. | ||||||
| Exercise alone compared with exercise plus electrophysical modality for haemophilia | ||||||
| Patient or population: participants with haemophilia Settings: outpatients Intervention: exercise alone Comparison: exercise plus electrophysical modality | ||||||
| Outcomes | Illustrative comparative risks* (95% CI) | Relative effect | No of Participants | Quality of the evidence | Comments | |
| Assumed risk | Corresponding risk | |||||
| Exercise plus electrophysical modality | Exercise alone | |||||
| Adverse events | Outcome not reported | NA | ||||
| Quality of life | Outcome not reported | NA | ||||
| Pain | Outcome not reported | NA | ||||
| Functional Status | Outcome not reported | NA | ||||
| Joint health: Modified Colorado Score Follow up: 12 weeks | See comment | See comment | NA | 25 (1 study) | ⊕⊝⊝⊝ | A statistically significant improvement was noted in the ankle scores, MD 0.90 points (95% CI 0.07 to 1.73 points) favouring the exercise plus electrophysical modality group over exercise alone group. There was no statistically significant difference between groups in elbow scores, MD 0.35 points (95% CI ‐0.70 to 1.40 points) or knee scores, MD 0.75 points (95% CI ‐0.47 to 1.97 points). |
| *The basis for the assumed risk is provided in the comments. The corresponding risk (and its 95% confidence interval) is based on the assumed risk in the comparison group and the relative effect of the intervention (and its 95% CI). | ||||||
| GRADE Working Group grades of evidence | ||||||
| 1. Downgraded once due to potential risk of bias: limited details of study design provided making assessment of study quality difficult; presence of bias cannot be ruled out. 2. Downgraded once due to imprecision: evidence available from only a single study recruiting a small sample of participants. 3. Downgraded once due to applicability: the single study contributing evidence recruits only participants with severe haemophilia; results are not applicable to participants with mild or moderate haemophilia. | ||||||
| Hydrotherapy compared with no exercise for haemophilia | ||||||
| Patient or population: participants with haemophilia Settings: outpatients Intervention: hydrotherapy Comparison: no exercise | ||||||
| Outcomes | Illustrative comparative risks* (95% CI) | Relative effect | No of Participants | Quality of the evidence | Comments | |
| Assumed risk | Corresponding risk | |||||
| No exercise | Hydrotherapy | |||||
| Adverse events | Outcome not reported | NA | ||||
| Quality of life | Outcome not reported | NA | ||||
| Pain | Outcome not reported | NA | ||||
| Functional status | Outcome not reported | NA | ||||
| Range of motion: flexion and extension Follow up: 8 weeks | See comment | See comment | NA | 20 (1 study) | ⊕⊝⊝⊝ | Data were presented via an analysis of covariance (post intervention scores adjusted for differences in pre intervention scores), so data could not be entered into the analysis. There was a statistically significant improvement in range of motion of the hydrotherapy group over the no exercise group. |
| Strength: knee flexor and extensor strength Follow up: 8 weeks | See comment | See comment | NA | 20 (1 study) | ⊕⊝⊝⊝ | Data were presented via an analysis of covariance (post intervention scores adjusted for differences in pre intervention scores), so data could not be entered into analysis. There was a statistically significant improvement in both knee flexor and extensor strength of the hydrotherapy group over the no exercise group. |
| *The basis for the assumed risk is provided in the comments. The corresponding risk (and its 95% confidence interval) is based on the assumed risk in the comparison group and the relative effect of the intervention (and its 95% CI). | ||||||
| GRADE Working Group grades of evidence | ||||||
| 1. Downgraded once due to potential risk of bias: limited details of study design provided making assessment of study quality difficult and suspected selective reporting bias and post‐intervention scores are not presented. 2. Downgraded once due to imprecision: evidence available from only a single study recruiting a small sample of participants. 3. Downgraded once due to applicability: the single study contributing evidence recruits only participants with moderate haemophilia; results are not applicable to participants with mild or severe haemophilia. | ||||||
Background
Description of the condition
Haemophilia is a congenital condition in which blood cannot clot due to the absence or deficiency of a clotting factor protein. The two most common types are haemophilia A (factor VIII deficiency) and haemophilia B (factor IX deficiency or Christmas disease) (WFH 2012). Haemophilia has an estimated frequency of approximately one per 10,000 births and there are approximately 400,000 people with haemophilia worldwide. Haemophilia A is more common than haemophilia B, representing 80% to 85% of the total haemophilia population (WFH 2012).
The frequency and severity of bleeding in haemophilia generally correlates to the clotting factor level, as measured by lab assay. People with severe haemophilia have clotting factor levels of less than 1% of normal and experience bleeding into joints and muscles, often in the absence of an identifiable haemostatic challenge, whereas individuals with mild haemophilia (levels of 5% to 40%) have severe bleeding only after major trauma or surgery (WFH 2012).
Haemophilia is caused by an inherited X‐linked recessive trait. Males with the defective X chromosome are affected; females are carriers and may also exhibit signs of coagulopathy. Each child of a carrier has a 50% chance of inheriting the defective gene. In approximately one third of new cases, there is no family history, and the condition arises due to a spontaneous genetic mutation in either the mother or the son (WFH 2012).
Internal and prolonged bleeding are the main symptoms of haemophilia, and haemorrhagic episodes can occur anywhere in the body. For both haemophilia A and B, haemarthrosis accounts for 70% to 80% of all bleeding episodes; muscle bleeds account for 10% to 20% of bleeding episodes. Although any joint may be affected, hinge joints, particularly the ankles, knees and elbows, are the most frequently affected (WFH 2012).
Bleeding occurs from the small vessels in the synovial membrane. If the bleeding continues, the joint capsule becomes distended. This is accompanied by pain, loss of range of motion, muscle spasm or muscle inhibition, and loss of joint proprioception. An acute inflammatory response follows, and the blood is removed by synoviocytes. Articular cartilage is damaged directly by the blood as well as by the inflammatory enzymes (Rodriquez‐Merchan 2012; Roosendaal 2008).
Repeated haemarthroses are common and, in the absence of adequate clotting factor replacement, frequently occur before the previous haemarthrosis has resolved. This creates a vicious cycle of bleed‐inflammation‐re‐bleed, known as a target joint. The synovium is in a chronic state of inflammation, and becomes hypervascularized, hypertrophied and villous (De La Corte‐Rodriquez 2013).
Recurrent hemarthroses eventually lead to epiphyseal changes and cartilage destruction with joint space narrowing, subchondral cysts, osteophyte formation, and incongruence of joint surfaces (Pettersson 1980).
Joint disease affects 90% of people with severe haemophilia and contributes the greatest cost and morbidity in the haemophilia population (Manco‐Johnson 2004).
Muscle bleeds can occur in any muscle of the body, and usually result from a direct blow or a sudden stretch. Muscle bleeds are associated with pain, swelling, and loss of function. Bleeds into deep muscular compartments may result in neurovascular compromise, a serious complication. The deep flexor muscle groups, such as iliopsoas, forearm flexors and toe flexors are particularly at risk of developing compartment syndromes (Beyer 2010; WFH 2012).
Recurrent haemarthrosis and muscular bleedings have serious consequences on the musculoskeletal system and the functional health status and quality of life of individuals (Rodriguez‐Merchan 2010).
Description of the intervention
For the purpose of this review, exercise will refer to a diverse set of interventions prescribed or planned by a health professional that includes conducting specific activities, postures or movements. Examples of such interventions are aerobic exercise, strengthening of specific muscles or groups of muscles, joint mobility and stretching exercises, and exercises designed to improve balance and proprioception, including exercise in water (Blamey 2010; Gomis 2009).
How the intervention might work
Exercise programs for people with haemophilia are usually designed and implemented to help manage the recovery after a hemarthrosis or a muscle bleed, to maintain or improve function in the presence of chronic arthropathy, or as a tool to help prevent frequent bleeding episodes.
The aims of exercise that are considered to be important for people with haemophilia are to (Gomis 2009; Iorio 2010; Negrier 2013):
-
promote normal neuromuscular development;
-
preserve or restore joint range of motion (ROM) and muscular flexibility;
-
increase muscular strength and endurance;
-
maintain or improve co‐ordination and balance;
-
maintain a healthy body weight thus decreasing stress on joints;
-
promote development and maintenance of good bone density;
-
improve aerobic conditioning;
-
improve function and participation, and thus improve quality of life;
-
reduce health risks associated with a sedentary lifestyle.
Why it is important to do this review
Over the past 50 years, the medical treatment for people with haemophilia has evolved from transfusions of whole blood to the use of fractionated blood products and to the use of recombinant technology. The availability and safety of coagulation factor products has allowed a philosophical change in medical care that previously limited activities and exercise for people with haemophilia because of concerns about the induction of bleeding (Gomis 2009; Riske 2007).
Since therapeutic exercise is an important component of the management of other forms of arthropathy (e.g. osteoarthritis, rheumatoid arthritis), it would appear logical that exercise would be effective for people with haemophilia (Hunter 2009; Stenstrom 2003).
Thus, this review will seek to evaluate the safety and effectiveness of exercise in preventing bleeding episodes, maintaining and restoring joint and muscle function, and in maintaining the ability of the individual with haemophilia to participate in society.
Objectives
To systematically assess the available evidence on the safety and effectiveness of exercise interventions for people with haemophilia.
Methods
Criteria for considering studies for this review
Types of studies
Randomized or quasi‐randomized controlled studies.
Types of participants
Males of any age diagnosed with haemophilia A or B of any severity (severe, moderate or mild). Males with inhibitors or other co‐morbidities were not excluded.
Types of interventions
For the purpose of this review, exercise will encompass "a diverse set of interventions prescribed or planned by a health professional that included conducting specific activities, postures or movements" (Blamey 2010). Any exercise intervention considered relevant to the management of haemophilia was included, such as aerobic exercise, strengthening of specific muscles, joint mobility and muscle stretching exercises, exercises designed to improve balance and proprioception, weight‐bearing exercises, and exercise in water (hydrotherapy).
Types of outcome measures
Primary outcomes
-
Bleed frequency (number of major bleeds reported per year, month, or week)
-
Adverse events (e.g. bleed following exercise, worsening of symptoms)
-
Quality of life (e.g. assessed through self‐administered questionnaires such as the 'Hemo‐QOL and SF‐36')
Secondary outcomes
-
Balance or proprioception (or both)
-
Aerobic activity
-
Joint health status measured via a validated outcome measure
-
Pain
-
Functional status
A post hoc analysis resulted in the addition of the following clinically relevant outcomes to the analysis. These outcomes were deemed important to healthcare providers and consumers as primary impairments that are assessed by musculoskeletal specialists and that may be impacted by an exercise intervention.
-
Range of motion
-
Biceps perimeter
-
Strength
-
Knee circumference
Search methods for identification of studies
There were no language or publication restrictions. Abstracts and full articles were included.
Electronic searches
We searched for relevant studies from the Cystic Fibrosis and Genetic Disorders Group's Coagulopathies Trials Register using the terms: haemophilia* AND exercise.
The Coagulopathies Trials Register is compiled from electronic searches of the Cochrane Central Register of Controlled Trials (CENTRAL) (updated each new issue of The Cochrane Library) and quarterly searches of MEDLINE and the prospective handsearching of one journal ‐ Haemophilia. Unpublished work is identified by searching the abstract books of major conferences: the European Haematology Association conference; the American Society of Hematology conference; the British Society for Haematology Annual Scientific Meeting; and the Congress of the World Federation of Hemophilia. For full details of all searching activities for the register, please see the relevant section of the Cochrane Cystic Fibrosis and Genetic Disorders Group's website.
Date of the most recent search of the Cochrane Cystic Fibrosis and Genetic Disorders Group's Coagulopathies Trials Register: 14 December 2016.
We performed additional searches on:
-
PubMed (www.ncbi.nlm.nih.gov/pubmed) (searched from conception to 25 November 2014);
-
Embase (Ovid) (searched from conception to 25 November 2014);
-
CINAHL (EBSCO) (searched from conception to 30 April 2014).
We searched ClinicalTrials.gov (www.clinicaltrials.gov/); the International Clinical Trials Registry Platform (http://apps.who.int/trialsearch/); and the EU Clinical Trials Register (www.clinicaltrialsregister.eu). Date of most recent search of trials registers: 01 December 2014.
For full search strategies please refer to the appendices (Appendix 1).
Unpublished work was identified by the authors by searching the (online) abstract books of the following major conferences.
-
European Haematology Association conference (2002 to 2013)
-
American Society of Hematology conference (2006 to 2013)
-
British Society for Haematology Annual Scientific Meeting (2007 to 2014)
-
Congress of the World Federation of Hemophilia (1996 to 2014)
-
Musculoskeletal Congresses of World Federation of Hemophilia (2005 to 2013)
For further details please refer to the appendices (Appendix 2).
Searching other resources
In addition, we searched the reference lists of all publications found by the above methods for any other potentially relevant studies.
Data collection and analysis
Selection of studies
Two authors (KS and KM) independently checked the titles and abstracts of the studies identified from the searches. We obtained the full text of all studies of possible relevance for assessment. We decided which studies fulfilled the inclusion criteria and resolved any disagreement by discussion. We also contacted study authors for clarification where necessary. Each of these two authors assessed studies published in languages other than English and included them in the review when feasible using English language abstracts, translation tools and services, or review by co‐authors and colleagues familiar with the language of publication.
Data extraction and management
Two authors (KS and KM) independently extracted data from the included studies using forms provided by the Cochrane Cystic Fibrosis and Genetic Disorders Group.
We extracted population characteristics (patient population, source and setting, study inclusion criteria, symptom characteristics, severity, mean age, prophylaxis), intervention characteristics (description and types of exercise, duration and number of treatment sessions, intervention delivery type and co‐interventions), comparison characteristics and outcome data. We extracted results for primary and secondary outcomes as change scores or final value scores for inclusion in the meta‐analyses. We assessed the clinical relevance of each study with four items: participants described in detail to assess clinical comparability; interventions and treatment settings adequately described to allow repetition; clinically relevant outcomes measured and reported; and whether the likely treatment benefits are worth the potential harms. We also extracted data on adverse events, if reported, from each paper.
When information regarding any of the above was unclear, we contacted the study authors for further details. We entered the data into the Review Manager software and pooled where appropriate (RevMan 2014).
Assessment of risk of bias in included studies
The two authors assessed the risk of bias of each included study using Cochrane's risk of bias assessment tool (Higgins 2011a).
We assessed the following domains as having either a low, unclear or high risk of bias.
-
Randomization ('low risk': randomization list generated using a computer, random number table, or similar methods; 'unclear risk': described as randomized, but no details given; 'high risk': non‐random approach, e.g. alternation, use of case record numbers, dates of birth or day of the week).
-
Concealment of allocation ('low risk': list from a central independent unit, on‐site locked computer, identically appearing treatment; 'unclear risk': not described; 'high risk': if allocation sequence was known to, or could be deciphered by the investigators who assigned participants or if an open allocation schedule was used.
-
Blinding ('low risk': if participants, investigators and outcome assessors were blinded, or if any of these were not blinded but outcome assessment was judged not to influence the outcome; 'unclear risk': if this issue was not discussed; 'high risk': if none of the parties involved in the study were blinded).
-
Incomplete outcome data ('low risk': if any withdrawals were described in full and were equal across groups; 'unclear risk': if insufficient information was given; 'high risk': if the missing data were likely to be directly related to the outcome or if they were uneven across groups).
-
Selective outcome reporting.
-
Other potential sources of bias.
Measures of treatment effect
Two authors (KS and KM) analysed the continuous outcomes by calculating the mean difference (MD) and the corresponding 95% confidence intervals (CI). For future updates, we will calculate the standardised mean difference (SMD) and corresponding 95% CIs if different scales of measurement have been used. Variation on measurement was reported as positive or negative providing information about effect. For example, a reduction in pain as measured by the visual analog scale (VAS) was reported as a negative effect as lower numbers on the VAS indicate improvement. Similarly, an improvement in range of motion (flexion) was reported as positive effect as higher numbers indicate improvement. For future updates, we will calculate the risk ratio (RR) and 95% CIs for dichotomous outcomes and for categorical data the results will be presented as a RR with 95% CI.
Since none of the included studies reported measures of intra‐subject variability (e.g. within‐group correlation co‐efficients for the post versus baseline measures) we were unable to account for it in assessing variability of the variation over time. We measured the effect across randomization by comparing within‐group differences, for which we calculated variability assuming independence. This likely led to a conservative approach (missing an effect where the effect was there, but not claiming a spurious effect when this was not true), which we considered an acceptable limitation. We will try to gather data from the study authors in order to properly update the calculation and publish an update if successful.
Unit of analysis issues
Cluster‐randomized studies
If, for future updates, we identify cluster‐randomized studies, we will include these in the analyses along with individually randomized studies. In an attempt to account for any unit of analysis error, we will use the methods described in the Cochrane Handbook for Systematic Reviews of Interventions using an estimate of the intra‐cluster correlation co‐efficient (ICC) derived from the study (if possible), from a similar (in design) study or from a study of a similar population (Higgins 2011b). If we use ICCs from other sources, we will report them and conduct sensitivity analyses to investigate the effect of variation in the ICC. If we identify both cluster‐randomized studies and individually‐randomized studies, we plan to pool the relevant information. If there is little heterogeneity between the study designs and the interaction between the effect of intervention and the choice of randomization unit is considered to be unlikely, we will consider it reasonable to combine the results from both. If appropriate, we will also acknowledge heterogeneity in the randomization unit and perform a sensitivity or subgroup analysis to investigate the effects of the randomization unit.
Cross‐over studies
No cross‐over studies were identified in the literature search and therefore were not included in the review. Given that an effective washout period is almost impossible to achieve with an exercise program, in future versions of the review, if we identify cross‐over studies, we will only analyse first‐arm data (collected prior to the cross‐over of the intervention).
In the first instance, we extracted outcome data with the unit of analysis being the participant (i.e. number of participants). However, for one study, 18 participants (nine in the intervention and nine in the control group) the results were reported at the unit of analysis of joints only (16 elbows included in the intervention group and 14 elbows included in the control group) (Cuesta‐Barriuso 2013). No data reported using different units of analysis were pooled and the difference in unit of analysis must be considered when interpreting the results.
Dealing with missing data
We reported the numbers and reasons for dropouts and withdrawals in all intervention groups, if described, and also reported if the papers specified that there were no dropouts or withdrawals. We contacted the original Investigators for clarification on any missing information.
In the event that we were unable to contact the original authors or they were unable to supply missing data, we imputed missing variance scores using the mean variance from studies with similar populations. If data were reported as a median and interquartile range (IQR), we used the median to estimate the mean for studies with moderate to large sample sizes (n > 25); for studies with small sample sizes, we used the formula proposed by Hozo (Hozo 2005). When appropriate we calculated the standard deviation (SD) with the width of the IQR equivalent to 1.35 times the SD (Higgins 2002). In studies where a range was presented along with the median instead of an IQR, we estimated the SD to be one quarter of the range (Higgins 2011c).
For included studies, we noted levels of attrition. For all outcomes, we carried out analyses, as far as possible, on an intention‐to‐treat basis, i.e. we attempted to include all participants randomized to each group in the analyses, and analysed all participants in the group to which they were allocated, and regardless of whether or not they received the allocated intervention. We analysed missing data using the Review Manager software (RevMan 2014).
Assessment of heterogeneity
We assessed heterogeneity between studies by inspecting the forest plots and using the Chi² test and I² statistic for heterogeneity with a statistical significance level of P < 0.10 and an interpretation of I² as follows:
• 0% to 40%: might not be important;
• 30% to 60%: may represent moderate heterogeneity;
• 50% to 90%: may represent substantial heterogeneity;
• 75% to 100%: considerable heterogeneity.
Assessment of reporting biases
For study protocols that were available, we compared these to the published reports. For primary outcomes, we were planning on investigating any potential reporting biases using a funnel plot; however, a sufficient number of studies were not available (Begg 1994). We performed comprehensive searches to locate all randomized controlled studies and also sought out all relevant unpublished studies to minimize reporting bias.
Data synthesis
Two authors (KS and KM) performed statistical analysis in accordance with Cochrane guidelines (Deeks 2011) using the Review Manager software (RevMan 2014). If there was no substantial heterogeneity (less than 50%) we used the fixed‐effect model. In the presence of at least moderate heterogeneity (over 50%) we used the random‐effects model and sensitivity analyses as described below to investigate the source of heterogeneity. We planned to analyse the different interventions separately and planned to group outcome data as follows: four weeks to three months; three months to six months; and longer than six months; however, we did not obtain sufficient data from the included studies.
Subgroup analysis and investigation of heterogeneity
We intended to undertake the following subgroup analyses:
-
exercise versus other interventions (including no intervention);
-
comparison of various modes of exercise in the prophylaxis group;
-
comparison of various modes of exercise in the on‐demand group;
-
long‐term and short‐term effects of exercise on patients with haemophilia.
We did not find sufficient data to perform the pre‐planned subgroup analysis.
Sensitivity analysis
If there are sufficient comparable studies, i.e. 10 or more, in future updates we will perform sensitivity analyses excluding studies with clearly inadequate allocation of concealment, randomization, blinding or incomplete outcome data (high risk of bias). As reported above, in reference to cluster randomized studies, if we use ICCs from other sources we will conduct sensitivity analyses to investigate the effect of variation in the ICC.
Summary of findings and quality of the evidence (GRADE)
In a post hoc change from the protocol, we have presented a summary of findings table for each comparison in the review (summary of findings Table for the main comparison; summary of findings Table 2; summary of findings Table 3; summary of findings Table 4).
-
Exercise compared to no intervention
-
Exercise A compared to Exercise B
-
Exercise alone compared to exercise plus electrophysical modality
-
Hydrotherapy compared to no exercise
The following outcomes were reported in all tables (chosen based on relevance to clinicians and consumers): quality of life; adverse events; functional status; and the following outcomes were reported in at least one table (again chosen based on clinical relevance to the comparison): pain; joint health; range of motion; strength; and balance.
We determined the quality of the evidence using the GRADE approach; and downgraded evidence in the presence of a high risk of bias in at least one study, indirectness of the evidence, unexplained heterogeneity or inconsistency, imprecision of results, high probability of publication bias. We downgraded evidence by one level if we considered the limitation to be serious and by two levels if very serious.
For clarity in the tables, where outcomes were presented using different measures (e.g. balance) or different domains (e.g. joint health according to modified Colorado score), a general statement is made in the table regarding the summary of findings for these outcomes and the evidence is graded based on all of the measures or subdomains combined.
Results
Description of studies
See: Characteristics of included studies; Characteristics of excluded studies.
Results of the search
Database searches (PubMed, CINAHL and Embase) and searches of the Group's Coagulopathies Trials Register yielded 231 references. A search of a clinical trials registries identified one study. Handsearches of conference proceedings from the World and Musculoskeletal Congresses of the World Federation of Hemophilia identified 77 references. Searches of European, British and American Hematology meetings did not yield any results. A total of 22 additional references were identified from reference lists, for a total of 328 references.
After duplicates were removed, 250 potential references remained. Of these, 129 described patient education strategies, gait analysis, population characteristics, measures of participation in activity, and laboratory training 'exercises'.
The remaining 121 described some type of exercise intervention, but most were single case studies or had no control group. A total of 75 of these references described clinical studies; however, after inspection, only 18 studies (22 references) were relevant. These were assessed by both authors for eligibility: after full text review, eight studies were deemed eligible for the review, seven studies were excluded and three are awaiting assessment.
See figure 1 'Study Flow Diagram' (Figure 1).

Study flow diagram.
Included studies
Eight studies met the inclusion criteria. The number of participants per study were ranged from 18 to 48, comprising a total of 233 males (Abd‐Elmonem 2014; Cuesta‐Barriuso 2013; Eid 2014; Kargarfard 2013; Mazloum 2014; Mohamed 2015; Parhampour 2014; Zaky 2013). Note: there were an additional 13 participants in the Mazloum study but these related to a third non‐randomized arm and have not been included in this review.
Design
All studies were randomized or quasi‐randomized with control groups.
Sample sizes
Samples sizes ranged from 18 to 48 participants (four studies each had 30 participants, with the remaining four having 18, 20, 40 and 48 participants.
Location
All studies were conducted in a physical therapy clinic at either a university or a large hospital. Four studies were conducted at the University of Cairo (Abd‐Elmonem 2014; Eid 2014; Zaky 2013; Mohamed 2015), three in Iran (Kargarfard 2013; Mazloum 2014; Parhampour 2014), and one in Spain (Cuesta‐Barriuso 2013).
Participants
Five studies selected participants with haemophilia A (Abd‐Elmonem 2014; Cuesta‐Barriuso 2013; Eid 2014; Mazloum 2014; Parhampour 2014) and two of these also included participants with haemophilia B (Abd‐Elmonem 2014; Cuesta‐Barriuso 2013). Three authors did not specify type of haemophilia (Kargarfard 2013; Mohamed 2015; Zaky 2013). The participants in four studies had moderate haemophilia (Abd‐Elmonem 2014; Eid 2014; Kargarfard 2013; Zaky 2013). Two studies included participants with all severities (Mazloum 2014; Mohamed 2015) and one study combined participants with mild and severe haemophilia (Cuesta‐Barriuso 2013). One study selected participants with severe haemophilia and osteoporosis (Parhampour 2014). Four studies included only children (aged eight years to 14 years) (Abd‐Elmonem 2014; Eid 2014; Mohamed 2015; Zaky 2013) while the other four included adults aged 20 years to 49 years (Cuesta‐Barriuso 2013; Kargarfard 2013; Mazloum 2014; Parhampour 2014). Participants in two studies infused factor prior to participation in the exercise programs (Mazloum 2014; Parhampour 2014).
Interventions
Study periods ranged from four to 12 weeks. Interventions included: exercises in water (Kargarfard 2013); land‐based exercises including resisted exercises with weights (Eid 2014; Mazloum 2014; Parhampour 2014); static exercises (Abd‐Elmonem 2014; Zaky 2013); stretching exercises (Abd‐Elmonem 2014; Eid 2014); bicycle ergometry (Eid 2014; Mohamed 2015); treadmill walking (Abd‐Elmonem 2014); partial weight‐bearing (Zaky 2013); and proprioceptive neuromuscular facilitation (PNF) techniques (Cuesta‐Barriuso 2013). Other non‐exercise interventions included: ultrasound (Abd‐Elmonem 2014); pulsed electromagnetic fields (Parhampour 2014); and joint traction (Cuesta‐Barriuso 2013).
Outcomes
Primary outcomes
-
Bleed frequency (number of major bleeds reported per year, month, or week) ‐ not measured
-
Adverse events (e.g. bleed following exercise, worsening of symptoms) ‐ not measured
-
Quality of life ‐ not measured
Secondary outcomes
-
Balance or proprioception (or both): Biodex stability system (Mohamed 2015)
-
Aerobic activity ‐ not measured
-
Joint health status measured via a validated outcome measure: Modified Colorado Score (Parhampour 2014)
-
Pain (visual analog scale (VAS)) (Cuesta‐Barriuso 2013; Mazloum 2014)
-
Functional status: Six Minute Walk test (Eid 2014)
-
Range of motion (Kargarfard 2013; Mazloum 2014)
-
Biceps perimeter (Cuesta‐Barriuso 2013)
-
Strength: peak torque using Biodex Isokinetic Dynamometer (Abd‐Elmonem 2014; Eid 2014; Kargarfard 2013) and Lafayette Manual Muscle Test (Zaky 2013)
-
Knee circumference (Abd‐Elmonem 2014)
See also: ‘Characteristics of included studies’ table
Excluded studies
See: 'Characteristics of Excluded Studies' table (Characteristics of excluded studies).
We excluded seven studies; four studies had no control group (Greene 1983; Khriesat 2000; Mulvany 2010; Vallejo 2010) and the remaining three had control groups but participants were not randomized (Czepa 2013; Hilberg 2003; Von Mackensen 2012).
Studies awaiting classification
Three additional studies are awaiting classification and will be assessed for possible inclusion in the next update (Cuesta‐Barriuso 2014; Cuesta‐Barriuso 2015; Firoozabadi 2012). Further details are provided in the tables (Studies awaiting classification).
Risk of bias in included studies
We assessed the included studies for general risk of bias and overall, we assessed these as having a low risk of bias for some aspects and unclear for others. The authors' judgements of risk of bias for each study are outlined in each of the studies risk of bias tables and are summarized in the risk of bias summary tables (Figure 2; Figure 3).

Risk of bias graph: review authors' judgements about each risk of bias item presented as percentages across all included studies.

Risk of bias summary: review authors' judgements about each risk of bias item for each included study.
Allocation
Sequence generation
We assessed two studies as having a low risk of bias for random sequence generation as one used a random draw of closed envelopes (Mohamed 2015) and the other used computerized blocks indicating group allocation (Parhampour 2014). We assessed six studies as having an unclear risk of bias as the method of sequence generation was not described (Abd‐Elmonem 2014; Cuesta‐Barriuso 2013; Eid 2014; Kargarfard 2013; Mazloum 2014; Zaky 2013). One study did report that participants were selected using "accessible sampling method" (Kargarfard 2013).
Allocation concealment
Two studies received a rating of low risk of selection bias (Mohamed 2015; Parhampour 2014). Allocation was concealed in one study by using "closed envelopes" (Mohamed 2015) and in another by computer block randomization carried out by an independent person not involved in the research team or project (Parhampour 2014). For six studies the method of concealment was not stated and these were judged to have an unclear risk of bias (Abd‐Elmonem 2014; Cuesta‐Barriuso 2013; Eid 2014; Kargarfard 2013; Mazloum 2014; Zaky 2013).
Blinding
In all eight included studies, blinding of the participants was not possible. Blinding of study personnel was demonstrated in only one study (Cuesta‐Barriuso 2013). Specifically "blinded evaluators" assessed outcomes at all time points and this study was rated to have a low risk of detection bias (Cuesta‐Barriuso 2013). Overall, the risk of blinding was unclear in seven studies as insufficient information was given as to the extent to which the unblinded assessment may have affected outcomes (Abd‐Elmonem 2014; Eid 2014; Kargarfard 2013; Mazloum 2014; Mohamed 2015; Parhampour 2014; Zaky 2013).
Incomplete outcome data
One study received a rating of low risk of attrition bias as the study reported the number, reason for the dropouts and from which treatment group the dropouts were from (Parhampour 2014). Overall, the proportion of dropouts in the study population was 10% (n = 5) for the Parhampour study (three from the resistance training group and two from the resistance training with pulsed electromagnetic fields group) (Parhampour 2014). The Mazloum study did indicate the number of dropouts and the reason for withdrawing from the study, but did not report from which intervention group the dropouts occurred, therefore, this was classified as having an unclear risk of bias for this domain (Mazloum 2014). The remaining six studies received an unclear rating as none indicated any dropouts nor did the authors directly state that all participants completed the study (Abd‐Elmonem 2014; Cuesta‐Barriuso 2013; Eid 2014; Kargarfard 2013; Mohamed 2015; Zaky 2013).
Selective reporting
Seven studies were determined to have an unclear risk of selective reporting bias. One study was deemed to have a high risk of selective reporting bias as reference is made to administration of a questionnaire post‐treatment but results were not reported (Kargarfard 2013).
Other potential sources of bias
We rated all eight included studies as having a low risk of other potential sources of bias.
Effects of interventions
See: Summary of findings for the main comparison Summary of findings ‐ Exercise compared with no intervention; Summary of findings 2 Summary of findings ‐ Exercise A compared with Exercise B; Summary of findings 3 Summary of findings ‐ Exercise alone compared with exercise plus electrophysical modality; Summary of findings 4 Summary of findings ‐ Hydrotherapy compared with no exercise
A total of eight studies have been included in the analysis.
Exercise versus no intervention
Two studies were included in this comparison (Cuesta‐Barriuso 2013; Parhampour 2014). Cuesta‐Barriuso included 18 participants with 16 elbows as the unit of analysis and Parhampour included 25 participants (13 in the exercise group and 12 in the control group) (Cuesta‐Barriuso 2013; Parhampour 2014).
Primary outcomes
1. Bleed frequency
Neither included study reported bleed frequency before or after the interventions.
2. Adverse events
Neither included study reported adverse events related to the study interventions.
3. Quality of life
Neither included study reported quality of life.
Secondary outcomes
1. Balance or proprioception (or both)
Neither included study reported on balance or proprioception.
2. Aerobic activity
Neither included study reported aerobic activity as a result of the interventions.
3. Joint health status
One study used the 'Modified Colorado Score' to assess status of elbows, knees and ankles in 25 participants (Parhampour 2014).
Interventions consisted of a six‐week study of resistance training (n = 13) compared to the control group (no intervention) (n = 12).
A positive effect using the 'Modified Colorado Questionnaire' is reported as a reduction in score. Statistically significant improvements were demonstrated in the resistance training group as compared to the control in measures of joint health status of the elbows, MD ‐1.21 points (95% CI ‐2.14 to ‐0.28 points), knees, MD ‐3.42 points (95% CI ‐4.82 to ‐2.02 points) and ankles, MD ‐1.65 points (95% CI ‐2.51 to ‐0.79) (Analysis 1.1) (Parhampour 2014).
4. Pain intensity
Pain intensity was measured using a visual analog scale with an improvement in pain reported as a decreased in VAS score.
The Cuesta‐Barriuso study (n = 18 ‐ but data relate to 30 joints (16 in exercise group and 14 in the control group)), reported the effects of exercise as compared to no intervention on pain intensity after 12 weeks of treatment (Cuesta‐Barriuso 2013). The study compared an exercise intervention which consisted of proprioceptive neuromuscular facilitation of the elbow joint (combined with joint traction) versus no exercise. We are unable to enter the data into the 'Data and analyses' section, given the unit of analysis issue (data on number of elbows available, not the number of participants) but the abstract described an "observed improvement (P < 0.05) on the .... pain perception of elbow" favouring the exercise group (Cuesta‐Barriuso 2013). The data reported in the abstract for the perception of elbow pain (VAS) are presented in an additional table (Table 1) (Cuesta‐Barriuso 2013).
| Outcome | Assessment | Exercise group: mean (SD) (n = 9 participants, 16 elbows) | Control group: mean (SD) (n = 9 participants, 14 elbows) |
| Flexion | Pre‐treatment: Post‐treatment (12 weeks): | 136.130 (14.818) 140.310 (11.247) | 138.000 (19.958) 138.430 (18.475) |
| Extension | Pre‐treatment: Post‐treatment (12 weeks): | 10.870 (14.207) 11.880 (14.917) | 8.640 (15.310) 8.290 (15.364) |
| Pain (VAS) | Pre‐treatment: Post‐treatment (12 weeks): | 0.719 (0.752) 0.344 (0.436) | 0.143 (0.305) 0.071 (0.267) |
| Biceps perimeter | Pre‐treatment: Post‐treatment (12 weeks): | 31.331 (3.474) 31.725 (3.205) | 32.007 (3.837) 31.857 (3.566) |
| Bicep strength | Pre‐treatment: Post‐treatment (12 weeks): | 0.094 (0.272) 0.000 (0.000) | 0.143 (0.363) 0.071 (0.181) |
Number of participants in each group = 9. Data relate to 16 elbows in the exercise group and 14 in the control group.
VAS: visual analog scale
5. Functional status
Neither included study reported on functional status as a result of the interventions.
6. Range of motion
Joint flexion
The Cuesta‐Barriuso study (n = 18 ‐ but data relate to 30 joints (16 in exercise group and 14 in the control group)) reported on this outcome. The exercise intervention consisted of joint traction and proprioceptive neuromuscular facilitation of the elbow joint and reported the effects of exercise (n = 9) as compared to no intervention (control, n = 9) on range of motion or joint flexion. We are unable to enter the data into the 'Data and analyses' section, given the unit of analysis issue (data on number of elbows available, not the number of participants) but it was reported in the abstract that there was an "observed improvement (P < 0.05) on the .... flexion of elbow". The data reported in the abstract are presented in an additional table (Table 1) (Cuesta‐Barriuso 2013).
Joint extension
The Cuesta‐Barriuso study also reported on the effects of exercise as compared to no intervention on range of motion or joint extension after 12 weeks of treatment (Cuesta‐Barriuso 2013). We are unable to enter the data into RevMan given the unit of analysis issue (data on number of elbows available, not the number of participants). The data reported in the abstract are presented in an additional table (Table 1) (Cuesta‐Barriuso 2013).
7. Biceps perimeter
The Cuesta‐Barriuso study (n = 18 participants with 30 elbows as the unit of analysis) reported the effectiveness of joint traction and proprioceptive neuromuscular facilitation (n = 16 elbows) as compared to no intervention (control, n = 14 elbows) on the perimeter of the biceps muscle following a 12‐week intervention period (Cuesta‐Barriuso 2013). We are unable to enter the data into the 'Data and analyses' section, given the unit of analysis issue (data on number of elbows available, not the number of participants). The data reported in the abstract are presented in an additional table (Table 1) (Cuesta‐Barriuso 2013).
8. Strength
One study (n = 18 participants with 30 elbows as the unit of analysis) compared joint traction and proprioceptive neuromuscular facilitation (n = 16 elbows) to no intervention (control, n = 14 elbows) to investigate the effects on biceps strength (Cuesta‐Barriuso 2013). We are unable to enter the data into the 'Data and analyses' section, given the unit of analysis issue (data on number of elbows available, not the number of participants). The data reported in the abstract are presented in an additional table (Table 1) (Cuesta‐Barriuso 2013).
9. Knee circumference
Neither included study reported on knee joint circumference as a result of the interventions.
Exercise A versus Exercise B
Five studies (n = 147) were included in this comparison (Abd‐Elmonem 2014; Eid 2014; Mazloum 2014; Mohamed 2015; Zaky 2013).
Three studies used a standardized exercise program for both groups ("Exercise A") then added additional exercises for one of the groups ("Exercise B") (Abd‐Elmonem 2014; Eid 2014; Zaky 2013).
Two studies used a different exercise program for each group (Mazloum 2014; Mohamed 2015).
The components of all of the exercise programs and the differences between the groups are summarized in an additional table (Table 2).
| Author | "Exercise A" | "Exercise B" |
| Ultrasound, stretching, strengthening 5 days per week | Exercise A plus treadmill training | |
| Stretching, static exercises, treadmill | Exercise A plus bicycle ergometer and resisted isotonic exercises | |
| Static and short‐arc quadriceps, straight leg raises | Exercise A plus partial weight‐bearing exercises in supine | |
| Stretching, isometric and isotonic strengthening | Rhythmic movement in water, isometric and isotonic strengthening | |
| Stretching, isometrics, balance or gait training; bicycle ergometry | Stretching, isometrics, balance or gait training; treadmill |
Primary outcomes
1. Bleed frequency
None of the included studies reported bleed frequency.
2. Adverse events
None of the included studies reported on adverse effects
3. Quality of life
None of the included studies reported on quality of life.
Secondary outcomes
1. Balance or proprioception (or both)
The Mohamed study (n = 30) reported the effects of bicycle ergometry and treadmill training on balance and gait parameters in children with haemophilia (Mohamed 2015). Both groups received the same physical activity program and were then randomized into either the bicycle (n = 15) or the treadmill group (n = 15) (Mohamed 2015). The group that performed aerobic exercise training on the treadmill combined with the physical activity program significantly improved balance after three months of successive treatment in terms of overall stability index, MD 0.25 points (95% CI 0.19 to 0.31 points), anterior‐posterior stability index, MD 0.35 points (95% CI 0.27 to 0.43 points) and medio‐lateral stability index, MD 0.24 points (CI 95% 0.17 to 0.31 points) (Analysis 2.1) (Mohamed 2015).
2. Aerobic activity
None of the included studies reported on aerobic activity.
3. Joint health status measured via a validated outcome measure
None of the included studies reported joint health status.
4. Pain
The Mazloum study investigated the effects of the land‐based exercise program (n = 13) described above compared to an aquatic‐based exercise program (n = 14) on pain intensity (Mazloum 2014). The aquatic‐based exercise program consisted of five minutes of warm up involving rhythmic movement of the lower limb in water, followed by 30 to 45 minutes of hamstring stretching and quadriceps strengthening in water followed by a five‐minute cool down of stretching exercises in water. The aquatic‐based exercise program group demonstrated a statistically significant improvement in pain intensity following the four‐week study period, MD 0.80 VAS (95% CI 0.41 to 1.19 VAS) (Analysis 2.2) (Mazloum 2014).
5. Functional status
The Zaky study (n = 30) investigated the effects of a partial weight bearing exercise program plus a quadriceps exercise training program (n = 15) compared to the quadriceps exercise training program alone (n = 15) using the six‐minute walk test as a measure of functional status (Zaky 2013). An increase in the distance walked in six minutes is indicative of improvement. The six‐minute walk test was measured before and after a six‐week intervention period. A statistically significant improvement favouring the partial weight bearing program plus the quadriceps training program was demonstrated, MD 2.60 metres (95% CI 0.08 to 5.12 metres) (Analysis 2.3) (Zaky 2013).
6. Range of motion
The Mazloum study also investigated the effects of the land‐based exercise program (n = 13) described above compared to an aquatic‐based exercise program (n = 14) on range of motion or joint flexion. The aquatic‐based exercise program consisted of five minutes of warm up involving rhythmic movement of the lower limb in water, followed by 30 to 45 minutes of hamstring stretching and quadriceps strengthening in water followed by a five‐minute cool down of stretching exercises in water (Mazloum 2014). No significant difference was demonstrated between the land‐based exercise program and the aquatic program on range of motion or joint flexion and extension following the four‐week study period with the following results: flexion, MD 0.20 degrees (95% CI ‐5.61 to 6.01 degrees); and extension MD ‐0.10 (95% CI ‐1.59 to1.39) (Analysis 2.4) (Mazloum 2014).
7. Biceps perimeter
None of the included studies reported on biceps perimeter.
8. Strength
Muscle strength was evaluated in three studies (n = 90) in which an exercise intervention (n = 45) was compared to another exercise intervention (control n = 45) (Abd‐Elmonem 2014; Eid 2014; Zaky 2013).
In the Zaky study, the effects of a partial weight bearing exercise program plus a quadriceps exercise training program (n = 15) compared to the quadriceps exercise training program alone (n = 15) on knee extensor muscle strength was investigated (Zaky 2013). The Eid study investigated the effects on knee extensor muscle strength of a physical therapy program including stretching, strengthening and aerobic activity (n = 15) versus the same program with the addition of bicycle ergometry and weight resistance (n = 15) (Eid 2014). The Abd‐Elmonem study compared a control group (n = 15) who received an exercise therapy program including ultrasound, stretching and strengthening exercises with a study group (n = 15) who received the same program plus treadmill training.
Strength outcomes demonstrated a significant improvement for the study groups over the control groups in all outcome measures of strength including knee extensor and flexor strength (Analysis 2.5) (Abd‐Elmonem 2014; Eid 2014; Zaky 2013). In the Zaky study, as measured in force in kg, MD 6.40 (95% CI 4.81 to 7.99); in the Abd‐Elmonem study, peak torque of the knee extensors at 60 degrees per second, MD 4.31 (95% CI 2.5 to 5.87); in the Abd‐Elmonem and Eid studies combined at 120 degrees per second, MD 12.75 (95% CI 1.46 to 24.04) (Analysis 2.5).
A statistically significant improvement of knee flexor strength was also demonstrated in favour of the exercise groups (Analysis 2.5) (Abd‐Elmonem 2014; Eid 2014). In the Abd‐Elmonem study, peak torque of the knee flexors at 60 degrees per second, MD 4.31 (95% CI 3.20 to 5.42); in the Abd‐Elmonem and Eid studies combined at 120 degrees per second, MD 9.12 (95% CI 6.74 to 11.51) (Analysis 2.5).
9. Knee circumference
In the Abd‐Elmonem study (n = 30) a exercise program consisting of stretching, strengthening and therapeutic ultrasound (n = 15) was compared to the same exercise program plus the addition of treadmill walking (n = 15) on knee circumference which was used as a measure of knee effusion (Abd‐Elmonem 2014). A significant improvement in knee circumference was demonstrated in the treadmill walking group as compared to the exercise group, MD 2.70 (95% CI 2.20 to 3.20) (Analysis 2.6) (Abd‐Elmonem 2014). Units of measurement for knee circumference were not provided by the study authors.
Exercise alone versus exercise plus electrophysical modality
One study (n = 25) was included in this comparison (Parhampour 2014)
Primary outcomes
1. Bleed frequency (number of major bleeds reported per year, month, or week)
The included study did not report on bleed frequency.
2. Adverse events (e.g. bleed following exercise, worsening of symptoms)
The included study did not report on adverse events.
3. Quality of life
The included study did not report on quality of life.
Secondary outcomes
1. Balance or proprioception (or both)
The included study did not report on balance or proprioception.
2. Aerobic activity
The included study did not report on aerobic activity.
3. Joint health status measured via a validated outcome measure
The included study used the Modified Colorado Score to assess joint health status (Parhampour 2014).
A statistically significant improvement was noted in the ankle scores favouring the resistance training plus pulsed electromagnetic fields group over the resistance training group, MD 0.90 points (95% CI 0.07 to 1.73 points) (Analysis 3.1) (Parhampour 2014).
No significant differences were found between the resistance training group and the resistance training plus pulsed electromagnetic fields group for the elbows, MD 0.35 points (95% CI ‐0.70 to 1.40 points) or knees, MD 0.75 points (95% CI ‐0.47 to 1.97 points) (Analysis 3.1) (Parhampour 2014).
4. Pain
The included study did not report on pain.
5. Functional status
The included study did not report functional status.
6. Range of motion
The included study did not report on range of motion.
7. Biceps perimeter
The included study did not report on biceps perimeter.
8. Strength
The included study did not report on strength.
9. Knee circumference
The included study did not report on knee circumference.
Hydrotherapy versus no exercise
One study (n = 20) was included in this comparison (Kargarfard 2013). The study authors completed an analysis of covariance (ANCOVA) to make comparisons, between experimental and control groups on post‐test scores adjusted for differences in pre‐test scores (Kargarfard 2013). Unfortunately, we were unable to calculate differences as the baseline data for the control group were not available in the publication. We have contacted the study authors in an attempt to obtain the baseline data and if successful we will include these in the next update of this review.
Primary outcomes
1. Bleed frequency
The included study did not report on bleed frequency.
2. Adverse events
The included study did not report on adverse events.
3. Quality of life
The included study did not report on quality of life.
Secondary outcomes
1. Balance or proprioception (or both)
The included study did not report on balance or proprioception.
2. Aerobic activity
The included study did not report on aerobic activity.
3. Joint health status measured via a validated outcome measure
The included study did not report on joint health status.
4. Pain
The included study did not report on pain.
5. Functional status
The included study did not report functional status.
6. Range of motion
The study presented data for range of motion (flexion and extension) comparing an aquatic exercise therapy group (n = 10) (40 to 60 minutes per week for eight weeks) to a control group (n = 10) who did not participate in any physical activity for a period of eight weeks. The covariance analysis test in this study demonstrated a statistically significant improvement in range of motion in the experimental compared to the control group; however, as mentioned above we were unable to calculate the MD, SD and 95% CI since data were missing (Kargarfard 2013).
7. Biceps perimeter
The included study did not report on biceps perimeter.
8. Strength
The Kargarfard study presented data for knee flexor and extensor strength comparing an aquatic exercise therapy group (n = 10) (40 to 60 minutes per week for eight weeks) to a control group (n = 10) who did not participate in any physical activity for a period of eight weeks. The covariance analysis test in this study demonstrated a statistically significant improvement in both knee flexor and extensor strength in the experimental compared to the control group; however, as mentioned above we were unable to calculate MD, SD and 95% CI since data were missing (Kargarfard 2013).
9. Knee circumference
The included study did not report on knee circumference.
Discussion
Summary of main results
Eight studies were included, which represented 233 males with all severities of haemophilia A and B, ranging in age from eight to 49 years. Study durations were from four to 12 weeks. Exercise interventions varied greatly and included resisted exercises, isometric exercises, bicycle ergometry, treadmill walking and hydrotherapy, making comparisons between studies difficult.
The general risk of bias was unclear. None of these studies measured or reported outcomes regarding bleed frequency or quality of life. No adverse events related to the interventions were measured or reported. None of the studies reported outcomes regarding aerobic activity.
All studies favoured exercise to no intervention for most of the outcome measures that were assessed. One study reported that six weeks of resistance training improved joint health status (Colorado score) compared to controls. The addition of pulsed electromagnetic fields also improved ankle scores compared to exercises alone, but this was not seen in the elbows or knees.
One study reported that hydrotherapy exercises produced statistically significant improvements in joint range of motion and knee flexor and extensor strength in the exercise group compared to controls.
One study, comparing joint traction and the proprioceptive neuromuscular facilitation (PNF) technique for the elbow to a control group, showed no differences in biceps girth or biceps strength after 12 weeks of intervention.
Some studies reported comparisons between interventions. In one study, treadmill training significantly improved balance in children compared to bicycle ergometry. Another study added a partial weight bearing exercise program to a quadriceps exercise program and showed improved walking tolerance.
Four studies evaluated quadriceps or hamstring strength (or both). Addition of bicycle ergometry and exercises with weights was more effective than static exercises and treadmill walking for strengthening knee flexors and extensors. Partial weight bearing exercises through range (leg presses in supine against a wall or therapy ball, bridging exercises in supine) were more effective than static and short arc exercises for improving knee extensor strength. The addition of treadmill walking to ultrasound, stretching and strengthening exercises showed increased peak torque of knee flexors and extensors and decrease in knee effusion (circumference).
Most exercise interventions produced improvement in one or more measured outcomes including pain, range of motion, strength and walking tolerance. Hydrotherapy may be more effective than land exercises for pain relief in adults. Functional exercises such as treadmill walking and partial weight bearing exercises seem to be more effective than static or short arc exercises for improving muscle strength. These findings would be consistent with the many non‐controlled intervention reports in the haemophilia literature.
No adverse effects, new bleeds or dropouts due to injury were reported due to any of the interventions. However, it should be noted that some groups used prophylactic factor prior to exercise and other groups studied only subjects with moderate haemophilia. Therefore, application of these techniques to persons with severe haemophilia, especially to those without access to prophylactic clotting factor, should still be approached with caution.
Overall completeness and applicability of evidence
Overall, the results demonstrate a large degree of heterogeneity in interventions and outcomes and limit the ability to demonstrate a clear preference of one type of exercise program over another.
Outcome measures that were reported upon measured impairment or function of the musculoskeletal system and none of the included studies provided reports of quality of life, effect on bleeding frequency or participation in age‐appropriate societal activities. Further, there was a lack of information regarding prophylaxis or on‐demand treatment regimens and the impact that access to factor replacement treatment has on the ability or willingness to exercise. The general risk of bias was assessed as unclear. No adverse events related to the interventions were reported. None of the studies reported outcomes regarding aerobic activity.
Exercise interventions varied greatly and included resisted exercises, isometric exercises, partial weight‐bearing exercises, bicycle ergometry, treadmill walking and hydrotherapy, making comparisons between studies difficult. Also, variability in the outcome measures used to demonstrate treatment effect negatively affects the confidence of our findings due to the inability to pool amongst studies. Lastly, due to the lack of reported data on intra‐subject variability we were unable to account for this when assessing the variability of the variation over time. This limitation results in the over estimation of the variability of participant change scores and wider confidence intervals of the pooled results which may have impacted statistical significance. However, the authors believe that this method is more conservative and we may have missed an effect where one is there, but would not have resulted in finding a spurious effect, which we considered an acceptable limitation.
All studies in this review favoured exercise to no intervention or control for all secondary outcome measures with the exception of biceps perimeter and biceps strength. One study reported that six weeks of resistance training improved joint health status (Colorado score) compared to controls (Parhampour 2014). The addition of pulsed electromagnetic fields also improved ankle scores compared to exercises alone, but this was not seen in the elbows or knees (Parhampour 2014). One study reported statistically significant improvements in pain intensity, favouring the exercise group over controls after the exercise interventions (Cuesta‐Barriuso 2013). This study also reported statistically significant improvements on range of motion or joint flexion, and range of motion or joint extension, favouring the exercise groups (Cuesta‐Barriuso 2013). In this study the exercise intervention consisted of joint traction and PNF of the elbow joint (Cuesta‐Barriuso 2013). These results indicate that exercise interventions have a positive impact on pain palliation, joint range of motion and joint health status over that of no intervention or control.
When comparing one type of exercise intervention to another type of exercise intervention, all secondary outcome measures with the exception of range of motion or joint flexion or joint extension demonstrated statistical significance of one exercise program over the other as described below.
When analyzing the results of the comparison of one exercise intervention to an exercise intervention plus an add‐on modality this review demonstrated an improvement in joint health status of the ankles, but not knees or elbows, and also demonstrated an improvement in secondary outcome measures of strength and knee circumference.
Again, these results demonstrate a large degree of heterogeneity in interventions and outcomes and limit the interpretation of effects.
The fourth and final comparison of hydrotherapy versus no intervention or control reported a statistically significant improvement in range of motion and knee flexor and extensor strength via covariant analysis; however, as mentioned above, we were unable to calculate the mean difference, standard deviation and 95% confidence interval due to the missing data (Kargarfard 2013).
Quality of the evidence
There are few randomized controlled studies addressing exercise for people with haemophilia. The quality of the eight studies included in this review was graded according to the standardized risk of bias tool as described in the Cochrane Handbook of Systematic Reviews of Interventions (Higgins 2011a). As a result of the heterogeneity of study populations, interventions and outcomes it was difficult to accurately determine study quality. This is further illustrated by the inability to pool data for quantitative analysis of the primary outcomes.
Three studies did not specify type or severity of haemophilia (Kargarfard 2013; Mohamed 2015; Zaky 2013). Four studies included only people with moderate haemophilia (Abd‐Elmonem 2014; Eid 2014; Kargarfard 2013; Zaky 2013). Three studies included all (Mazloum 2014; Mohamed 2015) or mixed (Cuesta‐Barriuso 2013) severities of haemophilia. Two studies included participants with both haemophilia A and B (Abd‐Elmonem 2014; Cuesta‐Barriuso 2013). In one study participants were asked "to take their clotting factor prior to participating" (Mazloum 2014). Only one study limited their participants to severe haemophilia, and these also had osteoporosis (Parhampour 2014). Therefore, it is not clear whether the same results would be achieved if, for example, only individuals with severe haemophilia A were studied.
Some of the outcome measures that were chosen were not used appropriately. For example, one study used the Modified Colorado Hemophilia PEDIATRIC Physical Examination Scale for an ADULT cohort (Parhampour 2014), another study evaluated an exercise intervention using biceps perimeter as a measure of muscle strength (Cuesta‐Barriuso 2013). However, biceps perimeter does not correlate with muscle strength or function. Also units of measurement for the biceps perimeter (Cuesta‐Barriuso 2013) and knee circumference (Abd‐Elmonem 2014) were not provided by the study authors.
The results should be interpreted with caution due to the Quality of Evidence (GRADE) as outlined in the summary of finding tables which demonstrate that all but one of the outcomes assessed were rated as "low" or "very low" due to small sample sizes and potential bias (summary of findings Table for the main comparison; summary of findings Table 2; summary of findings Table 3; summary of findings Table 4).
Potential biases in the review process
Many different types of exercise interventions and outcomes were included in this review. This may produce potential biases in the review process as some methods of exercise were better described to allow for replication, and many outcome assessments were not completed using valid and reliable outcome measures. For example, in one of the studies a measure of joint health, the Modified Colorado Hemophilia Pediatric Physical examination Scale was used to evaluate an adult population; however, this outcome measure has only been validated in children.
Agreements and disagreements with other studies or reviews
The findings of this review, which was limited to full‐text or abstracts of randomized, controlled studies only, are consistent with the findings of two recent comprehensive review articles which included a wider range of study designs (Gomis 2009; Negrier 2013). These authors reviewed the benefits and and effectiveness of exercise, and also concluded that exercise can have a positive effect on physical well‐being. The authors further commented on emotional and social well‐being, but this current review was unable to draw any conclusions in this regard due to lack of data. The authors also commented on the lack of rigorously designed trials, methodological drawbacks, and low levels of evidence in the existing literature.
Risk of bias graph: review authors' judgements about each risk of bias item presented as percentages across all included studies.
Risk of bias summary: review authors' judgements about each risk of bias item for each included study.

Comparison 1 Exercise versus no intervention, Outcome 1 Colorado score.
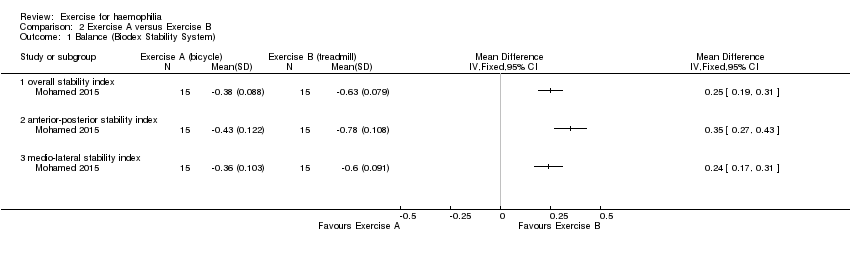
Comparison 2 Exercise A versus Exercise B, Outcome 1 Balance (Biodex Stability System).
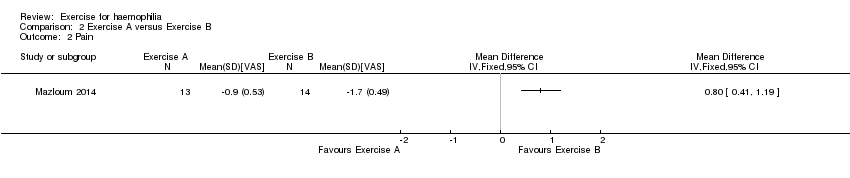
Comparison 2 Exercise A versus Exercise B, Outcome 2 Pain.

Comparison 2 Exercise A versus Exercise B, Outcome 3 6‐min walk: distance.

Comparison 2 Exercise A versus Exercise B, Outcome 4 Range of motion: flexion.

Comparison 2 Exercise A versus Exercise B, Outcome 5 Muscle strength.
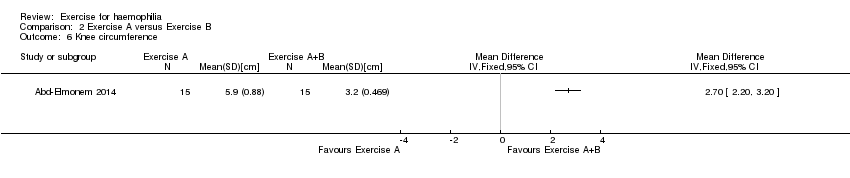
Comparison 2 Exercise A versus Exercise B, Outcome 6 Knee circumference.
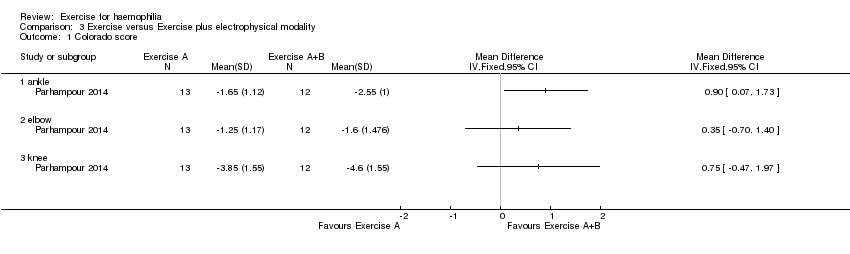
Comparison 3 Exercise versus Exercise plus electrophysical modality, Outcome 1 Colorado score.

Comparison 4 Hydrotherapy versus no intervention, Outcome 1 Pain.

Comparison 4 Hydrotherapy versus no intervention, Outcome 2 Range of motion.
| Exercise compared with no intervention for haemophilia | ||||||
| Patient or population: participants with haemophilia Settings: outpatients Intervention: exercise Comparison: no intervention | ||||||
| Outcomes | Illustrative comparative risks* (95% CI) | Relative effect | No of Participants | Quality of the evidence | Comments | |
| Assumed risk | Corresponding risk | |||||
| No intervention | Exercise | |||||
| Adverse events | Outcome not reported | NA | ||||
| Quality of life | Outcome not reported | NA | ||||
| Joint health: Modified Colorado Score Follow up: 6 weeks | See comment | See comment | NA | 25 (1 study) | ⊕⊕⊝⊝ | Statistically significant improvements were demonstrated in the exercise group compared to the no intervention group in the joint health status of the elbows, MD ‐1.21 points (95% CI ‐2.14 to ‐0.28 points), knees, MD ‐3.42 points (95% CI ‐4.82 to ‐2.02 points) and ankles, MD ‐1.65 points (95% CI ‐2.51 to ‐0.79). |
| Pain: reduction of pain intensity by visual analogue scale Follow up: 12 weeks | See comment | See comment | NA | 18 (1 study) | ⊕⊝⊝⊝ | Data were presented as number of joints (n = 30) rather than number of participants so could not be entered into the analysis. There was "observed improvement (P < 0.05)" in pain perception of the elbow in exercise group compared to the no intervention group. |
| Functional Status | Outcome not reported | NA | ||||
| Range of Motion: joint flexion and joint extension Follow up: 12 weeks | See comment | See comment | NA | 18 (1 study) | ⊕⊝⊝⊝ | Data were presented as number of joints (n = 30) rather than number of participants so could not be entered into the analysis. There was "observed improvement (P < 0.05)" in flexion of the elbow in exercise group compared to the no intervention group but no statistically significant difference between treatment groups for joint extension. |
| Strength: bicep strength Follow up: 12 weeks | See comment | See comment | NA | 18 (1 study) | ⊕⊝⊝⊝ | Data were presented as number of joints (n = 30) rather than number of participants so could not be entered into the analysis. There was no statistically significant difference between treatment groups. |
| *The basis for the assumed risk is provided in the comments. The corresponding risk (and its 95% confidence interval) is based on the assumed risk in the comparison group and the relative effect of the intervention (and its 95% CI). | ||||||
| GRADE Working Group grades of evidence | ||||||
| 1. Downgraded once due to potential risk of bias: limited details of study design provided making assessment of study quality difficult; presence of bias cannot be ruled out. 2. Downgraded once due to imprecision: evidence available from only a single study recruiting a small sample of participants. 3. Downgraded once due to applicability: the single study contributing evidence recruits only participants with severe haemophilia; results are not applicable to participants with mild or moderate haemophilia | ||||||
| Exercise A compared with Exercise B for haemophilia | ||||||
| Patient or population: participants with haemophilia Settings: outpatients Intervention: Exercise A Comparison: Exercise B | ||||||
| Outcomes | Illustrative comparative risks* (95% CI) | Relative effect | No of Participants | Quality of the evidence | Comments | |
| Assumed risk | Corresponding risk | |||||
| Exercise B | Exercise A | |||||
| Adverse events | Outcome not reported | |||||
| Quality of life | Outcome not reported | |||||
| Balance: Biodex stability parameters Follow up: 12 weeks | See comment | See comment | NA | 30 (1 study) | ⊕⊝⊝⊝ | Exercise B group (treadmill) significantly improved compared to Exercise A group (bicycle) in terms of overall stability index, MD 0.25 points (95% CI 0.19 to 0.31 points), anterior‐posterior stability index, MD 0.35 points (95% CI 0.27 to 0.43 points) and medio‐lateral stability index, MD 0.24 points (CI 95% 0.17 to 0.31 points). |
| Pain: reduction of pain intensity by visual analogue scale Follow up: 4 weeks | The mean reduction in pain from baseline was 1.7 on the VAS scale in the Exercise B group. | The mean reduction in pain from baseline was 0.8 lower (0.41 to 1.19 lower) on the VAS scale in the Exercise A group. | NA | 27 (1 study) | ⊕⊕⊝⊝ | Exercise A is a land‐based exercise program and Excerise B is an aquatic‐based exercise program. |
| Functional Status: 6MWT (metres) Follow up: 6 weeks | The mean 6MWT was 32 metres in Exercise group B. | The mean 6MWT was 2.6 metres greater (0.08 metres to 5.12 metres greater) in Exercise group A. | NA | 30 (1 study) | ⊕⊝⊝⊝ | Exercise A is a partial weight bearing exercise program plus a quadriceps exercise training program and Exercise B is a quadriceps exercise training program alone. |
| Range of Motion: flexion and extension Follow up: 4 weeks | See comment | See comment | NA | 27 (1 study) | ⊕⊕⊝⊝ | Exercise A is a land‐based exercise program and Excerise B is an aquatic‐based exercise program. No significant difference was demonstrated between the treatment groups; flexion, MD 0.20 degrees (95% CI ‐5.61 to 6.01 degrees) and extension MD ‐0.10 (95% CI ‐1.59 to 1.39). |
| Strength: flexors and extensors Follow up: 12 weeks | See comment | See comment | NA | 90 (3 studies) | ⊕⊕⊕⊝ | Strength outcomes demonstrated a significant improvement for the study groups over the control groups in all outcome measures of strength including knee extensor and flexor strength.4 |
| *The basis for the assumed risk is the mean control group risk or provided in the comments. The corresponding risk (and its 95% confidence interval) is based on the assumed risk in the comparison group and the relative effect of the intervention (and its 95% CI). | ||||||
| GRADE Working Group grades of evidence | ||||||
| 1. Downgraded once due to potential risk of bias: limited details of study design provided making assessment of study quality difficult; presence of bias cannot be ruled out. 2. Downgraded once due to imprecision: evidence available from only a single study recruiting a small sample of participants. 3. Downgraded once due to applicability: the single studies contributing evidence recruit only individuals with mild or moderate haemophilia; results are not applicable to participants with severe haemophilia. 4. Comparisons were partial weight bearing exercise program plus a quadriceps exercise training program (study group) compared to quadriceps exercise training program alone (control group), physical therapy program of stretching, strengthening and aerobic activity (control group) compared to the same program with the addition of bicycle ergometry (study group) and weight resistance and exercise therapy program including ultrasound, stretching and strengthening exercises (control group) compared to the same program plus treadmill training (study group). Also see Table 2 for further details of interventions. | ||||||
| Exercise alone compared with exercise plus electrophysical modality for haemophilia | ||||||
| Patient or population: participants with haemophilia Settings: outpatients Intervention: exercise alone Comparison: exercise plus electrophysical modality | ||||||
| Outcomes | Illustrative comparative risks* (95% CI) | Relative effect | No of Participants | Quality of the evidence | Comments | |
| Assumed risk | Corresponding risk | |||||
| Exercise plus electrophysical modality | Exercise alone | |||||
| Adverse events | Outcome not reported | NA | ||||
| Quality of life | Outcome not reported | NA | ||||
| Pain | Outcome not reported | NA | ||||
| Functional Status | Outcome not reported | NA | ||||
| Joint health: Modified Colorado Score Follow up: 12 weeks | See comment | See comment | NA | 25 (1 study) | ⊕⊝⊝⊝ | A statistically significant improvement was noted in the ankle scores, MD 0.90 points (95% CI 0.07 to 1.73 points) favouring the exercise plus electrophysical modality group over exercise alone group. There was no statistically significant difference between groups in elbow scores, MD 0.35 points (95% CI ‐0.70 to 1.40 points) or knee scores, MD 0.75 points (95% CI ‐0.47 to 1.97 points). |
| *The basis for the assumed risk is provided in the comments. The corresponding risk (and its 95% confidence interval) is based on the assumed risk in the comparison group and the relative effect of the intervention (and its 95% CI). | ||||||
| GRADE Working Group grades of evidence | ||||||
| 1. Downgraded once due to potential risk of bias: limited details of study design provided making assessment of study quality difficult; presence of bias cannot be ruled out. 2. Downgraded once due to imprecision: evidence available from only a single study recruiting a small sample of participants. 3. Downgraded once due to applicability: the single study contributing evidence recruits only participants with severe haemophilia; results are not applicable to participants with mild or moderate haemophilia. | ||||||
| Hydrotherapy compared with no exercise for haemophilia | ||||||
| Patient or population: participants with haemophilia Settings: outpatients Intervention: hydrotherapy Comparison: no exercise | ||||||
| Outcomes | Illustrative comparative risks* (95% CI) | Relative effect | No of Participants | Quality of the evidence | Comments | |
| Assumed risk | Corresponding risk | |||||
| No exercise | Hydrotherapy | |||||
| Adverse events | Outcome not reported | NA | ||||
| Quality of life | Outcome not reported | NA | ||||
| Pain | Outcome not reported | NA | ||||
| Functional status | Outcome not reported | NA | ||||
| Range of motion: flexion and extension Follow up: 8 weeks | See comment | See comment | NA | 20 (1 study) | ⊕⊝⊝⊝ | Data were presented via an analysis of covariance (post intervention scores adjusted for differences in pre intervention scores), so data could not be entered into the analysis. There was a statistically significant improvement in range of motion of the hydrotherapy group over the no exercise group. |
| Strength: knee flexor and extensor strength Follow up: 8 weeks | See comment | See comment | NA | 20 (1 study) | ⊕⊝⊝⊝ | Data were presented via an analysis of covariance (post intervention scores adjusted for differences in pre intervention scores), so data could not be entered into analysis. There was a statistically significant improvement in both knee flexor and extensor strength of the hydrotherapy group over the no exercise group. |
| *The basis for the assumed risk is provided in the comments. The corresponding risk (and its 95% confidence interval) is based on the assumed risk in the comparison group and the relative effect of the intervention (and its 95% CI). | ||||||
| GRADE Working Group grades of evidence | ||||||
| 1. Downgraded once due to potential risk of bias: limited details of study design provided making assessment of study quality difficult and suspected selective reporting bias and post‐intervention scores are not presented. 2. Downgraded once due to imprecision: evidence available from only a single study recruiting a small sample of participants. 3. Downgraded once due to applicability: the single study contributing evidence recruits only participants with moderate haemophilia; results are not applicable to participants with mild or severe haemophilia. | ||||||
| Outcome | Assessment | Exercise group: mean (SD) (n = 9 participants, 16 elbows) | Control group: mean (SD) (n = 9 participants, 14 elbows) |
| Flexion | Pre‐treatment: Post‐treatment (12 weeks): | 136.130 (14.818) 140.310 (11.247) | 138.000 (19.958) 138.430 (18.475) |
| Extension | Pre‐treatment: Post‐treatment (12 weeks): | 10.870 (14.207) 11.880 (14.917) | 8.640 (15.310) 8.290 (15.364) |
| Pain (VAS) | Pre‐treatment: Post‐treatment (12 weeks): | 0.719 (0.752) 0.344 (0.436) | 0.143 (0.305) 0.071 (0.267) |
| Biceps perimeter | Pre‐treatment: Post‐treatment (12 weeks): | 31.331 (3.474) 31.725 (3.205) | 32.007 (3.837) 31.857 (3.566) |
| Bicep strength | Pre‐treatment: Post‐treatment (12 weeks): | 0.094 (0.272) 0.000 (0.000) | 0.143 (0.363) 0.071 (0.181) |
| Number of participants in each group = 9. Data relate to 16 elbows in the exercise group and 14 in the control group. VAS: visual analog scale | |||
| Author | "Exercise A" | "Exercise B" |
| Ultrasound, stretching, strengthening 5 days per week | Exercise A plus treadmill training | |
| Stretching, static exercises, treadmill | Exercise A plus bicycle ergometer and resisted isotonic exercises | |
| Static and short‐arc quadriceps, straight leg raises | Exercise A plus partial weight‐bearing exercises in supine | |
| Stretching, isometric and isotonic strengthening | Rhythmic movement in water, isometric and isotonic strengthening | |
| Stretching, isometrics, balance or gait training; bicycle ergometry | Stretching, isometrics, balance or gait training; treadmill |
| Outcome or subgroup title | No. of studies | No. of participants | Statistical method | Effect size |
| 1 Colorado score Show forest plot | 1 | Mean Difference (IV, Fixed, 95% CI) | Totals not selected | |
| 1.1 elbow | 1 | Mean Difference (IV, Fixed, 95% CI) | 0.0 [0.0, 0.0] | |
| 1.2 knee | 1 | Mean Difference (IV, Fixed, 95% CI) | 0.0 [0.0, 0.0] | |
| 1.3 ankles | 1 | Mean Difference (IV, Fixed, 95% CI) | 0.0 [0.0, 0.0] | |
| Outcome or subgroup title | No. of studies | No. of participants | Statistical method | Effect size |
| 1 Balance (Biodex Stability System) Show forest plot | 1 | Mean Difference (IV, Fixed, 95% CI) | Totals not selected | |
| 1.1 overall stability index | 1 | Mean Difference (IV, Fixed, 95% CI) | 0.0 [0.0, 0.0] | |
| 1.2 anterior‐posterior stability index | 1 | Mean Difference (IV, Fixed, 95% CI) | 0.0 [0.0, 0.0] | |
| 1.3 medio‐lateral stability index | 1 | Mean Difference (IV, Fixed, 95% CI) | 0.0 [0.0, 0.0] | |
| 2 Pain Show forest plot | 1 | Mean Difference (IV, Fixed, 95% CI) | Totals not selected | |
| 3 6‐min walk: distance Show forest plot | 1 | Mean Difference (IV, Fixed, 95% CI) | Totals not selected | |
| 4 Range of motion: flexion Show forest plot | 1 | Mean Difference (IV, Fixed, 95% CI) | Totals not selected | |
| 4.1 flexion | 1 | Mean Difference (IV, Fixed, 95% CI) | 0.0 [0.0, 0.0] | |
| 4.2 extension | 1 | Mean Difference (IV, Fixed, 95% CI) | 0.0 [0.0, 0.0] | |
| 5 Muscle strength Show forest plot | 3 | Mean Difference (IV, Random, 95% CI) | Subtotals only | |
| 5.1 extensors (force in kg) | 1 | 30 | Mean Difference (IV, Random, 95% CI) | 6.40 [4.81, 7.99] |
| 5.2 extensors 60 degrees per second | 1 | 30 | Mean Difference (IV, Random, 95% CI) | 4.31 [2.75, 5.87] |
| 5.3 extensors 120 degrees per second | 2 | 60 | Mean Difference (IV, Random, 95% CI) | 12.75 [1.46, 24.04] |
| 5.4 flexors speed 60 degrees per second | 1 | 30 | Mean Difference (IV, Random, 95% CI) | 4.31 [3.20, 5.42] |
| 5.5 flexors speed 120 degrees per second | 2 | 60 | Mean Difference (IV, Random, 95% CI) | 9.12 [6.74, 11.51] |
| 6 Knee circumference Show forest plot | 1 | Mean Difference (IV, Fixed, 95% CI) | Totals not selected | |
| Outcome or subgroup title | No. of studies | No. of participants | Statistical method | Effect size |
| 1 Colorado score Show forest plot | 1 | Mean Difference (IV, Fixed, 95% CI) | Totals not selected | |
| 1.1 ankle | 1 | Mean Difference (IV, Fixed, 95% CI) | 0.0 [0.0, 0.0] | |
| 1.2 elbow | 1 | Mean Difference (IV, Fixed, 95% CI) | 0.0 [0.0, 0.0] | |
| 1.3 knee | 1 | Mean Difference (IV, Fixed, 95% CI) | 0.0 [0.0, 0.0] | |
| Outcome or subgroup title | No. of studies | No. of participants | Statistical method | Effect size |
| 1 Pain Show forest plot | 1 | Mean Difference (IV, Fixed, 95% CI) | Totals not selected | |
| 2 Range of motion Show forest plot | 1 | Mean Difference (IV, Fixed, 95% CI) | Totals not selected | |
| 2.1 flexion | 1 | Mean Difference (IV, Fixed, 95% CI) | 0.0 [0.0, 0.0] | |
| 2.2 extension | 1 | Mean Difference (IV, Fixed, 95% CI) | 0.0 [0.0, 0.0] | |