Ejercicio para la hemofilia
Information
- DOI:
- https://doi.org/10.1002/14651858.CD011180.pub2Copy DOI

- Database:
-
- Cochrane Database of Systematic Reviews
- Version published:
-
- 19 December 2016see what's new
- Type:
-
- Intervention
- Stage:
-
- Review
- Cochrane Editorial Group:
-
Cochrane Cystic Fibrosis and Genetic Disorders Group
- Copyright:
-
- Copyright © 2016 The Cochrane Collaboration. Published by John Wiley & Sons, Ltd.
Article metrics
Altmetric:
Cited by:
Authors
Contributions of authors
RM and KM developed the protocol. KS and KM conducted the search for studies and selected included trials; assessed study quality; extracted, entered and analyzed the data. KS interpreted the results. KS and KM wrote the review and RM reviewed the final manuscript.
Sources of support
Internal sources
-
No sources of support supplied
External sources
-
National Institute for Health Research, UK.
This systematic review was supported by the National Institute for Health Research, via Cochrane Infrastructure funding to the Cochrane Cystic Fibrosis and Genetic Disorders Group.
Declarations of interest
Karen Strike: none known.
Kathy Mulder: none known.
Rojer Michael: none known.
Acknowledgements
The authors would like to acknowledge the assistance of Tracey Remmington.
Version history
| Published | Title | Stage | Authors | Version |
| 2016 Dec 19 | Exercise for haemophilia | Review | Karen Strike, Kathy Mulder, Rojer Michael | |
| 2014 Jul 07 | Exercise for hemophilia | Protocol | Rojer Michael, Kathy Mulder, Karen Strike | |
Differences between protocol and review
Post hoc analysis resulted in the addition of the following clinically relevant outcomes. These outcomes were deemed important to healthcare providers and consumers as primary impairments that are assessed by musculoskeletal specialists and may be impacted by an exercise intervention.
-
Range of motion (Kargarfard 2013; Mazloum 2014).
-
Biceps perimeter (Cuesta‐Barriuso 2013).
-
Strength: peak torque using the Biodex Isokinetic Dynamometer (Abd‐Elmonem 2014; Eid 2014; Kargarfard 2013) and the Lafayette Manual Muscle Test (Zaky 2013).
-
Knee circumference (Abd‐Elmonem 2014).
Keywords
MeSH
Medical Subject Headings (MeSH) Keywords
- Exercise Therapy [*methods];
- Hemarthrosis [rehabilitation];
- Hemophilia A [*rehabilitation];
- Hemophilia B [*rehabilitation];
- Hydrotherapy;
- Muscle Strength;
- Muscle Stretching Exercises;
- Pain [rehabilitation];
- Pain Measurement;
- Randomized Controlled Trials as Topic;
- Range of Motion, Articular;
- Resistance Training;
Medical Subject Headings Check Words
Adolescent; Adult; Child; Humans; Male; Middle Aged;
PICOs


Risk of bias graph: review authors' judgements about each risk of bias item presented as percentages across all included studies.

Risk of bias summary: review authors' judgements about each risk of bias item for each included study.

Comparison 1 Exercise versus no intervention, Outcome 1 Colorado score.
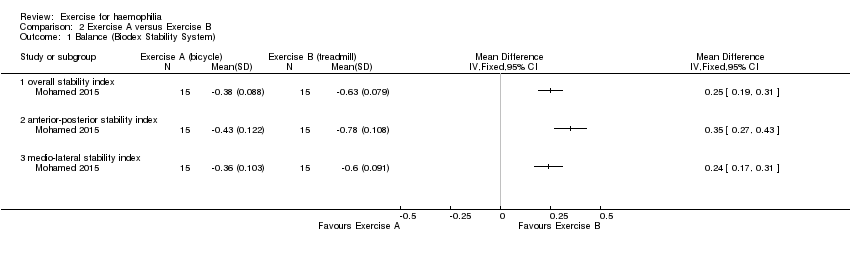
Comparison 2 Exercise A versus Exercise B, Outcome 1 Balance (Biodex Stability System).
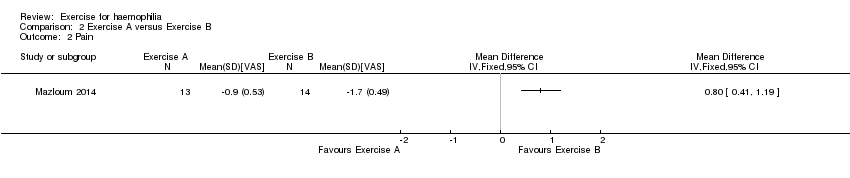
Comparison 2 Exercise A versus Exercise B, Outcome 2 Pain.

Comparison 2 Exercise A versus Exercise B, Outcome 3 6‐min walk: distance.

Comparison 2 Exercise A versus Exercise B, Outcome 4 Range of motion: flexion.

Comparison 2 Exercise A versus Exercise B, Outcome 5 Muscle strength.
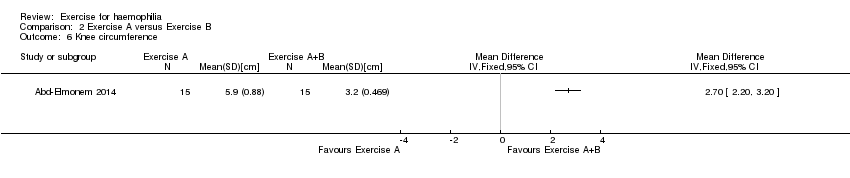
Comparison 2 Exercise A versus Exercise B, Outcome 6 Knee circumference.
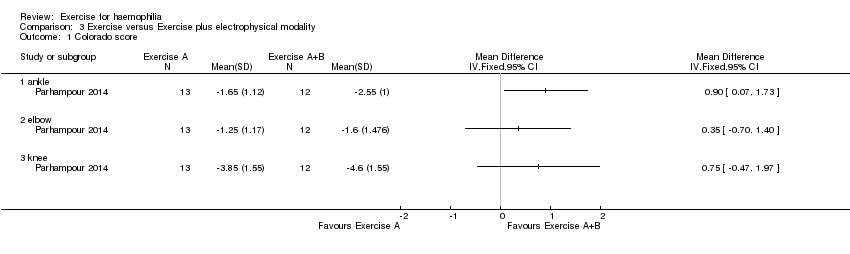
Comparison 3 Exercise versus Exercise plus electrophysical modality, Outcome 1 Colorado score.

Comparison 4 Hydrotherapy versus no intervention, Outcome 1 Pain.

Comparison 4 Hydrotherapy versus no intervention, Outcome 2 Range of motion.
| Exercise compared with no intervention for haemophilia | ||||||
| Patient or population: participants with haemophilia Settings: outpatients Intervention: exercise Comparison: no intervention | ||||||
| Outcomes | Illustrative comparative risks* (95% CI) | Relative effect | No of Participants | Quality of the evidence | Comments | |
| Assumed risk | Corresponding risk | |||||
| No intervention | Exercise | |||||
| Adverse events | Outcome not reported | NA | ||||
| Quality of life | Outcome not reported | NA | ||||
| Joint health: Modified Colorado Score Follow up: 6 weeks | See comment | See comment | NA | 25 (1 study) | ⊕⊕⊝⊝ | Statistically significant improvements were demonstrated in the exercise group compared to the no intervention group in the joint health status of the elbows, MD ‐1.21 points (95% CI ‐2.14 to ‐0.28 points), knees, MD ‐3.42 points (95% CI ‐4.82 to ‐2.02 points) and ankles, MD ‐1.65 points (95% CI ‐2.51 to ‐0.79). |
| Pain: reduction of pain intensity by visual analogue scale Follow up: 12 weeks | See comment | See comment | NA | 18 (1 study) | ⊕⊝⊝⊝ | Data were presented as number of joints (n = 30) rather than number of participants so could not be entered into the analysis. There was "observed improvement (P < 0.05)" in pain perception of the elbow in exercise group compared to the no intervention group. |
| Functional Status | Outcome not reported | NA | ||||
| Range of Motion: joint flexion and joint extension Follow up: 12 weeks | See comment | See comment | NA | 18 (1 study) | ⊕⊝⊝⊝ | Data were presented as number of joints (n = 30) rather than number of participants so could not be entered into the analysis. There was "observed improvement (P < 0.05)" in flexion of the elbow in exercise group compared to the no intervention group but no statistically significant difference between treatment groups for joint extension. |
| Strength: bicep strength Follow up: 12 weeks | See comment | See comment | NA | 18 (1 study) | ⊕⊝⊝⊝ | Data were presented as number of joints (n = 30) rather than number of participants so could not be entered into the analysis. There was no statistically significant difference between treatment groups. |
| *The basis for the assumed risk is provided in the comments. The corresponding risk (and its 95% confidence interval) is based on the assumed risk in the comparison group and the relative effect of the intervention (and its 95% CI). | ||||||
| GRADE Working Group grades of evidence | ||||||
| 1. Downgraded once due to potential risk of bias: limited details of study design provided making assessment of study quality difficult; presence of bias cannot be ruled out. 2. Downgraded once due to imprecision: evidence available from only a single study recruiting a small sample of participants. 3. Downgraded once due to applicability: the single study contributing evidence recruits only participants with severe haemophilia; results are not applicable to participants with mild or moderate haemophilia | ||||||
| Exercise A compared with Exercise B for haemophilia | ||||||
| Patient or population: participants with haemophilia Settings: outpatients Intervention: Exercise A Comparison: Exercise B | ||||||
| Outcomes | Illustrative comparative risks* (95% CI) | Relative effect | No of Participants | Quality of the evidence | Comments | |
| Assumed risk | Corresponding risk | |||||
| Exercise B | Exercise A | |||||
| Adverse events | Outcome not reported | |||||
| Quality of life | Outcome not reported | |||||
| Balance: Biodex stability parameters Follow up: 12 weeks | See comment | See comment | NA | 30 (1 study) | ⊕⊝⊝⊝ | Exercise B group (treadmill) significantly improved compared to Exercise A group (bicycle) in terms of overall stability index, MD 0.25 points (95% CI 0.19 to 0.31 points), anterior‐posterior stability index, MD 0.35 points (95% CI 0.27 to 0.43 points) and medio‐lateral stability index, MD 0.24 points (CI 95% 0.17 to 0.31 points). |
| Pain: reduction of pain intensity by visual analogue scale Follow up: 4 weeks | The mean reduction in pain from baseline was 1.7 on the VAS scale in the Exercise B group. | The mean reduction in pain from baseline was 0.8 lower (0.41 to 1.19 lower) on the VAS scale in the Exercise A group. | NA | 27 (1 study) | ⊕⊕⊝⊝ | Exercise A is a land‐based exercise program and Excerise B is an aquatic‐based exercise program. |
| Functional Status: 6MWT (metres) Follow up: 6 weeks | The mean 6MWT was 32 metres in Exercise group B. | The mean 6MWT was 2.6 metres greater (0.08 metres to 5.12 metres greater) in Exercise group A. | NA | 30 (1 study) | ⊕⊝⊝⊝ | Exercise A is a partial weight bearing exercise program plus a quadriceps exercise training program and Exercise B is a quadriceps exercise training program alone. |
| Range of Motion: flexion and extension Follow up: 4 weeks | See comment | See comment | NA | 27 (1 study) | ⊕⊕⊝⊝ | Exercise A is a land‐based exercise program and Excerise B is an aquatic‐based exercise program. No significant difference was demonstrated between the treatment groups; flexion, MD 0.20 degrees (95% CI ‐5.61 to 6.01 degrees) and extension MD ‐0.10 (95% CI ‐1.59 to 1.39). |
| Strength: flexors and extensors Follow up: 12 weeks | See comment | See comment | NA | 90 (3 studies) | ⊕⊕⊕⊝ | Strength outcomes demonstrated a significant improvement for the study groups over the control groups in all outcome measures of strength including knee extensor and flexor strength.4 |
| *The basis for the assumed risk is the mean control group risk or provided in the comments. The corresponding risk (and its 95% confidence interval) is based on the assumed risk in the comparison group and the relative effect of the intervention (and its 95% CI). | ||||||
| GRADE Working Group grades of evidence | ||||||
| 1. Downgraded once due to potential risk of bias: limited details of study design provided making assessment of study quality difficult; presence of bias cannot be ruled out. 2. Downgraded once due to imprecision: evidence available from only a single study recruiting a small sample of participants. 3. Downgraded once due to applicability: the single studies contributing evidence recruit only individuals with mild or moderate haemophilia; results are not applicable to participants with severe haemophilia. 4. Comparisons were partial weight bearing exercise program plus a quadriceps exercise training program (study group) compared to quadriceps exercise training program alone (control group), physical therapy program of stretching, strengthening and aerobic activity (control group) compared to the same program with the addition of bicycle ergometry (study group) and weight resistance and exercise therapy program including ultrasound, stretching and strengthening exercises (control group) compared to the same program plus treadmill training (study group). Also see Table 2 for further details of interventions. | ||||||
| Exercise alone compared with exercise plus electrophysical modality for haemophilia | ||||||
| Patient or population: participants with haemophilia Settings: outpatients Intervention: exercise alone Comparison: exercise plus electrophysical modality | ||||||
| Outcomes | Illustrative comparative risks* (95% CI) | Relative effect | No of Participants | Quality of the evidence | Comments | |
| Assumed risk | Corresponding risk | |||||
| Exercise plus electrophysical modality | Exercise alone | |||||
| Adverse events | Outcome not reported | NA | ||||
| Quality of life | Outcome not reported | NA | ||||
| Pain | Outcome not reported | NA | ||||
| Functional Status | Outcome not reported | NA | ||||
| Joint health: Modified Colorado Score Follow up: 12 weeks | See comment | See comment | NA | 25 (1 study) | ⊕⊝⊝⊝ | A statistically significant improvement was noted in the ankle scores, MD 0.90 points (95% CI 0.07 to 1.73 points) favouring the exercise plus electrophysical modality group over exercise alone group. There was no statistically significant difference between groups in elbow scores, MD 0.35 points (95% CI ‐0.70 to 1.40 points) or knee scores, MD 0.75 points (95% CI ‐0.47 to 1.97 points). |
| *The basis for the assumed risk is provided in the comments. The corresponding risk (and its 95% confidence interval) is based on the assumed risk in the comparison group and the relative effect of the intervention (and its 95% CI). | ||||||
| GRADE Working Group grades of evidence | ||||||
| 1. Downgraded once due to potential risk of bias: limited details of study design provided making assessment of study quality difficult; presence of bias cannot be ruled out. 2. Downgraded once due to imprecision: evidence available from only a single study recruiting a small sample of participants. 3. Downgraded once due to applicability: the single study contributing evidence recruits only participants with severe haemophilia; results are not applicable to participants with mild or moderate haemophilia. | ||||||
| Hydrotherapy compared with no exercise for haemophilia | ||||||
| Patient or population: participants with haemophilia Settings: outpatients Intervention: hydrotherapy Comparison: no exercise | ||||||
| Outcomes | Illustrative comparative risks* (95% CI) | Relative effect | No of Participants | Quality of the evidence | Comments | |
| Assumed risk | Corresponding risk | |||||
| No exercise | Hydrotherapy | |||||
| Adverse events | Outcome not reported | NA | ||||
| Quality of life | Outcome not reported | NA | ||||
| Pain | Outcome not reported | NA | ||||
| Functional status | Outcome not reported | NA | ||||
| Range of motion: flexion and extension Follow up: 8 weeks | See comment | See comment | NA | 20 (1 study) | ⊕⊝⊝⊝ | Data were presented via an analysis of covariance (post intervention scores adjusted for differences in pre intervention scores), so data could not be entered into the analysis. There was a statistically significant improvement in range of motion of the hydrotherapy group over the no exercise group. |
| Strength: knee flexor and extensor strength Follow up: 8 weeks | See comment | See comment | NA | 20 (1 study) | ⊕⊝⊝⊝ | Data were presented via an analysis of covariance (post intervention scores adjusted for differences in pre intervention scores), so data could not be entered into analysis. There was a statistically significant improvement in both knee flexor and extensor strength of the hydrotherapy group over the no exercise group. |
| *The basis for the assumed risk is provided in the comments. The corresponding risk (and its 95% confidence interval) is based on the assumed risk in the comparison group and the relative effect of the intervention (and its 95% CI). | ||||||
| GRADE Working Group grades of evidence | ||||||
| 1. Downgraded once due to potential risk of bias: limited details of study design provided making assessment of study quality difficult and suspected selective reporting bias and post‐intervention scores are not presented. 2. Downgraded once due to imprecision: evidence available from only a single study recruiting a small sample of participants. 3. Downgraded once due to applicability: the single study contributing evidence recruits only participants with moderate haemophilia; results are not applicable to participants with mild or severe haemophilia. | ||||||
| Outcome | Assessment | Exercise group: mean (SD) (n = 9 participants, 16 elbows) | Control group: mean (SD) (n = 9 participants, 14 elbows) |
| Flexion | Pre‐treatment: Post‐treatment (12 weeks): | 136.130 (14.818) 140.310 (11.247) | 138.000 (19.958) 138.430 (18.475) |
| Extension | Pre‐treatment: Post‐treatment (12 weeks): | 10.870 (14.207) 11.880 (14.917) | 8.640 (15.310) 8.290 (15.364) |
| Pain (VAS) | Pre‐treatment: Post‐treatment (12 weeks): | 0.719 (0.752) 0.344 (0.436) | 0.143 (0.305) 0.071 (0.267) |
| Biceps perimeter | Pre‐treatment: Post‐treatment (12 weeks): | 31.331 (3.474) 31.725 (3.205) | 32.007 (3.837) 31.857 (3.566) |
| Bicep strength | Pre‐treatment: Post‐treatment (12 weeks): | 0.094 (0.272) 0.000 (0.000) | 0.143 (0.363) 0.071 (0.181) |
| Number of participants in each group = 9. Data relate to 16 elbows in the exercise group and 14 in the control group. VAS: visual analog scale | |||
| Author | "Exercise A" | "Exercise B" |
| Ultrasound, stretching, strengthening 5 days per week | Exercise A plus treadmill training | |
| Stretching, static exercises, treadmill | Exercise A plus bicycle ergometer and resisted isotonic exercises | |
| Static and short‐arc quadriceps, straight leg raises | Exercise A plus partial weight‐bearing exercises in supine | |
| Stretching, isometric and isotonic strengthening | Rhythmic movement in water, isometric and isotonic strengthening | |
| Stretching, isometrics, balance or gait training; bicycle ergometry | Stretching, isometrics, balance or gait training; treadmill |
| Outcome or subgroup title | No. of studies | No. of participants | Statistical method | Effect size |
| 1 Colorado score Show forest plot | 1 | Mean Difference (IV, Fixed, 95% CI) | Totals not selected | |
| 1.1 elbow | 1 | Mean Difference (IV, Fixed, 95% CI) | 0.0 [0.0, 0.0] | |
| 1.2 knee | 1 | Mean Difference (IV, Fixed, 95% CI) | 0.0 [0.0, 0.0] | |
| 1.3 ankles | 1 | Mean Difference (IV, Fixed, 95% CI) | 0.0 [0.0, 0.0] | |
| Outcome or subgroup title | No. of studies | No. of participants | Statistical method | Effect size |
| 1 Balance (Biodex Stability System) Show forest plot | 1 | Mean Difference (IV, Fixed, 95% CI) | Totals not selected | |
| 1.1 overall stability index | 1 | Mean Difference (IV, Fixed, 95% CI) | 0.0 [0.0, 0.0] | |
| 1.2 anterior‐posterior stability index | 1 | Mean Difference (IV, Fixed, 95% CI) | 0.0 [0.0, 0.0] | |
| 1.3 medio‐lateral stability index | 1 | Mean Difference (IV, Fixed, 95% CI) | 0.0 [0.0, 0.0] | |
| 2 Pain Show forest plot | 1 | Mean Difference (IV, Fixed, 95% CI) | Totals not selected | |
| 3 6‐min walk: distance Show forest plot | 1 | Mean Difference (IV, Fixed, 95% CI) | Totals not selected | |
| 4 Range of motion: flexion Show forest plot | 1 | Mean Difference (IV, Fixed, 95% CI) | Totals not selected | |
| 4.1 flexion | 1 | Mean Difference (IV, Fixed, 95% CI) | 0.0 [0.0, 0.0] | |
| 4.2 extension | 1 | Mean Difference (IV, Fixed, 95% CI) | 0.0 [0.0, 0.0] | |
| 5 Muscle strength Show forest plot | 3 | Mean Difference (IV, Random, 95% CI) | Subtotals only | |
| 5.1 extensors (force in kg) | 1 | 30 | Mean Difference (IV, Random, 95% CI) | 6.40 [4.81, 7.99] |
| 5.2 extensors 60 degrees per second | 1 | 30 | Mean Difference (IV, Random, 95% CI) | 4.31 [2.75, 5.87] |
| 5.3 extensors 120 degrees per second | 2 | 60 | Mean Difference (IV, Random, 95% CI) | 12.75 [1.46, 24.04] |
| 5.4 flexors speed 60 degrees per second | 1 | 30 | Mean Difference (IV, Random, 95% CI) | 4.31 [3.20, 5.42] |
| 5.5 flexors speed 120 degrees per second | 2 | 60 | Mean Difference (IV, Random, 95% CI) | 9.12 [6.74, 11.51] |
| 6 Knee circumference Show forest plot | 1 | Mean Difference (IV, Fixed, 95% CI) | Totals not selected | |
| Outcome or subgroup title | No. of studies | No. of participants | Statistical method | Effect size |
| 1 Colorado score Show forest plot | 1 | Mean Difference (IV, Fixed, 95% CI) | Totals not selected | |
| 1.1 ankle | 1 | Mean Difference (IV, Fixed, 95% CI) | 0.0 [0.0, 0.0] | |
| 1.2 elbow | 1 | Mean Difference (IV, Fixed, 95% CI) | 0.0 [0.0, 0.0] | |
| 1.3 knee | 1 | Mean Difference (IV, Fixed, 95% CI) | 0.0 [0.0, 0.0] | |
| Outcome or subgroup title | No. of studies | No. of participants | Statistical method | Effect size |
| 1 Pain Show forest plot | 1 | Mean Difference (IV, Fixed, 95% CI) | Totals not selected | |
| 2 Range of motion Show forest plot | 1 | Mean Difference (IV, Fixed, 95% CI) | Totals not selected | |
| 2.1 flexion | 1 | Mean Difference (IV, Fixed, 95% CI) | 0.0 [0.0, 0.0] | |
| 2.2 extension | 1 | Mean Difference (IV, Fixed, 95% CI) | 0.0 [0.0, 0.0] | |