Related content
Related reviews and protocols
Usha Rani R Somaraju, Arturo Solis-Moya | 6 August 2020
Sze May Ng, Helen S Moore | 27 April 2021
Ian M Balfour-Lynn, Karen Welch, Sherie Smith | 4 July 2019
Karen A Robinson, Olaide A Odelola, Ian J Saldanha | 20 July 2016
Tomas C Jeffery, Anne B Chang, Louise S Conwell | 10 January 2023
Sherie Smith, Christopher T Edwards | 18 December 2017
Elinor F Burrows, Kevin W Southern, Peadar G Noone | 9 April 2014
Jayesh Bhatt, Nikki Jahnke, Alan R Smyth | 4 September 2019
Luke A Perry, Jahan C Penny‐Dimri, Aisha A Aslam, Tim WR Lee, Kevin W Southern | 17 June 2016
Katharine Cheng, Deborah Ashby, Rosalind L Smyth | 9 December 2015
![Forest plot of comparison: 2 ECM versus ECT, outcome: 2.2 Stool frequency [number/day].](/cdsr/doi/10.1002/14651858.CD008227.pub2/media/CDSR/CD008227/rel0002/CD008227/image_n/nCD008227-AFig-FIG01.png)
![Forest plot of comparison: 2 ECM versus ECT, outcome: 2.3 Abdominal pain [% days].](/cdsr/doi/10.1002/14651858.CD008227.pub2/media/CDSR/CD008227/rel0002/CD008227/image_n/nCD008227-AFig-FIG02.png)
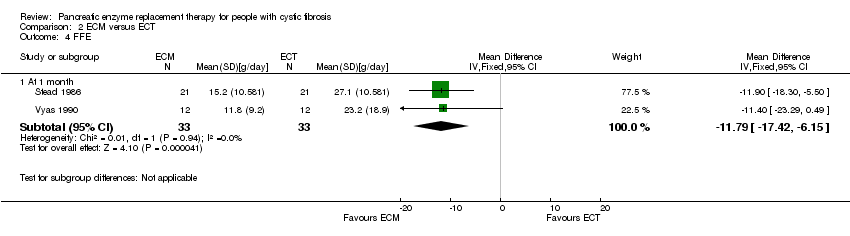
![Forest plot of comparison: 2 ECM versus ECT, outcome: 2.4 FFE [g/day].](/cdsr/doi/10.1002/14651858.CD008227.pub2/media/CDSR/CD008227/rel0002/CD008227/image_n/nCD008227-AFig-FIG03.png)