Plugs for containing faecal incontinence
Information
- DOI:
- https://doi.org/10.1002/14651858.CD005086.pub4Copy DOI

- Database:
-
- Cochrane Database of Systematic Reviews
- Version published:
-
- 20 July 2015see what's new
- Type:
-
- Intervention
- Stage:
-
- Review
- Cochrane Editorial Group:
-
Cochrane Incontinence Group
- Copyright:
-
- Copyright © 2015 The Cochrane Collaboration. Published by John Wiley & Sons, Ltd.
Article metrics
Altmetric:
Cited by:
Authors
Contributions of authors
The lead reviewer (MD) undertook additional literature searches and contacted authors and manufacturers for additional information when needed. The two reviewers (MD, AD) independently undertook the quality assessment of the trials and the data extraction. The lead reviewer entered the data. This was checked by the other reviewer (AD). Text until the discussion was drafted by the lead reviewer and checked by the other reviewer. Text starting with the discussion was checked by the lead reviewer and drafted by the other reviewer.
Sources of support
Internal sources
-
No sources of support supplied
External sources
-
National Institute for Health Research (NIHR), UK.
The National Institute for Health Research (NIHR) is the largest single funder of the Cochrane Incontinence.
Disclaimer:
The views and opinions expressed therein are those of the authors and do not necessarily reflect those of the NIHR, NHS or the Department of Health.
Declarations of interest
None known.
Acknowledgements
We are grateful to all members of the Cochrane Incontinence Group in Aberdeen (especially to June Cody and Sheila Wallace) for their assistance with the review. Thanks are also due to all authors and to suppliers of anal plugs for their cooperation. Finally we would like to thank Christine Norton for her useful comments on the protocol.
Version history
| Published | Title | Stage | Authors | Version |
| 2015 Jul 20 | Plugs for containing faecal incontinence | Review | Marije Deutekom, Annette C Dobben | |
| 2012 Apr 18 | Plugs for containing faecal incontinence | Review | Marije Deutekom, Annette C Dobben | |
| 2005 Jul 20 | Plugs for containing faecal incontinence | Review | Marije Deutekom, Annette C Dobben | |
| 2005 Jan 24 | Anal plugs for containing faecal incontinence | Protocol | M Deutekom, Annette C Dobben, Marije Deutekom MSc | |
Keywords
MeSH
Medical Subject Headings (MeSH) Keywords
Medical Subject Headings Check Words
Adult; Child; Humans;
PICOs
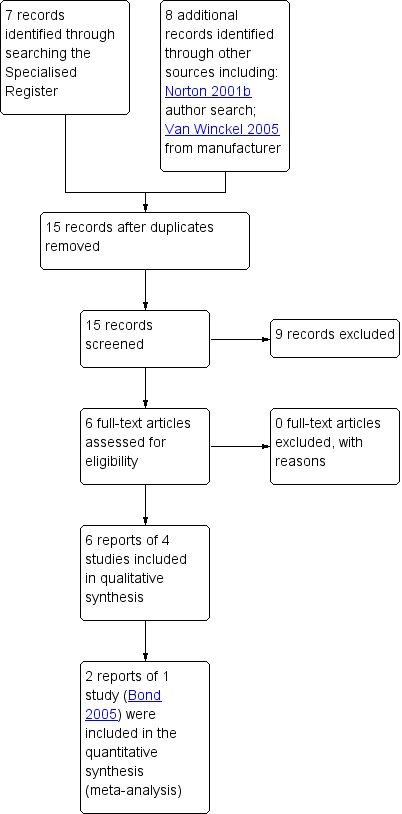
PRISMA study flow diagram.

Comparison 1 Anal plugs versus no plugs, Outcome 1 General health improved ‐ adults.

Comparison 1 Anal plugs versus no plugs, Outcome 2 Bodily pain improved ‐ adults.
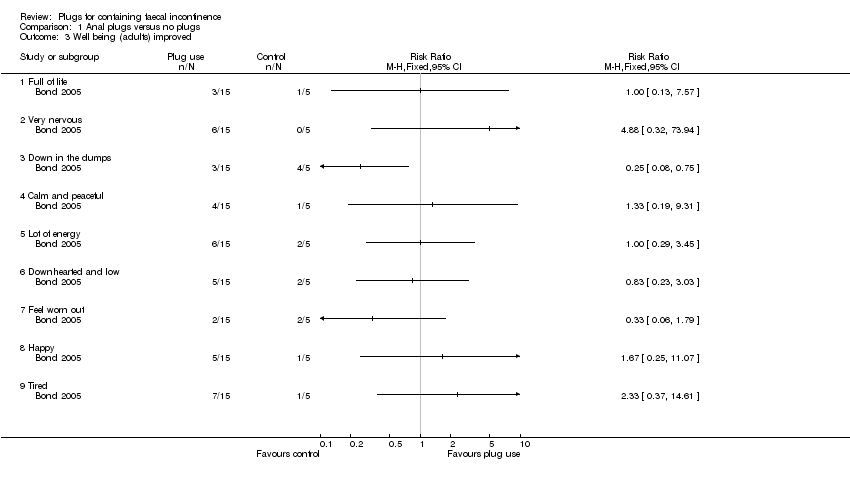
Comparison 1 Anal plugs versus no plugs, Outcome 3 Well being (adults) improved.

Comparison 1 Anal plugs versus no plugs, Outcome 4 Condition‐specific measures of faecal incontinence improved.
| Study | |
| Bond 2005 | No differences were observed between control and intervention group |
Comparison 1 Anal plugs versus no plugs, Outcome 5 Stool frequency.
| Study | |
| Bond 2005 | Little or no evidence that the plug led to significant reductions in the overall costs of care |
Comparison 1 Anal plugs versus no plugs, Outcome 6 Costs.
| Study | Anal plug period | Control period |
| Van Winckel 2005 | 6/12 | 0/12 |
Comparison 1 Anal plugs versus no plugs, Outcome 7 Achievement of pseudo‐continence.
| Study | Anal plug period | Control period |
| Van Winckel 2005 | 4/16 | 0/16 |
Comparison 1 Anal plugs versus no plugs, Outcome 8 Intolerance of intervention.
| Study | PU plug | PVA plug |
| Pfrommer 2000 | 15/23 | 14/23 |
Comparison 2 One type of anal plug versus another type, Outcome 1 Plug effectiveness: number of people with no soiling.
| Study | PU plug | PVA plug |
| Pfrommer 2000 | 16/23 | 10/23 |
Comparison 2 One type of anal plug versus another type, Outcome 2 Feeling of security.
| Study | PU plug | PVA plug |
| Pfrommer 2000 | 7/23 | 15/23 |
Comparison 2 One type of anal plug versus another type, Outcome 3 Loss of plug.
| Study | PU plug | PVA plug |
| Pfrommer 2000 | 9/23 | 16/23 |
Comparison 2 One type of anal plug versus another type, Outcome 4 Inconvenience.
| Study | PU plug | PVA plug |
| Pfrommer 2000 | 17/23 | 8/23 |
Comparison 2 One type of anal plug versus another type, Outcome 5 Overall satisfaction.
| Outcome or subgroup title | No. of studies | No. of participants | Statistical method | Effect size |
| 1 General health improved ‐ adults Show forest plot | 1 | Risk Ratio (M‐H, Fixed, 95% CI) | Totals not selected | |
| 2 Bodily pain improved ‐ adults Show forest plot | 1 | Risk Ratio (M‐H, Fixed, 95% CI) | Totals not selected | |
| 3 Well being (adults) improved Show forest plot | 1 | Risk Ratio (M‐H, Fixed, 95% CI) | Totals not selected | |
| 3.1 Full of life | 1 | Risk Ratio (M‐H, Fixed, 95% CI) | 0.0 [0.0, 0.0] | |
| 3.2 Very nervous | 1 | Risk Ratio (M‐H, Fixed, 95% CI) | 0.0 [0.0, 0.0] | |
| 3.3 Down in the dumps | 1 | Risk Ratio (M‐H, Fixed, 95% CI) | 0.0 [0.0, 0.0] | |
| 3.4 Calm and peaceful | 1 | Risk Ratio (M‐H, Fixed, 95% CI) | 0.0 [0.0, 0.0] | |
| 3.5 Lot of energy | 1 | Risk Ratio (M‐H, Fixed, 95% CI) | 0.0 [0.0, 0.0] | |
| 3.6 Downhearted and low | 1 | Risk Ratio (M‐H, Fixed, 95% CI) | 0.0 [0.0, 0.0] | |
| 3.7 Feel worn out | 1 | Risk Ratio (M‐H, Fixed, 95% CI) | 0.0 [0.0, 0.0] | |
| 3.8 Happy | 1 | Risk Ratio (M‐H, Fixed, 95% CI) | 0.0 [0.0, 0.0] | |
| 3.9 Tired | 1 | Risk Ratio (M‐H, Fixed, 95% CI) | 0.0 [0.0, 0.0] | |
| 4 Condition‐specific measures of faecal incontinence improved Show forest plot | 1 | Risk Ratio (M‐H, Fixed, 95% CI) | Totals not selected | |
| 4.1 Protection | 1 | Risk Ratio (M‐H, Fixed, 95% CI) | 0.0 [0.0, 0.0] | |
| 4.2 Rash/skin problems | 1 | Risk Ratio (M‐H, Fixed, 95% CI) | 0.0 [0.0, 0.0] | |
| 4.3 Unpleasant odour | 1 | Risk Ratio (M‐H, Fixed, 95% CI) | 0.0 [0.0, 0.0] | |
| 4.4 Staining/smearing | 1 | Risk Ratio (M‐H, Fixed, 95% CI) | 0.0 [0.0, 0.0] | |
| 4.5 Bowel movement in undergarments (last two weeks) | 1 | Risk Ratio (M‐H, Fixed, 95% CI) | 0.0 [0.0, 0.0] | |
| 4.6 Frequency of unpleasant odours | 1 | Risk Ratio (M‐H, Fixed, 95% CI) | 0.0 [0.0, 0.0] | |
| 4.7 Bowel movements in undergarments (on average day) | 1 | Risk Ratio (M‐H, Fixed, 95% CI) | 0.0 [0.0, 0.0] | |
| 4.8 Soiled/stained undergarment (on average day) | 1 | Risk Ratio (M‐H, Fixed, 95% CI) | 0.0 [0.0, 0.0] | |
| 4.9 Prevents staying away from home | 1 | Risk Ratio (M‐H, Fixed, 95% CI) | 0.0 [0.0, 0.0] | |
| 4.10 Must avoid long journeys | 1 | Risk Ratio (M‐H, Fixed, 95% CI) | 0.0 [0.0, 0.0] | |
| 4.11 Must always have a toilet nearby | 1 | Risk Ratio (M‐H, Fixed, 95% CI) | 0.0 [0.0, 0.0] | |
| 5 Stool frequency Show forest plot | Other data | No numeric data | ||
| 6 Costs Show forest plot | Other data | No numeric data | ||
| 7 Achievement of pseudo‐continence Show forest plot | Other data | No numeric data | ||
| 8 Intolerance of intervention Show forest plot | Other data | No numeric data | ||
| Outcome or subgroup title | No. of studies | No. of participants | Statistical method | Effect size |
| 1 Plug effectiveness: number of people with no soiling Show forest plot | Other data | No numeric data | ||
| 2 Feeling of security Show forest plot | Other data | No numeric data | ||
| 3 Loss of plug Show forest plot | Other data | No numeric data | ||
| 4 Inconvenience Show forest plot | Other data | No numeric data | ||
| 5 Overall satisfaction Show forest plot | Other data | No numeric data | ||