Sustained versus standard inflations during neonatal resuscitation to prevent mortality and improve respiratory outcomes
Abstract
Background
At birth, infants' lungs are fluid‐filled. For newborns to have a successful transition, this fluid must be replaced by air to enable gas exchange. Some infants are judged to have inadequate breathing at birth and are resuscitated with positive pressure ventilation (PPV). Giving prolonged (sustained) inflations at the start of PPV may help clear lung fluid and establish gas volume within the lungs.
Objectives
To assess the benefits and harms of an initial sustained lung inflation (SLI) (> 1 second duration) versus standard inflations (≤ 1 second) in newborn infants receiving resuscitation with intermittent PPV.
Search methods
We used the standard search strategy of Cochrane Neonatal to search the Cochrane Central Register of Controlled Trials (CENTRAL; 2019, Issue 3), MEDLINE via PubMed (1966 to 1 April 2019), Embase (1980 to 1 April 2019), and the Cumulative Index to Nursing and Allied Health Literature (CINAHL) (1982 to 1 April 2019). We also searched clinical trials databases, conference proceedings, and the reference lists of retrieved articles to identify randomised controlled trials and quasi‐randomised trials.
Selection criteria
Randomised controlled trials (RCTs) and quasi‐RCTs comparing initial sustained lung inflation (SLI) versus standard inflations given to infants receiving resuscitation with PPV at birth.
Data collection and analysis
We assessed the methodological quality of included trials using Cochrane Effective Practice and Organisation of Care Group (EPOC) criteria (assessing randomisation, blinding, loss to follow‐up, and handling of outcome data). We evaluated treatment effects using a fixed‐effect model with risk ratio (RR) for categorical data; and mean standard deviation (SD), and weighted mean difference (WMD) for continuous data. We used the GRADE approach to assess the quality of evidence.
Main results
Ten trials enrolling 1467 infants met our inclusion criteria. Investigators in nine trials (1458 infants) administered sustained inflation with no chest compressions. Use of sustained inflation had no impact on the primary outcomes of this review: mortality in the delivery room (typical RR 2.66, 95% confidence interval (CI) 0.11 to 63.40 (I² not applicable); typical RD 0.00, 95% CI −0.02 to 0.02; I² = 0%; 5 studies, 479 participants); and mortality during hospitalisation (typical RR 1.09, 95% CI 0.83 to 1.43; I² = 42%; typical RD 0.01, 95% CI −0.02 to 0.04; I² = 24%; 9 studies, 1458 participants). The quality of the evidence was low for death in the delivery room because of limitations in study design and imprecision of estimates (only one death was recorded across studies). For death before discharge the quality was moderate: with longer follow‐up there were more deaths (n = 143) but limitations in study design remained. Among secondary outcomes, duration of mechanical ventilation was shorter in the SLI group (mean difference (MD) −5.37 days, 95% CI −6.31 to −4.43; I² = 95%; 5 studies, 524 participants; low‐quality evidence). Heterogeneity, statistical significance, and magnitude of effects of this outcome are largely influenced by a single study at high risk of bias: when this study was removed from the analysis, the size of the effect was reduced (MD −1.71 days, 95% CI −3.04 to −0.39; I² = 0%). Results revealed no differences in any of the other secondary outcomes (e.g. risk of endotracheal intubation outside the delivery room by 72 hours of age (typical RR 0.91, 95% CI 0.79 to 1.04; I² = 65%; 5 studies, 811 participants); risk of surfactant administration during hospital admission (typical RR 0.99, 95% CI 0.91 to 1.08; I² = 0%; 9 studies, 1458 participants); risk of chronic lung disease (typical RR 0.99, 95% CI 0.83 to 1.18; I² = 0%; 4 studies, 735 participants); pneumothorax (typical RR 0.89, 95% CI 0.57 to 1.40; I² = 34%; 8 studies, 1377 infants); or risk of patent ductus arteriosus requiring pharmacological treatment (typical RR 0.99, 95% CI 0.87 to 1.12; I² = 48%; 7 studies, 1127 infants). The quality of evidence for these secondary outcomes was moderate (limitations in study design ‒ GRADE) except for pneumothorax (low quality: limitations in study design and imprecision of estimates ‒ GRADE). We could not perform any meta‐analysis in the comparison of the use of initial sustained inflation versus standard inflations in newborns receiving resuscitation with chest compressions because we identified only one trial for inclusion (a pilot study of nine preterm infants).
Authors' conclusions
Our meta‐analysis of nine studies shows that sustained lung inflation without chest compression was not better than intermittent ventilation for reducing mortality in the delivery room (low‐quality evidence ‒ GRADE) or during hospitalisation (moderate‐quality evidence ‒ GRADE), which were the primary outcomes of this review. However, the single largest study, which was well conducted and had the greatest number of enrolled infants, was stopped early for higher mortality rate in the sustained inflation group. When considering secondary outcomes, such as rate of intubation, rate or duration of respiratory support, or bronchopulmonary dysplasia, we found no benefit of sustained inflation over intermittent ventilation (moderate‐quality evidence ‒ GRADE). Duration of mechanical ventilation was shortened in the SLI group (low‐quality evidence ‒ GRADE); this result should be interpreted cautiously, however, as it might have been influenced by study characteristics other than the intervention. There is no evidence to support the use of sustained inflation based on evidence from our review.
PICOs
Plain language summary
Prolonged lung inflation for resuscitation of babies at birth
Review question
Does the use of prolonged (or sustained) lung inflation (> 1 second duration) rather than standard inflations (≤ 1 second) improve survival and other important outcomes among newly born babies receiving resuscitation at birth?
Background
At birth, the lungs are filled with fluid which must be replaced by air for babies to breathe properly. Some babies have difficulty establishing effective breathing at birth, and one in every 20 to 30 babies receives help to do so. A variety of devices are used to help babies begin normal breathing. Some of these devices allow caregivers to give long (or sustained) inflations. These sustained inflations may help inflate the lungs and may keep the lungs inflated better than if they are not used.
Study characteristics
We collected and analysed all relevant studies to answer the review question and found 10 studies enrolling 1467 infants. In all studies, babies were born before the due date (from 23 to 36 weeks of gestational age). The sustained inflation lasted between 15 and 20 seconds at pressure between 20 and 30 cmH₂O. Most studies provided one or more additional sustained inflations in cases of poor clinical response, for example persistent low heart rate. We analysed one study (which included only nine babies) separately because researchers combined use of sustained or standard inflations with chest compressions, an additional intervention that might help babies begin normal breathing.
Key results
The included studies showed no important differences among babies who received sustained versus standard inflations in terms of mortality, rate of intubation during the first three days of life, or chronic lung disease. Babies receiving sustained inflation at birth may spend fewer days on mechanical ventilation. The results of several ongoing studies might help us to determine whether sustained inflations are beneficial or harmful. At present we cannot exclude small to moderate differences between the two treatments.
Quality of evidence
The quality of evidence is low to moderate because only a small number of studies have looked at this intervention, few babies were included in these studies and some studies could have been better designed.
How up to date is this review?
We searched for studies that had been published up to April 2019.
Authors' conclusions
Summary of findings
| Use of initial sustained inflation compared to standard inflations in newborns receiving resuscitation with no chest compressions during resuscitation | ||||||
| Population: preterm infants resuscitated by PPV at birth | ||||||
| Outcomes | Illustrative comparative risks* (95% CI) | Relative effect | No. of participants | Quality of the evidence | Comments | |
| Assumed risk | Corresponding risk | |||||
| Standard inflations in newborns receiving resuscitation with no chest compressions | Use of initial sustained inflation | |||||
| Death ‒in the delivery room | Study population | RR 2.66 | 479 | ⊕⊕⊝⊝ | ||
| 0 per 1000 | 0 per 1000 | |||||
| Medium risk population | ||||||
| 0 per 1000 | 0 per 1000 | |||||
| Death ‒before discharge | Study population | RR 1.09 | 1458 | ⊕⊕⊕⊝ | ||
| 112 per 1000 | 122 per 1000 | |||||
| Medium risk population | ||||||
| 58 per 1000 | 63 per 1000 | |||||
| Rate of mechanical ventilation | Study population | RR 0.89 | 910 | ⊕⊕⊕⊝ | ||
| 461 per 1000 | 410 per 1000 | |||||
| Medium risk population | ||||||
| 439 per 1000 | 391 per 1000 | |||||
| Chronic lung disease ‒any grade | Study population | RR 0.98 | 1418 | ⊕⊕⊕⊝ | ||
| 340 per 1000 | 333 per 1000 | |||||
| Medium risk population | ||||||
| 211 per 1000 | 207 per 1000 | |||||
| Chronic lung disease ‒moderate to severe BPD | Study population | RR 0.95 | 683 | ⊕⊕⊕⊝ | ||
| 257 per 1000 | 244 per 1000 | |||||
| Medium risk population | ||||||
| 211 per 1000 | 200 per 1000 | |||||
| Pneumothorax | Study population | RR 0.89 | 1458 | ⊕⊕⊝⊝ | ||
| 52 per 1000 | 46 per 1000 | |||||
| Medium risk population | ||||||
| 50 per 1000 | 44 per 1000 | |||||
| Cranial ultrasound abnormalities ‒Intraventricular haemorrhage grade 3 to 4 | Study population | RR 0.85 | 735 | ⊕⊕⊝⊝ | ||
| 116 per 1000 | 99 per 1000 | |||||
| Medium risk population | ||||||
| 54 per 1000 | 46 per 1000 | |||||
| *The basis for the assumed risk (e.g. the median control group risk across studies) is provided in footnotes. The corresponding risk (and its 95% CI) is based on the assumed risk in the comparison group and the relative effect of the intervention (and its 95% CI). | ||||||
| GRADE Working Group grades of evidence | ||||||
| 1 all studies at high or unclear risk of bias in at least one domain (lack of blinding) and 1 study stopped early | ||||||
| Use of initial sustained inflation for | ||||||
| Population: infants below 33 weeks of postmenstrual age who required resuscitation in the delivery room | ||||||
| Outcomes | Illustrative comparative risks* (95% CI) | Relative effect | No. of participants | Quality of the evidence | Comments | |
| Assumed risk | Corresponding risk | |||||
| Control | Use of initial sustained inflation | |||||
| Death ‒in the delivery room | See comment | See comment | not reported | 9 (1 study) | The included study did not report on this outcome | |
| Death ‒before discharge | Study population | RR 4.17 | 9 | ⊝⊝⊝⊝ | ||
| 0 per 1000 | 0 per 1000 | |||||
| Medium risk population | ||||||
| 0 per 1000 | 0 per 1000 | |||||
| Rate of mechanical ventilation | See comment | See comment | not reported | 9 (1 study) | The included study did not report on this outcome | |
| Chronic lung disease ‒any grade | See comment | See comment | not reported | 9 (1 study) | The included study did not report on this outcome | |
| Chronic lung disease ‒moderate to severe BPD | Study population | RR 0.89 | 7 | ⊝⊝⊝⊝ | ||
| 750 per 1000 | 668 per 1000 | |||||
| Medium risk population | ||||||
| 750 per 1000 | 668 per 1000 | |||||
| Pneumothorax ‒at any time | See comment | See comment | Not estimable | 9 | ⊝⊝⊝⊝ | No events |
| Cranial ultrasound abnormalities ‒intraventricular haemorrhage grade 3 to 4 | Study population | RR 0.4 | 9 | ⊝⊝⊝⊝ | ||
| 500 per 1000 | 200 per 1000 | |||||
| Medium risk population | ||||||
| 500 per 1000 | 200 per 1000 | |||||
| *The basis for the assumed risk (e.g. the median control group risk across studies) is provided in footnotes. The corresponding risk (and its 95% CI) is based on the assumed risk in the comparison group and the relative effect of the intervention (and its 95% CI). | ||||||
| GRADE Working Group grades of evidence | ||||||
| 1 Limitations in study design: downgraded by 1 level due to included study at high or unclear risk of bias in 4 domains | ||||||
Background
Description of the condition
At birth, infants' lungs are filled with fluid which must be cleared for effective respiration to occur. Most newly born infants achieve this spontaneously and may use considerable negative pressure (up to −50 cmH₂O) for initial inspirations (Karlberg 1962; Milner 1977). However, it is estimated that 3% to 5% of newly born infants receive some help to breathe at delivery (Saugstad 1998). Adequate ventilation is the key to successful neonatal resuscitation and stabilisation (Wyckoff 2015). Positive pressure ventilation (PPV) is recommended for infants who have absent or inadequate respiratory efforts or bradycardia (or both) at birth (Wyckoff 2015). Use of manual ventilation devices — self‐inflating bags, flow‐inflating (or anaesthetic) bags, and T‐piece devices — with a face mask or endotracheal tube (ETT) is advised. Although it is not included in the International Liaison Committee on Resuscitation (ILCOR) guidelines, respiratory support of infants in the delivery room with a mechanical ventilator and a nasopharyngeal tube has been described (Lindner 1999).
Description of the intervention
Devices recommended for PPV in the delivery room differ in terms of physical characteristics and ability to deliver sustained lung inflation (SLI). The most commonly used self‐inflating bag may be of insufficient size to support sustained inflation (> 1 second) (O'Donnell 2004a; O'Donnell 2004b). Both flow‐inflating bags and T‐pieces may be used to consistently deliver inflations of more than one second. In addition, many of the self‐inflating bags are unsatisfactory at delivering an appropriate volume mainly because of serious leaks in the valves of the bags (Tracy 2019). Although target inflation pressures and long inspiratory times are achieved more consistently in mechanical models when T‐piece devices rather than bags are used, no recommendation can be made as to which device is preferable (Wyckoff 2015; Wyllie 2015). Positive end‐expiratory pressure (PEEP) is very important for aerating the lungs and improving oxygenation; SLI consists of prolonged high‐level PEEP or, more precisely, a prolonged peak inflation pressure.
How the intervention might work
When airways are filled with liquid, it might be unnecessary to interrupt inflation pressures to allow the lung to deflate and exhale CO₂ (Hooper 2016). Boon 1979 described a study of 20 term infants delivered by Caesarean section under general anaesthesia who were resuscitated with a T‐piece via an ETT. Study authors reported that gas continued to flow through the flow sensor placed between the T‐piece and the ETT toward the infant at the end of a standard inflation of one second on respiratory traces obtained (Boon 1979). On the basis of this observation, this group performed a non‐randomised trial of sustained inflations given via a T‐piece and an ETT to nine term infants during delivery room resuscitation. Investigators reported that initial inflation with a T‐piece lasting five seconds produced a two‐fold increase in inflation volume compared with standard resuscitation techniques (Vyas 1981). Citing these findings, a retrospective cohort study described the effects of a change in management strategy for extremely low birth weight infants in the delivery room (Lindner 1999). The new management strategy included the introduction of an initial sustained inflation of 15 seconds obtained with a mechanical ventilator via a nasopharyngeal tube. This change in strategy was associated with a reduction in the proportion of infants intubated for ongoing respiratory support without an apparent increase in adverse outcomes. Pulmonary morbidity in very low birth weight infants was reported to be related directly to mortality in 50% of cases of death (Drew 1982). Moreover, multiple SLIs in very preterm infants improved both heart rate and cerebral tissue oxygen saturation, in the absence of any detrimental effects (Fuchs 2011). An observational study showed that sustained inflation of 10 seconds at 25 cmH₂O in 70 very preterm infants at birth was not effective for infants who were not breathing, possibly owing to active glottic adduction (van Vonderen 2014). Newly born infants frequently take a breath and then prolong expiration via glottic closure and diaphragmatic braking, giving themselves prolonged end‐expiratory pressure.
Why it is important to do this review
Recommendations regarding use of sustained inflation at birth have varied between international bodies. Although European Resuscitation Council guidelines suggest giving five inflation breaths if the newborn is gasping or is not breathing (Wyllie 2015), the American Heart Association states that evidence is insufficient to recommend an optimum inflation time (Wyckoff 2015). Differences between these guidelines and their algorithms are intriguing (Klingenberg 2016). A narrative review reported that sustained inflation may reduce the need for mechanical ventilation among preterm infants at risk for respiratory distress syndrome (RDS) (Lista 2010). The same review showed that respiratory outcomes among infants receiving sustained inflation (25 cmH₂O for 15 seconds) were improved over those reported for an historical group (Lista 2011).
Our previous review 'Sustained versus standard inflations during neonatal resuscitation to prevent mortality and improve respiratory outcomes' included eight trials enrolling 941 (Bruschettini 2017). Sustained inflation was not better than intermittent ventilation for reducing mortality, need for intubation, need for or duration of respiratory support, or bronchopulmonary dysplasia. The quality of evidence for these outcomes was low to moderate. This version updated the previous review which was published in the Cochrane Database of Systematic Reviews in 2017 (Bruschettini 2017).
Objectives
To assess the benefits and harms of an initial sustained lung inflation (SLI) (> 1 second duration) versus standard inflations (≤ 1 second) in newborn infants receiving resuscitation with intermittent PPV.
Methods
Criteria for considering studies for this review
Types of studies
We included randomised controlled trials (RCTs) and quasi‐RCTs. We excluded observational studies (case‐control studies, case series) and cluster‐RCTs.
Types of participants
Term and preterm infants resuscitated via PPV at birth.
Types of interventions
Interventions included resuscitation with initial sustained (> 1 second) inflation versus resuscitation with regular (≤ 1 second) inflations:
-
with no chest compressions as part of the initial resuscitation; or
-
with chest compressions as part of the initial resuscitation.
Types of outcome measures
Primary outcomes
-
Death in the delivery room
-
Death during hospitalisation
-
Death to latest follow‐up
Secondary outcomes
-
Heart rate at 5 minutes
-
Endotracheal intubation in the delivery room
-
Endotracheal intubation in the first 72 hours of age
-
Surfactant administration in the delivery room or during hospital admission
-
Mechanical ventilation (yes/no)
-
Duration in hours of respiratory support (i.e. nasal continuous airway pressure and ventilation via an ETT considered separately and in total)
-
Duration in days of supplemental oxygen requirement
-
Chronic lung disease: rate of supplemental oxygen at 28 days of age; rate of supplemental oxygen at 36 weeks' postmenstrual age for infants born at or before 32 weeks of gestation
-
Air leaks (pneumothorax, pneumomediastinum, pneumopericardium, pulmonary interstitial emphysema) reported individually or as a composite outcome
-
Cranial ultrasound abnormalities: any intraventricular haemorrhage (IVH), grade 3 or 4 according to the Papile classification (Papile 1978), and cystic periventricular leukomalacia
-
Seizures including clinical and electroencephalographic
-
Hypoxic‐ischaemic encephalopathy for term and late preterm infants (grade 1 to 3 (Sarnat 1976))
-
Long‐term neurodevelopmental outcomes (rates of cerebral palsy on physician assessment, developmental delay (i.e. intelligence quotient (IQ) 2 standard deviations (SDs) < mean on validated assessment tool (e.g. Bayley's Mental Developmental Index))
-
Retinopathy of prematurity (ROP) (all stages and ≥ stage 3)
-
Patent ductus arteriosus (PDA) (pharmacological treatment and surgical ligation)
Search methods for identification of studies
We used the criteria and standard methods of Cochrane and Cochrane Neonatal (see the Cochrane Neonatal search strategy for specialised register).
Electronic searches
We conducted a comprehensive search that included the Cochrane Central Register of Controlled Trials (CENTRAL; 2019, Issue 3) in the Cochrane Library; MEDLINE via PubMed (1966 to 1 April 2019); Embase (1980 to 1 April 2019); and the Cumulative Index to Nursing and Allied Health Literature (CINAHL) (1982 to 1 April 2019). See Appendix 1 for full search strategy for each database. We did not apply language restrictions.
We searched clinical trials registries for ongoing and recently completed trials (ClinicalTrials.gov; the World Health Organization International Trials Registry and Platform ‒ www.whoint/ictrp/search/en; and the ISRCTN Registry).
Searching other resources
We also searched abstracts of the Pediatric Academic Society (PAS) from 2000 to 2019, electronically through the PAS website, using the following key words: "sustained inflation" AND "clinical trial".
Data collection and analysis
We used the standard methods of Cochrane Neonatal.
Selection of studies
For this update, two review authors (MB, MGC) independently screened all titles and abstracts to determine which trials met the inclusion criteria. We retrieved full‐text copies of all papers that were potentially relevant. We resolved disagreements by discussion between review authors.
Data extraction and management
Two review authors (MB, MGC) independently undertook data abstraction using a data extraction form developed ad hoc and integrated with a modified version of the Cochrane Effective Practice and Organisation of Care Group (EPOC) data collection checklist (EPOC 2015).
We extracted the following characteristics from each included trial.
-
Administrative details: study author(s); published or unpublished; year of publication; year in which trial was conducted; details of other relevant papers cited.
-
Trial details: study design; type, duration, and completeness of follow‐up; country and location of study; informed consent; ethics approval.
-
Details of participants: birth weight; gestational age; number of participants.
-
Details of intervention: type of ventilation device used; type of interface; duration and level of pressure of sustained lung inflation (SLI).
-
Details of outcomes: death during hospitalisation or to latest follow‐up; heart rate at 5 minutes; duration in hours of respiratory support; duration in days of supplemental oxygen requirement; long‐term neurodevelopmental outcomes; any adverse events.
We resolved disagreements by discussion between review authors. When available, we described ongoing trials identified by detailing primary trial author, research question(s) posed, and methods and outcome measures applied, together with an estimate of the reporting date.
When queries arose or additional data were required, we contacted trial authors.
Assessment of risk of bias in included studies
Two review authors (MB, MGC) independently assessed risk of bias (low, high, or unclear) of all included trials for the following domains using the Cochrane ‘Risk of bias’ tool (Higgins 2011).
-
Sequence generation (selection bias).
-
Allocation concealment (selection bias).
-
Blinding of participants and personnel (performance bias).
-
Blinding of outcome assessment (detection bias).
-
Incomplete outcome data (attrition bias).
-
Selective reporting (reporting bias).
-
Any other bias.
We resolved disagreements by discussion or via consultation with a third assessor. See Appendix 2 for a detailed description of risk of bias for each domain.
Selection bias (random sequence generation and allocation concealment)
Random sequence generation
For each included trial, we categorised risk of bias regarding random sequence generation as follows.
-
Low risk ‒ adequate (any truly random process, e.g. random number table; computer random number generator).
-
High risk ‒ inadequate (any non‐random process, e.g. odd or even date of birth; hospital or clinic record number).
-
Unclear risk ‒ no or unclear information provided.
Allocation concealment
For each included trial, we categorised risk of bias regarding allocation concealment as follows.
-
Low risk ‒ adequate (e.g. telephone or central randomisation; consecutively numbered sealed opaque envelopes).
-
High risk ‒ inadequate (open random allocation; unsealed or non‐opaque envelopes, alternation; date of birth).
-
Unclear risk ‒ no or unclear information provided.
Performance bias
Owing to the nature of the intervention, all trials were unblinded, leading to high risk of performance bias.
Detection bias
For each included trial, we categorised the methods used to blind outcome assessors from knowledge of which intervention a participant received. We assessed blinding separately for different outcomes or different classes of outcomes.
Attrition bias
For each included trial and for each outcome, we described completeness of data including attrition and exclusions from analysis. We noted whether attrition and exclusions were reported, numbers included in the analysis at each stage (compared with the total number of randomised participants), reasons for attrition or exclusion when reported, and whether missing data were balanced across groups or were related to outcomes.
Reporting bias
For each included trial, we described how we investigated the risk of selective outcome reporting bias and what we found. We assessed methods as follows.
-
Low risk ‒ adequate (when it is clear that all of a trial's prespecified outcomes and all expected outcomes of interest to the review have been reported).
-
High risk ‒ inadequate (when not all of a trial's prespecified outcomes have been reported; one or more reported primary outcomes were not prespecified; outcomes of interest were reported incompletely and so cannot be used; or the trial failed to include results of a key outcome that would have been expected to be reported).
-
Unclear risk ‒ no or unclear information provided (study protocol was not available).
Other bias
For each included trial, we described any important concerns that we had about other possible sources of bias (e.g. whether a potential source of bias was related to the specific trial design, whether the trial was stopped early owing to some data‐dependent process). We assessed whether each trial was free of other problems that could put it at risk of bias as follows.
-
Low risk ‒ no concerns of other bias raised.
-
High risk ‒ concerns raised about multiple looks at data with results made known to investigators, differences in numbers of participants enrolled in abstract, and final publications of the paper.
-
Unclear ‒ concerns raised about potential sources of bias that could not be verified by contacting trial authors.
We did not score blinding of the intervention because this was not applicable.
One review author entered data into RevMan Web, and a second review author checked entered data for accuracy.
Measures of treatment effect
We conducted measures of treatment effect data analysis using RevMan Web. We determined outcome measures for dichotomous data (e.g. death, endotracheal intubation in the delivery room, frequency of retinopathy) as risk ratios (RRs) with 95% confidence intervals (CIs). We calculated continuous data (e.g. duration of respiratory support, Apgar score) using mean differences (MDs) and SDs.
Unit of analysis issues
The unit of randomisation was the intended unit of analysis (individual neonate).
Dealing with missing data
We contacted trial authors to request missing data when needed.
Assessment of heterogeneity
As a measure of consistency, we used the I² statistic and the Q (Chi²) test (Deeks 2011). We judged statistical significance of the Q (Chi²) statistic by P < 0.10 because of the low statistical power of the test. We used the following cut‐offs for heterogeneity: less than 25% no heterogeneity; 25% to 49% low heterogeneity; 50% to 74% moderate heterogeneity; and ≥ 75% high heterogeneity (Higgins 2003). We combined trial results using the fixed‐effect model, regardless of statistical evidence of heterogeneity effect sizes.
Assessment of reporting biases
See Appendix 2.
Data synthesis
We performed statistical analyses using RevMan Web. We used the standard methods of the Cochrane Neonatal Review Group. For categorical data, we used RRs, relative risk reductions, and absolute risk difference (RDs). We obtained means and SDs for continuous data and performed analyses using MDs and WMDs when appropriate. We calculated 95% CIs. We presented the number needed to treat for an additional beneficial outcome (NNTB) and the number needed to treat for an additional harmful outcome (NNTH), as appropriate. For each comparison reviewed, meta‐analysis could be feasible if we identified more than one eligible trial, and if homogeneity among trials was sufficient with respect to participants and interventions. We combined trials using the fixed‐effect model, regardless of statistical evidence of heterogeneity effect sizes. For estimates of RR and RD, we used the Mantel‐Haenszel method.
Subgroup analysis and investigation of heterogeneity
We planned to perform the following subgroup analyses of the safety and efficacy of sustained inflation during resuscitation in subgroups.
-
Term (≥ 37 weeks of gestation) and preterm (< 37 weeks of gestation) infants.
-
Type of ventilation device used (self‐inflating bag, flow‐inflating bag, T‐piece, mechanical ventilator).
-
Interface used (i.e. face mask, ETT, nasopharyngeal tube).
-
Duration of sustained lung inflation (i.e. > 1 second to 5 seconds, > 5 seconds).
Sensitivity analysis
We planned to conduct sensitivity analyses to explore effects of the methodological quality of trials and check to ascertain whether studies with high risk of bias overestimated treatment effects.
Summary of findings and assessment of the certainty of the evidence
We used GRADE approach, as outlined in the GRADE Handbook (Schünemann 2013), to assess the quality of evidence for the following (clinically relevant) outcomes: death in the delivery room or during hospitalisation; endotracheal intubation in the delivery room or outside the delivery room during hospitalisation; surfactant administration in the delivery room or during hospital admission; rate of mechanical ventilation; chronic lung disease; air leaks; and cranial ultrasound abnormalities.
Two review authors independently assessed the quality of evidence for each of the outcomes above. We considered evidence from RCTs as high quality but downgraded evidence one level for serious (or two levels for very serious) limitations on the basis of the following: design (risk of bias), consistency across studies, directness of evidence, precision of estimates, and presence of publication bias. We used the GRADEpro GDT Guideline Development Tool to create a ‘Summary of findings’ table to report the quality of evidence.
The GRADE approach yields an assessment of the quality of a body of evidence according to one of four grades.
-
High: We are very confident that the true effect lies close to that of the estimate of the effect.
-
Moderate: We are moderately confident in the effect estimate: The true effect is likely to be close to the estimate of the effect, but there is a possibility that it is substantially different.
-
Low: Our confidence in the effect estimate is limited: The true effect may be substantially different from the estimate of the effect.
-
Very low: We have very little confidence in the effect estimate: The true effect is likely to be substantially different from the estimate of effect.
Results
Description of studies
We have provided results of the search for this review update in the study flow diagram (Figure 1).
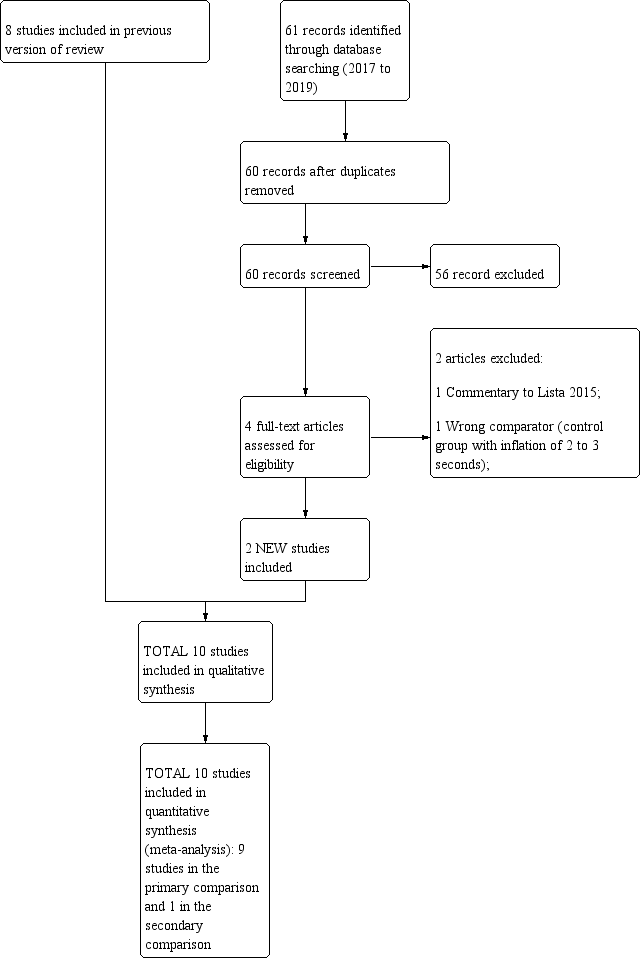
Study flow diagram: review update.
Results of the search
See summary of findings Table for the main comparison, summary of findings Table 2, Characteristics of included studies,Characteristics of excluded studies, and Characteristics of ongoing studies sections for details.
Included studies
Ten trials that recruited 1467 infants (768 in SLI groups, 699 in control groups) met the inclusion criteria (Abd 2017; El‐Chimi 2017; Jiravisitkul 2017; Kirpalani 2019; Lindner 2005; Lista 2015; Mercadante 2016; Ngan 2017; Schmölzer 2018; Schwaberger 2015). We pooled nine trials (with 1458 infants) in the comparison of the use of initial sustained inflation versus standard inflations in newborns receiving resuscitation with no chest compressions (Comparison 1) (Abd 2017; El‐Chimi 2017; Jiravisitkul 2017; Kirpalani 2019; Lindner 2005; Lista 2015; Mercadante 2016; Ngan 2017; Schwaberger 2015; see summary of findings Table for the main comparison). In contrast to other trials, Schwaberger 2015 sought to use near‐infrared spectroscopy (NIRS) to investigate whether SLI affected physiological changes in cerebral blood volume and oxygenation.
We could not perform any meta‐analysis in the comparison of the use of initial sustained inflation versus standard inflations in newborns receiving resuscitation with chest compressions because we identified only one trial for inclusion (a pilot study of 9 preterm infants) (Schmölzer 2018, see summary of findings Table 2).
We have listed characteristics of populations and interventions and comparisons of the 10 trials under Characteristics of included studies and in Table 1.
| Trial (no. infants) | Antenatal steroids | Gestational age, weeks | Birth weight, grams | Device/Interface | Interventions/Controls | ||||
| SLI | Control | SLI | Control | SLI | Control | SLI and control | SLI | Control | |
| Abd 2017 (100) | 70% to 80% | 55% | 29.3 to 29.7 | 29.4 (SD 2.1) | 1363 to 1367 | mean 1249 (SD 363) | T‐piece | 4 different arms: PIP of either 15 or 20 cmH₂O for either 10 or 20 seconds | PEEP 5 cmH₂O, oxygen 30% |
| El‐Chimi 2017 (112) | 39% | 34.5% | mean 31.1 (SD 1.7) | mean 31.3 (SD 1.7) | mean 1561 (SD 326) | mean 1510 (SD 319) | Mask and T‐piece in SLI group Mask and self‐inflating bag with an oxygen reservoir in control group | PIP of 20 cmH₂O for 15 seconds, followed by PEEP of 5 cmH₂O If needed: a second SLI of 15 seconds of 25 cmH₂O for 15 seconds, followed by PEEP of 6 cmH₂O; then a third SLI of 15 seconds of 30 cmH₂O for 15 seconds, followed by PEEP of 7 cmH₂O If still not satisfactory: intubated in delivery room | PIP maximum 40 cmH₂O, rate of 40 to 60 breaths/min for 30 seconds |
| Jiravisitkul 2017 (81) | 63% | 74% | 25 to 28 weeks: 29 to 32 weeks: | 25 to 28 weeks: 29 to 32 weeks: | mean 1206 (SD 367) | mean 1160 (SD 411) | Mask and T‐piece | PIP of 25 cmH₂O for 15 seconds If HR 60 to 100 beats/min and/or poor respiratory effort: a second SLI (25 cmH₂O, 15 seconds) | PIP 15 to 20 cmH₂O, PEEP 5 cmH₂O for 30 seconds, followed by resuscitation according to AHA guidelines |
| Kirpalani 2019 (426) | 97% | 97% | 23 to 24 weeks: n = 76; 25 to 26 weeks: | 23 to 24 weeks: n = 75; 25 to 26 weeks: | median 725 (IQR 620 to 855) | median 731 (IQR 630 to 854) | Either mask or a nasopharyngeal tube (as unit protocol dictated) and T‐piece resuscitator | PIP of 20 cmH₂O for 15 seconds. If needed: a second SLI of 15 seconds of 25 cmH₂O | PIP with PEEP |
| Lindner 2005 (61) | 81% | 80% | median 27.0 (IQR 25.0 to 28.9) | median 26.7 (IQR 25.0 to 28.9) | median 870 (IQR 410 to 1320) | median 830 (IQR 370 to 1370) | Nasopharyngeal tube (fixed at 4 to 5 cm) and mechanical ventilator | PIP of 20 cmH₂O for 15 seconds If response was not satisfactory: 2 further SLIs of 15 seconds (25 and 30 cmH₂O). Then PEEP at 4 to 6 cmH₂O | PIP 20 cmH₂O, PEEP 4 to 6 cmH₂O; inflation time 0.5 seconds; inflation rate 60 per min. Then, PEEP at 4 to 6 cmH₂O |
| Lista 2015 (301) | 87% | 91% | mean 26.8 (SD 1.2); 25 to 26 weeks: 27 to 28 weeks: | mean 26.8 (SD 1.1); 25 to 26 weeks: 27 to 28 weeks: | mean 894 (SD 247) | mean 893 (SD 241) | Mask and T‐piece | PIP 25 cmH₂O for 15 seconds. Then reduced to PEEP of 5 cmH₂O | PEEP 5 cmH₂O, followed by resuscitation according to AHA guidelines |
| Mercadante 2016 (185) | 40% | 32% | mean 35.2 (SD 0.8) | mean 35.2 (SD 0.8) | mean 2345 (SD 397) | mean 2346 (SD 359) | Mask and T‐piece | PIP 25 cmH₂O for 15 seconds, followed by PEEP of 5 cmH₂O. In case of persistent heart failure (HR < 100 bpm): SLI repeated | PEEP 5 cmH₂O, followed by resuscitation according to AAP guidelines |
| Ngan 2017 (162) | 78% | 70% | mean 28 (SD 2.5) | mean 28 (SD 2.5) | mean 1154 (SD 426) | mean 1140 (SD 406) | Mask and T‐piece | Two PIPs of 24 cmH₂O. Duration of first SLI was 20 seconds. Duration of second SLI was 20 or 10 seconds, guided by ECO₂ values. After SLIs, CPAP if breathing spontaneously or, if found to have apnoea or laboured breathing, mask IPPV at a rate of 40 to 60 bpm | IPPV, rate of 40 to 60 inflations/min until spontaneous breathing, at which time CPAP will be provided |
| Schmölzer 2018 (9) | 80%a | 100%a | mean 24.6 (SD 1.3)a | mean 25.6 (SD 2.3)a | mean 707 (SD 208)a | mean 808 (SD 192)a | Mask and T‐piecea | PIP for 20 + 20 secondsa during chest compressions | 3:1 compression:ventilation ratio according to resuscitation guidelines |
| Schwaberger 2015 (40) | not reported | not reported | mean 32.1 (SD 1.4) | mean 32.1 (SD 1.6) | mean 1692 (SD 297) | mean 1722 (SD 604) | Mask and T‐piece | PIP 30 cmH₂O for 15 seconds, to be repeated once or twice with HR remaining < 100 bpm. Infants with HR > 100 bpm: PPV at 30 cmH₂O PIP or CPAP at PEEP level of 5 cmH₂O depending on respiratory rate | Resuscitation according to AHA guidelines PEEP 5 cmH₂O if respiratory rate > 30 and signs of respiratory distress PPV at 30 cmH₂O PIP if insufficient breathing efforts |
aInformation provided by study authors
Settings and populations
Researchers conducted the included studies on five different continents: two in Italy (Lista 2015; Mercadante 2016); two in Canada by the same contact author (Ngan 2017; Schmölzer 2018); two in Egypt (Abd 2017; El‐Chimi 2017); one in Germany (Lindner 2005); one in Austria (Schwaberger 2015); one in Thailand (Jiravisitkul 2017); and one international multicentre (Kirpalani 2019) conducted in 18 neonatal intensive care units in nine countries (USA, Australia, the Netherlands, Canada, Germany, Italy, Austria, South Korea, and Singapore). Two studies were conducted at multiple centres (Kirpalani 2019; Lista 2015). Six of the 10 trials included infants with mean birth weight of more than 1 kg (Abd 2017; El‐Chimi 2017; Jiravisitkul 2017; Mercadante 2016; Ngan 2017; Schwaberger 2015), whereas three included studies enrolled extremely low birth weight infants (Kirpalani 2019; Lindner 2005; Lista 2015), as did the pilot trial (Schmölzer 2018). Mercadante 2016 was the only trial conducted in late preterm infants. No trials enrolled full‐term infants. Table 1 shows additional information on populations.
Interventions
Trials pooled in Comparison one (i.e. without chest compressions) reported that peak inspiratory pressure (PIP) was sustained for 15 seconds in seven trials (El‐Chimi 2017; Jiravisitkul 2017; Kirpalani 2019; Lindner 2005; Lista 2015; Mercadante 2016; Schwaberger 2015); and for 20 seconds in Ngan 2017. However, levels of PIP ranged from 20 cmH₂O (El‐Chimi 2017; Kirpalani 2019; Lindner 2005) to 24 (Ngan 2017), 25 (Jiravisitkul 2017; Lista 2015; Mercadante 2016), and 30 cmH₂O (Schwaberger 2015). Investigators provided additional SLIs in cases of poor response, with the same (Jiravisitkul 2017; Mercadante 2016; Schwaberger 2015) or higher PIP (El‐Chimi 2017; Kirpalani 2019; Lindner 2005); researchers in Ngan 2017 based the duration of the second SLI on exhaled CO₂ values. One study consisted of five groups: PIP of either 15 or 20 cmH₂O for either 10 or 20 seconds; control arm with PEEP 5 cmH₂O, oxygen 30% (Abd 2017). As regards interface and ventilation devices, most included trials used mask and T‐piece. Lindner 2005 used nasopharyngeal tube and ventilator, however, and El‐Chimi 2017 introduced a relevant bias into the study design by using a T‐piece ventilator in the SLI group and a self‐inflating bag in the control group (mask in both SLI and control groups). No trials reported whether prespecified levels of pressure for the SLI were actually delivered according to the protocol. Study authors did not monitor leaks at the mask and lung volumes during the manoeuvre. Whether the infant breathed before or during the SLI was not recorded: apnoeic newborns at birth are known to show less gain in lung volume during an SLI than actively breathing infants (Lista 2017).
For Comparison 2, in which infants in both SLI and control groups were resuscitated with chest compressions, duration of SLI was 20 + 20 seconds (Schmölzer 2018).
Table 1 shows additional information on interventions.
Excluded studies
We have summarised the reasons for exclusion of potentially eligible trials in the Characteristics of excluded studies table (Bouziri 2011; Gupta 2017; Harling 2005; Hunt 2019; te Pas 2007).
In particular, we excluded te Pas 2007 because sustained inflation was only one element of the intervention, and because it is not possible to determine the relative contributions of various elements of this intervention to differences observed between groups. We excluded Harling 2005, as investigators randomised infants in this trial to receive inflation for 2 seconds or 5 seconds at initiation of PPV. Similarly, in Hunt 2019 the duration of inflation in the control group was 2 to 3 seconds. All infants thus received sustained (> 1 second) inflations as defined in our protocol (O'Donnell 2004).
Risk of bias in included studies
We have presented a summary of the 'Risk of bias' assessment in Figure 2 and Figure 3. We have provided details of the methodological quality of included trials in the Characteristics of included studies section.
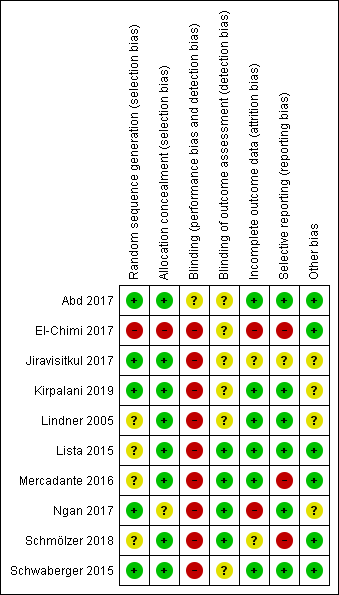
Risk of bias summary: review authors' judgements about each risk of bias item for each included trial.
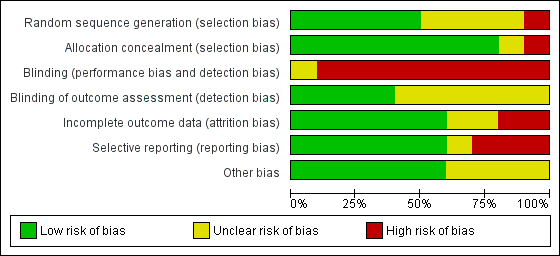
Risk of bias graph: review authors' judgements about each risk of bias item presented as percentages across all included trials.
Allocation
One trial had high risk of selection bias: This quasi‐randomised trial (odd‐numbered sheets indicated allocation to the SLI group, and even‐numbered sheets to the control group) did not use opaque envelopes (information provided by study authors) (El‐Chimi 2017). In Abd 2017, Kirpalani 2019, Jiravisitkul 2017 and Schwaberger 2015, risk of selection bias was low as regards random sequence generation and allocation concealment (opaque, numbered envelopes). In Ngan 2017, risk of selection bias was low as regards random sequence generation and was unclear for allocation concealment: timing of randomisation resulted in many post‐randomisation exclusions, as results showed more post‐randomisation exclusions in the SLI group than in the control group. In the other four trials, risk of selection bias was unclear as regards random sequence generation and was low as regards allocation concealment (opaque, numbered envelopes) (Lindner 2005; Lista 2015; Mercadante 2016; Schmölzer 2018).
Blinding
Owing to the nature of the intervention, all trials were unblinded, leading to high risk of performance bias. However, five trials blinded researchers assessing trial endpoints to the nature of study treatments (Kirpalani 2019; Lista 2015; Mercadante 2016; Ngan 2017; Schmölzer 2018). Furthermore it should be considered that blinding does not affect mortality. This outcome was considered by all included primary studies, limiting the risk of dealing with spurious or biased findings.
Incomplete outcome data
El‐Chimi 2017 transferred almost half of enrolled infants to other NICUs; we excluded this study from analysis owing to the high rate of follow‐up, although the primary outcome of the study (treatment failure/success within 72 hours) could have been determined and reported for all randomised infants. In Ngan 2017, post‐randomisation exclusion (27%) resulted in fewer included infants in the SLI group. Most trials accounted for all outcomes (Abd 2017; Kirpalani 2019; Lindner 2005; Lista 2015; Mercadante 2016; Schwaberger 2015).
Selective reporting
Six trials provided complete results for all planned outcomes (Abd 2017; Kirpalani 2019; Lindner 2005; Lista 2015; Ngan 2017; Schwaberger 2015).
Other potential sources of bias
El‐Chimi 2017 and Schwaberger 2015 did not report sample size calculations. For Schwaberger 2015, investigators registered the protocol after study initiation. Jiravisitkul 2017 planned sample sizes of 40 infants for each group but allocated only 38 to the control group. Lindner 2005 was stopped after the interim analysis. It was unclear why study authors made this decision. In Kirpalani 2019 the DSMB halted the trial for harm when 426 infants had been enrolled (of a planned sample size of 600). Ngan 2017 did not achieve the planned sample size; in addition, the incidence of the primary outcome in the control group was less than that assumed for the sample size calculation, leading to lack of power to detect the chosen effect size. The other trials appear free of other bias.
We did not explore possible bias through generation of funnel plots because fewer than 10 trials met the inclusion criteria of this Cochrane Review.
Effects of interventions
See: Summary of findings for the main comparison Use of initial sustained inflation compared to standard inflations in newborns receiving resuscitation with no chest compressions for; Summary of findings 2 Use of initial sustained inflation for
Comparison 1: use of initial sustained inflation versus standard inflations in newborns receiving resuscitation with no chest compressions
Nine trials (with 1458 infants) are included in the comparison of the use of initial sustained inflation versus standard inflations in newborns receiving resuscitation with no chest compressions (Comparison 1) (Abd 2017; El‐Chimi 2017; Jiravisitkul 2017; Kirpalani 2019; Lindner 2005; Lista 2015; Mercadante 2016; Ngan 2017; Schwaberger 2015) (see summary of findings Table for the main comparison).
Primary outcomes
Death (Outcome 1.1)
Death in the delivery room (Outcome 1.1.1)
Five trials (N = 479) reported this outcome (El‐Chimi 2017; Jiravisitkul 2017; Lindner 2005; Mercadante 2016; Schwaberger 2015); only one event occurred across both arms (death caused by severe birth asphyxia as the result of a prolapsed cord in the SLI group in Jiravisitkul 2017) (typical RR 2.66, 95% CI 0.11 to 63.40; typical RD 0.00, 95% CI −0.02 to 0.02; I² not applicable for RR and I² = 0% for RD; 5 studies, 479 participants) (Analysis 1.1 and Figure 4). The quality of the evidence (GRADE) for this outcome was low due to limitations in study design and imprecision (see summary of findings Table for the main comparison). For two trials we obtained mortality data from trial authors (Jiravisitkul 2017; Lindner 2005).
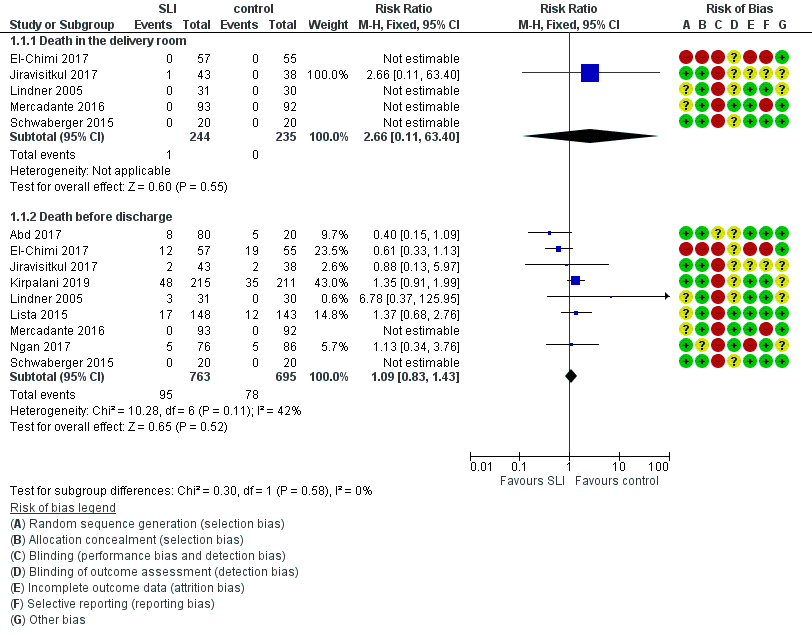
Forest plot of comparison: 1 Use of initial sustained inflation vs standard inflations in newborns receiving resuscitation with no chest compressions ‒ Outcome: 1.1 Death.
Death during hospitalisation (Outcome 1.1.2)
The observed death rate increased with longer follow‐up. All trials reported mortality during hospitalisation (typical RR 1.09, 95% 0.83 to 1.43; typical RD 0.01, 95% CI −0.02 to 0.04; I² = 42% for RR and I² = 24% for RD; 9 studies, 1458 participants; observed deaths = 143) (Analysis 1.1 and Figure 4) (Abd 2017; El‐Chimi 2017; Jiravisitkul 2017; Kirpalani 2019; Lindner 2005; Lista 2015; Mercadante 2016; Ngan 2017; Schwaberger 2015). The quality of the evidence (GRADE) for this outcome was moderate due to limitations in study design (see summary of findings Table for the main comparison). For three trials we obtained data from trial authors (El‐Chimi 2017; Jiravisitkul 2017; Lindner 2005).
In El‐Chimi 2017, 12 and 19 infants died in SLI and control groups, respectively. In Jiravisitkul 2017, two infants in each group died: in the SLI group, one died of severe birth asphyxia as the result of a prolapsed cord, and the other died at three hours of life of suspected umbilical catheter migration with haemothorax; in the control group, one died of severe respiratory distress syndrome at two hours of life, and the other of septic shock at 168 days of life. In Lindner 2005, three deaths occurred in the sustained inflation group: at day 1 (respiratory failure), at day 36 (necrotising enterocolitis), and at day 107 (liver fibrosis of unknown origin). In Lista 2015, 12 infants in the control group and 17 in the sustained inflations group died during the trial. Mercadante 2016 and Schwaberger 2015 reported no events. Kirpalani 2019 was stopped earlier than planned because of increased early mortality (before 48 hours) in the SLI group. Of the 19 early deaths, 13 were in the lower gestational age stratum, with the predominant cause being assigned as cardiorespiratory failure (respiratory failure, 5; asphyxia or failed transition, 4; pulmonary hypertension, 2; haemorrhagic shock, 1; and pneumothorax, 1). Only 8 of 19 (42.1%) of those who had an early death survived long enough for a head ultrasound. Of these three (37.5%) had an intraventricular haemorrhage, one of whom also had a catastrophic gastrointestinal perforation. There were three cases of sepsis.
Death to latest follow‐up
No data were provided in addition to those already presented for death during hospitalisation (Analysis 1.1).
Secondary outcomes
Heart rate at 5 minutes (Outcome 1.1)
One trial (N = 426) reported on heart rate after the first resuscitation manoeuvre (Kirpalani 2019). Heart rate was more frequently low in the SLI group, with heart rate of less than 60 beats per minute (BPM) occurring in 23% and 11% of the infants in the SLI and control group, respectively, whereas heart rate was greater than 100 BPM in 25% and 41% of the infants in the SLI and control group, respectively (P < 0.001).
Endotracheal intubation (Outcome 1.2)
Endotracheal intubation in the delivery room (Outcome 1.2.1)
Seven trials (N = 1127) reported this outcome (Abd 2017; El‐Chimi 2017; Jiravisitkul 2017; Kirpalani 2019; Lindner 2005; Mercadante 2016; Ngan 2017). Rate of endotracheal intubation in the delivery room was lower in SLI group (typical RR 0.85, 95% CI 0.73 to 0.99; typical RD −0.05, 95% CI −0.10 to −0.00; I² = 69% for RR and I² = 84% for RD; 7 studies, 1127 participants) (Analysis 1.2; Figure 5). Heterogeneity was moderate (I² = 69%) for RR and high for RD (I² = 84%). We obtained data for this outcome directly from trial authors (Mercadante 2016).

Forest plot of comparison: 1 Use of initial sustained inflation vs standard inflations in newborns receiving resuscitation with no chest compressions ‒ Outcome: 1.4 Endotracheal intubation.
Endotracheal intubation in the first 72 hours of life (Outcome 1.2.2)
Five included trials (N = 811) reported this outcome (typical RR 0.91, 95% CI 0.79 to 1.04; typical RD −0.04, 95% CI −0.10 to 0.01; I² = 65% for RR and I² = 79% for RD; 5 studies, 811 participants) (Analysis 1.2; Figure 5) (El‐Chimi 2017; Lindner 2005; Lista 2015; Mercadante 2016; Ngan 2017). We obtained data for this outcome directly from trial authors (Lindner 2005; Mercadante 2016).
Surfactant administration (Outcome 1.3)
Surfactant administration in the delivery room (Outcome 1.3.1)
Four trials (N = 761) reported this outcome (typical RR 1.06, 95% CI 0.88 to 1.27; typical RD 0.02, 95% CI −0.04 to 0.08; I² = 0 % for RR and RD; 4 studies, 761 participants) (Analysis 1.3; Figure 6) (El‐Chimi 2017; Kirpalani 2019; Lindner 2005; Ngan 2017). We obtained data for this outcome directly from trial authors (El‐Chimi 2017).

Forest plot of comparison: 1 Use of initial sustained inflation vs standard inflations in newborns receiving resuscitation with no chest compressions ‒ Outcome: 1.5 Surfactant administration.
Surfactant administration during hospital admission (Outcome 1.3.2)
All trials included in Comparison 1 (N = 1458) reported this outcome (typical RR 0.99, 95% CI 0.91 to 1.08; typical RD −0.00, 95% CI −0.05 to 0.04; I² = 0% for RR and RD; 9 studies, 1458 participants) (Analysis 1.3; Figure 6) (Abd 2017; El‐Chimi 2017; Jiravisitkul 2017; Kirpalani 2019; Lindner 2005; Lista 2015; Mercadante 2016; Ngan 2017; Schwaberger 2015). We obtained data for this outcome directly from trial authors (El‐Chimi 2017; Lindner 2005; Mercadante 2016).
Rate of mechanical ventilation (Outcome 1.4)
Four trials (N = 910) reported this outcome (typical RR 0.89, 95% CI 0.77 to 1.02; typical RD −0.05, 95% CI −0.11 to 0.01; I² = 0% for RR and I² = 69% for RD; 4 studies, 910 participants) (Analysis 1.4) (El‐Chimi 2017; Jiravisitkul 2017; Kirpalani 2019; Lista 2015). The quality of the evidence (GRADE) for this outcome was moderate due to limitations in study design (see summary of findings Table for the main comparison). We obtained data for this outcome directly from trial authors (El‐Chimi 2017).
Duration of nasal continuous airway pressure (Outcome 1.5)
Three trials (N = 355) reported this outcome (MD 0.26 days, 95% CI −0.19 to 0.72; I² = 59%; 3 studies, 355 participants) (Analysis 1.5) (El‐Chimi 2017; Lindner 2005; Mercadante 2016). We obtained data for this outcome directly from trial authors; data for this outcome refer to survivors at time of assessment (El‐Chimi 2017; Lindner 2005; Mercadante 2016).
Duration of ventilation via an ETT (Outcome 1.6)
Five trials (N = 524) reported this outcome (MD −5.37 days, 95% CI −6.31 to −4.43; I² = 95%; 5 studies, 524 participants) (Analysis 1.6) (Jiravisitkul 2017; Lindner 2005; Mercadante 2016; Ngan 2017; Schwaberger 2015). Data for this outcome refer to survivors at time of assessment (Jiravisitkul 2017; Lindner 2005; Mercadante 2016). We obtained data for this outcome directly from trial authors (Jiravisitkul 2017; Mercadante 2016; Ngan 2017; Schwaberger 2015). Heterogeneity, statistical significance, and magnitude of effects of this outcome are largely influenced by a single study (Ngan 2017): when this study was removed from the analysis, the size of the effect was reduced (MD −1.71 days, 95% CI −3.04 to −0.39; I² = 0%). In Ngan 2017, a second SLI was delivered to 84% of the infants in the SLI group and was guided by the amount of ECO₂.
Duration of respiratory support (nasal continuous airway pressure and ventilation via an ETT, considered in total) (Outcome 1.7)
Two trials (N = 243) reported this outcome (MD 0.69 days, 95% CI 0.23 to 1.16; 2 studies, 243 participants; I² = 0%) (Analysis 1.7) (Lindner 2005; Mercadante 2016). We obtained data for this outcome directly from trial authors; data refer to survivors at time of assessment (Lindner 2005; Mercadante 2016). Abd 2017 provided medians and interquartile range and observed significantly shorter times in the conventional group: 7.5 days (4 to 13.75 days) in SLI groups vs 2 (1 to 4.25 Days) in control group (P < 0.01).
Duration of supplemental oxygen requirement (days) (Outcome 1.8)
One trial (N = 81) reported this outcome (MD −9.73, 95% CI −25.06 to 5.60; 1 study, 81 participants) (Analysis 1.8) (Jiravisitkul 2017). The test for heterogeneity was not applicable. We obtained data for this outcome directly from trial authors (Jiravisitkul 2017). Abd 2017 provided medians and interquartile range: 6 days (2 to 15 days) in SLI groups vs 4 (0 to 6.5 Days) in control group.
Chronic lung disease (i.e. rate of supplemental oxygen at 36 weeks of gestational age for infants born at or before 32 weeks of gestation) (Outcome 1.9)
Bronchopulmonary dysplasia (BPD) any grade (Outcome 1.9.1)
Four trials (N = 735) reported this outcome (typical RR 0.99, 95% CI 0.83 to 1.18; typical RD −0.00, 95% CI −0.07 to 0.07; I² = 0% for RR and I² = 0% for RD; 4 studies, 735 participants) (Abd 2017; Kirpalani 2019; Lindner 2005; Ngan 2017). The quality of the evidence (GRADE) for this outcome was moderate due to limitations in study design (see summary of findings Table for the main comparison). We obtained data for this outcome directly from trial authors; data refer to survivors at time of assessment (Lindner 2005)(Analysis 1.9).
Moderate to severe BPD (Outcome 1.9.2)
Five included trials (N = 683) reported this outcome (typical RR 0.95, 95% CI 0.74 to 1.22; typical RD −0.01, 95% CI −0.07 to 0.05; I² = 47% for RR and I² = 57% for RD; 5 studies, 683 participants) (Analysis 1.9) (El‐Chimi 2017; Jiravisitkul 2017; Lista 2015; Ngan 2017; Schwaberger 2015). The quality of the evidence (GRADE) for this outcome was moderate due to limitations in study design (see summary of findings Table for the main comparison).
Air leaks (pneumothorax, pneumomediastinum, pneumopericardium, pulmonary interstitial emphysema) reported individually or as a composite outcome (Outcome 1.10)
Pneumothorax in first 48 hours of life (Outcome 1.10.1)
One trial (N = 81) reported this outcome (RR 0.88, 95% CI 0.06 to 13.65; RD −0.00, 95% CI −0.07 to 0.06) (Jiravisitkul 2017). The test for heterogeneity was not applicable (Analysis 1.10).
Pneumothorax at any time (Outcome 1.10.2)
Eight included studies (N = 1377) reported this outcome (typical (RR 0.89, 95% CI 0.57 to 1.40; typical RD −0.01, 95% CI −0.03 to 0.02; I² = 34% for RR and I² = 49% for RD; 8 studies, 1377 participants) (Analysis 1.10) (Abd 2017; El‐Chimi 2017; Kirpalani 2019; Lindner 2005; Lista 2015; Mercadante 2016; Ngan 2017; Schwaberger 2015). The quality of the evidence (GRADE) for this outcome was low due to limitations in study design and imprecision (see summary of findings Table for the main comparison).
Pulmonary interstitial emphysema (Outcome 1.11)
One trial (N = 426) reported this outcome (RR 1.14, 95% CI 0.39 to 3.35; RD 0.00, 95% CI −0.03 to 0.04). The test for heterogeneity was not applicable (Analysis 1.11) (Kirpalani 2019).
Pneumopericardium (Outcome 1.12)
One trial (N = 426) reported this outcome. No events were observed (Kirpalani 2019).
Cranial ultrasound abnormalities (Outcome 1.13)
Intraventricular haemorrhage (IVH), grade 3 or 4 according to the Papile classification (Papile 1978) (Outcome 1.13.1)
Six included trials (N = 735) reported this outcome (typical RR 0.85, 95% CI 0.56 to 1.28; typical RD −0.02, 95% CI −0.06 to 0.03; I² = 22% for RR and I² = 0% for RD; 6 studies, 735 participants) (Analysis 1.13) (Abd 2017; Jiravisitkul 2017; Lindner 2005; Lista 2015; Ngan 2017; Schwaberger 2015). The quality of the evidence (GRADE) for this outcome was low due to limitations in study design and imprecision (see summary of findings Table for the main comparison).
IVH any grade (Outcome 1.13.2)
Three included trials (N = 578) reported this outcome (typical RR 1.01, 95% CI 0.77 to 1.32; typical RD 0.00, 95% CI −0.07 to 0.07; I² = 0% for RR and I² = 0% for RD; 3 studies, 578 participants) (Analysis 1.13) (El‐Chimi 2017; Kirpalani 2019; Schwaberger 2015).
Cystic periventricular leukomalacia (Outcome 1.13.3)
Five included trials (N = 635) reported this outcome (typical RR 0.59, 95% CI 0.24 to 1.44; typical RD −0.04, 95% CI −0.04 to 0.01; I² = 0% for RR and I² = 0% for RD; 5 studies, 635 infants) (Analysis 1.13) (Jiravisitkul 2017; Lindner 2005; Lista 2015; Ngan 2017; Schwaberger 2015).
Retinopathy of prematurity (ROP) ≥ stage 3 (Outcome 1.14)
Six trials (N = 732) reported this outcome (typical RR 0.73, 95% CI 0.46 to 1.15; typical RD −0.03, 95% CI −0.07 to 0.01; I² = 30% for RR and I² = 51% for RD; 6 studies, 732 participants; Analysis 1.14) (Abd 2017; Jiravisitkul 2017; Lindner 2005; Lista 2015; Ngan 2017; Schwaberger 2015). For Lindner 2005, data refer to survivors at time of assessment; and for Abd 2017, data refer to pre‐threshold values. Kirpalani 2019 reports data ROP of any grade: 99/196 (50.5%) in SLI group vs 97/182 (53.3%) in conventional group (Analysis 1.14).
Patent ductus arteriosus (PDA) (Outcome 1.15)
Rate of PDA ‒ pharmacological treatment (Outcome 1.15.1)
Seven included trials (N = 1127) reported this outcome (typical RR 0.99, 95% CI 0.87 to 1.12; typical RD −0.01, 95% CI −0.06 to 0.05; I² = 48% for RR and I² = 53% for RD; 7 studies, 1127 participants; Analysis 1.15) (El‐Chimi 2017; Jiravisitkul 2017; Kirpalani 2019; Lindner 2005; Lista 2015; Ngan 2017; Schwaberger 2015). We obtained data for this outcome directly from trial authors (Schwaberger 2015).
One trial reported PDA rates (2/80 vs 2/20) without specifying whether requiring pharmacological or surgical treatment, and therefore they could not be added to the meta‐analysis (Abd 2017).
Rate of PDA ‒ surgical closure (Outcome 1.15.2)
Three trials (N = 412) reported this outcome (typical RR 0.73, 95% CI 0.27 to 1.99; typical RD −0.01, 95% CI −0.05 to 0.03; I² = 0% for RR and I² = 26% for RD; 3 studies, 412 infants; Analysis 1.15) (Jiravisitkul 2017; Lista 2015; Schwaberger 2015). We obtained data for this outcome directly from trial authors (Schwaberger 2015).
The data refer to all randomised infants, unless otherwise specified.
No data were reported for the following outcomes: heart rate; rate of supplemental oxygen at 28 days of life; seizures including clinical and electroencephalographic; hypoxic‐ischaemic encephalopathy in term and late preterm infants (grade 1 to 3) (Sarnat 1976); and long‐term neurodevelopmental outcomes.
Subgroup analysis for Comparison 1
For Comparison 1, we were unable to conduct any of the four prespecified subgroup analyses for the following reasons.
-
No term infants were included.
-
For ventilation devices, all trials used a T‐piece except Lindner 2005 (mechanical ventilator). We did not perform a separate analysis because of the very small sample size and the presence of high or unclear risk of bias in most GRADE domains. Moreover, El‐Chimi 2017 used a T‐piece ventilator in the SLI group and a self‐inflating bag in the control group, thus we could not include this as a subgroup.
-
For interface, all trials used a face mask, except Lindner 2005 (nasopharyngeal tube). As for ventilation devices, we did not perform a separate analysis for Lindner 2005.
-
No trials used SLI < 5 seconds.
Comparison 2: use of initial sustained inflation versus standard inflations in newborns receiving resuscitation with chest compressions
We could not perform any meta‐analysis in the comparison of the use of initial sustained inflation versus standard inflations in newborns receiving resuscitation with chest compressions because we identified only one trial for inclusion (a pilot study of nine preterm infants) (Schmölzer 2018) (see summary of findings Table 2).
Primary outcomes
Death (Outcome 2.1)
Death in the delivery room (Outcome 2.1.1)
The included trial (N = 9) did not report this outcome (Schmölzer 2018).
Death during hospitalisation (Outcome 2.1.2)
One trial (N = 9) reported this outcome (RR 4.17, 95% CI 0.25 to 68.16; RD 0.40, 95% CI −0.07 to 0.87); thus, the test for heterogeneity was not applicable for this outcome (Schmölzer 2018) (Analysis 2.1).
Secondary outcomes
Endotracheal intubation in the delivery room (Outcome 2.2)
One trial (N = 9) reported this outcome (RR 1.00, 95% CI 0.68 to 1.46; RD 0.00, 95% CI −0.34 to 0.34); thus, the test for heterogeneity was not applicable for this outcome (Schmölzer 2018) (Analysis 2.2). We obtained data for this outcome directly from trial authors (Schmölzer 2018).
Surfactant administration in the delivery room (Outcome 2.3)
One trial (N = 9) reported this outcome (RR 0.65, 95% CI 0.31 to 1.35; RD −0.40, 95% CI −0.87 to 0.07); thus, the test for heterogeneity was not applicable for this outcome (Schmölzer 2018) (Analysis 2.3).
Chronic lung disease (2.4)
Moderate to severe BDP (Outcome 2.4.1)
One trial (N = 9) reported this outcome (RR 0.89, 95% CI 0.33 to 2.37; RD −0.08, 95% CI −0.76 to 0.60); thus, the test for heterogeneity was not applicable for this outcome (Schmölzer 2018) (Analysis 2.4).
Pneumothorax at any time (Outcome 2.5)
One trial (N = 9) reported this outcome: no events occurred (Analysis 2.5).
Cranial ultrasound abnormalities (Outcome 2.6)
Intraventricular haemorrhage (IVH), grade 3 or 4 according to the Papile classification (Papile 1978) (Outcome 2.6.1)
One trial (N = 9) reported this outcome (RR 0.40, 95% CI 0.05 to 2.98; RD −0.30, 95% CI −0.90 to 0.30); thus, the test for heterogeneity was not applicable for this outcome (Schmölzer 2018) (Analysis 2.6).
IVH any grade (Outcome 2.6.2)
One trial (N = 9) reported this outcome (RR 0.28, 95% CI 0.07 to 1.15; RD −0.80, 95% CI −1.23 to −0.37); thus, the test for heterogeneity was not applicable for this outcome (Schmölzer 2018) (Analysis 2.6).
Retinopathy of prematurity (ROP) ≥ stage 3 (Outcome 2.7)
One trial (N = 9) reported this outcome (RR 0.27, 95% CI 0.04 to 1.68; RD −0.55, 95% CI −1.10 to 0.00); thus, the test for heterogeneity was not applicable for this outcome (Schmölzer 2018) (Analysis 2.7).
Rate of PDA ‒ pharmacological treatment (Outcome 2.8)
One trial (N = 9) reported this outcome (RR 0.46, 95% CI 0.17 to 1.25; RD −0.60, 95% CI −1.07 to −0.13); thus, the test for heterogeneity was not applicable for this outcome (Schmölzer 2018) (Analysis 2.8).
For Comparison 2, investigators provided no data on other prespecified outcomes.
Subgroup analysis for the Comparison two
For Comparison 2, we were unable to conduct any subgroup analysis as we included only one trial.
Discussion
Summary of main results
We evaluated the benefits and harms of sustained lung inflation (SLI) versus intermittent ventilation in infants requiring resuscitation and stabilisation at birth. Ten trials enrolling 1467 preterm infants compared the interventions in which we were interested (Abd 2017El‐Chimi 2017; Jiravisitkul 2017; Kirpalani 2019Lindner 2005; Lista 2015; Mercadante 2016; Ngan 2017; Schmölzer 2018; Schwaberger 2015), with one exception. Schmölzer 2018 was not meta‐analysed with the other studies because investigators considered as experimental intervention chest compressions in combination with SLI.
Sustained lung inflation was not better than intermittent ventilation for reducing mortality — the primary outcome of this review. We rated the quality of evidence as moderate (GRADE) for death before discharge (limitations in study design of most included trials) and as low (GRADE) for death in the delivery room (limitations in study design and imprecision of estimates). When considering secondary outcomes, such as intubation, rate or duration of respiratory support, bronchopulmonary dysplasia, or pneumothorax, we found no benefit of SLI over intermittent ventilation. The quality of evidence for secondary outcomes was moderate (limitations in study design of most included trials ‒ GRADE), except for pneumothorax (low quality: limitations in study design and imprecision of estimates ‒ GRADE). Duration of mechanical ventilation was shorter in the SLI group (low quality: limitations in study design and imprecision of estimates ‒ GRADE).
We identified eight ongoing trials.
Overall completeness and applicability of evidence
To date, 10 trials comparing sustained versus standard inflations for initial resuscitation have enrolled 1467 newborns. Available data were insufficient for assessment of clinically important outcomes, which were identified a priori. Study authors did not report outcomes such as duration of supplemental oxygen requirement and long‐term neurodevelopmental outcomes and did not enrol term infants. We could not perform a priori subgroup analyses (gestational age, ventilation device, interface, duration of sustained inflation) to detect differential effects because of the paucity of included trials. Relevant questions such as the following remain unanswered: What is the optimal duration for an SLI? Which level of positive end‐expiratory pressure (PEEP) should follow? Which is the optimal interface/device? (McCall 2016). We were able to summarise available evidence in a comprehensive way, as we obtained additional information about study design and outcome data from most of the included trials (El‐Chimi 2017; Jiravisitkul 2017; Lindner 2005; Lista 2015; Mercadante 2016; Ngan 2017; Schmölzer 2018; Schwaberger 2015) and from two excluded trials (Harling 2005; te Pas 2007). The eight ongoing trials that we identified reported important differences in choice of gestational age (NCT01255826; NCT01440868; NCT02493920; NCT02858583; NCT02887924; NCT03165305; NCT03437499; NCT03518762). NCT02493920 enrols infants at 25 to 36 weeks, NCT01440868 25 to 28 weeks, NCT01255826 26 to 34 weeks, NCT03518762 27 to 32 weeks, NCT03437499 28 to 30, NCT02887924 26 to 29 weeks, NCT02858583 enrols term and preterm infants, whereas NCT03165305 only term infants. These differences among study populations might prove to be important, as trials have reported that sustained inflation was more effective in infants at 28 to 30 weeks than at less than 28 or more than 30 weeks of gestation (te Pas 2007).
Quality of the evidence
According to the GRADE approach, we rated the overall quality of evidence for clinically relevant outcomes as low to moderate (see summary of findings Table for the main comparison for Comparison 1. We downgraded the overall quality of evidence for critical outcomes because of limitations in study design (i.e. selection bias due to lack of allocation concealment) and imprecision of results (few events for death in the delivery room and wide confidence intervals for pneumothorax). In addition, three trials did not report sample size calculations (Abd 2017; El‐Chimi 2017; Schwaberger 2015), and four did not achieve them (Jiravisitkul 2017; Kirpalani 2019; Lindner 2005; Ngan 2017). Results of smaller studies are subject to greater sampling variation, and hence are less precise. Indeed, imprecision is reflected in the confidence interval around the intervention effect estimate from each study and in the weight given to the results of each study included in the meta‐analysis (Higgins 2011).
Potential biases in the review process
A major limitation of this Cochrane Review is the definition of sustained lung inflation, as trials used different pressures, which may have impacted study results. We excluded Harling 2005 and Hunt 2019 because the control group received two and two to three seconds of inflation, respectively, whereas we defined 'sustained' as more than one second. An additional limitation consists of the high number of outcomes we specified, leading to low statistical power for most of the analyses. As one review author (PD) is also the author of one of the trials that was included (Kirpalani 2019), the other review authors conducted quality assessments of this trial.
No trials were blinded owing to the nature of the intervention. We excluded a potentially relevant trial because sustained inflation was only one element of the intervention (te Pas 2007), and it is not possible to determine the relative contributions of various elements of this intervention to differences observed between groups. For the 2017 update of this review, we made a post hoc decision to add a comparison based on the presence of chest compressions during resuscitation.
Agreements and disagreements with other studies or reviews
Several systematic reviews of SLI have been recently published. Schmölzer 2014 conducted a systematic review of randomised clinical trials comparing SLI versus intermittent positive‐pressure ventilation (IPPV) as the primary respiratory intervention during respiratory support in preterm individuals at less than 33 weeks of gestational age in the delivery room. This review included four trials, including two that we excluded from our systematic review (Harling 2005; te Pas 2007). Schmölzer 2014 reported a significant reduction in the rate of mechanical ventilation within 72 hours after birth (typical risk ratio (RR) 0.87, 95% confidence interval (CI) 0.74 to 1.03) and an increased rate of treatment for PDA in the SLI group (RR 1.27, 95% CI 1.05 to 1.54). Results showed no differences in bronchopulmonary dysplasia (BPD), death at latest follow‐up, or the combined outcome of death or BPD among survivors between groups. The findings of Schmölzer 2014 differ from the findings of this Cochrane Review because of differences in the definition of duration of the intervention, and therefore in determination of included trials. Foglia 2016, a narrative review including five trials (Harling 2005; Lindner 2005; Lista 2015; Mercadante 2016; te Pas 2007), concluded that data are at present insufficient to support the use of SLI in clinical practice. An observational analytical case‐control study of 78 preterm infants showed that SLI resulted in lower rates of intubation in the delivery room, lower rates of invasive mechanical ventilation, and higher rates of intraventricular haemorrhage (Grasso 2015).
Study flow diagram: review update.
Risk of bias summary: review authors' judgements about each risk of bias item for each included trial.
Risk of bias graph: review authors' judgements about each risk of bias item presented as percentages across all included trials.
Forest plot of comparison: 1 Use of initial sustained inflation vs standard inflations in newborns receiving resuscitation with no chest compressions ‒ Outcome: 1.1 Death.
Forest plot of comparison: 1 Use of initial sustained inflation vs standard inflations in newborns receiving resuscitation with no chest compressions ‒ Outcome: 1.4 Endotracheal intubation.
Forest plot of comparison: 1 Use of initial sustained inflation vs standard inflations in newborns receiving resuscitation with no chest compressions ‒ Outcome: 1.5 Surfactant administration.

Comparison 1 Use of initial sustained inflation vs standard inflations in newborns receiving resuscitation with no chest compressions, Outcome 1 Death.

Comparison 1 Use of initial sustained inflation vs standard inflations in newborns receiving resuscitation with no chest compressions, Outcome 2 Endotracheal intubation.

Comparison 1 Use of initial sustained inflation vs standard inflations in newborns receiving resuscitation with no chest compressions, Outcome 3 Surfactant administration.

Comparison 1 Use of initial sustained inflation vs standard inflations in newborns receiving resuscitation with no chest compressions, Outcome 4 Need for mechanical ventilation.

Comparison 1 Use of initial sustained inflation vs standard inflations in newborns receiving resuscitation with no chest compressions, Outcome 5 Duration of NCPAP.

Comparison 1 Use of initial sustained inflation vs standard inflations in newborns receiving resuscitation with no chest compressions, Outcome 6 Duration of mechanical ventilation.

Comparison 1 Use of initial sustained inflation vs standard inflations in newborns receiving resuscitation with no chest compressions, Outcome 7 Duration of respiratory support (NCPAP + MV).

Comparison 1 Use of initial sustained inflation vs standard inflations in newborns receiving resuscitation with no chest compressions, Outcome 8 Duration of supplemental oxygen requirement.

Comparison 1 Use of initial sustained inflation vs standard inflations in newborns receiving resuscitation with no chest compressions, Outcome 9 Chronic lung disease.

Comparison 1 Use of initial sustained inflation vs standard inflations in newborns receiving resuscitation with no chest compressions, Outcome 10 Pneumothorax.

Comparison 1 Use of initial sustained inflation vs standard inflations in newborns receiving resuscitation with no chest compressions, Outcome 11 Pulmonary interstitial emphysema.

Comparison 1 Use of initial sustained inflation vs standard inflations in newborns receiving resuscitation with no chest compressions, Outcome 12 Pneumopericardium.

Comparison 1 Use of initial sustained inflation vs standard inflations in newborns receiving resuscitation with no chest compressions, Outcome 13 Cranial ultrasound abnormalities.

Comparison 1 Use of initial sustained inflation vs standard inflations in newborns receiving resuscitation with no chest compressions, Outcome 14 Retinopathy of prematurity (ROP) stage ≥ 3.

Comparison 1 Use of initial sustained inflation vs standard inflations in newborns receiving resuscitation with no chest compressions, Outcome 15 Patent ductus arteriosus (PDA).

Comparison 2 Use of initial sustained inflation vs standard inflations in newborns receiving resuscitation with chest compressions, Outcome 1 Death.

Comparison 2 Use of initial sustained inflation vs standard inflations in newborns receiving resuscitation with chest compressions, Outcome 2 Endotracheal intubation.

Comparison 2 Use of initial sustained inflation vs standard inflations in newborns receiving resuscitation with chest compressions, Outcome 3 Surfactant administration.

Comparison 2 Use of initial sustained inflation vs standard inflations in newborns receiving resuscitation with chest compressions, Outcome 4 Chronic lung disease.

Comparison 2 Use of initial sustained inflation vs standard inflations in newborns receiving resuscitation with chest compressions, Outcome 5 Pneumothorax.

Comparison 2 Use of initial sustained inflation vs standard inflations in newborns receiving resuscitation with chest compressions, Outcome 6 Cranial ultrasound abnormalities.

Comparison 2 Use of initial sustained inflation vs standard inflations in newborns receiving resuscitation with chest compressions, Outcome 7 Retinopathy of prematurity (ROP) stage ≥ 3.

Comparison 2 Use of initial sustained inflation vs standard inflations in newborns receiving resuscitation with chest compressions, Outcome 8 Patent ductus arteriosus (PDA).
| Use of initial sustained inflation compared to standard inflations in newborns receiving resuscitation with no chest compressions during resuscitation | ||||||
| Population: preterm infants resuscitated by PPV at birth | ||||||
| Outcomes | Illustrative comparative risks* (95% CI) | Relative effect | No. of participants | Quality of the evidence | Comments | |
| Assumed risk | Corresponding risk | |||||
| Standard inflations in newborns receiving resuscitation with no chest compressions | Use of initial sustained inflation | |||||
| Death ‒in the delivery room | Study population | RR 2.66 | 479 | ⊕⊕⊝⊝ | ||
| 0 per 1000 | 0 per 1000 | |||||
| Medium risk population | ||||||
| 0 per 1000 | 0 per 1000 | |||||
| Death ‒before discharge | Study population | RR 1.09 | 1458 | ⊕⊕⊕⊝ | ||
| 112 per 1000 | 122 per 1000 | |||||
| Medium risk population | ||||||
| 58 per 1000 | 63 per 1000 | |||||
| Rate of mechanical ventilation | Study population | RR 0.89 | 910 | ⊕⊕⊕⊝ | ||
| 461 per 1000 | 410 per 1000 | |||||
| Medium risk population | ||||||
| 439 per 1000 | 391 per 1000 | |||||
| Chronic lung disease ‒any grade | Study population | RR 0.98 | 1418 | ⊕⊕⊕⊝ | ||
| 340 per 1000 | 333 per 1000 | |||||
| Medium risk population | ||||||
| 211 per 1000 | 207 per 1000 | |||||
| Chronic lung disease ‒moderate to severe BPD | Study population | RR 0.95 | 683 | ⊕⊕⊕⊝ | ||
| 257 per 1000 | 244 per 1000 | |||||
| Medium risk population | ||||||
| 211 per 1000 | 200 per 1000 | |||||
| Pneumothorax | Study population | RR 0.89 | 1458 | ⊕⊕⊝⊝ | ||
| 52 per 1000 | 46 per 1000 | |||||
| Medium risk population | ||||||
| 50 per 1000 | 44 per 1000 | |||||
| Cranial ultrasound abnormalities ‒Intraventricular haemorrhage grade 3 to 4 | Study population | RR 0.85 | 735 | ⊕⊕⊝⊝ | ||
| 116 per 1000 | 99 per 1000 | |||||
| Medium risk population | ||||||
| 54 per 1000 | 46 per 1000 | |||||
| *The basis for the assumed risk (e.g. the median control group risk across studies) is provided in footnotes. The corresponding risk (and its 95% CI) is based on the assumed risk in the comparison group and the relative effect of the intervention (and its 95% CI). | ||||||
| GRADE Working Group grades of evidence | ||||||
| 1 all studies at high or unclear risk of bias in at least one domain (lack of blinding) and 1 study stopped early | ||||||
| Use of initial sustained inflation for | ||||||
| Population: infants below 33 weeks of postmenstrual age who required resuscitation in the delivery room | ||||||
| Outcomes | Illustrative comparative risks* (95% CI) | Relative effect | No. of participants | Quality of the evidence | Comments | |
| Assumed risk | Corresponding risk | |||||
| Control | Use of initial sustained inflation | |||||
| Death ‒in the delivery room | See comment | See comment | not reported | 9 (1 study) | The included study did not report on this outcome | |
| Death ‒before discharge | Study population | RR 4.17 | 9 | ⊝⊝⊝⊝ | ||
| 0 per 1000 | 0 per 1000 | |||||
| Medium risk population | ||||||
| 0 per 1000 | 0 per 1000 | |||||
| Rate of mechanical ventilation | See comment | See comment | not reported | 9 (1 study) | The included study did not report on this outcome | |
| Chronic lung disease ‒any grade | See comment | See comment | not reported | 9 (1 study) | The included study did not report on this outcome | |
| Chronic lung disease ‒moderate to severe BPD | Study population | RR 0.89 | 7 | ⊝⊝⊝⊝ | ||
| 750 per 1000 | 668 per 1000 | |||||
| Medium risk population | ||||||
| 750 per 1000 | 668 per 1000 | |||||
| Pneumothorax ‒at any time | See comment | See comment | Not estimable | 9 | ⊝⊝⊝⊝ | No events |
| Cranial ultrasound abnormalities ‒intraventricular haemorrhage grade 3 to 4 | Study population | RR 0.4 | 9 | ⊝⊝⊝⊝ | ||
| 500 per 1000 | 200 per 1000 | |||||
| Medium risk population | ||||||
| 500 per 1000 | 200 per 1000 | |||||
| *The basis for the assumed risk (e.g. the median control group risk across studies) is provided in footnotes. The corresponding risk (and its 95% CI) is based on the assumed risk in the comparison group and the relative effect of the intervention (and its 95% CI). | ||||||
| GRADE Working Group grades of evidence | ||||||
| 1 Limitations in study design: downgraded by 1 level due to included study at high or unclear risk of bias in 4 domains | ||||||
| Trial (no. infants) | Antenatal steroids | Gestational age, weeks | Birth weight, grams | Device/Interface | Interventions/Controls | ||||
| SLI | Control | SLI | Control | SLI | Control | SLI and control | SLI | Control | |
| Abd 2017 (100) | 70% to 80% | 55% | 29.3 to 29.7 | 29.4 (SD 2.1) | 1363 to 1367 | mean 1249 (SD 363) | T‐piece | 4 different arms: PIP of either 15 or 20 cmH₂O for either 10 or 20 seconds | PEEP 5 cmH₂O, oxygen 30% |
| El‐Chimi 2017 (112) | 39% | 34.5% | mean 31.1 (SD 1.7) | mean 31.3 (SD 1.7) | mean 1561 (SD 326) | mean 1510 (SD 319) | Mask and T‐piece in SLI group Mask and self‐inflating bag with an oxygen reservoir in control group | PIP of 20 cmH₂O for 15 seconds, followed by PEEP of 5 cmH₂O If needed: a second SLI of 15 seconds of 25 cmH₂O for 15 seconds, followed by PEEP of 6 cmH₂O; then a third SLI of 15 seconds of 30 cmH₂O for 15 seconds, followed by PEEP of 7 cmH₂O If still not satisfactory: intubated in delivery room | PIP maximum 40 cmH₂O, rate of 40 to 60 breaths/min for 30 seconds |
| Jiravisitkul 2017 (81) | 63% | 74% | 25 to 28 weeks: 29 to 32 weeks: | 25 to 28 weeks: 29 to 32 weeks: | mean 1206 (SD 367) | mean 1160 (SD 411) | Mask and T‐piece | PIP of 25 cmH₂O for 15 seconds If HR 60 to 100 beats/min and/or poor respiratory effort: a second SLI (25 cmH₂O, 15 seconds) | PIP 15 to 20 cmH₂O, PEEP 5 cmH₂O for 30 seconds, followed by resuscitation according to AHA guidelines |
| Kirpalani 2019 (426) | 97% | 97% | 23 to 24 weeks: n = 76; 25 to 26 weeks: | 23 to 24 weeks: n = 75; 25 to 26 weeks: | median 725 (IQR 620 to 855) | median 731 (IQR 630 to 854) | Either mask or a nasopharyngeal tube (as unit protocol dictated) and T‐piece resuscitator | PIP of 20 cmH₂O for 15 seconds. If needed: a second SLI of 15 seconds of 25 cmH₂O | PIP with PEEP |
| Lindner 2005 (61) | 81% | 80% | median 27.0 (IQR 25.0 to 28.9) | median 26.7 (IQR 25.0 to 28.9) | median 870 (IQR 410 to 1320) | median 830 (IQR 370 to 1370) | Nasopharyngeal tube (fixed at 4 to 5 cm) and mechanical ventilator | PIP of 20 cmH₂O for 15 seconds If response was not satisfactory: 2 further SLIs of 15 seconds (25 and 30 cmH₂O). Then PEEP at 4 to 6 cmH₂O | PIP 20 cmH₂O, PEEP 4 to 6 cmH₂O; inflation time 0.5 seconds; inflation rate 60 per min. Then, PEEP at 4 to 6 cmH₂O |
| Lista 2015 (301) | 87% | 91% | mean 26.8 (SD 1.2); 25 to 26 weeks: 27 to 28 weeks: | mean 26.8 (SD 1.1); 25 to 26 weeks: 27 to 28 weeks: | mean 894 (SD 247) | mean 893 (SD 241) | Mask and T‐piece | PIP 25 cmH₂O for 15 seconds. Then reduced to PEEP of 5 cmH₂O | PEEP 5 cmH₂O, followed by resuscitation according to AHA guidelines |
| Mercadante 2016 (185) | 40% | 32% | mean 35.2 (SD 0.8) | mean 35.2 (SD 0.8) | mean 2345 (SD 397) | mean 2346 (SD 359) | Mask and T‐piece | PIP 25 cmH₂O for 15 seconds, followed by PEEP of 5 cmH₂O. In case of persistent heart failure (HR < 100 bpm): SLI repeated | PEEP 5 cmH₂O, followed by resuscitation according to AAP guidelines |
| Ngan 2017 (162) | 78% | 70% | mean 28 (SD 2.5) | mean 28 (SD 2.5) | mean 1154 (SD 426) | mean 1140 (SD 406) | Mask and T‐piece | Two PIPs of 24 cmH₂O. Duration of first SLI was 20 seconds. Duration of second SLI was 20 or 10 seconds, guided by ECO₂ values. After SLIs, CPAP if breathing spontaneously or, if found to have apnoea or laboured breathing, mask IPPV at a rate of 40 to 60 bpm | IPPV, rate of 40 to 60 inflations/min until spontaneous breathing, at which time CPAP will be provided |
| Schmölzer 2018 (9) | 80%a | 100%a | mean 24.6 (SD 1.3)a | mean 25.6 (SD 2.3)a | mean 707 (SD 208)a | mean 808 (SD 192)a | Mask and T‐piecea | PIP for 20 + 20 secondsa during chest compressions | 3:1 compression:ventilation ratio according to resuscitation guidelines |
| Schwaberger 2015 (40) | not reported | not reported | mean 32.1 (SD 1.4) | mean 32.1 (SD 1.6) | mean 1692 (SD 297) | mean 1722 (SD 604) | Mask and T‐piece | PIP 30 cmH₂O for 15 seconds, to be repeated once or twice with HR remaining < 100 bpm. Infants with HR > 100 bpm: PPV at 30 cmH₂O PIP or CPAP at PEEP level of 5 cmH₂O depending on respiratory rate | Resuscitation according to AHA guidelines PEEP 5 cmH₂O if respiratory rate > 30 and signs of respiratory distress PPV at 30 cmH₂O PIP if insufficient breathing efforts |
| aInformation provided by study authors | |||||||||
| Outcome or subgroup title | No. of studies | No. of participants | Statistical method | Effect size |
| 1 Death Show forest plot | 9 | Risk Ratio (M‐H, Fixed, 95% CI) | Subtotals only | |
| 1.1 Death in the delivery room | 5 | 479 | Risk Ratio (M‐H, Fixed, 95% CI) | 2.66 [0.11, 63.40] |
| 1.2 Death before discharge | 9 | 1458 | Risk Ratio (M‐H, Fixed, 95% CI) | 1.09 [0.83, 1.43] |
| 2 Endotracheal intubation Show forest plot | 8 | Risk Ratio (M‐H, Fixed, 95% CI) | Subtotals only | |
| 2.1 intubation in the delivery room (DR) | 7 | 1127 | Risk Ratio (M‐H, Fixed, 95% CI) | 0.85 [0.73, 0.99] |
| 2.2 intubation in the first 72 hours of age | 5 | 811 | Risk Ratio (M‐H, Fixed, 95% CI) | 0.91 [0.79, 1.04] |
| 3 Surfactant administration Show forest plot | 9 | Risk Ratio (M‐H, Fixed, 95% CI) | Subtotals only | |
| 3.1 Surfactant given in the delivery room | 4 | 761 | Risk Ratio (M‐H, Fixed, 95% CI) | 1.06 [0.88, 1.27] |
| 3.2 Surfactant given at any time | 9 | 1458 | Risk Ratio (M‐H, Fixed, 95% CI) | 0.99 [0.91, 1.08] |
| 4 Need for mechanical ventilation Show forest plot | 4 | 910 | Risk Ratio (M‐H, Fixed, 95% CI) | 0.89 [0.77, 1.02] |
| 5 Duration of NCPAP Show forest plot | 3 | 355 | Mean Difference (IV, Fixed, 95% CI) | 0.26 [‐0.19, 0.72] |
| 6 Duration of mechanical ventilation Show forest plot | 5 | 524 | Mean Difference (IV, Fixed, 95% CI) | ‐5.37 [‐6.31, ‐4.43] |
| 7 Duration of respiratory support (NCPAP + MV) Show forest plot | 2 | 243 | Mean Difference (IV, Fixed, 95% CI) | 0.69 [0.23, 1.16] |
| 8 Duration of supplemental oxygen requirement Show forest plot | 1 | 81 | Mean Difference (IV, Fixed, 95% CI) | ‐9.73 [‐25.06, 5.60] |
| 9 Chronic lung disease Show forest plot | 8 | Risk Ratio (M‐H, Fixed, 95% CI) | Subtotals only | |
| 9.1 BPD any grade | 4 | 735 | Risk Ratio (M‐H, Fixed, 95% CI) | 0.99 [0.83, 1.18] |
| 9.2 Moderate to severe BPD | 5 | 683 | Risk Ratio (M‐H, Fixed, 95% CI) | 0.95 [0.74, 1.22] |
| 10 Pneumothorax Show forest plot | 9 | Risk Ratio (M‐H, Fixed, 95% CI) | Subtotals only | |
| 10.1 During first 48 hours | 1 | 81 | Risk Ratio (M‐H, Fixed, 95% CI) | 0.88 [0.06, 13.65] |
| 10.2 At any time | 8 | 1377 | Risk Ratio (M‐H, Fixed, 95% CI) | 0.89 [0.57, 1.40] |
| 11 Pulmonary interstitial emphysema Show forest plot | 1 | 426 | Risk Ratio (M‐H, Fixed, 95% CI) | 1.14 [0.39, 3.35] |
| 12 Pneumopericardium Show forest plot | 1 | 426 | Risk Difference (M‐H, Fixed, 95% CI) | 0.0 [‐0.01, 0.01] |
| 13 Cranial ultrasound abnormalities Show forest plot | 8 | Risk Ratio (M‐H, Fixed, 95% CI) | Subtotals only | |
| 13.1 Intraventricular haemorrhage grade 3‐4 | 6 | 735 | Risk Ratio (M‐H, Fixed, 95% CI) | 0.85 [0.56, 1.28] |
| 13.2 IVH any grade | 3 | 578 | Risk Ratio (M‐H, Fixed, 95% CI) | 1.01 [0.77, 1.32] |
| 13.3 Cystic periventricular leukomalacia | 5 | 635 | Risk Ratio (M‐H, Fixed, 95% CI) | 0.59 [0.24, 1.44] |
| 14 Retinopathy of prematurity (ROP) stage ≥ 3 Show forest plot | 6 | 732 | Risk Ratio (M‐H, Fixed, 95% CI) | 0.73 [0.46, 1.15] |
| 15 Patent ductus arteriosus (PDA) Show forest plot | 7 | Risk Ratio (M‐H, Fixed, 95% CI) | Subtotals only | |
| 15.1 PDA ‐ pharmacological treatment | 7 | 1127 | Risk Ratio (M‐H, Fixed, 95% CI) | 0.99 [0.87, 1.12] |
| 15.2 PDA ‐ surgical closure | 3 | 412 | Risk Ratio (M‐H, Fixed, 95% CI) | 0.73 [0.27, 1.99] |
| Outcome or subgroup title | No. of studies | No. of participants | Statistical method | Effect size |
| 1 Death Show forest plot | 1 | Risk Ratio (M‐H, Fixed, 95% CI) | Subtotals only | |
| 1.1 Death before discharge | 1 | 9 | Risk Ratio (M‐H, Fixed, 95% CI) | 4.17 [0.25, 68.16] |
| 2 Endotracheal intubation Show forest plot | 1 | Risk Ratio (M‐H, Fixed, 95% CI) | Subtotals only | |
| 2.1 Endotracheal intubation in the delivery room | 1 | 9 | Risk Ratio (M‐H, Fixed, 95% CI) | 1.0 [0.68, 1.46] |
| 3 Surfactant administration Show forest plot | 1 | Risk Ratio (M‐H, Fixed, 95% CI) | Subtotals only | |
| 3.1 Surfactant given in the delivery room | 1 | 9 | Risk Ratio (M‐H, Fixed, 95% CI) | 0.65 [0.31, 1.35] |
| 4 Chronic lung disease Show forest plot | 1 | Risk Ratio (M‐H, Fixed, 95% CI) | Subtotals only | |
| 4.1 Moderate to severe BPD | 1 | 7 | Risk Ratio (M‐H, Fixed, 95% CI) | 0.89 [0.33, 2.37] |
| 5 Pneumothorax Show forest plot | 1 | Risk Difference (M‐H, Fixed, 95% CI) | Subtotals only | |
| 5.1 At any time | 1 | 9 | Risk Difference (M‐H, Fixed, 95% CI) | 0.0 [‐0.34, 0.34] |
| 6 Cranial ultrasound abnormalities Show forest plot | 1 | Risk Ratio (M‐H, Fixed, 95% CI) | Subtotals only | |
| 6.1 Intraventricular haemorrhage grade 3 to 4 | 1 | 9 | Risk Ratio (M‐H, Fixed, 95% CI) | 0.4 [0.05, 2.98] |
| 6.2 IVH any grade | 1 | 9 | Risk Ratio (M‐H, Fixed, 95% CI) | 0.28 [0.07, 1.15] |
| 7 Retinopathy of prematurity (ROP) stage ≥ 3 Show forest plot | 1 | 9 | Risk Ratio (M‐H, Fixed, 95% CI) | 0.27 [0.04, 1.68] |
| 8 Patent ductus arteriosus (PDA) Show forest plot | 1 | Risk Ratio (M‐H, Fixed, 95% CI) | Subtotals only | |
| 8.1 PDA ‐ pharmacological treatment | 1 | 9 | Risk Ratio (M‐H, Fixed, 95% CI) | 0.46 [0.17, 1.25] |