بررسی حوادث جانبی مرتبط با مصرف میانمدت و طولانیمدت اوپیوئیدها برای درد مزمن غیر‐سرطانی: بررسی اجمالی مرورهای کاکرین
چکیده
پیشینه
درد مزمن شایع است و مدیریت آن ممکن است چالشبرانگیز باشد. علیرغم افزایش استفاده از اوپیوئیدها (opioids)، ایمنی و اثربخشی استفاده طولانیمدت از این ترکیبات برای درد مزمن غیر‐سرطانی (chronic non‐cancer pain; CNCP) بحثبرانگیز باقی مانده است. این بررسی اجمالی مرورهای کاکرین، مکمل بررسی اجمالی انجام گرفته درباره موضوع زیر است: «نقش اوپیوئیدها با دوز بالا برای درد مزمن غیر‐سرطانی: بررسی اجمالی مرورهای کاکرین».
اهداف
ارائه یک بررسی اجمالی درباره وقوع و ماهیت حوادث جانبی مرتبط با هر عامل اوپیوئیدی (هر دوز، فرکانس، یا روش تجویز) مورد استفاده در یک دوره میانمدت یا طولانیمدت برای درمان CNCP در بزرگسالان.
روشها
بانک اطلاعاتی مرورهای نظاممند کاکرین (کتابخانه کاکرین) شماره 3؛ 2017 در 8 مارچ 2017 را برای شناسایی کلیه مرورهای کاکرین درباره مطالعات مربوط به استفاده میانمدت یا طولانیمدت از اوپیوئیدها (2 هفته یا بیشتر) برای CNCP در بزرگسالان 18 ساله و بالاتر جستوجو کردیم. کیفیت مرورها را با استفاده از معیارهای AMSTAR (ارزیابی کیفیت روششناسی مرورهای سیستماتیک (Assessing the Methodological Quality of Systematic Reviews)) بهروز شده برای بررسیهای اجمالی کاکرین ارزیابی کردیم. کیفیت شواهد را برای پیامدها با استفاده از چارچوب سیستم درجهبندی توصیه، ارزیابی، توسعه و ارزشیابی (GRADE) ارزیابی کردیم.
نتایج اصلی
در مجموع 16 مرور را در بررسی اجمالی خود وارد کردیم، که در 14 مطالعه دادههای عددی منحصربهفردی ارائه شد. این 14 مرور کاکرین 14 عامل مختلف اوپیوئیدی را مورد بررسی قرار دادند که برای دورههای زمانی دو هفته یا بیشتر تجویز شده بود. طولانیترین مطالعه به مدت 13 ماه بود، که بیشتر آنها بین 6 تا 16 هفته بودند. کیفیت مرورهای وارد شده با استفاده از معیارهای AMSTAR بالا بود، 11 مرور 10 معیار ورود و 5 مرور 9 معیار از 10 معیار ورود را داشتند، نمرهای برای انتخاب مطالعه دوگانه و استخراج داده، یا جستوجو برای مقالات بدون در نظر گرفتن زبان و نوع انتشار وجود نداشت. کیفیت شواهد برای پیامدهای حوادث جانبی عمومی بر اساس رویکرد درجهبندی توصیه، ارزیابی، توسعه و ارزشیابی (GRADE) بسیار پائین تا متوسط، و با خطر سوگیری (bias) و عدم‐دقت برای شناسایی پیامدهای عمومی حوادث جانبی زیر همراه بود: هر حادثه جانبی، هر حادثه جانبی جدی، و خروج به دلیل حوادث جانبی. ارزیابی GRADE از کیفیت شواهد مربوط به حوادث جانبی خاص به دلیل خطر سوگیری، غیر‐مستقیم بودن و عدم‐دقت منجر به کاهش کیفیت شواهد به بسیار پائین تا متوسط شد.
ما مقدار مساوی از هر میلیگرم مورفین (morphine) را در 24 ساعت برای هر اوپیوئید بررسی شده محاسبه کردیم (بوپرنورفین (buprenorphine)، کدئین (codeine)، دکستروپروپوکسیفن (dextropropoxyphene)، دیهیدروکودئین (dihydrocodeine)، فنتانیل (fentanyl)، هیدرومورفون (hydromorphone)، لورفانول (levorphanol)، متادون (methadone)، مورفین (morphine)، اکسیکدون (oxycodone)، اکسیمورفون (oxymorphone)، تپنتدول (tapentadol)، تیلیدین (tilidine)، و ترامادول (tramadol)). در 14 مرور کاکرین دادههای عددی منحصربهفردی ارائه شد، 61 مطالعه در مجموع با 18,679 شرکتکننده تصادفیسازی شده وجود داشت؛ 12 مطالعه از این مطالعات طراحی متقاطع و دو تا چهار بازو داشتند و در مجموع شامل 796 شرکتکننده بودند. بر اساس 14 مرور انتخاب شده کاکرین، افزایش خطر قابل توجهی از نظر ابتلا به هر نوع حوادث جانبی با اوپیوئیدها در مقایسه با دارونما (placebo) (خطر نسبی (RR): 1.42؛ 95% فاصله اطمینان (CI): 1.22 تا 1.66) و همچنین اوپیوئیدها در مقایسه با یک مقایسه کننده دارویی فعال غیر‐اوپیوئیدی، با خطر نسبی مشابه وجود داشت (RR: 1.21؛ 95% CI؛ 1.10 تا 1.33). همچنین افزایش خطر قابل توجهی از نظر ابتلا به یک حادثه جانبی جدی با اوپیوئیدها در مقایسه با دارونما وجود داشت (RR: 2.75؛ 95% CI؛ 2.06 تا 3.67). علاوه بر این، برای تعدادی از حوادث جانبی خاص افزایش قابل توجهی در خطر نسبی با اوپیوئیدها در مقایسه با دارونما یافتیم: یبوست، سرگیجه، خوابآلودگی، خستگی، گرگرفتگی، افزایش تعریق، تهوع، خارش، و استفراغ.
در مورد هیچ یک از حوادث جانبی از پیش تعیین شده زیر در هیچ یک از مرورهای وارد شده در این بررسی اجمالی مرورهای کاکرین دادهای وجود نداشت: اعتیاد (addiction)، نقص عملکرد شناختی (cognitive dysfunction)، نشانههای افسردگی یا اختلالات خلقوخو (depressive symptoms or mood disturbances)، هیپوگنادیسم (کمکاری غدد جنسی hypogonadism) یا سایر نقایص عملکرد غدد درونریز (endocrine dysfunction)، دپرسیون تنفسی (respiratory depression)، نقص عملکرد جنسی (sexual dysfunction)، و آپنه خواب (sleep apnoea) یا اختلال تنفسی در خواب (sleep‐disordered breathing). ما هیچ دادهای برای حوادث جانبی که بر اساس جنسیت یا قومیت تجزیهوتحلیل شدند، به دست نیاوردیم.
نتیجهگیریهای نویسندگان
تعدادی از حوادث جانبی، از جمله حوادث جانبی جدی، با استفاده میانمدت و طولانیمدت از اوپیوئیدها برای CNCP مرتبط هستند. نرخ مطلق رویداد برای هر حادثه جانبی مربوط به اوپیوئیدها در کارآزماییهایی که از دارونما برای مقایسه استفاده کردند 78%، و نرخ مطلق رویداد از 7.5% برای هر حادثه جانبی جدی بود. بر اساس حوادث جانبی شناسایی شده، پیش از اینکه برای استفاده طولانیمدت در افراد مبتلا به CNCP در عمل بالینی در نظر گرفته شوند مزیت بالینی مرتبط باید به وضوح نشان داده شود. تعدادی از حوادث جانبی که ما انتظار داریم با استفاده از اوپیوئیدها اتفاق بیافتند، در مرورهای وارد شده کاکرین گزارش نشده بود. بر این اساس، ما شناسایی دقیقتر و گزارشی از همه حوادث جانبی را در کارآزماییهای تصادفیسازی و کنترل شده و مرورهای سیستماتیک درباره اوپیوئید درمانی توصیه کردیم. عدم وجود داده برای بسیاری از حوادث جانبی نشان دهنده محدودیت جدی شواهد مربوط به اوپیوئیدها است. همچنین افزایش مدت پیگیری مطالعه را توصیه کردیم زیرا ممکن است در شروع برخی از حوادث جانبی تاخیر پیش بیاید.
خلاصه به زبان ساده
عوارض جانبی داروهای مخدر (اپیوئید) در هنگام استفاده برای درمان درد مزمن غیر‐سرطانی در میانمدت یا طولانیمدت
نکته مهم
شواهدی با کیفیت خوب وجود دارد که نشان میدهد عوارض جانبی ممکن است در افراد دارای درد مزمن غیر‐سرطانی که به مدت بیش از دو هفته از داروهای اوپیوئیدی (opioid) استفاده میکنند، اتفاق بیفتد.
پیشینه
اوپیوئیدها نوعی داروی درد مرتبط با تریاک هستند. ما بررسی اجمالی مرورهای کاکرین را انجام دادیم، که در آن دستهای از مقالات علمی وجود داشت که نشان داد این مقالات در مورد عوارض جانبی داروهای مخدر (اپیوئید) چه میگویند. به عوارض جانبی میانمدت و طولانیمدت مرتبط با این درمان برای درد در بزرگسالانی که از داروهای اوپیوئیدی استفاده میکنند و درد مزمن دارند که علت آن سرطان نیست، علاقمند شدیم. داروهای اوپیوئیدی را در مقایسه با قرصهایی که جزء هیچ دارویی نبودند (دارونما (placebo)) و داروهای اوپیوئیدی را در مقایسه با سایر درمانها مطالعه کردیم.
نتایج کلیدی
در مارچ 2017، ما 16 مرور کاکرین را درباره 14 داروی اوپیوئیدی از جمله کدئین (codeine)، مورفین (morphine)، و اکسیکدون (oxycodone) یافتیم. این مقالات، 61 مطالعه را با بیش از 18,000 شرکتکننده وارد کردند. ما متوجه شدیم افرادی که اوپیوئید دریافت میکنند خطر عوارض جانبی بالاتری دارند، مانند یبوست، سرگیجه و تهوع و همچنین عوارض جانبی جدی. هیچ اطلاعاتی در مورد مرورهای کاکرین در مورد بسیاری از عوارض جانبی شناخته شده و بعضی از عوارض جانبی جدی اوپیوئیدها، مانند اعتیاد، افسردگی، و مشکلات خواب نیافتیم.
کیفیت مرورها و شواهد
کیفیت مرورهای وارد شده را بیش از 10 امتیاز رتبهبندی کردیم. از آنجایی که نمرات تمام مرورها 9 یا 10 از 10 امتیاز بود، مطمئن هستیم که کیفیت مرورهای وارد شده بسیار خوب است. کیفیت شواهد به دست آمده از مطالعات را نیز با استفاده از چهار سطح رتبهبندی کردیم: بسیار پائین، پائین، متوسط، یا بالا؛ این رتبهبندیها نشان داد که ما چقدر میتوانیم از نتایج خود در مورد عوارض جانبی اوپیوئیدها مطمئن باشیم. شواهد با کیفیت بسیار پائین به این معنی است که ما در مورد نتایج بسیار نامطمئن هستیم. شواهد با کیفیت بالا به این معنی است که ما از نتایج بسیار مطمئن هستیم. تمام رتبهبندیهای ما بین بسیار پائین و متوسط قرار داشت.
Authors' conclusions
Background
Description of the condition
Pain is described as "an unpleasant sensory and emotional experience associated with actual or potential tissue damage, or described in terms of such damage" (Merskey 1994). Chronic pain is typically described as pain on most days for at least three months. Chronic non‐cancer pain (CNCP) is any chronic pain that is not due to a malignancy. Chronic non‐cancer pain is frequently divided into neuropathic pain (i.e. pain originating in nerves) and non‐neuropathic or nociceptive pain, which is often musculoskeletal in origin and arises from structures such as muscles, bones, or ligaments.
Chronic non‐cancer pain is very common in adults. A recent review estimated the prevalence of CNCP (of moderate or severe intensity, lasting more than three months) at approximately 20%, with considerable variation between studies (Moore 2014). The impact of CNCP on life is substantial, affecting quality of life and activities of daily living, social life, and work, with approximately 20% of people with chronic pain unable to work due to pain (Moore 2014).
The personal and subjective nature of pain makes objective measurement impossible; the assessment of pain is subjective and based on individual report (Breivik 2008). Different instruments are used to measure pain and to determine its impact on the physical, social, emotional, and spiritual aspects of life.
Description of the interventions
The treatment of pain may encompass a variety of approaches, including pharmacological management. Effective pain therapy has been described in terms of a reduction in pain intensity of at least 50% over study baseline, and results in consistent improvements in fatigue, sleep, depression, quality of life, and work ability (Moore 2014). Opioid therapy is used for the treatment of both acute and chronic pain conditions. There is a large number of policies and guidelines to assist with the use of opioids for the management of chronic pain. The World Health Organization (WHO) published a field‐tested analgesic ladder to guide the use of sequentially stronger pain medications for the relief of cancer pain, including opioids and non‐opioids such as non‐steroidal anti‐inflammatory drugs (NSAIDs) (WHO 1996). This tool is now applied generally for people who require analgesic treatment and is widely used for both cancer and non‐cancer pain (Vargas‐Schaffer 2010).
Long‐term opioid use may be associated with problematic patterns of use, leading to clinically significant impairment or distress, including substance use disorders (i.e. abuse and dependence). Opioid use may also be associated with somatic and psychological sequelae, including depressive disorders, anxiety disorders, sleep disorders, sexual dysfunction, and delirium (APA 2013). Furthermore, chronic opioid use is associated with a risk of fatal and non‐fatal overdose, as well as cardiovascular events, endocrinological harms, and motor vehicle accidents (Dowell 2016). High‐quality evidence demonstrates that an increased risk of vehicle crashes exists with the use of opioids (Hegmann 2014a). Operating a vehicle is considered a surrogate for safety‐sensitive work tasks, and hence the use of opioids is usually deemed incompatible with working in safety‐sensitive positions (Hegmann 2014a), and may also be incompatible with decision‐critical tasks. Opioid use may therefore have direct implications on ability to work and economic productivity.
The American College of Occupational and Environmental Medicine's Evidence‐based Practice Guidelines conclude that quality evidence (moderate or high quality) does not support the concept of superiority of opioids over NSAIDs or other medications for the treatment of CNCP (Hegmann 2014b). Estimates of efficacy may also be inflated by inappropriate imputation methods (McQuay 2012). Furthermore, there is a relative dearth of literature available on how to discontinue opioids in high‐dose users (Windmill 2013).
In view of the absence of dependable, high‐quality evidence for long‐term benefits with the use of opioids for CNCP, the Centers for Disease Control and Prevention suggest utilising the lowest effective dose, with careful reassessment of benefits versus risks when increasing the dose to 50 morphine milligram equivalents or more per day (Dowell 2016).
How the intervention might work
This overview focused on the use of opioids for their key function of analgesia. Opium is a plant‐derived substance, with pharmacologically active ingredients including morphine and codeine. The term 'opioids' can refer to either naturally occurring compounds ('opiates') or synthetic compounds. Opioids act by binding to opioid receptors; mu, kappa, and delta opioid receptors are widely distributed throughout the nervous system (Rachinger‐Adam 2011). Opioids bring about complex changes at the cellular and molecular level, decreasing pain perception and increasing tolerance to painful stimuli (Borg 2014).
Other opioid actions include euphoria (Schulteis 1996), sedation, drowsiness, and endocrine dysregulation (Vuong 2010). Opioids alter sleep regulation, and are associated with poor sleep quality, insomnia, respiratory depression, sleep apnoea, and sleep‐disordered breathing (Zutler 2011). Physiological dependence on opioids may develop rapidly after the initiation of opioid use, leading to opioid abuse and dependence (opioid use disorder). Increasing doses of opioids over time are a common and significant concern with this group of medications (Kosten 2002).
A number of effects have been identified with the acute administration of opioids or in opioid‐naive people; it has been suggested that chronic opioid use results in fewer medical problems (Rass 2014). However, there are serious and potentially lethal adverse effects that may occur with long‐term use.
Why it is important to do this overview
Opioids are now commonly and increasingly used for the treatment of pain, including CNCP (Zutler 2011). In fact, there has been a large increase in the use of opioids for CNCP in recent years despite safety concerns and a lack of convincing evidence of effectiveness (Kidner 2009; Chapman 2010; Bohnert 2012). Evidence of utilisation of larger doses of opioids for the treatment of CNCP is emerging. For example, one analysis of Workers' Compensation Board (WCB) data (where the vast majority of claimants with pain would have non‐malignant pain) from Manitoba, Canada, demonstrated a dramatic increase in the average opioid dose prescribed over time: from less than 500 morphine milligram equivalents per person per year in 1998 to over 6000 morphine milligram equivalents per person per year in 2010. Moreover, compared to other Manitobans, the WCB claimant population was about twice as likely to be prescribed doses above 120 morphine milligram equivalents per day (Kraut 2015). Opioid use often continues post‐claim, and both duration and dose of post‐claim opioid use are correlated with the dose during the claim (Shafer 2015). Dramatic increases in the number of opioid prescriptions have been seen across the world since the 2000s, for example in the UK (Zin 2014), Australia (Leong 2009), and the USA (Manchikanti 2012a). The rate of dispensing of high‐dose opioids specifically (i.e. doses of 200 morphine milligram equivalents per day or greater) increased in Canada by 23% between 2006 and 2011 (Gomes 2014).
The previous perception of the adverse event profile associated with opioid use may have contributed to the current opioid use and overdose epidemic in North America, which has been decades in the making. A letter published in The New England Journal of Medicine in 1980 examined the incidence of narcotic addiction in 39,946 hospitalised medical patients and suggested that addiction was rare in patients treated with opioids (Porter 1980). Later in the 1980s, Portenoy and Foley described an addiction risk of lower than 1% (Portenoy 1986). By current standards, most of the patients in that study were not on high‐dose opioids: two‐thirds (n = 25) required a dose of less than 20 morphine milligram equivalents per day, while only four participants received more than 40 morphine milligram equivalents per day (Portenoy 1986). Another survey of 100 participants receiving opioids for CNCP (mean treatment duration 224 days) suggested partial or good relief for almost 80% of those participants, with the most common adverse events listed as nausea and constipation, but no reported cases of respiratory depression or addiction (Zenz 1992). Guidelines for managing CNCP published in 1995 in the Canadian Family Physician cited evidence in support of an extremely low risk of addiction and evidence of high rates of efficacy of opioids for CNCP, as well as a relative paucity of adverse events in people first receiving opioids for medical reasons (Hagen 1995).
However, the liberal use of opioids for CNCP has come under scrutiny due to questions about their effectiveness and the potential for adverse events, abuse, and addiction (NOUGG 2010; Franklin 2014; Häuser 2014; Nuckols 2014; Katz 2015). There has recently been considerable criticism of earlier publications and their role in contributing to the opioid epidemic. One seminal paper, Porter 1980, was described as having been "heavily and uncritically cited as evidence that addiction was rare with long‐term opioid therapy. We believe that this citation pattern contributed to the North American opioid crisis by helping to shape a narrative that allayed prescribers’ concerns about the risk of addiction associated with long‐term opioid therapy" (Leung 2017).
The updated Canadian opioid guidelines, Busse 2017, had also come under criticism for potential financial conflicts of interest (Howlett 2017), highlighting the need for independent and unbiased summaries of the evidence such as those provided by Cochrane.
In contrast to the early and more permissive approaches to opioid use for CNCP, more recent evidence suggests that opioid abuse and addiction are well documented among people with chronic pain (Vowles 2015). There is a potential for opioid addiction to develop even if these compounds are used for the management of severe pain (Kosten 2002; Huffman 2015; Vowles 2015). The risk for addiction increases with increasing opioid doses. Huffman and colleagues reported that a 50‐milligram increase in oral morphine milligram equivalent dose almost doubled the risk of addiction; a 100‐milligram dose increase was associated with a three‐fold increase in that risk (Huffman 2015).
There is furthermore the potential for serious adverse events. Serious adverse events, as defined by the US Food and Drug Administration, are those with patient outcomes of life‐threatening effects, hospitalisation, disability or permanent damage, intervention to prevent permanent impairment, drug dependence or abuse, death, or another event that jeopardises the patient or requires treatment to prevent one of the other outcomes (FDA 2016). Some outcomes, including sleep‐disordered breathing and respiratory depression, may result in opioid‐associated deaths and demonstrate a clear relationship to dose (Walker 2007; Jungquist 2012). Drug interactions are another concern, as is interaction with alcohol, which can result in several types of serious adverse events (McCance‐Katz 2010).
Hegmann and colleagues summarised the substantial increase in the use of opioids and the increase in deaths associated with opioids (Hegmann 2014b). Opioid‐related deaths are common and can occur even when the prescription is in accordance with guidelines. Most opioid‐related deaths in the USA (60%) occurred in people given prescriptions based on prescribing guidelines by medical boards (with 20% of deaths at doses of 100 morphine milligram equivalents per day or less, and 40% in people who received doses above that threshold). The remaining 40% of deaths occurred in people abusing the drugs (Manchikanti 2012a). Abuse of opioids may be related to multiple prescriptions/'double‐doctoring', requesting early refills, and drug diversion.
A consensus is emerging that long‐term opioid therapy for CNCP may be appropriate only for well‐selected populations (Manchikanti 2012b). Furthermore, agreement is building that high‐dose opioid treatment should be used with extreme caution for indications other than cancer pain.
Objectives
To provide an overview of the occurrence and nature of adverse events associated with any opioid agent (any dose, frequency, or route of administration) used on a medium‐ or long‐term basis for the treatment of CNCP in adults.
Methods
Criteria for considering reviews for inclusion
We included all Cochrane Reviews that assessed medium‐ or long‐term opioid use for CNCP due to any condition in adults. The reviews must have reported our specified adverse event outcomes. We planned to analyse data from trials of opioids versus placebo and opioids versus non‐opioid treatments. We planned to analyse data from randomised controlled trials (RCTs) and other study designs separately.
Search methods for identification of reviews
We searched the Cochrane Database of Systematic Reviews (the Cochrane Library), Issue 3, 2017, on 8 March 2017, using the search strategy presented in Appendix 1.
Data collection and analysis
Selection of reviews
Medium‐ and long‐term opioid use have been variably defined. For our overview, we defined opioid use between two weeks and two months as medium‐term and two months or longer as long‐term use. We would expect trial durations of two weeks or more to be relevant for a chronic painful condition. Included reviews therefore assessed RCTs of opioid use versus placebo or active (non‐opioid) comparator for two weeks or longer, for CNCP due to any condition in adults.
The reviews must also have reported the inclusion and exclusion criteria used to select studies and the presence or absence of one or more of our specified adverse event outcomes. We only included trials from the reviews that met our criteria in the analyses.
Data extraction and management
Two overview authors (of CE, VL, and TJ) independently screened the results of the electronic search by title and abstract to assess reviews for inclusion. We obtained the full‐text versions of reviews deemed potentially relevant and subsequently applied the eligibility criteria to determine final inclusion. Reasons for exclusion are detailed in Table 1. Any disagreements were resolved by discussion or by consulting a third overview author (SSt).
| Review | Reason for exclusion |
| Trials either included cancer pain, did not use opioids, or were not at least 2 weeks in duration. | |
| Did not exclude cancer pain | |
| Review update published as Gaskell 2016. | |
| No opioids studied. | |
| No opioids studied. | |
| Trials with opioids were less than 2 weeks in duration. | |
| No opioids studied. | |
| Trials with opioids were for acute pain. |
We piloted a standardised data extraction form on three reviews and revised this for clarity and comprehensiveness. At least two overview authors (of CE, TJ, DK, VL, BS, and FK) then independently extracted data using this form and assessed methodological quality. After completion of the analyses, two overview authors (CE, TJ) independently assessed the quality of the evidence for the outcomes of interest. Where we were unable to achieve consensus, we consulted a third overview author (SSt).
We extracted data on the following:
-
citation details;
-
conditions studied;
-
number of included studies;
-
study and participant characteristics;
-
opioid medications used, formulation, doses, and frequencies of administration;
-
adverse event outcomes;
-
which studies were eligible, if there were studies from the review that did not meet all of the eligibility criteria.
The adverse event outcomes of interest were:
-
number of participants with any adverse event;
-
number of participants with any serious adverse event;
-
number of participants who withdrew from the studies due to adverse events;
-
number of deaths;
-
number of participants who experienced the following specific adverse events (of any severity):
-
-
addiction;
-
cognitive dysfunction;
-
constipation;
-
depressive symptoms or other mood disturbances;
-
hypogonadism or other endocrine dysfunction;
-
infection;
-
respiratory depression;
-
sexual dysfunction;
-
sleep apnoea or sleep‐disordered breathing;
-
xerostomia.
-
We added the following adverse events, which were not originally identified by us as outcomes of interest, but were reported in the included reviews and deemed relevant:
-
-
anorexia (loss of appetite);
-
diarrhoea;
-
dizziness;
-
drowsiness;
-
fatigue;
-
headache;
-
hot flushes;
-
increased sweating;
-
nausea;
-
pruritus;
-
sinusitis;
-
unspecified gastrointestinal events;
-
unspecified neurological events;
-
vomiting.
-
We consulted the original study reports where necessary to clarify discrepancies in data across reviews, or where only partial data was presented in the reviews. Some adverse events were variably named between the trials and reviews; we accepted different terminology as long as it pertained to similar concepts. For example, we combined "drowsiness" and "somnolence". We added other specific adverse events that were described in the reviews, as listed above. If the reporting of adverse events had been specified by sex or ethnicity in any of the reviews, we would have extracted these data as well. We aimed primarily to compare opioids to control groups receiving placebo; we also undertook comparisons of opioids versus non‐opioid treatments.
Where data from a trial were presented in more than one review, these data were only included once and were ascribed to the review that was published first. There was one exception where the earliest review, Chaparro 2013, did not include data on adverse events for one study (O'Donnell 2009), and in this case we used the study data as presented in a later review (Enthoven 2016). Without such de‐duplication, studies would have been counted multiple times, as shown in Table 2. We have included an outcome matrix to show which outcomes were extractable from which reviews (see Table 3 for outcomes reported for opioids versus placebo, and Table 4 for opioids versus active comparators).
| Review | Total number of trials | Number of eligible trials | Number of trials also in other reviews | Number of de‐duplicated trials |
| 11 | 8 | 0 | 8 | |
| 21 | 5 | 4 | 5 | |
| 15 | 10 | 2 | 9 | |
| 22 | 19 | 2 | 18 | |
| 6 | 1 | 1 | 0 | |
| 1 | 1 | 0 | 1 | |
| 13 | 1 | 0 | 1 | |
| 5 | 5 | 4 | 1 | |
| 3 | 2 | 2 | 2 | |
| 31 | 13 | 10 | 6 | |
| 26 | 6 | 1 | 6 | |
| 3 | 1 | 0 | 1 | |
| 4 | 4 | 2 | 2 | |
| 1 | 1 | 0 | 1 | |
| 11 | 2 | 2 | 2 | |
| Totals | 173 | 79 | 29 | 63 |
| Events reported | Totals | ||||||||||||
| Any adverse event | X | X | X | X | X | X | 6 | ||||||
| Any serious adverse event | X | X | X | X | X | X | 6 | ||||||
| Withdrawals due to adverse events | X | X | X | X | X | X | X | X | X | X | 10 | ||
| Deaths | X | X | X | X | X | X | X | X | X | 9 | |||
| Anorexia | X | 1 | |||||||||||
| Constipation | X | X | X | X | 4 | ||||||||
| Diarrhoea | X | 1 | |||||||||||
| Dizziness | X | X | X | X | X | 5 | |||||||
| Drowsiness or somnolence | X | X | X | X | 4 | ||||||||
| Fatigue | X | 1 | |||||||||||
| Gastrointestinal (unspecified) | X | 1 | |||||||||||
| Headache | X | 1 | |||||||||||
| Hot flushes | X | 1 | |||||||||||
| Increased sweating | X | 1 | |||||||||||
| Infection | X | X | 2 | ||||||||||
| Nausea | X | X | X | X | 4 | ||||||||
| Nervous system (unspecified) | X | 1 | |||||||||||
| Pruritus | X | 1 | |||||||||||
| Sinusitis | X | 1 | |||||||||||
| Vomiting | X | X | X | 3 | |||||||||
| Xerostomia | X | 1 |
An "X" indicates that the outcome was reported (whether or not any participants experienced it).
In Cepeda 2006, "serious adverse events" were defined as adverse events that resulted in withdrawals. These data are therefore included in both categories for the review in question.
| Events reported | Totals | ||||||
| Any adverse event | X | X | 2 | ||||
| Any serious adverse event | X | 1 | |||||
| Withdrawals due to adverse events | X | X | X | X | 4 | ||
| Constipation | X | X | 2 | ||||
| Dizziness | X | 1 | |||||
| Drowsiness or somnolence | X | 1 | |||||
| Nausea | X | 1 | |||||
| Vomiting | X | 1 |
An "X" indicates that the outcome was reported (whether or not any participants experienced it).
Assessment of methodological quality of included reviews
An overview of Cochrane Reviews on adverse events associated with treatments for acute pain has established appropriate criteria (adapted from the AMSTAR (Assessing the Methodological Quality of Systematic Reviews) guidance), Shea 2007, for the quality assessment of the Cochrane Reviews to be included in an overview (Moore 2015b). Following this example, we assessed the reviews with the following questions.
-
Was an a priori design provided?
-
Was there duplicate study selection and data extraction?
-
Was a comprehensive literature search performed?
-
Were published and unpublished studies included irrespective of language of publication?
-
Was a list of studies (included and excluded) provided?
-
Were the characteristics of the included studies provided?
-
Was the scientific quality of the included studies assessed and documented?
-
Was the scientific quality of the included studies used appropriately in formulating conclusions?
-
Were the methods used to combine the findings of studies appropriate?
-
Was a conflict of interest stated?
Data synthesis
We performed qualitative and quantitative evidence syntheses as appropriate. For meta‐analysis, we used either a fixed‐effect or alternatively a random‐effects model as determined by between‐study heterogeneity. In addition to assessing statistical heterogeneity (I² statistic), we also considered clinical heterogeneity between the studies. We used a fixed‐effect model when there was no evidence of significant heterogeneity of either type. We calculated risk ratios (RRs) and numbers needed to treat for an additional harmful outcome (NNTH) from the pooled number of events using the method of Cook and Sackett (Cook 1995). We did not calculate an NNTH where the RR was not significant (the 95% confidence interval (CI) of the RR included 1). We also calculated the proportion of participants experiencing adverse events and associated 95% CIs; if the lower bound of such a 95% CI was calculated as negative, we reported it as 0, following the methodology of Moore and McQuay (Moore 2005). We conducted the methodology for our overview and for meta‐analyses according to the Cochrane Handbook for Systematic Reviews of Interventions (Higgins 2011). We performed our analyses for all opioid agents together. We had planned to conduct supplementary analyses for the individual opioid drugs and by trial duration. In some reviews, outcomes were reported only for a treatment group and not for the placebo or comparator group. We have therefore presented additional summary data for adverse events experienced with opioids from studies with or without reported comparators.
We assessed the quality of the evidence on adverse events associated with medium‐ and long‐term use of opioids for CNCP using the GRADE approach as applied in Cochrane Reviews (Higgins 2011). See Appendix 2 for a further description of the GRADE system.
Results
Our searches of the Cochrane Database of Systematic Reviews identified 421 records. We excluded 397 records based on titles and abstracts, and obtained the full texts of the remaining 24 records. We excluded eight reviews for reasons such as the reviews not reporting non‐cancer pain separately, not studying opioids, or investigating acute rather than chronic pain (Table 1).
We included 16 Cochrane Reviews in total. For a further description of our screening process, see the study flow diagram (Figure 1).

Study selection.
Description of included reviews
We included a total of 16 reviews in the overview, of which 15 presented quantitative data, and 14 of these presented quantitative data that was not already included in a previously published review. The 14 Cochrane Reviews containing novel quantitative data investigated 14 different opioid agents (buprenorphine, codeine, dextropropoxyphene, dihydrocodeine, fentanyl, hydromorphone, levorphanol, methadone, morphine, oxycodone, oxymorphone, tapentadol, tilidine, and tramadol) that were administered for a period of at least two weeks for CNCP and reported adverse events (Figure 1 and Table 5). The opioid agents and doses studied in the included reviews are detailed in Table 6. Conversions were performed to calculate the equivalent milligrams of morphine per 24 hours for each opioid studied, according to the sources in Table 7. Conversion factors for transdermal fentanyl were computed from the manufacturer's monograph (Fentanyl monograph 2017).
| Review | Date assessed as up‐to‐date | Condition(s) studied | Participant characteristics | Inclusion criteria | Exclusion criteria | Duration of treatment in eligible studies |
| Oct‐11 | Phantom limb pain | Participants of any age with established phantom limb pain | Pharmacologic agents given singly or in combination | Stump/residual limb pain alone, or postamputation pain that was not phantom pain, or phantom pain mixed with other neuropathic pains; pharmacologic interventions aimed at preventing phantom limb pain | 10 weeks (no quantitative data reported on outcomes of interest) | |
| May‐06 | Osteoarthritis | Adults with primary or secondary osteoarthritis of the hip or knee | Tramadol or tramadol plus paracetamol used | Other types of arthritis; non‐osteoarthritic joint pain or back pain | 14 to 91 days | |
| Apr‐12 | Neuropathic pain | Adults with neuropathic pain | Compared combinations of 2 or more drugs against placebo or another comparator | Studies with a neuraxial approach or that included injection therapies, transcutaneous electrical stimulation, or vitamins | 5 to 36 weeks (includes a cross‐over trial of 9 weeks with 4 conditions) | |
| Apr‐13 | CLBP | Adults with persistent pain in the low back for at least 12 weeks | Any opioid prescribed in an outpatient setting for 1 month or longer | Participants with cancer, infections, inflammatory arthritic conditions, compression fractures, or studies where less than 50% of participants had CLBP | 4 to 15 weeks | |
| Aug‐12 | Osteoarthritis | Adults with osteoarthritis of the knee or hip | Any type of opioid except tramadol | Trials with inflammatory arthritis exclusively or with less than 75% of participants having osteoarthritis of the knee or hip | 2 to 30 weeks | |
| Jan‐15 | Neuropathic pain | Adults with a chronic neuropathic pain condition | Nortriptyline at any dose, by any route, compared to placebo or any active comparator | Nortriptyline given in combination with other drugs, without separate reporting | 28 weeks (no unique data was reported) | |
| Jun‐16 | Neuropathic pain | Adults with postherpetic neuralgia, complex regional pain syndrome, or chronic postoperative pain | Fentanyl at any dose, by any route | Treatment of < 2 weeks | 94 to 113 days | |
| Jun‐15 | CLBP | Adults with non‐specific CLBP for at least 12 weeks | 1 or more types of NSAIDs used | Trials of NSAIDs no longer available on the market; participants with sciatica or with specific low back pain caused by pathological entities, e.g. infection, neoplasm, metastases, osteoporosis, rheumatoid arthritis, or fractures | 6 weeks | |
| Dec‐15 | Chronic neuropathic pain | Adults with painful diabetic neuropathy or postherpetic neuralgia | Any dose or formulation of oxycodone | Fewer than 10 participants per treatment arm, or less than 2 weeks of treatment | 12 weeks | |
| Apr‐12 | CNCP | Adults having any type of CNCP | Methadone by any route in randomised or quasi‐randomised studies | Studies with fewer than 10 participants | 40 to 119 days | |
| Aug‐13 | Neuropathic pain | Adults with central or peripheral neuropathic pain of any aetiology | Opioid agonists used in an RCT | Partial opioid agonists or agonist‐antagonists used | 6 to 16 weeks (includes a 6‐ and 8‐week cross‐over trial with 2 conditions) | |
| May‐09 | CNCP | Adults with chronic pain for at least 3 months | Treament for at least 6 months | Fewer than 10 participants | 2 weeks to 13 months | |
| Dec‐09 | CLBP | Adults with CLBP, with or without radiating pain | Mean duration of CLBP > 12 weeks | Single‐treatment studies; studies examining specific pathologies (e.g. sciatica) | 6 weeks | |
| Mar‐14 | CNCP | Adults with osteoarthritis of the knee or hip, CLBP | Tapentadol ER in doses of 100 to 500 mg/day | Pain for less than 3 months or that was not moderate to severe | 15 to 52 weeks | |
| Nov‐15 | Neuropathic pain | Adults with 1 or more chronic neuropathic pain conditions | Hydromorphone at any dose, by any route | Treatment of < 2 weeks | 14 to 16 weeks | |
| May‐10 | Rheumatoid arthritis pain | Adults with rheumatoid arthritis | Opioids of any formulation at any dose, by any route | Studies of opioid therapy for rheumatoid arthritis in the immediate postoperative setting | 6 to 10 weeks |
CLBP: chronic low back pain
CNCP: chronic non‐cancer pain
NSAIDs: non‐steroidal anti‐inflammatory drugs
RCT: randomised controlled trial
Tapentadol ER: tapentadol extended‐release
| Drug | Formulations | Dosing Schedule | Dose (lowest) | Dose (highest) | MEq (lowest) | MEq (highest) | ||||||||||||||
| Buprenorphine | Transdermal patch (µg/h) | ‐ | 5 µg/h | 40 µg/h | 12 | 96 | X | X | ||||||||||||
| Codeine | Contin | Twice a day, 3 times a day | 32 | 200 | 4.8 | 30 | X | X | ||||||||||||
| Dextropropoxyphene | ‐ | 3 times a day | 300 | ‐ | 30 | ‐ | X | |||||||||||||
| Dihydrocodeine | LA | Every 12 hours | 30 | 240 | 3 | 24 | X | X | ||||||||||||
| Fentanyl | Transdermal patch (µg/h) | ‐ | 12.5 µg/h | 250 µg/h | 45 | 944 | X | X | X | |||||||||||
| Hydromorphone | ER, OROS | Once a day | 4 | 64 | 16 | 256 | X | X | ||||||||||||
| Levorphanol | ‐ | 3 times a day | 0.45 | 15.75 | 4.95 | 173.5 | X | |||||||||||||
| Methadone | ‐ | Twice a day | 5 | 80 | 15 | 240 | X | X | ||||||||||||
| Morphine | Avinza, Contin, CR, ER, LA, SR | Twice a day, once a day, every 12 hours, as needed | 15 | 300 | 15 | 300 | X | X | X | X | X | X | X | |||||||
| Oxycodone | CR, ER, LA, MR, PR, immediate‐release, liquid | Twice a day, 3 times a day to 6 times a day | 10 | 160 | 15 | 240 | X | X | X | X | X | X | X | |||||||
| Oxycodone and naloxone | PR | ‐ | ‐ | ‐ | ‐ | ‐ | X | |||||||||||||
| Oxycodone and naltrexone | ‐ | 4 times a day | 10 | 40 | 15 | 60 | X | |||||||||||||
| Oxymorphone | ER | Twice a day, every 12 hours | 10 | 140 | 30 | 420 | X | X | ||||||||||||
| Tapentadol | ER, immediate‐release | Twice a day, 3 times a day to 6 times a day | 100 | 500 | 40 | 200 | X | X | X | |||||||||||
| Tilidine and naloxone | ‐ | ‐ | 4 | 12 | 10 | 30 | X | |||||||||||||
| Tramadol | ER, LP, Retard | Twice a day, as needed, 3 times a day, 4 times a day, once a day, every 12 hours | 37.5 | 400 | 3.75 | 40 | X | X | X | X | X |
Dose is given in milligrams, except for transdermal opioids, which are given in micrograms.
CR: controlled‐release
ER: extended‐release
LA: long‐acting
LP: sustained‐release (libération prolongée)
MEq: the equivalent number of milligrams of morphine per 24‐hour period
MR: modified‐release
OROS: extended‐release (registered trademark)
PR: Prolonged release
Retard: prolonged‐release
SR: sustained‐release
| Opioid | Source | Equivalent dose of oral morphine, in mg, per 1 mg of the converted opioid |
| Buprenorphine (transdermal) | 100 | |
| Codeine | 0.15 | |
| Dextropropoxyphene | 0.1 | |
| Dihydrocodeine | 0.1 | |
| Fentanyl (transdermal) | 158* | |
| Hydromorphone | 4 | |
| Levorphanol | 7.5 | |
| Methadone | 3 | |
| Oxycodone | 1.5 | |
| Oxymorphone | 3 | |
| Tapentadol | 0.4 | |
| Tilidine | 0.2 | |
| Tramadol | 0.1 |
Transdermally delivered opioid doses (buprenorphine and fentanyl) are usually expressed as an hourly rate of delivery, but were converted to the dose per 24 hours before being converted into morphine equivalents.
*Calculated as the mean conversion factor from data in Fentanyl monograph 2017.
On appraising the reviews, we added the following adverse events to our prespecified list of specific adverse events: anorexia, diarrhoea, dizziness, drowsiness, fatigue, headache, hot flushes, increased sweating, nausea, pruritus, sinusitis, unspecified gastrointestinal events, unspecified neurological events, and vomiting.
Seven of our prespecified adverse events were not reported in any of the included reviews: addiction, cognitive dysfunction, depressive symptoms or mood disturbance, hypogonadism or other endocrine dysfunction, respiratory depression, sexual dysfunction, and sleep apnoea or sleep‐disordered breathing. In our overview, we extracted data on serious adverse events if they were reported as such in the included Cochrane Reviews.
We found no data for adverse events analysed by sex or ethnicity. We excluded data from studies under two weeks' duration from the analysis.
In some reviews, outcomes were reported only for a treatment group and not for the placebo group. We have therefore presented summary data for opioids used with or without a comparator as supplementary analyses (Table 8, Table 9, and Table 10).
| Review | Events | Total | Event rate (%) | |
| Average | 95% CI | |||
| 481 | 1613 | 29.8 | 27.6 to 32.1 | |
| 2145 | 2725 | 78.7 | 77.2 to 80.3 | |
| 454 | 785 | 57.8 | 54.4 to 61.3 | |
| 40 | 48 | 83.3 | 72.8 to 93.9 | |
| 1 | 17 | 5.9 | ‐5.3 to 17.1 | |
| 766 | 894 | 85.7 | 83.4 to 88 | |
| 21 | 43 | 48.8 | 33.9 to 63.8 | |
| Total events | 3908 | 6622 | 59.0 | 57.8 to 60.2 |
CI: confidence interval
| Review | Events | Total | Event rate (%) | |
| Average | 95% CI | |||
| 196 | 899 | 21.8 | 19.1 to 24.5 | |
| 9 | 355 | 2.5 | 0.9 to 4.2 | |
| 4 | 48 | 8.3 | 0.5 to 16.2 | |
| 73 | 1767 | 4.1 | 3.2 to 5.1 | |
| 6 | 134 | 4.5 | 1 to 8 | |
| Total events | 288 | 3203 | 9.0 | 8 to 10 |
CI: confidence interval
| Review | Events | Total | Event rate (%) | |
| Average | 95% CI | |||
| 196 | 899 | 21.8 | 19.1 to 24.5 | |
| 63 | 526 | 12.0 | 9.2 to 14.8 | |
| 1169 | 4398 | 26.6 | 25.3 to 27.9 | |
| 132 | 785 | 16.8 | 14.2 to 19.5 | |
| 3 | 48 | 6.3 | 0 to 13.1 | |
| 11 | 90 | 12.2 | 5.5 to 19 | |
| 19 | 177 | 10.7 | 6.2 to 15.3 | |
| 620 | 1830 | 33.9 | 31.7 to 36.1 | |
| 480 | 1770 | 27.1 | 24.9 to 29.3 | |
| 3 | 43 | 7.0 | 7 to 7 | |
| 3 | 11 | 27.3 | 27.3 to 27.3 | |
| Total events | 2699 | 10,577 | 25.5 | 25.5 to 25.5 |
In some reviews, specific adverse event outcomes were reported only as qualitative data. For example, a review on phantom limb pain noted that constipation, nausea, and drowsiness were commonly reported in opioid trials (Alviar 2011). The occurrence of these adverse events as most common or frequent was echoed by two other reviews (Cepeda 2006; Whittle 2011), which presented quantitative data only for generic adverse event outcomes.
Methodological quality of included reviews
The AMSTAR quality assessment found that only two of the criteria were not met by all reviews (Table 11). Two reviews did not explicitly describe duplicate, independent study selection and data extraction (Chaparro 2012; Enthoven 2016). Three reviews did not state that they included non‐English, unpublished, and/or grey literature in their searches (Noble 2010; Chaparro 2013; McNicol 2013).
| AMSTAR criteria | ||||||||||||||||
| 1. A priori design | 1 | 1 | 1 | 1 | 1 | 1 | 1 | 1 | 1 | 1 | 1 | 1 | 1 | 1 | 1 | 1 |
| 2. Duplicate selection and extraction | 1 | 1 | 0 | 1 | 1 | 1 | 1 | 0 | 1 | 1 | 1 | 1 | 1 | 1 | 1 | 1 |
| 3. Comprehensive literature search | 1 | 1 | 1 | 1 | 1 | 1 | 1 | 1 | 1 | 1 | 1 | 1 | 1 | 1 | 1 | 1 |
| 4. Published and unpublished, no language restrictions | 1 | 1 | 1 | 0 | 1 | 1 | 1 | 1 | 1 | 1 | 0 | 0 | 1 | 1 | 1 | 1 |
| 5. List of studies provided | 1 | 1 | 1 | 1 | 1 | 1 | 1 | 1 | 1 | 1 | 1 | 1 | 1 | 1 | 1 | 1 |
| 6. Characteristics of studies provided | 1 | 1 | 1 | 1 | 1 | 1 | 1 | 1 | 1 | 1 | 1 | 1 | 1 | 1 | 1 | 1 |
| 7. Scientific quality assessed | 1 | 1 | 1 | 1 | 1 | 1 | 1 | 1 | 1 | 1 | 1 | 1 | 1 | 1 | 1 | 1 |
| 8. Scientific quality used in formulating conclusions | 1 | 1 | 1 | 1 | 1 | 1 | 1 | 1 | 1 | 1 | 1 | 1 | 1 | 1 | 1 | 1 |
| 9. Methods used to combine appropriate | 1 | 1 | 1 | 1 | 1 | 1 | 1 | 1 | 1 | 1 | 1 | 1 | 1 | 1 | 1 | 1 |
| 10. Conflict of interest stated | 1 | 1 | 1 | 1 | 1 | 1 | 1 | 1 | 1 | 1 | 1 | 1 | 1 | 1 | 1 | 1 |
| Total score/10 | 10 | 10 | 9 | 9 | 10 | 10 | 10 | 9 | 10 | 10 | 9 | 9 | 10 | 10 | 10 | 10 |
AMSTAR: Assessing the Methodological Quality of Systematic Reviews
GRADE quality judgement
The GRADE quality judgements, which are detailed in Table 12, Table 13, Table 14, and Table 15, revealed the following:
| Participants (reviews) | Risk of bias | Inconsistency | Indirectness | Imprecision | Other considerations | Overall quality of evidence | |
| Any adverse event | 1583 | Serious | Not serious | Not serious | Not serious | None | +++◯ |
| Any serious adverse event | 108 | Serious | Not serious | Not serious | Not serious | None | +++◯ MODERATE |
| Withdrawals due to adverse events | 2375 | Serious | Not serious | Not serious | Not serious | None | +++◯ |
| Participants (reviews) | Risk of bias | Inconsistency | Indirectness | Imprecision | Other considerations | Overall quality of evidence | |
| Constipation | 4255 (4 reviews) | Serious | Not serious | Serious | Not serious | Strong association | +++◯ |
| Dizziness | 4130 (4 reviews) | Serious | Not serious | Serious | Not serious | Strong association | +++◯ |
| Drowsiness or somnolence | 3856 (3 reviews) | Serious | Not serious | Serious | Not serious | Strong association | +++◯ |
| Fatigue | 1589 (1 review) | Serious | Not serious | Very serious | Not serious | None | +◯◯◯ |
| Hot flushes | 593 (1 review) | Serious | Not serious | Very serious | Not serious | None | +◯◯◯ |
| Increased sweating | 1350 (1 review) | Serious | Not serious | Very serious | Not serious | Very strong association | +++◯ |
| Nausea | 4346 (3 reviews) | Serious | Not serious | Serious | Not serious | Strong association | +++◯ |
| Pruritus | 2865 (1 review) | Serious | Not serious | Very serious | Not serious | None | +◯◯◯ |
| Vomiting | 3368 (2 reviews) | Serious | Not serious | Very serious | Not serious | Strong association | ++◯◯ |
| Participants (reviews) | Risk of bias | Inconsistency | Indirectness | Imprecision | Other considerations | Overall quality of evidence | |
| Any adverse event | 1583 | Serious | Not serious | Not serious | Not serious | None | +++◯ |
| Any serious adverse event | 108 | Serious | Not serious | Not serious | Very serious | None | +◯◯◯ |
| Withdrawals due to adverse events | 2375 | Serious | Not serious | Not serious | Not serious | None | +++◯ |
| Participants (reviews) | Risk of bias | Inconsistency | Indirectness | Imprecision | Other considerations | Overall quality of evidence | |
| Any adverse event | 32 (1 review) | Very serious | Not serious | Not serious | Not serious | None | +◯◯◯ |
Opioids compared to placebo
-
Any adverse event: moderate quality of evidence
-
Any serious adverse event: moderate quality of evidence
-
Withdrawal due to adverse events: moderate quality of evidence
-
Constipation: moderate quality of evidence
-
Dizziness: moderate quality of evidence
-
Drowsiness or somnolence: moderate quality of evidence
-
Fatigue: very low quality of evidence
-
Hot flushes: very low quality of evidence
-
Increased sweating: moderate quality of evidence
-
Nausea: moderate quality of evidence
-
Pruritus: very low quality of evidence
-
Vomiting: low quality of evidence
Opioids compared to active (non‐opioid) pharmacological comparators
-
Any adverse event: moderate quality of evidence
-
Any serious adverse event: very low quality of evidence
-
Withdrawal due to adverse events: moderate quality of evidence
Opioids compared to non‐pharmacological interventions
-
Any adverse event: very low quality of evidence
Effect of interventions
Opioids compared to placebo
Number of participants with any adverse event
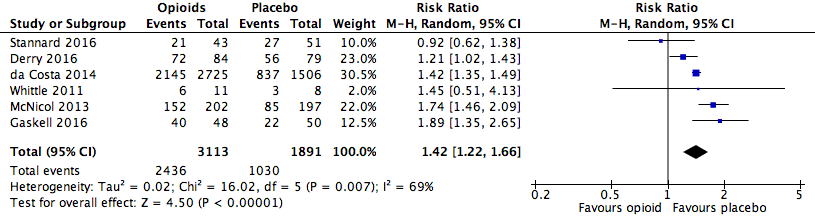
There was a significantly increased risk of experiencing any adverse event with opioids compared to placebo (risk ratio (RR) 1.42, 95% confidence interval (CI) 1.22 to 1.66; Figure 2 and Table 16). The absolute event rate was 78% (Table 17).
Analysis 1.1: Opioids versus placebo, any adverse event.
CI: confidence interval
df: degrees of freedom
M‐H: Mantel‐Haenszel method of meta‐analysis
P: probability
Z: Z score (standard score)
| Adverse event | Studies | Participants | Statistical method | Risk ratio | NNTH |
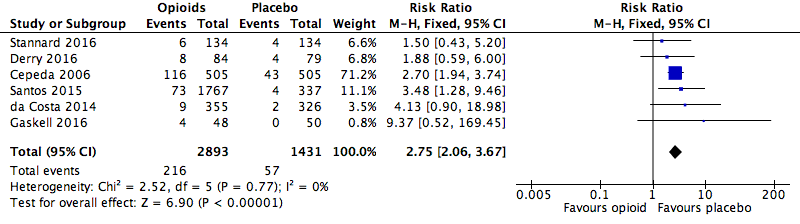
| Any adverse event | 6 | 5004 | Risk Ratio (M‐H, Random, 95% CI) | 1.42 (1.22, 1.66) | 4.20 (3.78, 4.74) |
| Any serious adverse event | 6 | 4324 | Risk Ratio (M‐H, Fixed, 95% CI) | 2.75 (2.06, 3.67) | 28.71 (20.50, 47.88) |
| Withdrawals due to adverse events | 10 | 11,510 | Risk Ratio (M‐H, Fixed, 95% CI) | 3.40 (3.02, 3.82) | 5.55 (5.19, 5.97) |
CI: confidence interval
M‐H: Mantel‐Haenszel method of meta‐analysis
| Opioid | Placebo | ||||||||
| Number of participants | Event rate (%) | Number of participants | Event rate (%) | ||||||
| Analysis | Adverse event | With AE | Total | Average | 95% CI | With AE | Total | Average | 95% CI |
| 1.1 | Any adverse event | 2436 | 3113 | 78.3 | 76.8 to 79.7 | 1030 | 1891 | 54.5 | 52.2 to 56.7 |
| 1.2 | Any serious adverse event | 216 | 2893 | 7.5 | 6.5 to 8.4 | 57 | 1431 | 4.0 | 3 to 5 |
| 1.3 | Withdrawals due to adverse events | 1836 | 7316 | 25.1 | 24.1 to 26.1 | 297 | 4194 | 7.1 | 6.3 to 7.9 |
| 2.1 | Constipation | 285 | 2513 | 11.3 | 10.1 to 12.6 | 94 | 1742 | 5.4 | 4.3 to 6.5 |
| 2.6 | Dizziness | 284 | 2448 | 11.6 | 10.3 to 12.9 | 71 | 1682 | 4.2 | 3.3 to 5.2 |
| 2.7 | Drowsiness or somnolence | 237 | 2313 | 10.3 | 9 to 11.5 | 57 | 1543 | 3.7 | 2.8 to 4.6 |
| 2.8 | Fatigue | 57 | 796 | 7.2 | 5.4 to 8.9 | 29 | 793 | 3.7 | 2.4 to 5 |
| 2.10 | Hot flushes | 14 | 295 | 4.8 | 2.3 to 7.2 | 5 | 298 | 1.7 | 0.2 to 3.1 |
| 2.11 | Increased sweating | 32 | 674 | 4.7 | 3.1 to 6.3 | 2 | 676 | 0.3 | 0.0 to 0.7 |
| 2.12 | Nausea | 535 | 2556 | 20.9 | 20.9 to 20.9 | 151 | 1790 | 8.4 | 8.4 to 8.4 |
| 2.13 | Pruritus | 155 | 1809 | 8.6 | 8.6 to 8.6 | 52 | 1056 | 4.9 | 4.9 to 4.9 |
| 2.15 | Vomiting | 184 | 2058 | 8.9 | 8.9 to 8.9 | 28 | 1310 | 2.1 | 2.1 to 2.1 |
AE: adverse event
CI: confidence interval
Number of participants with any serious adverse event
There was an increased risk of experiencing any serious adverse event with opioids compared to placebo (RR 2.75, 95% CI 2.06 to 3.67; Figure 3). The absolute event rate was 7.5% (Table 17).
Analysis 1.2: Opioids versus placebo, any serious adverse event.
CI: confidence interval
df: degrees of freedom
M‐H: Mantel‐Haenszel method of meta‐analysis
P: probability
Z: Z score (standard score)
Number of participants who withdrew from the studies due to adverse events
We found that the risk of participants withdrawing from the trials due to adverse events was significantly increased with opioid treatment compared to placebo (RR 3.40, 95% CI 3.02 to 3.82; Figure 4). The absolute event rate was 25% (Table 17).

Analysis 1.3: Opioids versus placebo, withdrawals due to adverse events.
CI: confidence interval
df: degrees of freedom
M‐H: Mantel‐Haenszel method of meta‐analysis
P: probability
Z: Z score (standard score)
Number of deaths
A total of two deaths were reported in the included reviews (da Costa 2014 and Gaskell 2016). In one RCT, Afilalo 2010, reviewed in da Costa 2014, the death occurred in the oxycodone group and was ascribed to myocardial infarction. The death in Gimbel 2003, reviewed in Gaskell 2016, was also in an oxycodone group and was ascribed to acute renal failure.
Number of participants who experienced specific adverse events (of any severity)
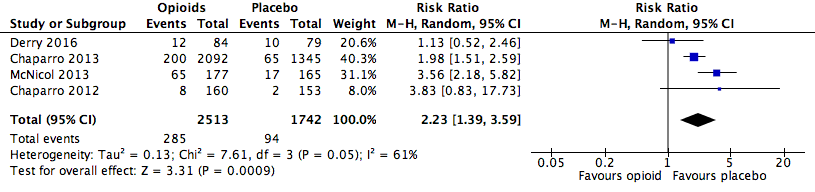
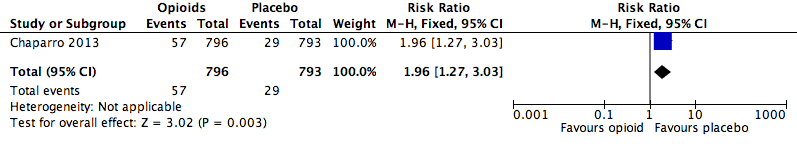
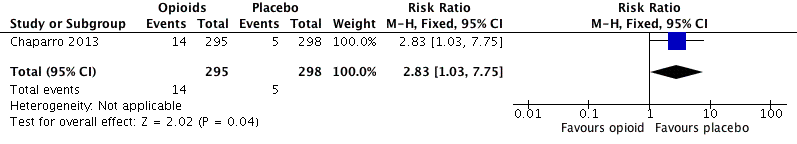
We also found significantly increased risk ratios with opioids compared to placebo for a number of specific adverse events: constipation (Figure 5), dizziness (Figure 6), drowsiness (Figure 7), fatigue (Figure 8), hot flushes (Figure 9), increased sweating (Figure 10), nausea (Figure 11), pruritus (Figure 12), and vomiting (Figure 13). Table 18 summarises the specific adverse events with opioids and placebo.
Analysis 2.1: Opioids versus placebo, constipation.
CI: confidence interval
df: degrees of freedom
M‐H: Mantel‐Haenszel method of meta‐analysis
P: probability
Z: Z score (standard score)

Analysis 2.6: Opioids versus placebo, dizziness.
CI: confidence interval
df: degrees of freedom
M‐H: Mantel‐Haenszel method of meta‐analysis
P: probability
Z: Z score (standard score)

Analysis 2.7: Opioids versus placebo, drowsiness.
CI: confidence interval
df: degrees of freedom
M‐H: Mantel‐Haenszel method of meta‐analysis
P: probability
Z: Z score (standard score)
Analysis 2.8: Opioids versus placebo, fatigue.
CI: confidence interval
df: degrees of freedom
M‐H: Mantel‐Haenszel method of meta‐analysis
P: probability
Z: Z score (standard score)
Analysis 2.10: Opioids versus placebo, hot flushes.
CI: confidence interval
df: degrees of freedom
M‐H: Mantel‐Haenszel method of meta‐analysis
P: probability
Z: Z score (standard score)

Analysis 2.11: Opioids versus placebo, increased sweating.
CI: confidence interval
df: degrees of freedom
M‐H: Mantel‐Haenszel method of meta‐analysis
P: probability
Z: Z score (standard score)

Analysis 2.12: Opioids versus placebo, nausea.
CI: confidence interval
df: degrees of freedom
M‐H: Mantel‐Haenszel method of meta‐analysis
P: probability
Z: Z score (standard score)

Analysis 2.13: opioids versus placebo, pruritus.
CI: confidence interval
df: degrees of freedom
M‐H: Mantel‐Haenszel method of meta‐analysis
P: probability
Z: Z score (standard score)

Analysis 2.15: Opioids versus placebo, vomiting.
CI: confidence interval
df: degrees of freedom
M‐H: Mantel‐Haenszel method of meta‐analysis
P: probability
Z: Z score (standard score)
| Adverse event | Studies | Participants | Statistical method | Risk ratio | NNTH |
| Anorexia | 1 | 330 | Risk Ratio (M‐H, Fixed, 95% CI) | 13.64 (0.77, 240.21) | ‐ |
| Constipation | 4 | 4255 | Risk Ratio (M‐H, Random, 95% CI) | 2.23 (1.39, 3.59) | 16.82 (13.20, 23.19) |
| Diarrhoea | 1 | 313 | Risk Ratio (M‐H, Fixed, 95% CI) | 2.55 (0.69, 9.43) | ‐ |
| Dizziness | 4 | 4130 | Risk Ratio (M‐H, Fixed, 95% CI) | 2.76 (2.15, 3.55) | 13.55 (11.15, 17.28) |
| Drowsiness, sleepiness, somnolence, or anergia | 3 | 3856 | Risk Ratio (M‐H, Fixed, 95% CI) | 2.89 (2.19, 3.83) | 15.26 (12.34, 20.00) |
| Fatigue | 1 | 1589 | Risk Ratio (M‐H, Fixed, 95% CI) | 1.96 (1.27, 3.03) | 28.54 (17.48, 77.71) |
| Gastrointestinal (unspecified) | 1 | 98 | Risk Ratio (M‐H, Fixed, 95% CI) | 1.77 (0.90, 3.47) | ‐ |
| Headache | 1 | 313 | Risk Ratio (M‐H, Fixed, 95% CI) | 0.78 (0.33, 1.84) | ‐ |
| Hot flushes | 1 | 593 | Risk Ratio (M‐H, Fixed, 95% CI) | 2.83 (1.03, 7.75) | 32.60 (16.95, 421.76) |
| Increased sweating | 1 | 1350 | Risk Ratio (M‐H, Fixed, 95% CI) | 16.05 (3.86, 66.69) | 22.46 (16.37, 35.78) |
| Infection | 2 | 631 | Risk Ratio (M‐H, Fixed, 95% CI) | 0.87 (0.47, 1.61) | ‐ |
| Nausea | 3 | 4346 | Risk Ratio (M‐H, Fixed, 95% CI) | 2.46 (2.08, 2.92) | 8.00 (6.88, 9.56) |
| Nervous system disorders (unspecified) | 1 | 98 | Risk Ratio (M‐H, Fixed, 95% CI) | 2.50 (0.95, 6.56) | ‐ |
| Pruritus | 1 | 2865 | Risk Ratio (M‐H, Fixed, 95% CI) | 1.74 (1.28, 2.36) | 27.44 (18.25, 55.27) |
| Sinusitis | 1 | 318 | Risk Ratio (M‐H, Fixed, 95% CI) | 1.56 (0.52, 4.67) | ‐ |
| Vomiting | 2 | 3368 | Risk Ratio (M‐H, Fixed, 95% CI) | 4.29 (2.90, 6.34) | 14.70 (12.10, 18.72) |
| Xerostomia | 1 | 1668 | Risk Ratio (M‐H, Fixed, 95% CI) | 1.10 (0.47, 2.57) | ‐ |
CI: confidence interval
M‐H: Mantel‐Haenszel method of meta‐analysis
Opioids versus active pharmacological comparators
Table 19 outlines the active comparators in the included reviews.
| Drug | Total dose per day | Dosing schedule | ||||
| Celecoxib | 400 mg | ‐ | X | |||
| Desipramine | 10 to 160 mg | ‐ | X | |||
| Diclofenac | 25 to 150 mg | Up to 3 times a day | X | |||
| Gabapentin | 1200 to 3600 mg | 3 times a day | X | |||
| Lorazepam | 0.7 to 1.6 mg | Twice a day and 3 times a day | X | |||
| Naproxen | 250 to 1000 mg | ‐ | X | |||
| Nortriptyline | 10 to 160 mg | Twice a day | X | X |
An "X" indicates that the drug was used as an active comparator to opioids in the review.
Rubinstein 2011 used a non‐pharmacological comparator (spinal manipulative therapy).
Number of participants with any adverse event
The absolute event rate for any adverse event with opioids compared with active pharmacological comparators was 58% (Figure 14 and Table 20).

Analysis 3.1: Opioids versus active pharmacological comparator, any adverse event.
CI: confidence interval
df: degrees of freedom
M‐H: Mantel‐Haenszel method of meta‐analysis
P: probability
Z: Z score (standard score)
| Opioid | Active comparator | ||||||||
| Number of participants | Event rate (%) | Number of participants | Event rate (%) | ||||||
| Analysis | Adverse event | With AE | Total | Average | 95% CI | With AE | Total | Average | 95% CI |
| 1.1 | Any adverse event | 454 | 785 | 57.8 | 54.4 to 61.3 | 381 | 798 | 47.7 | 44.3 to 51.2 |
| 1.2 | Any serious adverse event | 5 | 54 | 9.3 | 1.5 to 17 | 1 | 54 | 1.9 | 0 to 5.4 |
| 1.3 | Withdrawals due to adverse events | 185 | 1201 | 15.4 | 13.4 to 17.4 | 56 | 1174 | 4.8 | 3.6 to 6 |
AE: adverse event
CI: confidence interval
Number of participants with any serious adverse event
The absolute event rate for any serious adverse event with opioids compared with active pharmacological comparators was 9.3% (Figure 15 and Table 20).

Analysis 3.2: Opioids versus active pharmacological comparator, any serious adverse event.
CI: confidence interval
df: degrees of freedom
M‐H: Mantel‐Haenszel method of meta‐analysis
P: probability
Z: Z score (standard score)
Number of participants who withdrew from the studies due to adverse events
The risk of withdrawals from the trials due to adverse events was increased in participants treated with opioids compared to other active pharmacological interventions (RR 3.23, 95% CI 2.42 to 4.30; Figure 16 and Table 21). The absolute event rate for withdrawal from studies due to adverse events for those taking opioids was 15% (Table 20).

Analysis 3.3: Opioids versus active pharmacological comparator, withdrawals due to adverse events.
CI: confidence interval
df: degrees of freedom
M‐H: Mantel‐Haenszel method of meta‐analysis
P: probability
Z: Z score (standard score)
| Adverse event | Studies | Participants | Statistical method | Risk ratio | NNTH |
| Any adverse event | 1 | 1583 | Risk Ratio (M‐H, Random, 95% CI) | 1.21 (1.10, 1.33) | 9.91 (6.67, 19.24) |
| Any serious adverse event | 1 | 108 | Risk Ratio (M‐H, Fixed, 95% CI) | 5.00 (0.60, 41.39) | ‐ |
| Withdrawals due to adverse events | 4 | 2375 | Risk Ratio (M‐H, Fixed, 95% CI) | 3.23 (2.42, 4.30) | 9.40 (7.69, 12.11) |
CI: confidence interval
M‐H: Mantel‐Haenszel method of meta‐analysis
Number of deaths
No deaths were reported.
Number of participants who experienced specific adverse events (of any severity)
No data was reported.
Opioids versus active non‐pharmacological comparators
Number of participants with any adverse event
The absolute event rate for any adverse event with opioids compared with active non‐pharmacological comparators was 5.8% (Figure 17 and Table 22).

Analysis 4.1: Opioids versus active non‐pharmacological comparator, any adverse event.
CI: confidence interval
df: degrees of freedom
M‐H: Mantel‐Haenszel method of meta‐analysis
P: probability
Z: Z score (standard score)
| Opioid | Active comparator | ||||||||
| Number of participants | Event rate (%) | Number of participants | Event rate (%) | ||||||
| Analysis | Adverse event | With AE | Total | Average | 95% CI | With AE | Total | Average | 95% CI |
| 1.1 | Any adverse event | 1 | 17 | 5.8 | 0 to 17.1 | 0 | 15 | 0 | 0 to 0 |
AE: adverse event
CI: confidence interval
Discussion
Given the current evidence of limited efficacy and risk for serious adverse events, primary care providers often find the treatment of the common condition of CNCP to be challenging (Dowell 2016). There are substantial variations in clinical practice, influenced by politics, economics, and socioeconomic variables, which complicate generalisation of solutions (Moore 2010). Similarly, physicians' opioid prescribing practices are impacted by several factors, including societal and normative values as well as prescribers' perception of efficacy of the opioid and the risk of adverse events. Earlier studies, which have not always been conducted to current methodological standards, suggest a relative paucity of opioid‐related adverse events, including reports of a low risk of addiction with the use of opioids (Porter 1980; Portenoy 1986).
The perception of infrequent adverse events and even more infrequent serious adverse events, along with advocacy by special interest groups aimed at remedying an undertreatment of chronic pain, and with marketing efforts by opioid manufacturers, arguably resulted in a bolstering of prescribing by physicians. Reliance on earlier studies with less robust methodology may have contributed to the current opioid use epidemic and opioid overdoses and deaths. In the midst of a public health crisis related to opioid use and overdoses, there was a need to examine the existing evidence to determine the true nature of occurrence of adverse events, as well as the efficacy of commonly used approaches to the management of CNCP. This overview suggests that the occurrence of adverse events with opioids for CNCP is both common and clinically relevant.
Summary of main results
This overview included 16 Cochrane Reviews, of which 15 reported quantitative data, and 14 of these contained data not already presented in earlier reviews. The 14 Cochrane Reviews reporting unique quantitative data had 18,679 participants, and investigated 14 different opioids for a variety of chronic non‐cancer painful conditions where opioids were administered for longer than two weeks. There is a 42% higher risk of any adverse events and a 175% increased risk of serious adverse events associated with opioid use when compared to placebo.
The risks of specific adverse events were increased for constipation, dizziness, drowsiness, fatigue, hot flushes, increased sweating, nausea, pruritus, and vomiting.
Overall completeness and applicability of evidence
This overview of Cochrane Reviews suggests that the occurrence of adverse events related to the medium‐ and long‐term use of opioids is common, but unlike what is observed in clinical practice, the included reviews reported a limited range of specific adverse events. The overview authors consider addiction, cognitive dysfunction, hypogonadism or other endocrine dysfunction, respiratory depression, and sleep apnoea or sleep‐disordered breathing as significant harms, none of which were reported in the reviews, and the absence of reporting represents a serious limitation.
Only two deaths were reported in the reviews, both of which were in participants randomised to oxycodone, and were ascribed to myocardial infarction and renal failure, respectively.
The reviews included in this overview also did not report adverse events by sex or ethnicity. For some adverse events, such as endocrinological harms, sex‐specific reporting would have been especially informative.
Quality of the evidence
We utilised AMSTAR to evaluate the included reviews. The methodological quality of the 16 systematic reviews included in this overview was high overall. The quality of the evidence for the outcomes according to GRADE ranged from very low to moderate, with risk of bias and imprecision identified for the following generic adverse event outcomes: any adverse event, any serious adverse event, and withdrawals due to adverse events. A GRADE assessment of the quality of evidence for specific adverse events led to a downgrading to very low to moderate due to risk of bias, indirectness, and imprecision.
Potential biases in the overview process
To limit the potential for bias in this overview, two overview authors conducted the key steps, involving a third overview author to resolve discrepancies. We adhered to the methodology described in the protocol.
Agreements and disagreements with other studies or reviews
The Canadian guideline for opioid therapy and chronic non‐cancer pain reports the presence of substantial risks associated with the use of opioids (Busse 2017). This guideline is a departure from the 2010 Canadian guideline, where 200 mg morphine equivalent per day was considered a "watchful dose", and where doses in excess of this were supported under some circumstances (NOUGG 2010). Although some differences emerged, the present overview yielded evidence that was mostly consistent with the 2016 Centers for Disease Control and Prevention (CDC) guideline for prescribing opioids for chronic pain (Dowell 2016).
The prevalence of opioid‐use disorders in primary care settings in some recent studies ranged from 3% to 26% (Fleming 2007; Banta‐Green 2009; Boscarino 2010). The CDC guideline reports the association of long‐term opioid use with the development of opioid abuse and dependence, whereas the reviews included in this overview did not report opioid abuse or dependence. This should not be misinterpreted as the absence of risk for the development of a substance use disorder. Possible explanations are that these outcomes were not reported in the RCTs or the Cochrane Reviews, or that the inclusion criteria were sufficiently stringent to have screened out potential participants with risk factors for addiction or abuse. Furthermore, trial duration may not have been sufficient for these adverse events to manifest. In the CDC guideline, there is mention of an increased risk of fatal and non‐fatal overdose (Dunn 2010; Gomes 2011). Yet, the Cochrane Reviews included in this overview did not report overdoses, either fatal or non‐fatal. Similarly, there were no instances of endocrinological harms in the reviews included in this overview, despite the salient caution in this regard in the CDC guideline.
In their position paper, the American Academy of Neurology suggests that no substantial evidence exists for maintained pain relief or improved function with chronic opioid use for CNCP without incurring serious risk of developing adverse events (Franklin 2014).
The Washington State guideline on prescribing opioids for pain suggests that the most commonly reported adverse events in RCTs included constipation, nausea and vomiting, dizziness, and drowsiness, but that more serious long‐term adverse events have only been identified from observational studies (AMDG 2015).
These observations from major guideline groups are broadly consistent with the findings of the present overview of Cochrane Reviews.
Analysis 1.1: Opioids versus placebo, any adverse event.
CI: confidence interval
df: degrees of freedom
M‐H: Mantel‐Haenszel method of meta‐analysis
P: probability
Z: Z score (standard score)
Analysis 1.2: Opioids versus placebo, any serious adverse event.
CI: confidence interval
df: degrees of freedom
M‐H: Mantel‐Haenszel method of meta‐analysis
P: probability
Z: Z score (standard score)
Analysis 1.3: Opioids versus placebo, withdrawals due to adverse events.
CI: confidence interval
df: degrees of freedom
M‐H: Mantel‐Haenszel method of meta‐analysis
P: probability
Z: Z score (standard score)
Analysis 2.1: Opioids versus placebo, constipation.
CI: confidence interval
df: degrees of freedom
M‐H: Mantel‐Haenszel method of meta‐analysis
P: probability
Z: Z score (standard score)
Analysis 2.6: Opioids versus placebo, dizziness.
CI: confidence interval
df: degrees of freedom
M‐H: Mantel‐Haenszel method of meta‐analysis
P: probability
Z: Z score (standard score)
Analysis 2.7: Opioids versus placebo, drowsiness.
CI: confidence interval
df: degrees of freedom
M‐H: Mantel‐Haenszel method of meta‐analysis
P: probability
Z: Z score (standard score)
Analysis 2.8: Opioids versus placebo, fatigue.
CI: confidence interval
df: degrees of freedom
M‐H: Mantel‐Haenszel method of meta‐analysis
P: probability
Z: Z score (standard score)
Analysis 2.10: Opioids versus placebo, hot flushes.
CI: confidence interval
df: degrees of freedom
M‐H: Mantel‐Haenszel method of meta‐analysis
P: probability
Z: Z score (standard score)
Analysis 2.11: Opioids versus placebo, increased sweating.
CI: confidence interval
df: degrees of freedom
M‐H: Mantel‐Haenszel method of meta‐analysis
P: probability
Z: Z score (standard score)
Analysis 2.12: Opioids versus placebo, nausea.
CI: confidence interval
df: degrees of freedom
M‐H: Mantel‐Haenszel method of meta‐analysis
P: probability
Z: Z score (standard score)
Analysis 2.13: opioids versus placebo, pruritus.
CI: confidence interval
df: degrees of freedom
M‐H: Mantel‐Haenszel method of meta‐analysis
P: probability
Z: Z score (standard score)
Analysis 2.15: Opioids versus placebo, vomiting.
CI: confidence interval
df: degrees of freedom
M‐H: Mantel‐Haenszel method of meta‐analysis
P: probability
Z: Z score (standard score)
Analysis 3.1: Opioids versus active pharmacological comparator, any adverse event.
CI: confidence interval
df: degrees of freedom
M‐H: Mantel‐Haenszel method of meta‐analysis
P: probability
Z: Z score (standard score)
Analysis 3.2: Opioids versus active pharmacological comparator, any serious adverse event.
CI: confidence interval
df: degrees of freedom
M‐H: Mantel‐Haenszel method of meta‐analysis
P: probability
Z: Z score (standard score)
Analysis 3.3: Opioids versus active pharmacological comparator, withdrawals due to adverse events.
CI: confidence interval
df: degrees of freedom
M‐H: Mantel‐Haenszel method of meta‐analysis
P: probability
Z: Z score (standard score)
Analysis 4.1: Opioids versus active non‐pharmacological comparator, any adverse event.
CI: confidence interval
df: degrees of freedom
M‐H: Mantel‐Haenszel method of meta‐analysis
P: probability
Z: Z score (standard score)
| Review | Reason for exclusion |
| Trials either included cancer pain, did not use opioids, or were not at least 2 weeks in duration. | |
| Did not exclude cancer pain | |
| Review update published as Gaskell 2016. | |
| No opioids studied. | |
| No opioids studied. | |
| Trials with opioids were less than 2 weeks in duration. | |
| No opioids studied. | |
| Trials with opioids were for acute pain. |
| Review | Total number of trials | Number of eligible trials | Number of trials also in other reviews | Number of de‐duplicated trials |
| 11 | 8 | 0 | 8 | |
| 21 | 5 | 4 | 5 | |
| 15 | 10 | 2 | 9 | |
| 22 | 19 | 2 | 18 | |
| 6 | 1 | 1 | 0 | |
| 1 | 1 | 0 | 1 | |
| 13 | 1 | 0 | 1 | |
| 5 | 5 | 4 | 1 | |
| 3 | 2 | 2 | 2 | |
| 31 | 13 | 10 | 6 | |
| 26 | 6 | 1 | 6 | |
| 3 | 1 | 0 | 1 | |
| 4 | 4 | 2 | 2 | |
| 1 | 1 | 0 | 1 | |
| 11 | 2 | 2 | 2 | |
| Totals | 173 | 79 | 29 | 63 |
| Events reported | Totals | ||||||||||||
| Any adverse event | X | X | X | X | X | X | 6 | ||||||
| Any serious adverse event | X | X | X | X | X | X | 6 | ||||||
| Withdrawals due to adverse events | X | X | X | X | X | X | X | X | X | X | 10 | ||
| Deaths | X | X | X | X | X | X | X | X | X | 9 | |||
| Anorexia | X | 1 | |||||||||||
| Constipation | X | X | X | X | 4 | ||||||||
| Diarrhoea | X | 1 | |||||||||||
| Dizziness | X | X | X | X | X | 5 | |||||||
| Drowsiness or somnolence | X | X | X | X | 4 | ||||||||
| Fatigue | X | 1 | |||||||||||
| Gastrointestinal (unspecified) | X | 1 | |||||||||||
| Headache | X | 1 | |||||||||||
| Hot flushes | X | 1 | |||||||||||
| Increased sweating | X | 1 | |||||||||||
| Infection | X | X | 2 | ||||||||||
| Nausea | X | X | X | X | 4 | ||||||||
| Nervous system (unspecified) | X | 1 | |||||||||||
| Pruritus | X | 1 | |||||||||||
| Sinusitis | X | 1 | |||||||||||
| Vomiting | X | X | X | 3 | |||||||||
| Xerostomia | X | 1 | |||||||||||
| An "X" indicates that the outcome was reported (whether or not any participants experienced it). In Cepeda 2006, "serious adverse events" were defined as adverse events that resulted in withdrawals. These data are therefore included in both categories for the review in question. | |||||||||||||
| Events reported | Totals | ||||||
| Any adverse event | X | X | 2 | ||||
| Any serious adverse event | X | 1 | |||||
| Withdrawals due to adverse events | X | X | X | X | 4 | ||
| Constipation | X | X | 2 | ||||
| Dizziness | X | 1 | |||||
| Drowsiness or somnolence | X | 1 | |||||
| Nausea | X | 1 | |||||
| Vomiting | X | 1 | |||||
| An "X" indicates that the outcome was reported (whether or not any participants experienced it). | |||||||
| Review | Date assessed as up‐to‐date | Condition(s) studied | Participant characteristics | Inclusion criteria | Exclusion criteria | Duration of treatment in eligible studies |
| Oct‐11 | Phantom limb pain | Participants of any age with established phantom limb pain | Pharmacologic agents given singly or in combination | Stump/residual limb pain alone, or postamputation pain that was not phantom pain, or phantom pain mixed with other neuropathic pains; pharmacologic interventions aimed at preventing phantom limb pain | 10 weeks (no quantitative data reported on outcomes of interest) | |
| May‐06 | Osteoarthritis | Adults with primary or secondary osteoarthritis of the hip or knee | Tramadol or tramadol plus paracetamol used | Other types of arthritis; non‐osteoarthritic joint pain or back pain | 14 to 91 days | |
| Apr‐12 | Neuropathic pain | Adults with neuropathic pain | Compared combinations of 2 or more drugs against placebo or another comparator | Studies with a neuraxial approach or that included injection therapies, transcutaneous electrical stimulation, or vitamins | 5 to 36 weeks (includes a cross‐over trial of 9 weeks with 4 conditions) | |
| Apr‐13 | CLBP | Adults with persistent pain in the low back for at least 12 weeks | Any opioid prescribed in an outpatient setting for 1 month or longer | Participants with cancer, infections, inflammatory arthritic conditions, compression fractures, or studies where less than 50% of participants had CLBP | 4 to 15 weeks | |
| Aug‐12 | Osteoarthritis | Adults with osteoarthritis of the knee or hip | Any type of opioid except tramadol | Trials with inflammatory arthritis exclusively or with less than 75% of participants having osteoarthritis of the knee or hip | 2 to 30 weeks | |
| Jan‐15 | Neuropathic pain | Adults with a chronic neuropathic pain condition | Nortriptyline at any dose, by any route, compared to placebo or any active comparator | Nortriptyline given in combination with other drugs, without separate reporting | 28 weeks (no unique data was reported) | |
| Jun‐16 | Neuropathic pain | Adults with postherpetic neuralgia, complex regional pain syndrome, or chronic postoperative pain | Fentanyl at any dose, by any route | Treatment of < 2 weeks | 94 to 113 days | |
| Jun‐15 | CLBP | Adults with non‐specific CLBP for at least 12 weeks | 1 or more types of NSAIDs used | Trials of NSAIDs no longer available on the market; participants with sciatica or with specific low back pain caused by pathological entities, e.g. infection, neoplasm, metastases, osteoporosis, rheumatoid arthritis, or fractures | 6 weeks | |
| Dec‐15 | Chronic neuropathic pain | Adults with painful diabetic neuropathy or postherpetic neuralgia | Any dose or formulation of oxycodone | Fewer than 10 participants per treatment arm, or less than 2 weeks of treatment | 12 weeks | |
| Apr‐12 | CNCP | Adults having any type of CNCP | Methadone by any route in randomised or quasi‐randomised studies | Studies with fewer than 10 participants | 40 to 119 days | |
| Aug‐13 | Neuropathic pain | Adults with central or peripheral neuropathic pain of any aetiology | Opioid agonists used in an RCT | Partial opioid agonists or agonist‐antagonists used | 6 to 16 weeks (includes a 6‐ and 8‐week cross‐over trial with 2 conditions) | |
| May‐09 | CNCP | Adults with chronic pain for at least 3 months | Treament for at least 6 months | Fewer than 10 participants | 2 weeks to 13 months | |
| Dec‐09 | CLBP | Adults with CLBP, with or without radiating pain | Mean duration of CLBP > 12 weeks | Single‐treatment studies; studies examining specific pathologies (e.g. sciatica) | 6 weeks | |
| Mar‐14 | CNCP | Adults with osteoarthritis of the knee or hip, CLBP | Tapentadol ER in doses of 100 to 500 mg/day | Pain for less than 3 months or that was not moderate to severe | 15 to 52 weeks | |
| Nov‐15 | Neuropathic pain | Adults with 1 or more chronic neuropathic pain conditions | Hydromorphone at any dose, by any route | Treatment of < 2 weeks | 14 to 16 weeks | |
| May‐10 | Rheumatoid arthritis pain | Adults with rheumatoid arthritis | Opioids of any formulation at any dose, by any route | Studies of opioid therapy for rheumatoid arthritis in the immediate postoperative setting | 6 to 10 weeks | |
| CLBP: chronic low back pain | ||||||
| Drug | Formulations | Dosing Schedule | Dose (lowest) | Dose (highest) | MEq (lowest) | MEq (highest) | ||||||||||||||
| Buprenorphine | Transdermal patch (µg/h) | ‐ | 5 µg/h | 40 µg/h | 12 | 96 | X | X | ||||||||||||
| Codeine | Contin | Twice a day, 3 times a day | 32 | 200 | 4.8 | 30 | X | X | ||||||||||||
| Dextropropoxyphene | ‐ | 3 times a day | 300 | ‐ | 30 | ‐ | X | |||||||||||||
| Dihydrocodeine | LA | Every 12 hours | 30 | 240 | 3 | 24 | X | X | ||||||||||||
| Fentanyl | Transdermal patch (µg/h) | ‐ | 12.5 µg/h | 250 µg/h | 45 | 944 | X | X | X | |||||||||||
| Hydromorphone | ER, OROS | Once a day | 4 | 64 | 16 | 256 | X | X | ||||||||||||
| Levorphanol | ‐ | 3 times a day | 0.45 | 15.75 | 4.95 | 173.5 | X | |||||||||||||
| Methadone | ‐ | Twice a day | 5 | 80 | 15 | 240 | X | X | ||||||||||||
| Morphine | Avinza, Contin, CR, ER, LA, SR | Twice a day, once a day, every 12 hours, as needed | 15 | 300 | 15 | 300 | X | X | X | X | X | X | X | |||||||
| Oxycodone | CR, ER, LA, MR, PR, immediate‐release, liquid | Twice a day, 3 times a day to 6 times a day | 10 | 160 | 15 | 240 | X | X | X | X | X | X | X | |||||||
| Oxycodone and naloxone | PR | ‐ | ‐ | ‐ | ‐ | ‐ | X | |||||||||||||
| Oxycodone and naltrexone | ‐ | 4 times a day | 10 | 40 | 15 | 60 | X | |||||||||||||
| Oxymorphone | ER | Twice a day, every 12 hours | 10 | 140 | 30 | 420 | X | X | ||||||||||||
| Tapentadol | ER, immediate‐release | Twice a day, 3 times a day to 6 times a day | 100 | 500 | 40 | 200 | X | X | X | |||||||||||
| Tilidine and naloxone | ‐ | ‐ | 4 | 12 | 10 | 30 | X | |||||||||||||
| Tramadol | ER, LP, Retard | Twice a day, as needed, 3 times a day, 4 times a day, once a day, every 12 hours | 37.5 | 400 | 3.75 | 40 | X | X | X | X | X | |||||||||
| Dose is given in milligrams, except for transdermal opioids, which are given in micrograms. CR: controlled‐release PR: Prolonged release | ||||||||||||||||||||
| Opioid | Source | Equivalent dose of oral morphine, in mg, per 1 mg of the converted opioid |
| Buprenorphine (transdermal) | 100 | |
| Codeine | 0.15 | |
| Dextropropoxyphene | 0.1 | |
| Dihydrocodeine | 0.1 | |
| Fentanyl (transdermal) | 158* | |
| Hydromorphone | 4 | |
| Levorphanol | 7.5 | |
| Methadone | 3 | |
| Oxycodone | 1.5 | |
| Oxymorphone | 3 | |
| Tapentadol | 0.4 | |
| Tilidine | 0.2 | |
| Tramadol | 0.1 | |
| Transdermally delivered opioid doses (buprenorphine and fentanyl) are usually expressed as an hourly rate of delivery, but were converted to the dose per 24 hours before being converted into morphine equivalents. *Calculated as the mean conversion factor from data in Fentanyl monograph 2017. | ||
| Review | Events | Total | Event rate (%) | |
| Average | 95% CI | |||
| 481 | 1613 | 29.8 | 27.6 to 32.1 | |
| 2145 | 2725 | 78.7 | 77.2 to 80.3 | |
| 454 | 785 | 57.8 | 54.4 to 61.3 | |
| 40 | 48 | 83.3 | 72.8 to 93.9 | |
| 1 | 17 | 5.9 | ‐5.3 to 17.1 | |
| 766 | 894 | 85.7 | 83.4 to 88 | |
| 21 | 43 | 48.8 | 33.9 to 63.8 | |
| Total events | 3908 | 6622 | 59.0 | 57.8 to 60.2 |
| CI: confidence interval | ||||
| Review | Events | Total | Event rate (%) | |
| Average | 95% CI | |||
| 196 | 899 | 21.8 | 19.1 to 24.5 | |
| 9 | 355 | 2.5 | 0.9 to 4.2 | |
| 4 | 48 | 8.3 | 0.5 to 16.2 | |
| 73 | 1767 | 4.1 | 3.2 to 5.1 | |
| 6 | 134 | 4.5 | 1 to 8 | |
| Total events | 288 | 3203 | 9.0 | 8 to 10 |
| CI: confidence interval | ||||
| Review | Events | Total | Event rate (%) | |
| Average | 95% CI | |||
| 196 | 899 | 21.8 | 19.1 to 24.5 | |
| 63 | 526 | 12.0 | 9.2 to 14.8 | |
| 1169 | 4398 | 26.6 | 25.3 to 27.9 | |
| 132 | 785 | 16.8 | 14.2 to 19.5 | |
| 3 | 48 | 6.3 | 0 to 13.1 | |
| 11 | 90 | 12.2 | 5.5 to 19 | |
| 19 | 177 | 10.7 | 6.2 to 15.3 | |
| 620 | 1830 | 33.9 | 31.7 to 36.1 | |
| 480 | 1770 | 27.1 | 24.9 to 29.3 | |
| 3 | 43 | 7.0 | 7 to 7 | |
| 3 | 11 | 27.3 | 27.3 to 27.3 | |
| Total events | 2699 | 10,577 | 25.5 | 25.5 to 25.5 |
| AMSTAR criteria | ||||||||||||||||
| 1. A priori design | 1 | 1 | 1 | 1 | 1 | 1 | 1 | 1 | 1 | 1 | 1 | 1 | 1 | 1 | 1 | 1 |
| 2. Duplicate selection and extraction | 1 | 1 | 0 | 1 | 1 | 1 | 1 | 0 | 1 | 1 | 1 | 1 | 1 | 1 | 1 | 1 |
| 3. Comprehensive literature search | 1 | 1 | 1 | 1 | 1 | 1 | 1 | 1 | 1 | 1 | 1 | 1 | 1 | 1 | 1 | 1 |
| 4. Published and unpublished, no language restrictions | 1 | 1 | 1 | 0 | 1 | 1 | 1 | 1 | 1 | 1 | 0 | 0 | 1 | 1 | 1 | 1 |
| 5. List of studies provided | 1 | 1 | 1 | 1 | 1 | 1 | 1 | 1 | 1 | 1 | 1 | 1 | 1 | 1 | 1 | 1 |
| 6. Characteristics of studies provided | 1 | 1 | 1 | 1 | 1 | 1 | 1 | 1 | 1 | 1 | 1 | 1 | 1 | 1 | 1 | 1 |
| 7. Scientific quality assessed | 1 | 1 | 1 | 1 | 1 | 1 | 1 | 1 | 1 | 1 | 1 | 1 | 1 | 1 | 1 | 1 |
| 8. Scientific quality used in formulating conclusions | 1 | 1 | 1 | 1 | 1 | 1 | 1 | 1 | 1 | 1 | 1 | 1 | 1 | 1 | 1 | 1 |
| 9. Methods used to combine appropriate | 1 | 1 | 1 | 1 | 1 | 1 | 1 | 1 | 1 | 1 | 1 | 1 | 1 | 1 | 1 | 1 |
| 10. Conflict of interest stated | 1 | 1 | 1 | 1 | 1 | 1 | 1 | 1 | 1 | 1 | 1 | 1 | 1 | 1 | 1 | 1 |
| Total score/10 | 10 | 10 | 9 | 9 | 10 | 10 | 10 | 9 | 10 | 10 | 9 | 9 | 10 | 10 | 10 | 10 |
| AMSTAR: Assessing the Methodological Quality of Systematic Reviews | ||||||||||||||||
| Participants (reviews) | Risk of bias | Inconsistency | Indirectness | Imprecision | Other considerations | Overall quality of evidence | |
| Any adverse event | 1583 | Serious | Not serious | Not serious | Not serious | None | +++◯ |
| Any serious adverse event | 108 | Serious | Not serious | Not serious | Not serious | None | +++◯ MODERATE |
| Withdrawals due to adverse events | 2375 | Serious | Not serious | Not serious | Not serious | None | +++◯ |
| Participants (reviews) | Risk of bias | Inconsistency | Indirectness | Imprecision | Other considerations | Overall quality of evidence | |
| Constipation | 4255 (4 reviews) | Serious | Not serious | Serious | Not serious | Strong association | +++◯ |
| Dizziness | 4130 (4 reviews) | Serious | Not serious | Serious | Not serious | Strong association | +++◯ |
| Drowsiness or somnolence | 3856 (3 reviews) | Serious | Not serious | Serious | Not serious | Strong association | +++◯ |
| Fatigue | 1589 (1 review) | Serious | Not serious | Very serious | Not serious | None | +◯◯◯ |
| Hot flushes | 593 (1 review) | Serious | Not serious | Very serious | Not serious | None | +◯◯◯ |
| Increased sweating | 1350 (1 review) | Serious | Not serious | Very serious | Not serious | Very strong association | +++◯ |
| Nausea | 4346 (3 reviews) | Serious | Not serious | Serious | Not serious | Strong association | +++◯ |
| Pruritus | 2865 (1 review) | Serious | Not serious | Very serious | Not serious | None | +◯◯◯ |
| Vomiting | 3368 (2 reviews) | Serious | Not serious | Very serious | Not serious | Strong association | ++◯◯ |
| Participants (reviews) | Risk of bias | Inconsistency | Indirectness | Imprecision | Other considerations | Overall quality of evidence | |
| Any adverse event | 1583 | Serious | Not serious | Not serious | Not serious | None | +++◯ |
| Any serious adverse event | 108 | Serious | Not serious | Not serious | Very serious | None | +◯◯◯ |
| Withdrawals due to adverse events | 2375 | Serious | Not serious | Not serious | Not serious | None | +++◯ |
| Participants (reviews) | Risk of bias | Inconsistency | Indirectness | Imprecision | Other considerations | Overall quality of evidence | |
| Any adverse event | 32 (1 review) | Very serious | Not serious | Not serious | Not serious | None | +◯◯◯ |
| Adverse event | Studies | Participants | Statistical method | Risk ratio | NNTH |
| Any adverse event | 6 | 5004 | Risk Ratio (M‐H, Random, 95% CI) | 1.42 (1.22, 1.66) | 4.20 (3.78, 4.74) |
| Any serious adverse event | 6 | 4324 | Risk Ratio (M‐H, Fixed, 95% CI) | 2.75 (2.06, 3.67) | 28.71 (20.50, 47.88) |
| Withdrawals due to adverse events | 10 | 11,510 | Risk Ratio (M‐H, Fixed, 95% CI) | 3.40 (3.02, 3.82) | 5.55 (5.19, 5.97) |
| CI: confidence interval | |||||
| Opioid | Placebo | ||||||||
| Number of participants | Event rate (%) | Number of participants | Event rate (%) | ||||||
| Analysis | Adverse event | With AE | Total | Average | 95% CI | With AE | Total | Average | 95% CI |
| 1.1 | Any adverse event | 2436 | 3113 | 78.3 | 76.8 to 79.7 | 1030 | 1891 | 54.5 | 52.2 to 56.7 |
| 1.2 | Any serious adverse event | 216 | 2893 | 7.5 | 6.5 to 8.4 | 57 | 1431 | 4.0 | 3 to 5 |
| 1.3 | Withdrawals due to adverse events | 1836 | 7316 | 25.1 | 24.1 to 26.1 | 297 | 4194 | 7.1 | 6.3 to 7.9 |
| 2.1 | Constipation | 285 | 2513 | 11.3 | 10.1 to 12.6 | 94 | 1742 | 5.4 | 4.3 to 6.5 |
| 2.6 | Dizziness | 284 | 2448 | 11.6 | 10.3 to 12.9 | 71 | 1682 | 4.2 | 3.3 to 5.2 |
| 2.7 | Drowsiness or somnolence | 237 | 2313 | 10.3 | 9 to 11.5 | 57 | 1543 | 3.7 | 2.8 to 4.6 |
| 2.8 | Fatigue | 57 | 796 | 7.2 | 5.4 to 8.9 | 29 | 793 | 3.7 | 2.4 to 5 |
| 2.10 | Hot flushes | 14 | 295 | 4.8 | 2.3 to 7.2 | 5 | 298 | 1.7 | 0.2 to 3.1 |
| 2.11 | Increased sweating | 32 | 674 | 4.7 | 3.1 to 6.3 | 2 | 676 | 0.3 | 0.0 to 0.7 |
| 2.12 | Nausea | 535 | 2556 | 20.9 | 20.9 to 20.9 | 151 | 1790 | 8.4 | 8.4 to 8.4 |
| 2.13 | Pruritus | 155 | 1809 | 8.6 | 8.6 to 8.6 | 52 | 1056 | 4.9 | 4.9 to 4.9 |
| 2.15 | Vomiting | 184 | 2058 | 8.9 | 8.9 to 8.9 | 28 | 1310 | 2.1 | 2.1 to 2.1 |
| AE: adverse event | |||||||||
| Adverse event | Studies | Participants | Statistical method | Risk ratio | NNTH |
| Anorexia | 1 | 330 | Risk Ratio (M‐H, Fixed, 95% CI) | 13.64 (0.77, 240.21) | ‐ |
| Constipation | 4 | 4255 | Risk Ratio (M‐H, Random, 95% CI) | 2.23 (1.39, 3.59) | 16.82 (13.20, 23.19) |
| Diarrhoea | 1 | 313 | Risk Ratio (M‐H, Fixed, 95% CI) | 2.55 (0.69, 9.43) | ‐ |
| Dizziness | 4 | 4130 | Risk Ratio (M‐H, Fixed, 95% CI) | 2.76 (2.15, 3.55) | 13.55 (11.15, 17.28) |
| Drowsiness, sleepiness, somnolence, or anergia | 3 | 3856 | Risk Ratio (M‐H, Fixed, 95% CI) | 2.89 (2.19, 3.83) | 15.26 (12.34, 20.00) |
| Fatigue | 1 | 1589 | Risk Ratio (M‐H, Fixed, 95% CI) | 1.96 (1.27, 3.03) | 28.54 (17.48, 77.71) |
| Gastrointestinal (unspecified) | 1 | 98 | Risk Ratio (M‐H, Fixed, 95% CI) | 1.77 (0.90, 3.47) | ‐ |
| Headache | 1 | 313 | Risk Ratio (M‐H, Fixed, 95% CI) | 0.78 (0.33, 1.84) | ‐ |
| Hot flushes | 1 | 593 | Risk Ratio (M‐H, Fixed, 95% CI) | 2.83 (1.03, 7.75) | 32.60 (16.95, 421.76) |
| Increased sweating | 1 | 1350 | Risk Ratio (M‐H, Fixed, 95% CI) | 16.05 (3.86, 66.69) | 22.46 (16.37, 35.78) |
| Infection | 2 | 631 | Risk Ratio (M‐H, Fixed, 95% CI) | 0.87 (0.47, 1.61) | ‐ |
| Nausea | 3 | 4346 | Risk Ratio (M‐H, Fixed, 95% CI) | 2.46 (2.08, 2.92) | 8.00 (6.88, 9.56) |
| Nervous system disorders (unspecified) | 1 | 98 | Risk Ratio (M‐H, Fixed, 95% CI) | 2.50 (0.95, 6.56) | ‐ |
| Pruritus | 1 | 2865 | Risk Ratio (M‐H, Fixed, 95% CI) | 1.74 (1.28, 2.36) | 27.44 (18.25, 55.27) |
| Sinusitis | 1 | 318 | Risk Ratio (M‐H, Fixed, 95% CI) | 1.56 (0.52, 4.67) | ‐ |
| Vomiting | 2 | 3368 | Risk Ratio (M‐H, Fixed, 95% CI) | 4.29 (2.90, 6.34) | 14.70 (12.10, 18.72) |
| Xerostomia | 1 | 1668 | Risk Ratio (M‐H, Fixed, 95% CI) | 1.10 (0.47, 2.57) | ‐ |
| CI: confidence interval | |||||
| Drug | Total dose per day | Dosing schedule | ||||
| Celecoxib | 400 mg | ‐ | X | |||
| Desipramine | 10 to 160 mg | ‐ | X | |||
| Diclofenac | 25 to 150 mg | Up to 3 times a day | X | |||
| Gabapentin | 1200 to 3600 mg | 3 times a day | X | |||
| Lorazepam | 0.7 to 1.6 mg | Twice a day and 3 times a day | X | |||
| Naproxen | 250 to 1000 mg | ‐ | X | |||
| Nortriptyline | 10 to 160 mg | Twice a day | X | X | ||
| An "X" indicates that the drug was used as an active comparator to opioids in the review. Rubinstein 2011 used a non‐pharmacological comparator (spinal manipulative therapy). | ||||||
| Opioid | Active comparator | ||||||||
| Number of participants | Event rate (%) | Number of participants | Event rate (%) | ||||||
| Analysis | Adverse event | With AE | Total | Average | 95% CI | With AE | Total | Average | 95% CI |
| 1.1 | Any adverse event | 454 | 785 | 57.8 | 54.4 to 61.3 | 381 | 798 | 47.7 | 44.3 to 51.2 |
| 1.2 | Any serious adverse event | 5 | 54 | 9.3 | 1.5 to 17 | 1 | 54 | 1.9 | 0 to 5.4 |
| 1.3 | Withdrawals due to adverse events | 185 | 1201 | 15.4 | 13.4 to 17.4 | 56 | 1174 | 4.8 | 3.6 to 6 |
| AE: adverse event | |||||||||
| Adverse event | Studies | Participants | Statistical method | Risk ratio | NNTH |
| Any adverse event | 1 | 1583 | Risk Ratio (M‐H, Random, 95% CI) | 1.21 (1.10, 1.33) | 9.91 (6.67, 19.24) |
| Any serious adverse event | 1 | 108 | Risk Ratio (M‐H, Fixed, 95% CI) | 5.00 (0.60, 41.39) | ‐ |
| Withdrawals due to adverse events | 4 | 2375 | Risk Ratio (M‐H, Fixed, 95% CI) | 3.23 (2.42, 4.30) | 9.40 (7.69, 12.11) |
| CI: confidence interval | |||||
| Opioid | Active comparator | ||||||||
| Number of participants | Event rate (%) | Number of participants | Event rate (%) | ||||||
| Analysis | Adverse event | With AE | Total | Average | 95% CI | With AE | Total | Average | 95% CI |
| 1.1 | Any adverse event | 1 | 17 | 5.8 | 0 to 17.1 | 0 | 15 | 0 | 0 to 0 |
| AE: adverse event | |||||||||