Pharmacological interventions for acute hepatitis B infection
Abstract
Background
Infection with hepatitis B virus (HBV) can be symptomatic or asymptomatic. Apart from chronic HBV infection, the complications related to acute HBV infection are severe acute viral hepatitis and fulminant hepatitis characterised by liver failure. The optimal pharmacological treatment of acute HBV infection remains controversial.
Objectives
To assess the benefits and harms of pharmacological interventions in the treatment of acute HBV infection through a network meta‐analysis and to generate rankings of the available treatments according to their safety and efficacy. As it was not possible to assess whether the potential effect modifiers were similar across different comparisons, we did not perform the network meta‐analysis and instead assessed the benefits and harms of different interventions using standard Cochrane methodological procedures.
Search methods
We searched CENTRAL, MEDLINE, Embase, Science Citation Index Expanded, WHO International Clinical Trials Registry Platform, and randomised clinical trials (RCTs) registers to August 2016 to identify RCTs on pharmacological interventions for acute HBV infection.
Selection criteria
RCTs, irrespective of language, blinding, or publication status in participants with acute HBV infection. We excluded trials if participants had previously undergone liver transplantation and had other coexisting viral diseases such as hepatitis C virus and HIV. We considered any of the various pharmacological interventions compared with each other or with placebo, or no intervention.
Data collection and analysis
We calculated the odds ratio (OR) and rate ratio with 95% confidence intervals (CI) using both fixed‐effect and random‐effects models based on available‐participant analysis with Review Manager 5. We assessed risk of bias, controlled risk of random errors with Trial Sequential Analysis, and assessed the quality of the evidence using GRADE.
Main results
Seven trials (597 participants) met our review inclusion criteria. All trials provided information for one or more outcomes; however, five participants were excluded from analysis by study authors. All the trials were at high risk of bias. Overall, all the evidence was low or very low quality evidence because of risk of bias (downgraded one level for risk of bias), small sample size (downgraded one level for imprecision), and wide CIs (downgraded one more level for imprecision in some comparisons). Of the seven trials, six were two‐armed trials, while one trial was a three‐armed trial. The comparisons included hepatitis B immunoglobulin (HBIG) versus placebo (one trial; 55 participants); interferon versus placebo (two trials; 200 participants); lamivudine versus placebo or no intervention (four trials; 316 participants); lamivudine versus entecavir (one trial; 90 participants); and entecavir versus no intervention (one trial; 131 participants). One trial included only people with acute HBV with hepatic encephalopathy (i.e. people with fulminant liver failure); one trial included only people with severe acute HBV, but it did not state whether any of the people also had fulminant HBV infection; three trials excluded fulminant HBV infection; and two trials did not report the severity of acute HBV infection. The mean or median follow‐up period in the trials ranged from three to 12 months in the trials that provided this information.
There was no evidence of any differences in short‐term mortality (less than one year) in any of the comparisons: HBIG versus placebo (OR 1.13, 95% CI 0.36 to 3.54; participants = 55; 1 trial), lamivudine versus placebo or no intervention (OR 1.29, 95% CI 0.33 to 4.99; participants = 250; 2 trials); lamivudine versus entecavir (OR 1.23, 95% CI 0.13 to 11.65; participants = 90; 1 trial), or entecavir versus no intervention (OR 1.05, 95% CI 0.12 to 9.47; participants = 131; 1 trial). The proportion of people who progressed to chronic HBV infection was higher in the lamivudine group than the placebo or no intervention group (OR 1.99, 95% CI 1.05 to 3.77; participants = 285; 3 trials) and in the lamivudine group versus entecavir group (OR 3.64, 95% CI 1.31 to 10.13; participants = 90; 1 trial). There was no evidence of a difference in the proportion of people who progressed to chronic HBV infection between the entecavir and the no intervention groups (OR 0.58, 95% CI 0.23 to 1.49; participants = 131; 1 trial). None of the trials reported progression to fulminant HBV infection. Three trials with 371 participants reported serious adverse events. There were no serious adverse events in any of the groups (no intervention: 0/183 (0%), interferon: 0/67 (0%), lamivudine: 0/100 (0%), and entecavir: 0/21 (0%)). The proportion of people with adverse events was higher in the interferon group than the placebo group (OR 348.16, 95% CI 45.39 to 2670.26; participants = 200; 2 trials). There was no evidence of a difference in the proportion of people with adverse events between the lamivudine group and the placebo or no intervention group (OR 1.42, 95% CI 0.34 to 5.94; participants = 35; 1 trial) or number of adverse events between the lamivudine group and the placebo or no intervention group (rate ratio 1.72, 95% CI 1.01 to 2.91; participants = 35; 1 trial). One trial with 100 participants reported quality of life at one week. The scale used to report the health‐related quality of life was not stated and lacked information on whether higher score meant better or worse, making it difficult to interpret the results. None of the trials reported quality of life beyond one week or other clinical outcomes such as mortality beyond one year, liver transplantation, cirrhosis, decompensated cirrhosis, or hepatocellular carcinoma.
Two trials received funding from pharmaceutical companies; three trials were funded by parties without any vested interest in the results or did not receive any special funding; the source of funding was not available in the remaining two trials.
Authors' conclusions
Low or very low quality evidence suggests that progression to chronic HBV infection was higher in people receiving lamivudine compared with placebo, no intervention, or entecavir. Low quality evidence suggests that interferon may increase the adverse events after treatment for acute HBV infection. Based on a very low quality evidence, there is currently no evidence of benefit of any intervention in acute HBV infection. There is significant uncertainty in the results and further RCTs are required.
PICOs
Plain language summary
Medical treatment of acute hepatitis B virus infection
Background
Hepatitis B virus (HBV) is a virus that affects the liver. It is usually transmitted by injectable drug abuse, transfusion of infected blood, unhygienic tattooing practices, coming into contact with blood infected with HBV, or by unprotected sex. Acute HBV infection is the period that covers the period immediately after HBV infection. Most people are asymptomatic. About 5% to 40% of people with acute HBV develop symptoms such as jaundice (yellowish discolouration of the eyes and skin), tummy pain, tiredness, nausea, and vomiting. While most people clear the virus after acute HBV infection, the virus remains in others (chronic HBV infection) and causes major health problems (excessive tiredness and eventually may end with liver failure leading to vomiting blood, confusion, and death). Occasionally, people with acute HBV may develop immediate liver failure (fulminant HBV infection). The best way to treat acute HBV is not clear. We sought to resolve this issue by performing this review. We included all randomised clinical trials (RCTs) (clinical studies where people are randomly put into one of two or more treatment groups) published to August 2016. We included only trials in which participants with acute HBV infection had not undergone liver transplantation previously and did not have liver disease due to other viral infections. Apart from using standard Cochrane methods which allow comparison of only two treatments at a time (direct comparison), we planned to use an advanced method which allows comparison of the many different treatments individually which are compared in the trials (network meta‐analysis). However, because of the nature of the information available, we could not determine whether the network meta‐analysis results were reliable. So, we used standard Cochrane methodology.
Study characteristics
We identified seven RCTs. Trial authors included 592 (out of 597 randomised) participants in analyses. The trials included people with acute HBV infection of varying severity. The main interventions included hepatitis B immunoglobulin (a vaccine), interferon (protein secreted in response to viral infection), and lamivudine and entecavir (medicines) which are considered to have antiviral effects and were compared with placebo or no intervention. The trials' average follow‐up period ranged from three months to one year in the six trials that reported this information.
Two trials received funding from pharmaceutical companies; three trials were funded by parties without any vested interest in the results or did not receive any special funding; two trials did not report the funding source.
Quality of evidence
The overall quality of evidence was low or very low, and all the trials were at high risk of bias (the likely possibility of making wrong conclusions overestimating benefits or underestimating harms because of the way the studies were conducted is high).
Key results
There was no evidence of differences in death at less than one year between any of the treated and untreated groups. The percentage of people who progressed to chronic HBV infection was higher in lamivudine versus placebo or no intervention and lamivudine versus entecavir groups. There was no evidence of difference in the proportion of people who progressed to chronic HBV infection between entecavir and no intervention. None of the trials reported progression to fulminant HBV infection. There were no serious adverse events in any of the treatment groups in the trials that reported this information. The percentage of people who developed adverse events was higher in the interferon group (100%) than in the placebo (dummy treatment) group (27%) in the trials that reported this information. There was no evidence of differences in the percentage of people who developed adverse events or the total number of adverse events in the comparison between lamivudine versus no treatment. One trial reported quality of life at one week; however, the information provided was insufficient to determine whether there was any difference between the interferon and placebo groups. None of the trials reported quality of life beyond one week or other important outcomes such as death beyond one year, severe progressive liver damage, liver failure, requirement for liver transplantation, or liver cancer. There is currently no evidence of benefit of any treatment in acute HBV infection. There is significant uncertainty in the results and high‐quality RCTs are required.
Authors' conclusions
Summary of findings
| Lamivudine versus no intervention for acute hepatitis B virus infection | |||||
| Patient or population: people with acute HBV infection Settings: secondary or tertiary care Intervention: lamivudine Control: no intervention | |||||
| Outcomes | Illustrative comparative risks* (95% CI) | Relative effect | No of participants | Quality of the evidence | |
| Assumed risk | Corresponding risk | ||||
| No intervention | Lamivudine | ||||
| Short‐term mortality (< 1 year) | 33 per 1000 | 43 per 1000 | OR 1.29 | 250 | ⊕⊝⊝⊝ |
| Progression to chronic HBV infection (6 to 12 months) | 413 per 1000 | 584 per 1000 | OR 1.99 | 285 | ⊕⊝⊝⊝ |
| Progression to fulminant HBV infection | None of the trials reported this information. | ||||
| Serious adverse events (6 to 12 months) | There were no serious adverse events in either group. | 250 (2 trials) | ⊕⊝⊝⊝ | ||
| Adverse events (proportion) (12 months) | 647 per 1000 | 722 per 1000 | OR 1.42 | 35 | ⊕⊝⊝⊝ |
| Adverse events (number of events) (12 months) | 1235 per 1000 | 2124 per 1000 | Rate ratio 1.72 | 35 | ⊕⊝⊝⊝ |
| Health‐related quality of life (1 week) | None of the trials reported this information. | ||||
| *The basis for the assumed risk is the mean control group risk in the control group across studies. The corresponding risk (and its 95% confidence interval) is based on the assumed risk in the comparison group and the relative effect of the intervention (and its 95% CI). CI: confidence interval; HBV: hepatitis B virus; OR: odds ratio. | |||||
| GRADE Working Group grades of evidence | |||||
| 1 The risk of bias in the trial(s) was high (downgraded by 1 level for risk of bias). | |||||
| Interferon versus no intervention for acute hepatitis B virus infection | |||||
| Patient or population: people with acute HBV infection Settings: secondary or tertiary care Intervention: interferon Control: no intervention | |||||
| Outcomes | Illustrative comparative risks* (95% CI) | Relative effect | No of participants | Quality of the evidence | |
| Assumed risk | Corresponding risk | ||||
| No intervention | Interferon | ||||
| Short‐term mortality | None of the trials reported this information. | ||||
| Progression to chronic HBV infection | None of the trials reported this information. | ||||
| Progression to fulminant HBV infection | None of the trials reported this information. | ||||
| Serious adverse events | There were no serious adverse events in either group. | 100 (1 trial) | ⊕⊝⊝⊝ | ||
| Adverse events (proportion) (4 to 6 months) | 273 per 1000 | 992 per 1000 | OR 348.16 | 200 | ⊕⊕⊝⊝ |
| Adverse events (number of events) | None of the trials reported this information. | ||||
| Health‐related quality of life (1 week) | The scale used to report the health‐related quality of life was not stated. Neither was information on whether higher score meant better or worse available. The mean score in the placebo group was 42.7 units. The mean score in the interferon group was 5.4 units higher. There was no information to calculate the 95% confidence intervals or P value. | 100 | ⊕⊝⊝⊝ | ||
| *The basis for the assumed risk is the mean control group risk in the control group across studies. The corresponding risk (and its 95% confidence interval) is based on the assumed risk in the comparison group and the relative effect of the intervention (and its 95% CI). CI: confidence interval; HBV: hepatitis B virus; OR: odds ratio. | |||||
| GRADE Working Group grades of evidence | |||||
| 1 The risk of bias in the trial(s) was high (downgraded by 1 level for risk of bias). | |||||
Background
Description of the condition
Hepatitis B virus (HBV) is a member of the Hepadnaviridae (hepatotropic DNA virus) family, a family of viruses that infect liver cells (Ganem 2004). Currently, 10 HBV genotypes (genotypes A to J) are recognised (Lin 2011; Tanwar 2012). The major mode of transmission of HBV is by parenteral routes, which include parenteral drug abuse, transfusion of infected blood, unhygienic tattooing practices, and occupational exposure to the blood of people infected with HBV (Wright 1993; Thompson 2009; Nelson 2011). The other major modes of transmission include sexual intercourse with infected people and perinatal transmission from mother to child (Wright 1993; Shi 2010; Deng 2012). The incubation period of HBV infection is about two to four weeks (Tillmann 2014). Infection with HBV is usually self‐limiting and can be symptomatic (jaundice, abdominal pain, fatigue, nausea, and vomiting) in about 5% to 40% of people or asymptomatic (Leen 1989; Ganem 2004; Kumar 2006; Choi 2011; Sharif 2013; Tillmann 2014). Acute HBV infection is usually followed by spontaneous clearance of the virus and long‐lasting protection against reinfection (Ganem 2004; Choi 2011; Tillmann 2014). Acute HBV infection can be difficult to distinguish from first exacerbation of asymptomatic chronic HBV, despite serological tests (Kumar 2006). Apart from chronic HBV infection, the complications related to acute HBV infection are severe acute HBV and fulminant hepatitis characterised by liver failure. Severe acute HBV is variably defined as the presence of at least two of the following criteria: severe jaundice (bilirubin levels higher than 10 mg/dL or 171 µmol/L), international normalised ratio (INR; an expression of the blood's ability to clot) of 1.6 or greater, hepatic encephalopathy (Bruno 2014), or the presence of elevated transaminase levels along with an elevated INR (Tillmann 2014). Fulminant hepatitis is characterised by liver failure manifest as elevated INR and hepatic encephalopathy (Tillmann 2014).
In the US, approximately 3000 people developed acute HBV infection annually between 2010 and 2014, equating to about 1 in 100,000 population with highest rates in the 30‐ to 39‐year age group and lowest rates in children and adolescents (CDC 2014). The incidence is higher in men than women (CDC 2014).
The proportion of people with fulminant hepatitis after an attack of acute HBV can be variable, depending upon whether all people with acute HBV infection are included in the analysis (2% of people with acute HBV becoming fulminant) or whether only those people with severe acute HBV infection are included in the analysis (4% to 5% of people with severe acute HBV becoming fulminant) (Leen 1989; Souza 2013; Coppola 2014). A significant proportion of people with fulminant hepatitis B require liver transplantation or may die (varies from 18% to 48%) (Leen 1989; Garfein 2004; Tillmann 2006). Overall, approximately 1% of people with acute HBV (of all severities) died (CDC 2014).
Less than 1% to 27% of people develop chronic HBV infection (persistence of acute HBV infection for more than six months) (Ganem 2004; McMahon 2014; Tillmann 2014). The risk of chronic HBV infection can be as high as 90% if the primary, acute HBV infection occurs at birth and 25% if it occurs between early infancy and five years of age (McMahon 2014). Later in life, the risk declines. Overall, in people with chronic HBV infection, about 13.5% develop cirrhosis (Yang 2009), and about 5% develop hepatocellular carcinoma (Hoofnagle 2007; Thiele 2014). People with compensated (asymptomatic) chronic HBV‐related cirrhosis may develop decompensated (symptomatic) cirrhosis (3% to 5% per year), or hepatocellular carcinoma (2% to 8% per year), or die (3% to 4% per year) (Chu 2006).
Description of the intervention
Various drugs, such as nucleoside or nucleotide analogues (L‐nucleosides (lamivudine, telbivudine, clevudine), acyclic phosphonates (adefovir, tenofovir), and cyclopenteanes (entecavir)), N‐acetyl cysteine, ursodeoxycholic acid, interferon, and thymosin, have been used to prevent the complications of acute HBV infection and progression to chronic HBV infection (Bruno 2014; Tillmann 2014). Nucleoside analogues and nucleotide analogues are administered orally (Martindale 2011). N‐acetyl cysteine is an antioxidant that can be administered orally or intravenously (Martindale 2011; Bass 2013). Ursodeoxycholic acid is a bile salt that is administered orally (Lazaridis 2001; Martindale 2011). Interferons are proteins secreted by cells in response to a wide range of inducers and that confer resistance against viruses and cancer cells (NCBI 2014a). The major types of interferon include interferon‐alpha (or interferon‐alfa), interferon‐beta, interferon‐omega, interferon‐lambda, and interferon‐gamma (Feld 2005; NCBI 2014a). Interferon‐alpha is used in acute HBV infection (Tassopoulos 1997). Interferon is usually manufactured by recombinant technology where a sequence of human DNA is combined with the DNA of a bacteria such as Escherichia coli (Anonymous 1981). A variation of interferon‐alpha is pegylated interferon‐alpha, where the structure of interferon is modified to make it long acting (Bailon 2001). Interferon‐alpha is usually administered by subcutaneous or intramuscular injections (Martindale 2011). Thymosins are a family of polypeptide hormones secreted by the thymus gland (NCBI 2014b). Thymosin‐alpha (or thymalfasin) is usually manufactured by recombinant technology and is administered subcutaneously (Li 2010; Martindale 2011). It should be noted that these treatments have significant complications including severe infections, anaemia, neutropenia, thrombocytopenia, renal impairment, and neuropsychiatric disorders (homicidal and suicidal ideas) (Martindale 2011). Other complications include abdominal pain, elevation of liver enzymes, and myalgia (Martindale 2011).
How the intervention might work
Nucleoside and nucleotide analogues inhibit viral replication by inhibiting reverse transcriptase (ribonucleic acid (RNA)‐directed DNA polymerase) in different ways (Martindale 2011). N‐Acetyl cysteine increases the levels of glutathione, which is an antioxidant and protects the cells against oxidative stress. In addition, N‐acetyl cysteine increases nitric oxide production resulting in vasodilation and improved tissue oxygen delivery and uptake, and inhibits proinflammatory factors (Bass 2013). Ursodeoxycholic acid decreases the exposure of liver cells to toxic bile salts and has anti‐inflammatory properties (Bass 2013). This may decrease the damage to the liver cells. Interferon is one of the natural defence mechanisms of the body against viruses (Feld 2005; NCBI 2014a). Interferons induce interferon‐stimulated genes, which creates an antiviral state within the cells (Feld 2005). Thymosins increase lymphocyte production and enhance the function of T cells (Li 2010; NCBI 2014b).
Why it is important to do this review
The current guidelines on the management of acute HBV infection by the European Association for the Study of the Liver (EASL) recommends the following treatment (EASL 2012). Entecavir or tenofovir should be used in people with acute severe HBV infection or people with fulminant hepatitis. Antiviral therapy should be continued for at least three months after the appearance of anti‐HBs (antibody against HBsAg, the surface antigen of HBV) or at least 12 months after appearance of anti‐HBe (antibody against HBeAg, a protein secreted by virus). However, the American Association for the Study of Liver Diseases (AASLD) guidelines recommend treatment only in people with fulminant hepatitis and in people with protracted severe acute HBV infection (AASLD 2009). Lamivudine and telbivudine may be used when the anticipated duration of treatment is short; otherwise, entecavir is the preferred treatment (AASLD 2009). Treatment should be continued until the clearance of HBsAg or indefinitely in people undergoing liver transplantation (AASLD 2009). Interferon‐alpha is contraindicated in acute HBV infection (AASLD 2009). Thus, the optimal management of people with acute HBV infection is not known.
Network meta‐analysis allows combining the direct evidence and indirect evidence and allows ranking of different treatments in terms of the different outcomes (Salanti 2011; Salanti 2012). There has been no network meta‐analysis on the pharmacological interventions used for treatment of acute HBV infection. This systematic review and attempted network meta‐analysis intended to provide the best level of evidence for the role of different pharmacological interventions in the treatment of people with acute HBV infection.
Objectives
To assess the comparative benefits and harms of different pharmacological interventions in the treatment of acute HBV infection through a network meta‐analysis and to generate rankings of the available pharmacological interventions according to their safety and efficacy. However, it was not possible to assess whether the potential effect modifiers were similar across different comparisons. Therefore, we did not perform the network meta‐analysis, and assessed the benefits and harms of different interventions using standard Cochrane methodology.
When more trials become available with adequate description of potential effect modifiers, we will attempt to conduct network meta‐analysis to generate rankings of the available interventions according to their safety and efficacy. This is why we retain the planned methodology for network meta‐analysis in our Appendix 1. Once data appear allowing for the conduct of network meta‐analysis, this Appendix 1 will be moved back into the Methods section.
Methods
Criteria for considering studies for this review
Types of studies
We considered only randomised clinical trials for this systematic review irrespective of language, publication status, or date of publication. We excluded studies of other designs because of the risk of bias in such studies. We are all aware that such exclusions make us focus much more on potential benefits and not fully assess the risks of serious adverse events as well as risks of adverse events.
Types of participants
We included participants with acute HBV infection irrespective of the presence or absence of symptoms, severity of the HBV infection, method of diagnosis of the disease, or HBV genotype. We excluded participants who had undergone liver transplantation previously. We also excluded participants who had HIV, hepatitis C virus (HCV), or hepatitis delta virus (HDV) coinfections, or acute exacerbations of chronic HBV infection. However, we included participants who did not undergo testing for viral coinfections.
Types of interventions
We included any of the following pharmacological interventions used either alone or in combination and could be compared with each other or with placebo or no intervention.
Some of the pharmacological interventions that we considered were:
-
lamivudine;
-
telbivudine;
-
clevudine;
-
adefovir;
-
tenofovir;
-
entecavir;
-
N‐acetyl cysteine;
-
ursodeoxycholic acid;
-
interferon‐alpha;
-
pegylated interferon‐alpha;
-
other interferons;
-
thymosin.
The above list of interventions was not an exhaustive list. If we identified any other pharmacological interventions that we were not aware of (we included hepatitis B immunoglobulin (HBIG)), we considered them eligible and included them in the review if they were used primarily for the treatment of acute HBV infection.
Types of outcome measures
We assessed the benefits and harms of available pharmacological interventions aimed at treating people with acute HBV infection for the following outcomes.
Primary outcomes
-
Short‐term mortality (up to one year).
-
Progression to chronic HBV infection or to fulminant hepatitis HBV infection (in trials that included only participants without fulminant HBV infection).
-
Adverse events (within three months of cessation of treatment). We defined a non‐serious adverse event as any untoward medical occurrence not necessarily having a causal relationship with the treatment but resulting in a dose reduction or discontinuation of treatment (any time after commencement of treatment) (ICH‐GCP 1997). We defined a serious adverse event as any event that would increase mortality; was life threatening; required hospitalisation; resulted in persistent or significant disability; was a congenital anomaly/birth defect; or any important medical event that might have jeopardised the person or required intervention to prevent it. We planned to use the definition used by study authors for non‐serious adverse events and serious adverse events:
-
proportion of participants with serious adverse events;
-
number of serious adverse events;
-
proportion of participants with any type of adverse event;
-
number of any type of adverse event.
-
-
Health‐related quality of life as defined in the included trials using a validated scale such as EQ‐5D or 36‐item Short Form (SF‐36) (EuroQol 2014; Ware 2014):
-
short‐term (up to one year);
-
medium‐term (one to five years);
-
long‐term (beyond five years).
-
We considered short‐term quality of life more important than medium‐term or long‐term quality of life, although medium‐term or long‐term quality of life are also important primary outcomes.
Secondary outcomes
-
Mortality:
-
medium‐term mortality (one to five years) (proportion);
-
time to death (maximal follow‐up).
-
-
Liver transplantation:
-
proportion of participants with liver transplantation (for fulminant HBV infection);
-
time to liver transplantation (maximal follow‐up).
-
-
Cirrhosis (maximal follow‐up):
-
proportion of participants with cirrhosis;
-
time to cirrhosis.
-
-
Decompensated liver disease (maximal follow‐up):
-
proportion of participants with decompensated liver disease;
-
time to liver decompensation.
-
-
Proportion of participants with hepatocellular carcinoma (maximal follow‐up).
Potential surrogate outcomes (added post hoc)
We have reported seroconversion which is sometimes used as a surrogate for progression to chronic HBV infection.
Search methods for identification of studies
Electronic searches
We searched the Cochrane Central Register of Controlled Trials (CENTRAL), MEDLINE (OvidSP), Embase (OvidSP), and Science Citation Index Expanded (Web of Knowledge) (Royle 2003) from inception to 11 August 2016 for randomised clinical trials comparing two or more of the above interventions (including placebo or no intervention) without applying any language restrictions. We searched for all possible comparisons formed by the interventions of interest. To identify further ongoing or completed trials, we also searched the World Health Organization International Clinical Trials Registry Platform search portal (www.who.int/ictrp/en/), which encompasses various trial registers, including ISRCTN and ClinicalTrials.gov on 11 August 2016. Appendix 2 shows the search strategies that we used and the time spans of the searches.
Searching other resources
We searched the references of the identified trials and planned to search existing systematic reviews on acute HBV infection (we did not find any existing systematic reviews on this topic) to identify additional trials for inclusion.
Data collection and analysis
Selection of studies
Three review authors (KM, MR, and KG) independently identified the trials for inclusion by screening the titles and abstracts. We sought full‐text articles for any references that at least one of the review authors identified for potential inclusion. We selected trials for inclusion based on the full‐text articles. We have listed the excluded full‐text references with reasons for their exclusion in the Characteristics of excluded studies table. We planned to list any ongoing trials identified primarily through the search of the clinical trial registers for further follow‐up; however, we did not find any ongoing trials on the topic. We resolved discrepancies through discussion.
Data extraction and management
Three review authors (KM, MR, and KG) independently extracted the following data.
-
Outcome data (for each outcome and for each treatment arm whenever applicable):
-
number of participants randomised;
-
number of participants included for the analysis;
-
number of participants with events for binary outcomes, mean and standard deviation for continuous outcomes, number of events for count outcomes, and number of participants with events and mean follow‐up period for time‐to‐event outcomes;
-
definition of outcomes or scale used if appropriate.
-
-
Data on potential confounding variables:
-
participant characteristics such as age, sex, comorbidity, proportion of participants with asymptomatic or mild acute HBV infection versus severe acute HBV infection or fulminant HBV infection, and proportion of participants with different HBV genotypes;
-
details of the intervention and control (including dose, frequency, and duration);
-
risk of bias (assessment of risk of bias in included studies).
-
-
Other data:
-
year and language of publication;
-
country in which the participants were recruited;
-
year(s) in which the trial was conducted;
-
inclusion and exclusion criteria;
-
follow‐up time points of the outcome.
-
If available, we planned to obtain the data separately for treatment‐naive, non‐responders, and relapsers from the report. If available, we also planned to obtain the data separately on participants with asymptomatic or mild acute HBV infection compared to severe acute HBV infection, or fulminant HBV infection, and participants with different genotypes. We sought unclear or missing information by attempting to contact the trial authors. If there was any doubt whether trials shared the same participants ‐‐ completely or partially (by identifying common authors and centres) ‐‐ we planned to attempt to contact the trial authors to clarify whether the trial report was duplicated; however, there were no such trials. We resolved any differences in opinion through discussion.
Assessment of risk of bias in included studies
We followed the guidance given in the Cochrane Handbook for Systematic Reviews of Interventions (Higgins 2011), and described in the Cochrane Hepato‐Biliary Module (Gluud 2016), to assess the risk of bias in included studies. Specifically, we assessed the risk of bias in included trials for the following domains using the bias risk domains with definitions below (Schulz 1995; Moher 1998; Kjaergard 2001; Wood 2008; Savović 2012a; Savović 2012b; Lundh 2017).
Allocation sequence generation
-
Low risk of bias: sequence generation was achieved using computer random number generation or a random number table. Drawing lots, tossing a coin, shuffling cards, and throwing dice were adequate if performed by an independent person not otherwise involved in the trial.
-
Unclear risk of bias: the method of sequence generation was not specified.
-
High risk of bias: the sequence generation method was not random.
Allocation concealment
-
Low risk of bias: the participant allocations could not have been foreseen in advance of, or during, enrolment. Allocation was controlled by a central and independent randomisation unit. The allocation sequence was unknown to the investigators (e.g. if the allocation sequence was hidden in sequentially numbered, opaque, and sealed envelopes).
-
Unclear risk of bias: the method used to conceal the allocation was not described so that intervention allocations may have been foreseen in advance of, or during, enrolment.
-
High risk of bias: the allocation sequence was likely to be known to the investigators who assigned the participants.
Blinding of participants and personnel
-
Low risk of bias: any of the following: no blinding or incomplete blinding, but the review authors judged that the outcome was not likely to be influenced by lack of blinding; or blinding of participants and key study personnel ensured, and it was unlikely that the blinding could have been broken.
-
Unclear risk of bias: any of the following: insufficient information to permit judgement of 'low risk' or 'high risk'; or the trial did not address this outcome.
-
High risk of bias: any of the following: no blinding or incomplete blinding, and the outcome was likely to be influenced by lack of blinding; or blinding of key study participants and personnel attempted, but likely that the blinding could have been broken, and the outcome was likely to be influenced by lack of blinding.
Blinding of outcome assessors
-
Low risk of bias: any of the following: no blinding of outcome assessment, but the review authors judged that the outcome measurement was not likely to be influenced by lack of blinding; or blinding of outcome assessment ensured, and unlikely that the blinding could have been broken.
-
Unclear risk of bias: any of the following: insufficient information to permit judgement of 'low risk' or 'high risk'; or the trial did not address this outcome.
-
High risk of bias: any of the following: no blinding of outcome assessment, and the outcome measurement was likely to be influenced by lack of blinding; or blinding of outcome assessment, but likely that the blinding could have been broken, and the outcome measurement was likely to be influenced by lack of blinding.
Incomplete outcome data
-
Low risk of bias: missing data were unlikely to make treatment effects depart from plausible values. Sufficient methods, such as multiple imputation, has been employed to handle missing data.
-
Unclear risk of bias: there was insufficient information to assess whether missing data in combination with the method used to handle missing data were likely to induce bias on the results.
-
High risk of bias: the results were likely to be biased due to missing data.
Selective outcome reporting
-
Low risk of bias: the trial reported at least short‐term mortality, progression to chronic HBV infection, and treatment‐related adverse events. If the original trial protocol was available, the outcomes should have been those called for in that protocol. If the trial protocol was obtained from a trial registry (e.g. www.clinicaltrials.gov), the outcomes sought should have been those enumerated in the original protocol if the trial protocol was registered before or at the time that the trial was begun. If the trial protocol was registered after the trial was begun, those outcomes were not considered to be reliable.
-
Unclear risk of bias: not all predefined, or clinically relevant and reasonably expected, outcomes were reported fully, or it was unclear whether data on these outcomes were recorded or not.
-
High risk of bias: one or more predefined or clinically relevant and reasonably expected outcomes were not reported, even though data on these outcomes were likely to have been available and even recorded.
For‐profit bias
-
Low risk of bias: the trial appeared to be free of industry sponsorship or other type of for‐profit support that may manipulate the trial design, conductance, or results of the trial.
-
Unclear risk of bias: the trial may or may not have been free of for‐profit bias as no information on clinical trial support or sponsorship was provided.
-
High risk of bias: the trial was sponsored by industry or received other type of for‐profit support.
Other bias
-
Low risk of bias: the trial appeared to be free of other components (e.g. inappropriate control or dose or administration of control) that could put it at risk of bias.
-
Unclear risk of bias: the trial may or may not have been free of other components that could put it at risk of bias.
-
High risk of bias: there are other factors in the trial that could put it at risk of bias (e.g. inappropriate control or dose or administration of control).
We considered a trial at low risk of bias if we assessed the trial to be at low risk of bias across all the above domains. Otherwise, we considered trials at unclear risk of bias or at high risk of bias regarding one or more of the above domains at high risk of bias.
Measures of treatment effect
For dichotomous variables (e.g. short‐term and medium‐term mortality, liver transplantation, progression to chronic HBV, proportion of participants with adverse events, decompensated liver disease, cirrhosis, or hepatocellular carcinoma), we calculated the odds ratio (OR) with 95% confidence intervals (CI). For continuous variables (e.g. quality of life reported on the same scale), we calculated the mean difference (MD) with 95% CI. We planned to use standardised mean difference values with 95% CI for quality of life if included trials used different scales. For count outcomes (e.g. number of adverse events), we calculated the rate ratio with 95% CI. For time‐to‐event data (e.g. mortality at maximal follow‐up or requirement for liver transplantation, time to liver decompensation, and time to cirrhosis), we planned to use the hazard ratio with 95% CIs. We also calculated Trial Sequential Analysis‐adjusted CI to control random errors (Thorlund 2011; Wetterslev 2017).
Unit of analysis issues
The unit of analysis was people with acute HBV infection according to the intervention group to which they were randomly assigned.
Cluster randomised clinical trials
We found no cluster randomised clinical trials. However, if we found such trials, we planned to include these, provided that the effect estimate adjusted for cluster correlation was available.
Cross‐over randomised clinical trials
As expected, we found no cross‐over randomised clinical trials. However, if we had identified any, we planned to only include the outcomes after the period of first treatment to avoid a potentially residual effect (the carryover effect) from the treatment administered during the first period.
Trials with multiple intervention groups
We collected data for all trial intervention groups that met the inclusion criteria.
Dealing with missing data
We performed an intention‐to‐treat analysis whenever possible (Newell 1992). Otherwise, we used the data that were available to us (e.g. a trial may have reported only 'per‐protocol' analysis results). As such per‐protocol analyses may be biased, we planned to conduct best‐worst case scenario (good outcome (e.g. no mortality) in intervention group and bad outcome (e.g. mortality) in control group) and worst‐best case scenario (bad outcome (e.g. mortality) in intervention group and good outcome (e.g. no mortality) in control group) analyses as sensitivity analyses whenever possible.
For continuous outcomes, we planned to impute the standard deviation from P values according to guidance given in the Cochrane Handbook for Systematic Reviews of Interventions (Higgins 2011). If the data were likely to be normally distributed, we planned to use the median for meta‐analysis when the mean was not available. If it was not possible to calculate the standard deviation from the P value or the CIs, we planned to impute the standard deviation using the largest standard deviation in other trials for that outcome. This form of imputation may decrease the weight of the study for calculation of MDs and may bias the effect estimate to no effect for calculation of standardised mean differences (Higgins 2011).
Assessment of heterogeneity
We assessed clinical and methodological heterogeneity by carefully examining the characteristics and design of included trials. We assessed or planned to assess the presence of clinical heterogeneity by comparing effect estimates in participants with asymptomatic or mild acute HBV infection compared to severe acute HBV infection or fulminant HBV infection, different HBV genotypes, and the different regimens (e.g. different doses and different durations) of the pharmacological interventions. Different study designs and risk of bias may contribute to methodological heterogeneity. We used the I2 test and Chi2 test for heterogeneity, and overlapping of CIs to assess heterogeneity.
Assessment of reporting biases
We planned to use visual asymmetry on a funnel plot to explore reporting bias in the presence of at least 10 trials that could be included for a direct comparison (Egger 1997; Macaskill 2001). In the presence of heterogeneity that could be explained by subgroup analysis, we planned to produce a funnel plot for each subgroup in the presence of the adequate number of trials. We planned to use the linear regression approach described by Egger 1997 to determine the funnel plot asymmetry.
We also considered selective reporting as evidence of reporting bias.
Data synthesis
We performed the meta‐analyses according to the recommendations of Cochrane (Higgins 2011), using the software package Review Manager 5 (RevMan 2014). We used a random‐effects model (DerSimonian 1986) and a fixed‐effect model (DeMets 1987). In the case of a discrepancy between the two models, we reported both results; otherwise, we reported only the results from the fixed‐effect model.
Calculation of required information size and Trial Sequential Analysis
For calculation of the required information size, see Appendix 3. We performed Trial Sequential Analysis to control the risks of random errors when there were at least two trials included in the meta‐analysis (Wetterslev 2008; Thorlund 2011; TSA 2011; Wetterslev 2017). We used an alpha error as per guidance of Jakobsen 2014, power of 90% (beta error of 10%), a relative risk reduction of 20%, a control group proportion observed in the trials, and the diversity observed in the meta‐analysis.
Subgroup analysis and investigation of heterogeneity
We planned to assess the differences in the effect estimates between the following subgroups.
-
Trials with low risk of bias compared to trials with high risk of bias.
-
Asymptomatic or mild acute HBV infection compared to severe acute HBV infection or fulminant HBV infection.
-
Different HBV genotypes.
-
Different regimens (different doses and different durations) of pharmacological interventions.
We planned to use the Chi2 test for subgroup differences to identify subgroup differences.
Sensitivity analysis
If a trial reported only per‐protocol analysis results, we planned to re‐analyse the results using the best‐worst case scenario and worst‐best case scenario analyses as sensitivity analyses whenever possible.
Presentation of results and GRADE assessments
We reported all the primary outcomes in a 'Summary of findings' table format for comparisons with at least two trials, downgrading the quality of evidence for risk of bias, inconsistency, indirectness, imprecision, and publication bias using GRADE (Guyatt 2011). One review author (KG) created the 'Summary of findings' table.
Results
Description of studies
Results of the search
We identified 2676 references through electronic searches of CENTRAL (n = 238), MEDLINE (n = 1786), Embase (n = 310), Science Citation Index Expanded (n = 322), World Health Organization International Clinical Trials Registry Platform (n = 10), and ClinicalTrials.gov trials registers (n = 10). After the removal of 446 duplicates we obtained 2230 references. We then excluded 2215 clearly irrelevant references through screening titles and reading abstracts. We retrieved 15 references for further assessment. No references were identified through scanning reference lists of the identified randomised trials. We excluded seven references for the reasons listed in Characteristics of excluded studies table (Gregory 1976; Blum 1977; Botero 1991; Flisiak 2000; Sharapov 2000; Tillmann 2006; Yu 2010). In total, seven trials (eight references) met the inclusion criteria (Anonymous 1974; Tassopoulos 1989; Tassopoulos 1997; Apostolescu 2001; Kumar 2007; Wiegand 2014; Streinu‐Cercel 2016). The reference flow is summarised in the study flow diagram (Figure 1).

Study flow diagram. HBV: hepatitis B virus; RCT: randomised clinical trial.
Included studies
The seven trials included 597 participants (Anonymous 1974; Tassopoulos 1989; Tassopoulos 1997; Apostolescu 2001; Kumar 2007; Wiegand 2014; Streinu‐Cercel 2016). In these seven trials, 597 participants were randomised and data on one or more outcomes were available for 592 participants. One trial was a three‐armed trial which compared lamivudine, entecavir, and no intervention (Streinu‐Cercel 2016). The remaining six trials were two‐armed trials (Anonymous 1974; Tassopoulos 1989; Tassopoulos 1997; Apostolescu 2001; Kumar 2007; Wiegand 2014). The details of intervention, control, and the period of follow‐up, and the risk of bias in the trials arranged according to intervention and control is summarised in Table 1. One trial (55 participants) compared HBIG versus placebo (Anonymous 1974). Two trials (200 participants) compared interferon versus placebo (Tassopoulos 1989; Tassopoulos 1997). Four trials (316 participants) compared lamivudine versus placebo or no intervention (Apostolescu 2001; Kumar 2007; Wiegand 2014; Streinu‐Cercel 2016). One trial (90 participants) compared lamivudine versus entecavir (Streinu‐Cercel 2016). One trial (131 participants) compared entecavir versus no intervention (Streinu‐Cercel 2016). Overall, five trials used placebo as the 'no intervention' (Anonymous 1974; Tassopoulos 1989; Tassopoulos 1997; Kumar 2007; Wiegand 2014); two trials used 'no intervention' as the 'no intervention' (Apostolescu 2001; Streinu‐Cercel 2016). The mean or median follow‐up period in the trials ranged from three to 12 months in the six trials that provided this information (Tassopoulos 1989; Tassopoulos 1997; Apostolescu 2001; Kumar 2007; Wiegand 2014; Streinu‐Cercel 2016).
| Study name | Intervention | Control | Follow‐up period (months) | Sequence generation | Allocation concealment | Blinding of participants and healthcare providers | Blinding of outcome assessors | Incomplete outcome data | Selective outcome reporting | Source of funding | Other bias | Overall risk of bias |
| Hepatitis B Immunoglobulin | Placebo | Not stated | Low | Low | Unclear | Unclear | Unclear | High | Low | Low | High | |
| Interferon | Placebo | Min 5 | Unclear | Unclear | Unclear | Unclear | Unclear | High | High | Low | High | |
| Interferon | Placebo | Min 5 | Unclear | Unclear | Low | Low | Low | High | High | Low | High | |
| Lamivudine | No intervention | Min 3 | Unclear | Unclear | Unclear | Unclear | Unclear | High | Unclear | Low | High | |
| Lamivudine | Placebo | Min 12 | Low | Unclear | Low | Low | Low | Low | Unclear | Low | Unclear | |
| Lamivudine | Placebo | Not stated | Unclear | Unclear | Unclear | Unclear | High | High | Low | Low | High | |
| Lamivudine | Control 1: entecavir | Min 11 | Low | Unclear | High | High | Low | High | Low | Low | High |
Min: minimum.
The mean or median age in the five trials that reported this information ranged from 32 to 41 years (Tassopoulos 1989; Tassopoulos 1997; Kumar 2007; Wiegand 2014; Streinu‐Cercel 2016). The proportion of females in the trials that reported this information ranged from 14% to 54% (Tassopoulos 1989; Tassopoulos 1997; Kumar 2007; Wiegand 2014; Streinu‐Cercel 2016). One trial included only participants with acute HBV and hepatic encephalopathy (i.e. participants with fulminant liver failure; Anonymous 1974); one trial included only participants with severe acute HBV, but did not state whether it included fulminant HBV infection (Streinu‐Cercel 2016); three trials excluded people with fulminant HBV infection (Tassopoulos 1989; Tassopoulos 1997; Wiegand 2014); two trials did not report the severity of acute HBV infection (Apostolescu 2001; Kumar 2007). None of the trials reported the proportion of participants with different HBV genotypes.
Source of funding: two trials received financial assistance from pharmaceutical companies who would benefit from the findings of the research or one of the authors was employed by a pharmaceutical company who would benefit from the findings of the research (Tassopoulos 1989; Tassopoulos 1997); two trials did not report the source of funding (Apostolescu 2001; Kumar 2007); three trials were funded by parties without any vested interest in the results or did not receive any special funding (Anonymous 1974; Wiegand 2014; Streinu‐Cercel 2016)..
Excluded studies
We excluded seven references because they were quasi‐randomised studies (two references: Sharapov 2000; Yu 2010), non‐randomised studies (two references: Flisiak 2000; Tillmann 2006), lack of confirmation of HBV infection in all participants (two references: Gregory 1976; Blum 1977), or because only four participants in the trial had acute HBV infection (three in intervention group and one in control group) (Botero 1991).
Risk of bias in included studies
The risk of bias in included trials is summarised in Figure 2 and Figure 3. None of the trials were at low risk of bias and were at high risk of bias in one or more domains. So, all the trials were at high risk of bias.

Risk of bias graph: review authors' judgements about each risk of bias item presented as percentages across all included studies.

Risk of bias summary: review authors' judgements about each risk of bias item for each included study.
Allocation
Three trials were at low risk of random sequence generation bias (Anonymous 1974; Kumar 2007; Streinu‐Cercel 2016). The remaining trials were at unclear risk of random sequence generation bias (Tassopoulos 1989; Tassopoulos 1997; Apostolescu 2001; Wiegand 2014). One trial was at low risk of allocation concealment bias (Anonymous 1974). The remaining trials were at unclear risk of allocation concealment bias (Tassopoulos 1989; Tassopoulos 1997; Apostolescu 2001; Kumar 2007; Wiegand 2014; Streinu‐Cercel 2016).
Blinding
Two trials were at low risk of bias due to lack of blinding of participants, healthcare providers, and outcome assessors (Tassopoulos 1997; Kumar 2007). One trial was at high risk of bias due to lack of blinding of participants, healthcare providers, and outcome assessors (Streinu‐Cercel 2016). The remaining trials were at unclear risk of bias due to lack of blinding of participants, healthcare providers, and outcome assessors (Anonymous 1974; Tassopoulos 1989; Apostolescu 2001; Wiegand 2014).
Incomplete outcome data
Three trials were at low risk of bias due to incomplete outcome data (Tassopoulos 1997; Kumar 2007; Streinu‐Cercel 2016). One trial was at high risk of bias due to incomplete outcome data (Wiegand 2014). The remaining trials were at unclear risk of bias due to incomplete outcome data (Anonymous 1974; Tassopoulos 1989; Apostolescu 2001).
Selective reporting
None of the trials had a published protocol. Two trials reported mortality, adverse events, and progression to chronic HBV, and were at low risk of reporting bias (Kumar 2007; Streinu‐Cercel 2016). The remaining trials did not report these outcomes, which can be reasonably expected to be measured in trials in this field (Anonymous 1974; Tassopoulos 1989; Tassopoulos 1997; Apostolescu 2001; Wiegand 2014). So, these trials were at high risk of selecting outcome reporting.
Other potential sources of bias
Three trials were at low risk of vested interest bias (Anonymous 1974; Wiegand 2014; Streinu‐Cercel 2016); two trials were at high risk of vested interest bias (Tassopoulos 1989; Tassopoulos 1997); the remaining trials were at unclear risk of vested interest bias (Apostolescu 2001; Kumar 2007).
All the trials were at low risk of other bias.
Effects of interventions
See: Summary of findings for the main comparison Lamivudine versus no intervention for acute hepatitis B virus infection; Summary of findings 2 Interferon versus no intervention for acute hepatitis B virus infection
Short‐term mortality (up to one year)
Three trials (326 participants) reported short‐term mortality (Anonymous 1974; Kumar 2007; Streinu‐Cercel 2016). There was no evidence of difference in short‐term mortality in any of the comparisons (Analysis 1.1).
-
HBIG (19/27 (70.4%)) versus placebo (19/28 (67.9%)) (OR 1.13, 95% CI 0.36 to 3.54; participants = 55; 1 trial).
-
Lamivudine (adjusted proportion: 4.3%) versus placebo or no intervention (5/150 (3.3%)) (OR 1.29, 95% CI 0.33 to 4.99; participants = 250; 2 trials).
-
Lamivudine (4/69 (5.8%)) versus entecavir (1/21 (4.8%)) (OR 1.23, 95% CI 0.13 to 11.65; participants = 90; 1 trial).
-
Entecavir (1/21 (4.8%)) versus no intervention (5/110 (4.5%)) (OR 1.05, 95% CI 0.12 to 9.47; participants = 131; 1 trial).
Only one comparison had more than one trial (lamivudine versus placebo or no intervention). Even in this comparison, only one trial contributed to the analysis (Streinu‐Cercel 2016), as there were no events in either group in the other trial (Kumar 2007). Therefore, heterogeneity was not assessed.
Progression to chronic hepatitis B virus infection or to fulminant hepatitis B virus infection
Three trials (306 participants) reported proportion of people who continued to have HBsAg in serum (Kumar 2007; Wiegand 2014; Streinu‐Cercel 2016). The proportion of people who developed progression to chronic HBV infection was higher in the lamivudine group (adjusted proportion: 58.4%) versus the placebo or no intervention group (69/167 (41.3%)) (OR 1.99, 95% CI 1.05 to 3.77; participants = 285; 3 trials; I2 = 0%) and in the lamivudine group (53/69 (76.8%)) versus the entecavir group (10/21 (47.6%)) (OR 3.64, 95% CI 1.31 to 10.13; participants = 90; 1 trial). There was no evidence of difference in the proportion of people who progressed to chronic HBV infection between the entecavir group (10/21 (47.6%)) versus the no intervention group (67/110 (60.9%)) (OR 0.58, 95% CI 0.23 to 1.49; participants = 131; 1 trial) (Analysis 1.2).
There was no evidence of heterogeneity in the only comparison with more than one trial (lamivudine versus placebo or no intervention: I2 = 0%). None of the trials reported progression to fulminant hepatitis. Authors also reported seroconversion which was variably defined in the different trials (see 'Seroconversion (surrogate outcome)' below). As this is an unvalidated surrogate outcome, we presented this information last and did not arrive at conclusions based on this surrogate outcome.
Adverse events
Three trials (371 participants) reported serious adverse events (Tassopoulos 1989; Kumar 2007; Streinu‐Cercel 2016). There were no serious adverse events in any of the groups (Analysis 1.3).
Three trials (235 participants) reported proportion of people with any adverse events (Tassopoulos 1989; Tassopoulos 1997; Wiegand 2014). The proportion of people with adverse events was higher in the interferon group (adjusted proportion: 99.2%) versus the placebo group (18/66 (27.3%)) (OR 348.16, 95% CI 45.39 to 2670.26; participants = 200; 2 trials; low quality evidence: downgraded by one level for risk of bias in the studies and one more level for small sample size) (Analysis 1.4). There was no evidence of heterogeneity (I2 = 0%; Chi2 test for heterogeneity P = 1.00; good overlap of CIs). There was no evidence of difference in the proportion of people with adverse events between the lamivudine group (13/18 (72.2%)) versus the placebo or no intervention (11/17 (64.7%)) (OR 1.42, 95% CI 0.34 to 5.94; participants = 35; 1 trial) or the number of adverse events between the lamivudine group (38/18 (211.1 events per 100 participants)) versus the no intervention group (21/17 (123.5 events per 100 participants)) (rate ratio 1.72, 95% CI 1.01 to 2.91; participants = 35; 1 trial) (Analysis 1.5).
Health‐related quality of life
One trial (100 participants) reported health‐related quality of life at one week (Tassopoulos 1997). The scale used to report the health‐related quality of life was not stated. Neither was information on whether higher score meant better or worse available. The mean score in the placebo group was 42.7 units. The mean score in the interferon group was 5.4 units higher. There was no information to calculate the 95% CIs or P value (Analysis 1.6). None of the trials reported quality of life beyond one week.
Mortality (beyond one year)
None of the trials reported mortality beyond one year.
Liver transplantation
None of the trials reported the proportion of people who required liver transplantation.
Cirrhosis
None of the trials reported the proportion of people who developed cirrhosis.
Decompensated liver disease
None of the trials reported the proportion of people who developed decompensated liver disease.
Hepatocellular carcinoma
None of the trials reported the proportion of people who developed hepatocellular carcinoma.
Seroconversion (surrogate outcome)
Five trials (437 participants) reported proportion of people who developed seroconversion (Tassopoulos 1997; Apostolescu 2001; Kumar 2007; Wiegand 2014; Streinu‐Cercel 2016). The definition of seroconversion in the four trials that reported this information were: clearance of HBV DNA (Tassopoulos 1997), hepatitis B surface antibody at 12 months (Kumar 2007), hepatitis B surface antibody at 24 weeks (Streinu‐Cercel 2016), and hepatitis B surface antibody greater than 10 U/L (Wiegand 2014). The seroconversion proportions in the different comparisons were (Analysis 1.8):
-
interferon (65/67 (97.0%)) versus placebo (33/33 (100.0%)) (OR 0.39, 95% CI 0.02 to 8.38; participants = 100; 1 trial);
-
lamivudine (proportion: varied between 10.1% and 77.8%) versus placebo or no intervention (proportion varied between 22.7% and 85%) (OR varied between 0.27 and 2.63 (meta‐analysis inappropriate because of variable definitions used for seroconversion and poor overlap of CI between effect estimates between trials); participants = 316; 4 trials);
-
lamivudine (7/69 (10.1%)) versus entecavir (9/21 (42.9%)) (OR 0.15, 95% CI 0.05 to 0.48; participants = 90; 1 trial);
-
entecavir (9/21 (42.9%)) versus no intervention (25/110 (22.7%)) (OR 2.55, 95% CI 0.96 to 6.74; participants = 131; 1 trial).
Of the five trials that reported the proportion of people who developed seroconversion, two trials (135 participants) reported the time taken to achieve seroconversion (Tassopoulos 1997; Wiegand 2014). Of these, only one reported the standard deviation (Tassopoulos 1997). There was no evidence of difference in the time taken to achieve seroconversion between interferon and placebo (MD ‐0.10 weeks, 95% CI ‐2.02 to 1.82; participants = 100; 1 trial) or between lamivudine and placebo or no intervention (MD 1.00 weeks, P = 0.519 (no details to calculate 95% CI); participants = 35; 1 trial) (Analysis 1.8; Analysis 1.9).
Subgroup analysis and sensitivity analysis
We did not perform any of the subgroup analyses because none of the trials were at low risk of bias, the trials did not report the data for different genotypes separately, and because there were too few trials to perform a meaningful subgroup analysis based on severity of hepatitis B or dosage. Only one trial reported postrandomisation dropouts but did not report the group to which the participants belonged. Therefore, we did not perform a sensitivity analysis. Since we did not impute mean or standard deviations, we did not perform a sensitivity analysis excluding trials in which mean or standard deviation were imputed.
Reporting bias
We did not explore reporting bias using funnel plot because of few trials included in the review.
Trial Sequential Analysis
We performed Trial Sequential Analysis for comparisons with two or more trials only (progression to chronic HBV infection: lamivudine versus placebo or no intervention and adverse events (proportion): interferon versus placebo). As shown in Figure 4, the accrued sample size was only a small fraction of the diversity‐adjusted required information size (DARIS). The Z‐curve did not cross trial sequential monitoring boundaries indicating that there was a high risk of random errors in these outcomes.

Trial sequential analysis of progression to chronic hepatitis B virus infection (lamivudine versus placebo or no treatment) and adverse events (proportion) (interferon versus placebo): Using the control group proportion observed in the trials (Pc = 41.3% and 34.9% respectively), alpha error of 2%, beta error of 90%, relative risk reduction (RRR) of 20%, and diversity observed in the analysis (0%), the accrued sample sizes (285 and 200 respectively) were only small proportions of the diversity‐adjusted required information sizes (DARIS) (progression to chronic hepatitis B = 1783; adverse events (proportion) = 2303). While the Z‐curve (blue lines) crossed the conventional boundary of P = 0.05 (dotted green lines) favouring placebo or no treatment, it did not cross any of the trial sequential monitoring boundaries (dotted red lines). There was a high risk of random errors.
The Trial Sequential Analysis adjusted CIs were as follows.
-
Progression to chronic HBV infection: lamivudine versus no intervention: 1.99 (95% CI 0.15 to 27.06).
-
Adverse events (proportion): interferon versus placebo: 348.16 (95% CI 0.09 to 1,422,918.89).
Quality of evidence
The overall quality of evidence was very low for all outcomes unless indicated. The reason for downgrading was risk of bias in the trials (one level), small sample size (one level), and wide CIs (one level) (summary of findings Table for the main comparison).
Discussion
Summary of main results
A total of 597 participants in seven trials were included in this review. A total of 592 participants in these seven trials contributed to one or more outcomes of this review. A total of five interventions (four active interventions and one inactive intervention) were evaluated in the seven trials included in this review. This included interferon, HBIG, lamivudine, entecavir, and inactive intervention (placebo or no intervention).
Overall, mortality at three months to one year following intervention in people with acute HBV infection was low (10/271 (3.7%)) (Kumar 2007; Streinu‐Cercel 2016), except in the one trial reported in 1970s, which included only people with fulminant HBV infection (Anonymous 1974). Mortality in this trial was 69.1% (38/55) (Anonymous 1974). There was no evidence of differences in mortality between different interventions regardless of the severity of HBV infection. However, the sample size was very low to detect differences in mortality. Three trials reported the proportion of people who progressed to chronic HBV infection (defined as persistence of HBsAg after six months). None of the interventions resulted in reduction in the proportion of people who progressed to chronic HBV infection compared to placebo or no intervention. None of the trials reported progression to fulminant HBV infection either. None of the participants developed serious adverse events in the three trials that reported this information (Tassopoulos 1989; Kumar 2007; Streinu‐Cercel 2016). The proportion of people who developed adverse events (such as influenza‐like symptoms and vomiting), was more in the interferon group than the placebo group. However, the trial sequential monitoring boundaries were not crossed, suggesting that there may be random errors. There was no evidence of a difference in proportion of people who developed adverse events or the number of adverse events between lamivudine and placebo or no intervention. Although one trial reported quality of life at one week, the information was not sufficient to understand whether there was a difference in quality of life between the two interventions compared in this trial (interferon versus placebo) (Tassopoulos 1997).
None of the trials reported the proportion of people who died during medium or long term (more than one year' follow‐up); required liver transplantation; or developed cirrhosis, decompensated liver disease, or developed hepatocellular carcinoma.
The trials reported seroconversion as a surrogate outcome for progression to chronic HBV infection. The definition used in the trials was variable, reflecting the problem with using lack of seroconversion as a surrogate marker for chronic HBV infection. In any case, the only comparison where there was evidence for difference was lamivudine versus entecavir: seroconversion was lower in people who received lamivudine compared with those who received entecavir. There was no evidence for differences in the time taken for seroconversion in the trials that reported this information.
Overall completeness and applicability of evidence
Overall, it appears that none of the interventions are beneficial for people with acute HBV infection.
Considering that lamivudine or interferon do not offer any benefit but have the potential to cause harm, it may be appropriate to test entecavir or other similar antiviral interventions such as tenofovir. We have included all the major interventions used for treating acute HBV infection that have been compared in randomised clinical trials in this review. The severity of acute HBV infection was variable across trials. In particular, only one trial clearly indicated inclusion of fulminant HBV infection (Anonymous 1974). Three trials clearly excluded fulminant HBV infection (Tassopoulos 1989; Tassopoulos 1997; Wiegand 2014). It was unclear whether any participants with fulminant HBV infection were included in the remaining trials (Apostolescu 2001; Kumar 2007; Streinu‐Cercel 2016). Considering that the main interventions that are currently recommended for treatment of acute HBV infection are antiviral drugs (Tillmann 2012) (and there was no comparison of antiviral interventions versus no intervention in people with fulminant HBV infection), the findings of this review are applicable only to people with acute HBV without fulminant liver failure. The findings are also applicable only in adults with acute HBV infection, as none of the trials appeared to include children. The findings are also applicable only in people who have not undergone liver transplantation and those who do not have other coexisting viral diseases, since we did not consider trials conducted in these populations.
Quality of the evidence
The overall quality of evidence was low to very low for all the outcomes. All the trials were at high risk of bias for at least one of the domains as shown in Figure 2 and Figure 3. The sample size was small for all the comparisons. There were also wide 95% CIs (the CIs overlapped 20% increase or decrease and minimal clinical important difference) for many of the comparisons. Moreover, when we calculated Trial Sequential analysis‐adjusted CI, the inconsistency exploded. There was insufficient information to assess whether the diagnostic criteria for acute HBV and the severity of acute hepatitis HBV were similar across trials. In general, there was no evidence of statistical heterogeneity in most comparisons with the exception of the seroconversion in the comparison lamivudine versus placebo or no intervention, where there was moderate heterogeneity.
Potential biases in the review process
We followed the guidance of Cochrane Handbook for Systematic Reviews of Interventions with two review authors independently selecting studies and extracting data. We performed a thorough search of literature. However, the search period included the premandatory trial registration era and it is likely that some trials on interventions that were not effective or were harmful were not reported at all.
We only included randomised clinical trials which are known to focus mostly on benefits and do not collect and report harms in a detailed manner. According to our choice of studies (i.e. only randomised clinical trials), we might have missed a large number of studies that address reporting of harms. Accordingly, this review is biased towards benefits ignoring harms. We did not search for interventions and trials registered at regulatory authorities (e.g. US Food and Drug Administration; European Medicines Agency, etc.). This may have overlooked trials and as such trials usually are unpublished, the lack of inclusion of such trials may make our comparisons look more advantageous than they really are. However, this is of academic interest only because there is no evidence of benefit of any treatment in people with acute HBV infection (i.e. there is no reason to suggest that any of the interventions should be used in routine clinical practice regardless of the adverse event profile of the intervention).
We planned to perform a network meta‐analysis. However, it was not possible to assess whether the potential effect modifiers were similar across different comparisons. Performing a network meta‐analysis in this scenario can be misleading. So we did not perform the network meta‐analysis, and assessed the comparative benefits and harms of different interventions using standard Cochrane methodology.
Agreements and disagreements with other studies or reviews
This is the first systematic review on the topic. Our review does not support the recommendations of EASL or the AASLD (AASLD 2009; EASL 2012). This is probably because we have based our conclusions on randomised clinical trials. Information from non‐randomised studies is likely to provide biased effect estimates, since the people who receive antiviral drugs are likely to differ significantly from those who do not receive antiviral drugs.
Study flow diagram. HBV: hepatitis B virus; RCT: randomised clinical trial.
Risk of bias graph: review authors' judgements about each risk of bias item presented as percentages across all included studies.
Risk of bias summary: review authors' judgements about each risk of bias item for each included study.
Trial sequential analysis of progression to chronic hepatitis B virus infection (lamivudine versus placebo or no treatment) and adverse events (proportion) (interferon versus placebo): Using the control group proportion observed in the trials (Pc = 41.3% and 34.9% respectively), alpha error of 2%, beta error of 90%, relative risk reduction (RRR) of 20%, and diversity observed in the analysis (0%), the accrued sample sizes (285 and 200 respectively) were only small proportions of the diversity‐adjusted required information sizes (DARIS) (progression to chronic hepatitis B = 1783; adverse events (proportion) = 2303). While the Z‐curve (blue lines) crossed the conventional boundary of P = 0.05 (dotted green lines) favouring placebo or no treatment, it did not cross any of the trial sequential monitoring boundaries (dotted red lines). There was a high risk of random errors.

Comparison 1 Pharmacological treatments for acute hepatitis B virus infection, Outcome 1 Mortality.
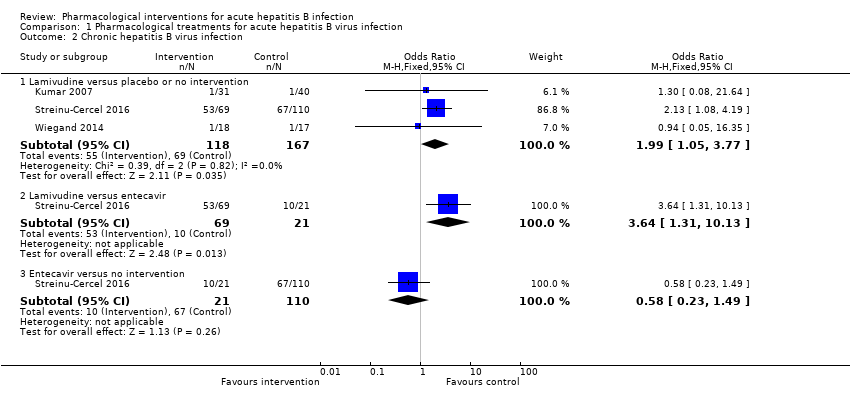
Comparison 1 Pharmacological treatments for acute hepatitis B virus infection, Outcome 2 Chronic hepatitis B virus infection.
| Study | Number of events (intervention) | Number of participants (intervention) | Number of events (control) | Number of participants (control) |
| Interferon versus placebo | ||||
| Tassopoulos 1989 | 0 | 67 | 0 | 33 |
| Lamivudine versus placebo or no intervention | ||||
| Kumar 2007 | 0 | 31 | 0 | 40 |
| Streinu‐Cercel 2016 | 0 | 69 | 0 | 110 |
| Lamivudine versus entecavir | ||||
| Streinu‐Cercel 2016 | 0 | 69 | 0 | 21 |
| Entecavir versus no intervention | ||||
| Streinu‐Cercel 2016 | 0 | 21 | 0 | 110 |
Comparison 1 Pharmacological treatments for acute hepatitis B virus infection, Outcome 3 Serious adverse events.

Comparison 1 Pharmacological treatments for acute hepatitis B virus infection, Outcome 4 Adverse events proportion.

Comparison 1 Pharmacological treatments for acute hepatitis B virus infection, Outcome 5 Adverse events number.
| Study | Mean (interferon) | Number of participants (interferon) | Mean (control) | Number of participants (control) | Mean difference | Statistical significance | Further details on scale used |
| Interferon versus placebo | |||||||
| Tassopoulos 1997 | 48.1 | 67 | 42.7 | 33 | 5.4 | Not stated | Scale not stated. Not reported whether higher score indicates better or worse |
Comparison 1 Pharmacological treatments for acute hepatitis B virus infection, Outcome 6 Health‐related quality of life.

Comparison 1 Pharmacological treatments for acute hepatitis B virus infection, Outcome 7 Seroconversion.

Comparison 1 Pharmacological treatments for acute hepatitis B virus infection, Outcome 8 Time to seroconversion.
| Study | Mean (lamivudine) | Number of participants (lamivudine) | Mean (control) | Number of participants (control) | Mean difference | Statistical significance |
| Lamivudine versus placebo or no intervention | ||||||
| Wiegand 2014 | 17 | 18 | 16 | 17 | 1 | P = 0.519 (not statistically significant) |
Comparison 1 Pharmacological treatments for acute hepatitis B virus infection, Outcome 9 Time to seroconversion [weeks].
| Lamivudine versus no intervention for acute hepatitis B virus infection | |||||
| Patient or population: people with acute HBV infection Settings: secondary or tertiary care Intervention: lamivudine Control: no intervention | |||||
| Outcomes | Illustrative comparative risks* (95% CI) | Relative effect | No of participants | Quality of the evidence | |
| Assumed risk | Corresponding risk | ||||
| No intervention | Lamivudine | ||||
| Short‐term mortality (< 1 year) | 33 per 1000 | 43 per 1000 | OR 1.29 | 250 | ⊕⊝⊝⊝ |
| Progression to chronic HBV infection (6 to 12 months) | 413 per 1000 | 584 per 1000 | OR 1.99 | 285 | ⊕⊝⊝⊝ |
| Progression to fulminant HBV infection | None of the trials reported this information. | ||||
| Serious adverse events (6 to 12 months) | There were no serious adverse events in either group. | 250 (2 trials) | ⊕⊝⊝⊝ | ||
| Adverse events (proportion) (12 months) | 647 per 1000 | 722 per 1000 | OR 1.42 | 35 | ⊕⊝⊝⊝ |
| Adverse events (number of events) (12 months) | 1235 per 1000 | 2124 per 1000 | Rate ratio 1.72 | 35 | ⊕⊝⊝⊝ |
| Health‐related quality of life (1 week) | None of the trials reported this information. | ||||
| *The basis for the assumed risk is the mean control group risk in the control group across studies. The corresponding risk (and its 95% confidence interval) is based on the assumed risk in the comparison group and the relative effect of the intervention (and its 95% CI). CI: confidence interval; HBV: hepatitis B virus; OR: odds ratio. | |||||
| GRADE Working Group grades of evidence | |||||
| 1 The risk of bias in the trial(s) was high (downgraded by 1 level for risk of bias). | |||||
| Interferon versus no intervention for acute hepatitis B virus infection | |||||
| Patient or population: people with acute HBV infection Settings: secondary or tertiary care Intervention: interferon Control: no intervention | |||||
| Outcomes | Illustrative comparative risks* (95% CI) | Relative effect | No of participants | Quality of the evidence | |
| Assumed risk | Corresponding risk | ||||
| No intervention | Interferon | ||||
| Short‐term mortality | None of the trials reported this information. | ||||
| Progression to chronic HBV infection | None of the trials reported this information. | ||||
| Progression to fulminant HBV infection | None of the trials reported this information. | ||||
| Serious adverse events | There were no serious adverse events in either group. | 100 (1 trial) | ⊕⊝⊝⊝ | ||
| Adverse events (proportion) (4 to 6 months) | 273 per 1000 | 992 per 1000 | OR 348.16 | 200 | ⊕⊕⊝⊝ |
| Adverse events (number of events) | None of the trials reported this information. | ||||
| Health‐related quality of life (1 week) | The scale used to report the health‐related quality of life was not stated. Neither was information on whether higher score meant better or worse available. The mean score in the placebo group was 42.7 units. The mean score in the interferon group was 5.4 units higher. There was no information to calculate the 95% confidence intervals or P value. | 100 | ⊕⊝⊝⊝ | ||
| *The basis for the assumed risk is the mean control group risk in the control group across studies. The corresponding risk (and its 95% confidence interval) is based on the assumed risk in the comparison group and the relative effect of the intervention (and its 95% CI). CI: confidence interval; HBV: hepatitis B virus; OR: odds ratio. | |||||
| GRADE Working Group grades of evidence | |||||
| 1 The risk of bias in the trial(s) was high (downgraded by 1 level for risk of bias). | |||||
| Study name | Intervention | Control | Follow‐up period (months) | Sequence generation | Allocation concealment | Blinding of participants and healthcare providers | Blinding of outcome assessors | Incomplete outcome data | Selective outcome reporting | Source of funding | Other bias | Overall risk of bias |
| Hepatitis B Immunoglobulin | Placebo | Not stated | Low | Low | Unclear | Unclear | Unclear | High | Low | Low | High | |
| Interferon | Placebo | Min 5 | Unclear | Unclear | Unclear | Unclear | Unclear | High | High | Low | High | |
| Interferon | Placebo | Min 5 | Unclear | Unclear | Low | Low | Low | High | High | Low | High | |
| Lamivudine | No intervention | Min 3 | Unclear | Unclear | Unclear | Unclear | Unclear | High | Unclear | Low | High | |
| Lamivudine | Placebo | Min 12 | Low | Unclear | Low | Low | Low | Low | Unclear | Low | Unclear | |
| Lamivudine | Placebo | Not stated | Unclear | Unclear | Unclear | Unclear | High | High | Low | Low | High | |
| Lamivudine | Control 1: entecavir | Min 11 | Low | Unclear | High | High | Low | High | Low | Low | High | |
| Min: minimum. | ||||||||||||
| Outcome or subgroup title | No. of studies | No. of participants | Statistical method | Effect size |
| 1 Mortality Show forest plot | 3 | Odds Ratio (M‐H, Fixed, 95% CI) | Totals not selected | |
| 1.1 Hepatitis B immunoglobulin (HBIG) versus placebo | 1 | Odds Ratio (M‐H, Fixed, 95% CI) | 0.0 [0.0, 0.0] | |
| 1.2 Lamivudine versus placebo or no intervention | 2 | Odds Ratio (M‐H, Fixed, 95% CI) | 0.0 [0.0, 0.0] | |
| 1.3 Lamivudine versus entecavir | 1 | Odds Ratio (M‐H, Fixed, 95% CI) | 0.0 [0.0, 0.0] | |
| 1.4 Entecavir versus no intervention | 1 | Odds Ratio (M‐H, Fixed, 95% CI) | 0.0 [0.0, 0.0] | |
| 2 Chronic hepatitis B virus infection Show forest plot | 3 | Odds Ratio (M‐H, Fixed, 95% CI) | Subtotals only | |
| 2.1 Lamivudine versus placebo or no intervention | 3 | 285 | Odds Ratio (M‐H, Fixed, 95% CI) | 1.99 [1.05, 3.77] |
| 2.2 Lamivudine versus entecavir | 1 | 90 | Odds Ratio (M‐H, Fixed, 95% CI) | 3.64 [1.31, 10.13] |
| 2.3 Entecavir versus no intervention | 1 | 131 | Odds Ratio (M‐H, Fixed, 95% CI) | 0.58 [0.23, 1.49] |
| 3 Serious adverse events Show forest plot | Other data | No numeric data | ||
| 3.1 Interferon versus placebo | Other data | No numeric data | ||
| 3.2 Lamivudine versus placebo or no intervention | Other data | No numeric data | ||
| 3.3 Lamivudine versus entecavir | Other data | No numeric data | ||
| 3.4 Entecavir versus no intervention | Other data | No numeric data | ||
| 4 Adverse events proportion Show forest plot | 3 | Odds Ratio (M‐H, Fixed, 95% CI) | Subtotals only | |
| 4.1 Interferon versus placebo | 2 | 200 | Odds Ratio (M‐H, Fixed, 95% CI) | 348.16 [45.39, 2670.26] |
| 4.2 Lamivudine versus placebo or no intervention | 1 | 35 | Odds Ratio (M‐H, Fixed, 95% CI) | 1.42 [0.34, 5.94] |
| 5 Adverse events number Show forest plot | 1 | Rate Ratio (Fixed, 95% CI) | Totals not selected | |
| 5.1 Lamivudine versus placebo or no intervention | 1 | Rate Ratio (Fixed, 95% CI) | 0.0 [0.0, 0.0] | |
| 6 Health‐related quality of life Show forest plot | Other data | No numeric data | ||
| 6.1 Interferon versus placebo | Other data | No numeric data | ||
| 7 Seroconversion Show forest plot | 5 | Odds Ratio (M‐H, Fixed, 95% CI) | Totals not selected | |
| 7.1 Interferon versus placebo | 1 | Odds Ratio (M‐H, Fixed, 95% CI) | 0.0 [0.0, 0.0] | |
| 7.2 Lamivudine versus placebo or no intervention | 4 | Odds Ratio (M‐H, Fixed, 95% CI) | 0.0 [0.0, 0.0] | |
| 7.3 Lamivudine versus entecavir | 1 | Odds Ratio (M‐H, Fixed, 95% CI) | 0.0 [0.0, 0.0] | |
| 7.4 Entecavir versus no intervention | 1 | Odds Ratio (M‐H, Fixed, 95% CI) | 0.0 [0.0, 0.0] | |
| 8 Time to seroconversion Show forest plot | 1 | Mean Difference (IV, Fixed, 95% CI) | Totals not selected | |
| 8.1 Interferon versus placebo | 1 | Mean Difference (IV, Fixed, 95% CI) | 0.0 [0.0, 0.0] | |
| 9 Time to seroconversion [weeks] Show forest plot | Other data | No numeric data | ||
| 9.1 Lamivudine versus placebo or no intervention | Other data | No numeric data | ||