Celecoxib for osteoarthritis
Abstract
Background
Osteoarthritis (OA) is the most common form of arthritis and is caused by degeneration of the joint cartilage and growth of new bone, cartilage and connective tissue. It is often associated with major disability and impaired quality of life. There is currently no consensus on the best treatment to improve OA symptoms. Celecoxib is a selective non‐steroidal anti‐inflammatory drug (NSAID).
Objectives
To assess the clinical benefits (pain, function, quality of life) and safety (withdrawals due to adverse effects, serious adverse effects, overall discontinuation rates) of celecoxib in osteoarthritis (OA).
Search methods
We searched the Cochrane Central Register of Controlled Trials (CENTRAL), MEDLINE, Embase and clinical trials registers up to April 11, 2017, as well as reference and citation lists of included studies. Pharmaceutical companies and authors of published articles were contacted.
Selection criteria
We included published studies (full reports in a peer reviewed journal) of prospective randomized controlled trials (RCTs) that compared oral celecoxib versus no intervention, placebo or another traditional NSAID (tNSAID) in participants with clinically‐ or radiologically‐confirmed primary OA of the knee or hip, or both knee and hip.
Data collection and analysis
Two authors independently performed data extraction, quality assessment, and compared results. Main analyses for patient‐reported outcomes of pain and physical function were conducted on studies with low risk of bias for sequence generation, allocation concealment and blinding of participants and personnel.
Main results
We included 36 trials that provided data for 17,206 adults: 9402 participants received celecoxib 200 mg/day, and 7804 were assigned to receive either tNSAIDs (N = 1869) or placebo (N = 5935). Celecoxib was compared with placebo (32 trials), naproxen (6 trials) and diclofenac (3 trials). Studies were published between 1999 and 2014. Studies included participants with knee, hip or both knee and hip OA; mean OA duration was 7.9 years. Most studies included predominantly white participants whose mean age was 62 (± 10) years; most participants were women. There were no concerns about risk of bias for performance and detection bias, but selection bias was poorly reported in most trials. Most trials had high attrition bias, and there was evidence of selective reporting in a third of the studies.
Celecoxib versus placebo
Compared with placebo celecoxib slightly reduced pain on a 500‐point Western Ontario and McMaster Universities Arthritis Index (WOMAC) pain scale, accounting for 3% absolute improvement (95% CI 2% to 5% improvement) or 12% relative improvement (95% CI 7% to 18% improvement) (4 studies, 1622 participants). This improvement may not be clinically significant (high quality evidence).
Compared with placebo celecoxib slightly improved physical function on a 1700‐point WOMAC scale, accounting for 4% absolute improvement (95% CI 2% to 6% improvement), 12% relative improvement (95% CI 5% to 19% improvement) (4 studies, 1622 participants). This improvement may not be clinically significant (high quality evidence).
There was no evidence of an important difference for withdrawals due to adverse events (Peto OR 0.99, 95% CI 0.85 to 1.15) (moderate quality evidence due to study limitations).
Results were inconclusive for numbers of participants experiencing any serious AEs (SAEs) (Peto OR 0.95, 95% CI 0.66 to 1.36), gastro‐intestinal events (Peto OR 1.91, 95% CI 0.24 to 14.90) and cardiovascular events (Peto OR 3.40, 95% CI 0.73 to 15.88) (very low quality evidence due to serious imprecision and study limitations). However, regulatory agencies have warned of increased cardiovascular events for celecoxib.
Celecoxib versus tNSAIDs
There were inconclusive results regarding the effect on pain between celecoxib and tNSAIDs on a 100‐point visual analogue scale (VAS), showing 5% absolute improvement (95% CI 11% improvement to 2% worse), 11% relative improvement (95% CI 26% improvement to 4% worse) (2 studies, 1180 participants, moderate quality evidence due to publication bias).
Compared to a tNSAID celecoxib slightly improved physical function on a 100‐point WOMAC scale, showing 6% absolute improvement (95% CI 6% to 11% improvement) and 16% relative improvement (95% CI 2% to 30% improvement). This improvement may not be clinically significant (low quality evidence due to missing data and few participants) (1 study, 264 participants).
Based on low or very low quality evidence (downgraded due to missing data, high risk of bias, few events and wide confidence intervals) results were inconclusive for withdrawals due to AEs (Peto OR 0.97, 95% CI 0.74 to 1.27), number of participants experiencing SAEs (Peto OR 0.92, 95% CI 0.66 to 1.28), gastro‐intestinal events (Peto OR 0.61, 0.15 to 2.43) and cardiovascular events (Peto OR 0.47, 95% CI 0.17 to 1.25).
In comparisons of celecoxib and placebo there were no differences in pooled analyses between our main analysis with low risk of bias and all eligible studies. In comparisons of celecoxib and tNSAIDs, only one outcome showed a difference between studies at low risk of bias and all eligible studies: physical function (6% absolute improvement in low risk of bias, no difference in all eligible studies).
No studies included in the main comparisons measured quality of life. Of 36 studies, 34 reported funding by drug manufacturers and in 34 studies one or more study authors were employees of the sponsor.
Authors' conclusions
We are highly reserved about results due to pharmaceutical industry involvement and limited data. We were unable to obtain data from three studies, which included 15,539 participants, and classified as awaiting assessment. Current evidence indicates that celecoxib is slightly better than placebo and some tNSAIDs in reducing pain and improving physical function. We are uncertain if harms differ among celecoxib and placebo or tNSAIDs due to risk of bias, low quality evidence for many outcomes, and that some study authors and Pfizer declined to provide data from completed studies with large numbers of participants. To fill the evidence gap, we need to access existing data and new, independent clinical trials to investigate benefits and harms of celecoxib versus tNSAIDs for people with osteoarthritis, with longer follow‐up and more direct head‐to‐head comparisons with other tNSAIDs.
PICOs
Plain language summary
Benefits and harms of celecoxib to treat people with osteoarthritis
Review question
We evaluated benefits and harms of celecoxib, a drug used to treat people with osteoarthritis, to improve pain, movement, quality of life and drug safety.
Background
Osteoarthritis is a joint disease (mostly knees and hips) caused when cartilage wears away leading to pain, joint stiffness and inflammation, which can cause limited mobility and reduces quality of life. Celecoxib is marketed as being as effective as traditional anti‐inflammatory drugs (tNSAIDs such as naproxen and diclofenac) but with fewer gut and other problems.
Study characteristics
We searched up to April 2017 and included 36 trials that involved 17,206 adults who received 200 mg celecoxib daily (9402 participants), or either another drug (naproxen ‐ 6 trials, or diclofenac ‐ 3 trials, total of 1869 participants) or a fake treatment (placebo ‐ 32 trials, 5935 participants).
On average, participants were aged 62 years and had osteoarthritis for 7.9 years. Participants had knee, hip, or both, osteoarthritis; most were women and white.
Study funding sources
Most studies (34/36) were funded by the studied drugs manufacturers, and (34/36) included authors who worked for drug companies.
Key results
Celecoxib, compared with placebo, slightly reduced pain, improved physical function, and probably did not increase numbers of people who withdrew from trials because of problems with the treatment. However, these results were unlikely to be clinically significant. Very low quality evidence meant that we are uncertain if celecoxib caused harms, such as gut or heart problems when compared with placebo. However, drug regulatory agencies have warned of increased risk of heart problems with celecoxib.
Celecoxib and tNSAIDs reduced pain by the same amount; celecoxib slightly improved physical function compared with tNSAIDs. Evidence comparing celecoxib and tNSAIDs was low to very low quality, so it is uncertain if harms (such as heart or gut problems) occurred from taking these drugs.
None of the high‐quality studies assessed quality of life.
Quality of evidence
Evidence quality was poor and results should be interpreted cautiously. Because it is known that sponsorship by the manufacturing drug company may lead to more favorable results and conclusions than sponsorship from other sources, we are highly reserved about results due to significant drug industry involvement and few data.
We were unable to obtain data from three trials which included 15,539 participants (awaiting assessment); Pfizer declined to provide data for two reports that involved 14,042 participants.
We need access to all trials results to better understand the benefits and harms of celecoxib and other treatments. New trials researching benefits and harms of celecoxib versus tNSAIDs for people with osteoarthritis, that have longer follow‐up periods, more direct comparisons with other tNSAIDs, and funded by non‐commercial sources, are needed.
Authors' conclusions
Summary of findings
| Patient or population: osteoarthritis | ||||||
| Outcomes | Anticipated absolute effects* (95% CI) | Relative effect | № of participants | Quality of the evidence | Comments | |
| Risk with placebo | Risk with celecoxib | |||||
| Pain | The mean pain was 136 | The mean pain in the intervention group was 16 lower (9 lower to 24 lower) 1 | ‐ | 1622 | ⊕⊕⊕⊕ | 3% absolute improvement (95% CI 2% to 5%)1, 12% relative improvement (95% CI 7% to 18% improvement), SMD ‐0.22 (‐0.32 to ‐0.12), NNTB 11 (7 to 18) 2 |
| Physical function | The mean physical function was 540 | The mean physical function in the intervention group was 64 lower (26 lower to 101 lower) 3 | ‐ | 1622 | ⊕⊕⊕⊕ | 4% absolute improvement (95% CI 2% to 6% improvement)3, 12% relative improvement (95% CI 5% to 19% improvement), SMD ‐0.17 (‐0.27 to ‐0.07), NNTB 14 (9 to 34) 2 |
| Quality of life | not estimable | see comment | ‐ | (0 RCTs) | No included studies measured this outcome | |
| Number withdrawn due to adverse events | 57 per 1000 | 55 per 1000 | Peto OR 0.99 | 10996 | ⊕⊕⊕⊝ | 0% absolute change (95% CI 1% less to 1% more), 1% relative change (95% CI 15% less to 15% more) (NNTH = NA) |
| Number experiencing any serious adverse events | 10 per 1000 | 10 per 1000 | Peto OR 0.95 | 10926 | ⊕⊝⊝⊝ | 0% absolute change (95% CI 0% to 0%), 5% relative change (95% CI 34% less to 36% more) (NNTH = NA) |
| Number experiencing gastro‐intestinal events (perforation, ulcer, bleeds) | 1 per 1000 | 1 per 1000 | Peto OR 1.91 | 3263 | ⊕⊝⊝⊝ | 0% absolute change (95% CI 0% less to 1% more), 91% relative change (95% CI 76% less to 1390% more) (NNTH = NA) |
| Number experiencing cardiovascular events (myocardial infarction, stroke) | 1 per 1000 | 7 per 1000 | Peto OR 3.40 | 2112 | ⊕⊝⊝⊝ | 0% absolute change (95% CI 0% less to 1% more), 240% relative change (95% CI 27% less to 1488% more) (NNTH = NA) |
| *The risk in the intervention group (and its 95% confidence interval) is based on the assumed risk in the comparison group and the relative effect of the intervention (and its 95% CI). | ||||||
| GRADE Working Group grades of evidence | ||||||
| ¹ Calculations based on control group SD for pain of 74.2 (from Clegg 2006); to obtain absolute change, the following formula was used: SMD x SD/500 ² Number needed to treat for an additional beneficial outcome (NNTB) for continuous outcomes calculated using the Wells calculator (from the CMSG Editorial office http://musculoskeletal.cochrane.org/) ³ Calculations based on control group SD for pain of 374.1 (from Clegg 2006); to obtain absolute change, the following formula was used: SMD x SD/500 ⁴ Downgraded one level due to study limitations (all trials had high or unclear risk of at least one type of bias (harms outcomes included all eligible studies)) ⁵ Downgraded two levels for serious imprecision (few events and wide confidence intervals) ⁶ Report Peto OR which can be interpreted as an RR due to the low event rate | ||||||
| Patient or population: osteoarthritis | ||||||
| Outcomes | Anticipated absolute effects* (95% CI) | Relative effect | № of participants | Quality of the evidence | Comments | |
| Risk with tNSAIDs | Risk with celecoxib | |||||
| Pain | The mean pain was 41 points | The mean pain in the intervention group was 4.52 points lower (10.65 lower to 1.61 higher) | ‐ | 1180 | ⊕⊕⊕⊝ | 5% absolute improvement (95% CI 11% improvement to 2% worse), 11% relative improvement (95% CI 26% improvement to 4% worse), MD ‐4.52 (‐10.65 to 1.61) |
| Physical function | The mean physical function was 37 points | The mean physical function in the intervention group was 6 points lower (0.6 lower to 11 lower) | ‐ | 264 | ⊕⊕⊕⊝ | 6% absolute improvement (95% CI 6% to 11% improvement), 16% relative improvement (95% CI 2% to 30% improvement), MD: ‐6 (‐11.4 to ‐0.6), NNTB 9 (5 to 121) 2 |
| Quality of life | not estimable | see comment | ‐ | (0 study) | no included studies measured this outcome | |
| Number withdrawn due to adverse events | 74 per 1000 | 72 per 1000 | Peto OR 0.97 | 3150 | ⊕⊕⊝⊝ | 0% absolute change (95% CI 3% less to 2% more), 3% relative change (95% CI 26% less to 27% more) (NNTH = NA) |
| Number experiencing any serious adverse events | 68 per 1000 | 63 per 1000 | Peto OR 0.92 | 2404 | ⊕⊝⊝⊝ | 0% absolute change (95% CI 2% less to 1% more), 8% relative change (95% CI 34% less to 28% more) (NNTH = NA) |
| Number experiencing gastro‐intestinal events (perforation, ulcer, bleeds) | 6 per 1000 | 4 per 1000 | Peto OR 0.61 | 1755 | ⊕⊝⊝⊝ | 0% absolute change (95% CI 1% less to 0% more), 39% relative change (95% CI 85% less to 143% more) (NNTH = NA) |
| Number experiencing cardiovascular events (myocardial infarction, stroke) follow up: 52 weeks | 24 per 1000 | 11 per 1000 | Peto OR 0.47 | 916 | ⊕⊝⊝⊝ | 1% absolute change (95% CI 3% less to 0% more), 53% relative change (95% CI 83% less to 25% more) (NNTH = NA) |
| *The risk in the intervention group (and its 95% confidence interval) is based on the assumed risk in the comparison group and the relative effect of the intervention (and its 95% CI). | ||||||
| GRADE Working Group grades of evidence | ||||||
| ¹ Downgraded one level due to publication bias (missing data from large studies) ² Number needed to treat for an additional beneficial outcome (NNTB) for continuous outcomes calculated using the Wells calculator (from the CMSG editorial office) ³ Downgraded one level for study limitations (all trials had high or unclear risk of at least one type of bias (harms outcomes included all eligible studies)) and one level due to imprecision ⁴ Downgraded two levels for serious imprecision (few events and wide confidence intervals) ⁵ Report Peto OR which can be interpreted as an RR due to the low event rate | ||||||
Background
Description of the condition
Osteoarthritis (OA) is the most common form of arthritis and is caused by degeneration of the joint cartilage and growth of new bone, cartilage and connective tissue. It is often associated with major disability and impaired quality of life, particularly when the knee and hip bones are affected. The onset of OA is age‐related and occurs usually between the ages of 50 years and 60 years (Garner 2008).
In 2014 a report from the Global Burden of Disease 2010 study indicated that of the 291 conditions listed, hip and knee OA was ranked globally as the 11th highest contributor to global disability and 38th highest in disability‐adjusted life year (DALYs) (Cross 2014). The global age‐standardized prevalence of knee OA was 3.8% and hip OA was 0.85%, with no discernible change between 1990 and 2010. Prevalence was higher in women than men and increases with age. The conclusion of the report is that hip and knee OA is one of the leading causes of global disability. It was also emphasized that the real burden of OA may have been underestimated because of methodological limitations. Considering the aging and increasing obesity of the global population, health professionals need to prepare for increased demand for health services to treat hip and knee OA (Cross 2014). The impact of OA on pain, disability, and quality of life results in considerable burdens to individuals, health services and society (Deeks 2002).
Description of the intervention
Non‐steroidal anti‐inflammatory drugs (NSAIDs) are among the most widely prescribed drugs worldwide in the treatment of rheumatic disorders and other degenerative inflammatory joint diseases (Warner 1999). NSAIDs are used for the treatment of OA because they provide effective relief from symptoms (Deeks 2002). Most clinical guidelines for OA recommend the use of NSAIDs after the failure of acetaminophen as first‐line treatment of mild‐to‐moderate symptoms of OA and as initial treatment for severe symptoms. However, NSAIDs cause numerous side effects, particularly cardiovascular and gastro‐intestinal toxicity. A nationwide cohort study conducted in Denmark showed that NSAIDs were significantly associated with increased relative risks of cardiovascular events and death, even in the low‐risk population, which is a major public health concern because of the widespread use of such drugs (Fosbøl 2009). Cardiovascular risks of NSAIDs are well established although uncertainty remains about differences among individual NSAIDs (Kearney 2006; Trelle 2011). The gastro‐intestinal toxicity of NSAIDs can be broadly categorized into three groups: (i) symptoms such as dyspepsia, heartburn, nausea, vomiting and abdominal pain; (ii) mucosal lesions seen on endoscopy; and (iii) serious gastro‐intestinal complications, such as perforated ulcers or bleeding requiring hospitalization (Singh 1998).
The analgesic effect of NSAIDs is explained by inhibition of cyclooxygenase (COX) enzyme, which has two isoforms (COX‐1 and COX‐2). While COX‐1 is a constitutive member of normal cells, COX‐2 has a role in mediation of pain, inflammation and fever (Conaghan 2012). Selective COX‐2 inhibitors (coxibs) were developed to avoid gastro‐intestinal toxicity associated with traditional NSAIDs (tNSAIDs) (Conaghan 2012).
The COX‐2 selective inhibitors are marketed as drugs that are as effective as traditional non‐selective NSAIDs (tNSAIDs) but with a safer gastro‐intestinal profile (Micklewright 2003). As a result of concerns over the long‐term use of a coxib drug, rofecoxib, and increased risk of serious cardiovascular events, the manufacturer voluntarily withdrew rofecoxib from the market in September 2004 (Sibbald 2004). Subsequently, the USA Food and Drug Administration's (FDA) Arthritis and Drug Safety and Risk Management Advisory Committees reviewed all available data on selective cyclooxygenase (COX)‐2 inhibitors. This led to a request by the FDA to the manufacturer for the voluntary withdrawal of valdecoxib from the market in April 2005 and re‐labelling of celecoxib to include a more specific warning of the risks of serious cardiovascular adverse events associated with its use (Chou 2006).
How the intervention might work
NSAIDs primarily act on the COX enzyme that converts arachidonic acid into prostaglandins, which mediate inflammation and pain among other functions (Garner 2002). The constitutive COX‐1 is present in, for example in the endothelium, stomach and kidney, whereas COX‐2 is induced by pro‐inflammatory cytokines and endotoxin in cells in vitro and at inflammatory sites in vivo (Vane 1998). Studies that use in vitro methods show inhibitory activity of putative anti‐inflammatory drugs on either COX‐1 or COX‐2 (Warner 1999). On the basis of these laboratory tests, many of the original NSAIDs were found to have inhibitory activity against both isoforms, they were dual inhibitors of COX‐1 and COX‐2. The more selective COX‐2 inhibitors had fewer gastro‐intestinal side effects, and thus, it was predicted that a new generation of anti‐inflammatory drugs, selective COX‐2 inhibitors, would be free of gastro‐intestinal side effects (Willoughby 2000). This group of NSAIDs known as the coxibs includes celecoxib, etoricoxib, lumiracoxib, parecoxib, rofecoxib and valdecoxib (Garner 2008). Celecoxib is the only coxib still on the market in most countries, where is represents a substantial market share. The recommended dose of celecoxib for OA is 200 mg daily, given as a single dose or 100 mg twice a day.
Why it is important to do this review
Clinical studies, rather than the laboratory assay studies, are the best way to determine whether participants actually benefit from using more selective NSAIDs (Chou 2006). This review examined the clinical benefit and harms of celecoxib for people with OA.
Objectives
To assess the clinical benefits (pain, function, quality of life) and harms (withdrawals due to adverse effects, serious adverse effects, overall discontinuation rates) of celecoxib in osteoarthritis (OA).
Methods
Criteria for considering studies for this review
Types of studies
Published (full reports in a peer reviewed journal) prospective randomized controlled trials (RCTs) were included. Studies published in any language were considered. Studies were excluded if they had fewer than 50 participants in each arm (Nüesch 2010) or involved treatment of less than four weeks' duration.
Types of participants
At least 75% of participants with clinically‐ or radiologically‐confirmed primary osteoarthritis (OA) of the knee or hip or both hip and knee OA, of any age and either sex. The diagnosis of OA was based on valid clinical and radiographic findings in accordance with the American College of Rheumatology (ACR) criteria. Trials including only participants with inflammatory arthritis, such as rheumatoid arthritis, were not considered.
Types of interventions
Oral celecoxib 200 mg daily (either as 200 mg once daily or 100 mg twice daily) versus no intervention, placebo or another marketed tNSAID. Dosage of 200 mg daily was used because it is the recommended dosage.
Types of outcome measures
Studies were included if any accepted method to assess outcomes of benefit was used because there is already an extensive body of literature available on adverse events and celecoxib.
For benefit, the major outcomes were: (1) pain, (2) function and (3) quality of life, as currently recommended for OA trials (Altman 1996; Pham 2004). For harms, the major outcomes were the number of participants: (4) who withdrew because of adverse events; (5) experiencing any serious adverse events; (6) presenting clinically with perforations, ulcer or bleed; and (7) experiencing cardiovascular outcomes. The timing was the end of the RCT unless specified otherwise.
Benefit
Pain
If data on more than one pain scale were provided for a trial, data were extracted on the pain scale that was highest on the following list, according to a previously described hierarchy of pain‐related outcomes (Jüni 2006; Reichenbach 2010).
-
Global pain.
-
Pain on walking.
-
The Western Ontario and McMaster Universities osteoarthritis index (WOMAC) osteoarthritis index pain sub score.
-
Composite pain scores other than WOMAC.
-
Pain on activities other than walking.
-
Rest pain or pain during the night.
-
WOMAC global algofunctional score.
-
Lequesne osteoarthritis index global score.
-
Other algofunctional scale.
Physical function
If data on more than one physical function scale were provided for a trial, data were extracted according to hierarchy presented below:
-
Global disability score.
-
Walking disability.
-
WOMAC disability sub score.
-
Composite disability scores other than WOMAC.
-
Disability other than walking.
-
WOMAC global scale.
-
Lequesne osteoarthritis index global score.
-
Other algofunctional scale.
Quality of life
Quality of life data were extracted from the following instruments, if available: Short Form‐12 (SF‐12) and 36 (SF‐36), EuroQoL, Sickness Impact Profile (SIP) or Nottingham Health Profile (NHP).
At least 50% reduction in pain score
Number of responders with at least 50% reduction in pain scores was recorded.
Harms
-
Withdrawals due to adverse events.
-
Serious adverse effects were extracted from trials, defined as events resulting in inpatient hospitalization, prolongation of hospitalization, persistent or significant disability, congenital abnormality or birth defect of offspring, life‐threatening events or death.
-
Gastro‐intestinal events, number of participants presenting clinically with perforations, ulcer or bleeds.
-
Cardiovascular events, number of participants with cardiovascular events.
Search methods for identification of studies
Electronic searches
The following electronic databases were searched:
-
Cochrane Central Register of Controlled Clinical Trials (CENTRAL) via Ovid (The Cochrane Library, current issue) (Appendix 1);
-
MEDLINE via Ovid (1948 to present) (Appendix 2); and
-
Embase via Ovid (1980 to present) (Appendix 3).
The MEDLINE search strategy combined the subject search with the Cochrane highly sensitive search strategy for identifying reports of RCTs (as published in Box 6.4.c in the Cochrane Handbook for Systematic Reviews of Interventions Version 5.1.0, updated March 2011) and was modified for other databases (Higgins 2011). Searches were performed up to April 11, 2017.
For assessments on adverse effects, we searched the websites of the regulatory agencies: USA Food and Drug Administration‐Medwatch, European Medicines Evaluation Agency, Australian Adverse Drug Reactions Bulletin, and UK Medicines and Healthcare Products Regulatory Agency (MHRA) pharmacovigilance and drug safety updates.
Searching other resources
References of all included studies, other reviews, guidelines and related articles were searched, using both forward (through citation databases such as Web of Science) and backward (examining reference lists) citation searching up to April 11, 2017.
Ongoing studies were searched in the trial registry ClinicalTrials.gov and World Health Organization International Clinical Trials Registry Platform (WHO ICTRP).
Data collection and analysis
Selection of studies
The selection of papers and decisions about eligibility was carried out independently by at least two review authors. Full‐text copies of all possibly or definitely relevant studies were obtained for further assessment. All disagreements were resolved by discussion and consensus. A statistician was consulted in cases of doubt about inclusion or data extraction, as well as with regard to data analysis.
Study authors were contacted for clarifications and to obtain additional data to perform a systematic review whenever necessary. Studies considered for inclusion were translated into English when necessary.
Data extraction and management
Predefined data extraction forms were pilot tested and used to collate data. Relevant data from selected studies were independently extracted according to inclusion criteria by two review authors. Review authors independently determined study eligibility and discrepancies were resolved by discussion. Standard tables for characteristics of included studies and risk of bias were constructed to minimize errors. Possible doubts and disagreements were discussed and if unresolved, study authors were contacted for clarification. Abstracts were considered together with the full publication. The review authors were not blinded to the study authors, interventions or results obtained in the included studies. For each study, the following information was extracted: participant and study characteristics, intervention and outcomes data. The raw data (means and standard deviations for continuous outcomes and numbers of events and participants for dichotomous outcomes) were extracted for outcomes of interest. Where least squares means (LSM) were available, we assumed this for the mean to enter into RevMan.
In nine studies only LSM were available for the continuous outcomes of interest (Asmus 2014 Study 1; Asmus 2014 Study 2; Birbara 2006 Study 1; Birbara 2006 Study 2; DeLemos 2011; Essex 2012a: Hochberg 2011 Study 307; Hochberg 2011 Study 309; McKenna 2001a). Five studies provided explanations for adjustments made for calculating LSM; four studies (Asmus 2014 Study 1; Asmus 2014 Study 2; DeLemos 2011; Essex 2012a) did not provide explanations for adjustments. Two studies made adjustments for treatment group factors: previous OA treatment strata and baseline WOMAC score at randomization (Birbara 2006 Study 1; Birbara 2006 Study 2). Two studies used baseline values as covariates to estimate LSM changes from baseline for each treatment group (Hochberg 2011 Study 307; Hochberg 2011 Study 309). One study used baseline score, investigational site and treatment as factors for adjustment (McKenna 2001a).
Since most continuous outcomes for pain and physical function were reported as changes from baseline, for the remainder of the studies, change from baseline was calculated using baseline and final data using procedures recommended in the Cochrane Handbook for Systematic Reviews of Interventions (Higgins 2011). Two studies (Williams 2000; Williams 2001) had three arms, comparing continuous and intermittent celecoxib 200 mg per day therapy with placebo. We combined data for the celecoxib groups using procedures recommended in the Cochrane Handbook for Systematic Reviews of Interventions (Higgins 2011).
Two review authors extracted trial information independently using a standardized, piloted extraction form accompanied by a codebook. Disagreements were resolved by discussion. The following date were extracted: both generic and trade names of the experimental intervention, the type of control used, dosage, frequency, route of administration, duration of treatment, participant characteristics (gender, average age and duration of symptoms, types of joints affected), types of measures used for the outcomes, trial design, trial size, duration of follow‐up, type and source of financial support, and publication status. Whenever possible, results from intention‐to‐treat analyses were used. When necessary, means and measures of dispersion were extracted from figures in the reports using open‐access Plot Digitizer software (Jelicic Kadic 2016; Vucic 2015).
Requests for data
Incomplete reporting of study methods and results may impact negatively on systematic review quality, introduce bias and overestimate treatment effects (Mullan 2009). Therefore, study authors were contacted to reduce risk of bias and improve the strength of the inferences (Mullan 2009). For the purpose of this review, corresponding authors of 24 studies were contacted by email, at least twice if the first email did not elicit response. Contact authors of eight studies responded (33% response rate), but only one (Essex 2012a) provided requested information (5% success rate in obtaining necessary information from authors). All requests were made to obtain missing information or clarify imprecise reporting. Corresponding authors of 16 studies did not respond to requests for additional information or clarification (Asmus 2014 Study 1; Asmus 2014 Study 2; Birbara 2006 Study 1; Birbara 2006 Study 2; Clegg 2006; Emery 2008; Hochberg 2011 Study 307; Hochberg 2011 Study 309; Kivitz 2001; Leeb 2004; Lehmann 2005; Ozgocmen 2005; Pincus 2004 PACES‐a; Pincus 2004 PACES‐b; Smugar 2006 Study 1; Smugar 2006 Study 2).
Authors of four studies responded immediately, or after a reminder, indicating that they would look into providing the requested data (Boswell 2008 Study A; Boswell 2008 Study B, funded by GlaxoSmithKline) or that they needed to contact the study sponsor (Bingham 2007 Study 1; Bingham 2007 Study 2, funded by Merck) before responding. However, repeated follow‐up queries did not result in further response. One study author responded that he did not have requested data (Fleischmann 2005, funded by Novartis Pharma AG); a second email about where data might be obtained elicited the response "don't know". The corresponding author of a study that reported previously unpublished data responded to our query that: "A formal protocol outlining your research approach will be necessary for our group to participate". After sharing the published protocol of the review, no further response was received (Iyengar 2013, funded by Pfizer). Extensive email exchanges took place with Pfizer employees regarding data from two studies that did not report outcomes separately for all randomized groups (Lisse 2001; Singh 2006). Both requests were denied by Pfizer, first for data relating to Singh 2006 (communication presented in detail in Table 1) and then for Lisse 2001 after waiting two years for response.
| March 8, 2013: L Puljak (review author) contacted Prof Gurkirpal Singh to request missing data, because data were not shown as randomized |
| March 8, 2013: Prof Singh responds that the study protocol prespecified data analysis |
| March 8, 2013: L Puljak asked Prof Singh if raw data can be obtained |
| March 8, 2013: Prof Singh responds that data are owned by Pfizer and copies the message to 2 Pfizer employees, Manuela Berger and Gail Cawkwell |
| March 12, 2013: L Puljak writes to Manuela Berger and Gail Cawkwell, repeating the request |
| March 13, 2013: Gail Cawkwell responds, thanks for the interest, directs communication to Dr Peter Park, medical lead for Celebrex, who will “follow up [...] as soon as he returns from a business trip” |
| March 25, 2013: Since there was no response, L Puljak emailed Peter Park |
| March 25, 2013: Automatic reply received, indicating Peter Park is away until March 24 |
| March 25, 2013: Peter Park responds, asks L Puljak to file for "independent data grant application” – Investigator Initiated Research (IIR) request |
| March 29, 2013: L Puljak filed the IIR request in order to obtain summary data (means and standard deviations) for each randomized group separately |
| Shortly afterwards, a gentleman from Croatian Pfizer (Dr Lado Uglesic) called L Puljak on the office phone to ask about the identity of authors, purpose of doing this |
| April 30, 2013: Peter Park responds that a committee will meet in May to decide about the request |
| May 8, 2013: Lado Uglesic from Croatian Pfizer emails L Puljak confirmation of the IIR |
| May 8, 2013: Lado Uglesic asks L Puljak to anonymize her CV submitted with IIR application |
| May 13, 2013: Lado Uglesic confirms that the CV was successfully anonymized |
| October 18, 2013: Lado Uglesic sends email containing the following decision: “Thank you for your submission entitled Celecoxib for osteoarthritis. After careful consideration by the CELEBREX IIR Grant Review Committee, we regret to inform you that we are unable to support it at this time. We receive many promising requests and unfortunately cannot respond favourably to all of them. [...] We appreciate your interest in Pfizer’s IIR program and would be pleased to review another submission from you in the future." |
Assessment of risk of bias in included studies
Two review authors independently assessed risk of bias for included studies using Cochrane's tool for assessing risk of bias (Higgins 2011). The tool addresses seven specific domains: sequence generation, allocation concealment, blinding of participants and personnel, blinding of outcome assessment, incomplete outcome data, selective outcome reporting and 'other sources of bias'. To determine each study's risk of bias of a study, the presence of sufficient information and the likelihood of potential bias was evaluated for each criterion. Each criterion was rated as low risk of bias, high risk of bias or unclear risk of bias (either lack of information or uncertainty about the potential for bias). In a consensus meeting, disagreements among review authors were discussed and resolved.
Attrition above 30% in either arm and imbalance in attrition rates between study arms over 10% was considered as high risk of bias, regardless of the data imputation method. Attrition between 10% and 30% in either arm, and imbalance between groups between 5% and 10% was considered as unclear risk of bias.
Since none of the included studies were assessed at low risk of bias for all seven domains, we considered studies that had low risk of bias for the first three domains ‐ related to sequence generation, allocation concealment and blinding of participants and personnel ‐ as overall low risk of bias.
Measures of treatment effect
Meta‐analysis was performed for benefit outcomes if study data were sufficiently clinically and statistically homogeneous. If not sufficiently homogenous, heterogeneity was explored in stratified analyses.
For dichotomous data, the results of each RCT were expressed as risk ratio (RR) with corresponding 95% confidence interval (95% CI). RRs were considered clinically relevant if less than 0.7 or larger than 1.5, in favor of the intervention or control group, respectively. For dichotomous data with rare events (< 10%) Peto's odds ratio (Peto OR) was used.
For continuous data, results were analyzed as mean differences (MD) between the intervention and comparator group with 95% CIs. There were many different pain and function outcome measures to pool, so to obtain a clinically useful synthesis, standardized mean differences (SMD) were calculated. The SMD expresses the size of the intervention effect in each study relative to the variability observed in that study. SMDs were calculated by dividing the MD by the standard deviation of outcome among participants. A 95% CI was computed for the SMD. The SMD was interpreted as described by Cohen 1988, that is, SMD of 0.2 is considered to indicate a small beneficial effect, 0.5 a medium effect, and 0.8 a large effect of celecoxib.
Unit of analysis issues
For cross‐over trials (Pincus 2004 PACES‐a; Pincus 2004 PACES‐b), data were extracted from the first period only. If the meta‐analyses resulted in statistically significant overall estimates, these results were transformed (pooled estimate of RR, MD or SMD) back into measures which are clinically useful in daily practice, such as the number needed to treat (NNT) and the absolute or relative improvement on the original units, to express the final results of the review. The results were back translated by multiplying SMD by the standard deviation from a representative study (Akl 2011).
Dealing with missing data
For missing summary data, standard deviations were imputed from other statistics such as standard errors, CIs or P values, according to methods recommended in the Cochrane Handbook for Systematic Reviews of Interventions (Higgins 2011).
In two studies (Kivitz 2001; McKenna 2001a) there were no available relevant statistics for calculating standard deviations for change from baseline of global pain visual analog scale (VAS) outcome. We followed recommendations from the Cochrane Handbook for Systematic Reviews of Interventions (Higgins 2011, chapter 16.1.3.2. Imputing standard deviations for changes from baseline), and included standard deviations from two similar studies (Bensen 1999; McKenna 2001b). In one study there were no relevant statistics for calculating standard deviation for change from baseline for pain on walking VAS (McKenna 2001a) and standard deviation was included for this outcome from a similar study (Smugar 2006 Study 2). Two studies did not have relevant statistics for calculating standard deviation for WOMAC pain (Boswell 2008 Study A; Boswell 2008 Study B) and standard deviation was imputed from two similar studies, Williams 2001 and Bingham 2007 Study 1, respectively.
Whenever possible, the original investigators were contacted to request missing data.
The possible impact of missing data is presented in the Discussion.
Assessment of heterogeneity
Before meta‐analysis, studies were first assessed for clinical homogeneity with respect to type of therapy, control group and outcomes. For studies judged as clinically homogeneous, statistical heterogeneity was tested by Chi² (Q) and I² statistics (Higgins 2003). A P value of less than 0.10 or an I² value greater than 50% indicates substantial heterogeneity. In cases of substantial heterogeneity, data were explored further, including subgroup analyses, to try to explain the heterogeneity.
Assessment of reporting biases
To determine whether reporting bias was present, the review authors searched for protocols of RCTs that were published before starting recruitment of study participants. Trial protocols were compared with subsequent publication(s) to identify any discrepancies in reported outcomes.
All trials that began enrolment of participants after September 2005 should be registered in a public trials registry at or before the onset of enrolment to be considered for publication in major medical journals that follow International Committee of Medical Journal Editors (ICMJE) recommendations. Therefore, for studies published after 1 July 2005, the Clinical Trial Register at the International Clinical Trials Registry Platform of the World Health Organization was checked. If the protocols were not found, outcomes listed in the methods section of a publication were compared with the reported results. For each study, the review authors evaluated whether selective reporting of outcomes was present. In the case of suspected reporting bias, study authors were contacted for clarification.
A funnel plot was to be constructed to assess the possibility of publication bias for outcomes that were reported in 10 or more studies. A test for funnel plot asymmetry (small study effects) formally examines whether the association between estimated intervention effects and a measure of study size is greater than might be expected to occur by chance.
Data synthesis
The aim was to statistically pool results from individual studies for each intervention to inform an estimate an overall effect. Meta‐analyses were conducted using the random‐effects model. In the case of statistically significant results, the number needed to treat for an additional benefit (NNTB) and number needed to harm (NNTH) were also calculated for the main analyses. Analysis was performed using Review Manager 5 (RevMan 2014) and forest plots were produced for all analyses.
Subgroup analysis and investigation of heterogeneity
The following subgroup analyses were planned: participants’ age (< 65 years versus ≥ 65 years), gender, duration of OA (≤ 2 years versus > 2 years), location of the study joint (knee or hip), previous OA medication (tNSAID, paracetamol), doses of celecoxib and doses of tNSAIDs in comparison groups. However, there were insufficient data in included manuscripts to justify subgroup analyses in this study.
Sensitivity analysis
Primary meta‐analyses were planned to be restricted to studies at low risk of bias. However, because none of the included studies were assessed at low risk of bias for all domains, we considered studies with low risk of bias on the first three domains (randomization, allocation concealment, blinding of participants and personnel) as low risk of bias, and sensitivity analysis was conducted accordingly. We also performed sensitivity analysis for studies with imputed standard deviations. A third set of sensitivity analyses was conducted in an attempt to assess how data from Singh 2006 (a study with 13,274 participants that is waiting assessment) could change the effect estimates.
Summary of findings tables
The main results of the study were presented in a 'Summary of findings' table, which was produced using GRADEpro software (GRADEpro GDT 2014). This table provides key information concerning the quality of the evidence, the magnitude of effect of the interventions examined, and the sum of available data on the main outcomes. The table included an overall grading of the evidence related to each of the main outcomes using the GRADE approach, as indicated in the Cochrane Handbook for Systematic Reviews of Interventions (Higgins 2011).
The important outcomes that were included in the 'Summary of findings' tables are:
-
pain;
-
function;
-
quality of life;
-
number of participants experiencing any serious adverse events;
-
number of participants who withdrew because of adverse events;
-
number of participants presenting clinically with perforations, or perforations, ulcers, bleeds (PUBs), or both; and
-
number of participants experiencing cardiovascular outcomes.
We used the five GRADE (Grades of Recommendation, Assessment, Development and Evaluation) considerations (study limitations, consistency of effect, imprecision, indirectness and publication bias) to assess the quality of a body of evidence for stated outcomes. Outcomes pooled using SMDs were re‐expressed as changes by multiplying by a representative control group baseline SD. We presented the absolute change, the relative change, as well as NNTB and NNTH that were estimated from the OR in the 'Comments' column of the table.
Results
Description of studies
Results of the search
We identified 7627 records from database searches and 2338 additional records from other sources. Following removal of duplicates, we assessed 6237 records, and excluded 6142 based on titles and abstracts (Figure 1). We assessed 93 possibly eligible papers in full text. Of these, 36 studies met the inclusion criteria for this review.

Study flow diagram
The 36 included trials were published in 29 full‐text manuscripts; seven reported two separate randomized controlled trials (RCTs) (Asmus 2014 Study 1; Asmus 2014 Study 2; Bingham 2007 Study 1; Bingham 2007 Study 2; Birbara 2006 Study 1; Birbara 2006 Study 2; Boswell 2008 Study A; Boswell 2008 Study B; Hochberg 2011 Study 307; Hochberg 2011 Study 309; Pincus 2004 PACES‐a; Pincus 2004 PACES‐b; Smugar 2006 Study 1; Smugar 2006 Study 2). Data from one study were published in two separate manuscripts (Bensen 1999; Zhao 1999). All included studies were published in English.
We excluded 52 studies for the reasons given in the Characteristics of excluded studies table; eight studies were classified as Studies awaiting classification; four ongoing studies were identified and described in Characteristics of ongoing studies.
Included studies
We included 36 studies which are described in Characteristics of included studies. Publication dates ranged from 1999 to 2014. All studies were double‐blinded, randomized, parallel‐group trials and included a total of 17,206 adults whose mean age was 62 (± 10) years. There were 9402 participants assigned to treatment with celecoxib 200 mg per day, and 7804 assigned to a comparator group – tNSAIDs (N = 1869) or placebo (N = 5935).
Of the 36 studies, 34 reported receiving funding from pharmaceutical companies that produced study drugs. One study had independent funding (Clegg 2006). One study did not provide information about the source of funding, but according to the author affiliations, three of six authors were employees of Novartis Corporation, and a study drug by Novartis was used in the study (Sheldon 2005). Only two studies (Clegg 2006; Dahlberg 2009) did not include authors who were employed by pharmaceutical companies; all others (34 studies) included one or more (or all) authors who were employed by the sponsor.
Only eight studies reported registration on the ClinicalTrials.gov register (Bingham 2007 Study 1; Bingham 2007 Study 2; Clegg 2006; Conaghan 2013; Hochberg 2011 Study 307; Hochberg 2011 Study 309; Rother 2007; Schnitzer 2011), although 23 studies were published after 2005. Of the eight registered studies, only two deposited results on ClinicalTrials.gov (Hochberg 2011 Study 307; Hochberg 2011 Study 309).
Among the included studies, 32 compared celecoxib 200 mg with placebo (Asmus 2014 Study 1; Asmus 2014 Study 2; Bensen 1999; Bingham 2007 Study 1; Bingham 2007 Study 2; Birbara 2006 Study 1; Birbara 2006 Study 2; Boswell 2008 Study A; Boswell 2008 Study B; Clegg 2006; Conaghan 2013; DeLemos 2011; Essex 2012b; Essex 2014; Fleischmann 2005; Gibofsky 2003; Hochberg 2011 Study 307; Hochberg 2011 Study 309; Kivitz 2001; Lehmann 2005; McKenna 2001a; McKenna 2001b; Pincus 2004 PACES‐a; Pincus 2004 PACES‐b; Rother 2007; Schnitzer 2011; Sheldon 2005; Smugar 2006 Study 1; Smugar 2006 Study 2; Tannenbaum 2004; Williams 2000; Williams 2001).
Six studies compared celecoxib 200 mg with naproxen 1000 mg/day (Bensen 1999; Essex 2012a; Essex 2012b; Essex 2014; Kivitz 2001; Sowers 2005). Three studies compared celecoxib 200 mg with diclofenac 100 mg or 150 mg/day (Dahlberg 2009, Emery 2008, McKenna 2001b).
Nineteen studies were performed in one country: USA (Asmus 2014 Study 1; Asmus 2014 Study 2; Birbara 2006 Study 1; Birbara 2006 Study 2; Clegg 2006; Essex 2012a; Essex 2012b; Essex 2014; Hochberg 2011 Study 307; Hochberg 2011 Study 309; McKenna 2001a; McKenna 2001b; Smugar 2006 Study 1; Smugar 2006 Study 2; Williams 2000; Williams 2001), UK (Emery 2008) and Germany (Rother 2007). Three studies were conducted in two countries, including USA and Canada (Bensen 1999; Gibofsky 2003; Kivitz 2001; Sheldon 2005), USA and Finland (Pincus 2004 PACES‐a; Pincus 2004 PACES‐b), and Sweden and Norway (Dahlberg 2009). Other studies were conducted in more than two countries, including “Europe, North America and internationally” (Boswell 2008 Study A; Boswell 2008 Study B), Czech Republic, Germany, Poland and the UK (Conaghan 2013), Canada, USA, Germany, Italy and UK (DeLemos 2011; Schnitzer 2011), Argentina, Chile, Colombia, Peru, Uruguay, Venezuela, Switzerland, Canada, USA (Fleischmann 2005), Canada, France, Belgium, Germany, UK, Hungary, Denmark, Switzerland, Italy, Spain (Tannenbaum 2004), seven countries including Austria, Canada, Chile, Germany, Spain, United Kingdom (Sowers 2005) and “15 countries” (Lehmann 2005).
Only knee, hip or both knee and hip osteoarthritis (OA) was evaluated in the included studies. None of the studies evaluated OA in other sites such as hands or spine. In three studies only the hip joint was evaluated (Emery 2008; Kivitz 2001; Schnitzer 2011). The knee was evaluated in 24 RCTs (Asmus 2014 Study 1; Asmus 2014 Study 2; Bensen 1999; Birbara 2006 Study 1; Birbara 2006 Study 2; Boswell 2008 Study A; Boswell 2008 Study B; Clegg 2006; Conaghan 2013; Essex 2012a; Essex 2012b; Essex 2014; Fleischmann 2005; Gibofsky 2003; Hochberg 2011 Study 307; Hochberg 2011 Study 309; Lehmann 2005; McKenna 2001a; McKenna 2001b; Rother 2007; Sheldon 2005; Tannenbaum 2004; Williams 2000; Williams 2001). Seven RCTs assessed both knee and hip joints (Dahlberg 2009; DeLemos 2011; Pincus 2004 PACES‐a; Pincus 2004 PACES‐b; Smugar 2006 Study 1; Smugar 2006 Study 2; Sowers 2005).
Participants with primary OA were evaluated in all studies. In most of the included studies, the diagnosis of OA was based on valid clinical and radiographic findings in accordance with the American College of Rheumatology (ACR) criteria. The Kellgren and Lawrence radiographic gradation of OA (Kellgren 1957) was used to evaluate the radiographic diagnosis of OA in five studies (Boswell 2008 Study A; Boswell 2008 Study B; Clegg 2006; Pincus 2004 PACES‐a; Pincus 2004 PACES‐b). One study described clinical OA criteria for inclusion, without mentioning referent criteria (Rother 2007). Mean OA duration was 7.9 years.
Duration of studies ranged from 6 weeks to 12 months.
Birbara 2006 reported two separate randomized studies, but reported combined adverse events for both studies (Birbara 2006 Study 1; Birbara 2006 Study 2). Number of events and participants was therefore proportionally divided between the studies and included as such in our analyses. Bingham 2007 also reported two separate randomized studies, where both studies had two placebo groups, but data for both placebo groups were pooled together and reported as such. Pooled data for both placebo groups were used as such in our analyses (Bingham 2007 Study 1; Bingham 2007 Study 2).
Excluded studies
See Characteristics of excluded studies.
We excluded 53 studies for the following reasons: duration shorter than four weeks (this time frame may be too short to assess harms and benefits of the intervention for osteoarthritis) (Bianchi 2007; Detrembleur 2005; Hawel 2003; Simon 1998; Wittenberg 2006), fewer than 50 participants in each arm (Bianchi 2003; Gallelli 2013; Leeb 2004; NCT02192190; Ozgocmen 2005; Sampalis 2012; Taşcioğlu 2004; Trudeau 2015), reviews summarizing primary studies (Andrews 1999; Angiolillo 2014; Ashcroft 2001; Bensen 2000; Bensen 2000b; Bingham 2008; Bingham 2009; Bingham 2011; Dougados 2007; Johnson 2003; Moore 2009; Sakamoto 2011; Stam 2012; Tive 2015), conference abstracts with irrelevant comparators (Castgillo 2015; Castillo 2014; Chan 2015; Henrotin 2015; Hochberg 2014a; Hochberg 2014b; Pelletier 2016), primary study, but not an RCT (Brereton 2014; Hirayama 2014; Ogunlade 2005; Rozenberg 2008; Tsvetkova 2001; Wolfe 2004), RCT comparing celecoxib with comparators that were irrelevant for this systematic review (Battisti 2004; Essex 2014b; Luyten 2007; Sands 2013; Schnitzer 2015; Stengaard‐Pedersen 2004; Strand 2011; Tran 2004; Yoo 2014a; Yoo 2014b), RCT including participants with post‐traumatic osteoarthritis (Adegbehingbe 2008), RCT with irrelevant dosage of celecoxib and no benefit outcomes of interest for this systematic review (Silverstein 2000) and RCT that included patients with OA and rheumatoid arthritis patients, but patients with OA were not analyzed separately (Nissen 2016).
Studies awaiting classification
See Characteristics of studies awaiting classification.
We identified eight studies that await classification. We contacted the study sponsor (Pfizer Inc.) to request additional data for the largest trial (Singh 2006) and another study (Lisse 2001); however, Pfizer declined to provide further information. We await provision of data after contacting the authors of Iyengar 2013. The published manuscripts of these studies presented data in way that combined outcome data from the same groups in multiple RCTs (Iyengar 2013; Lisse 2001) or the authors presented data from one study, but pooled data for two tNSAID groups and two doses of celecoxib, and presented pain outcome only per country/region, without providing participant numbers (Singh 2006). One registered clinical trial had results posted online, but not in a peer‐reviewed journal (EUCTR2005‐002772‐14‐GB). Information published online was incomplete; our email to Novartis regarding studies on celecoxib did not yield response. One conference abstract appeared eligible, but we were unable to locate the full text (Mastbergen 2010). Two trials were published during preparation of this manuscript and we will include them in the next update (Essex 2016; Gordo 2017), as well as the third trial for which we initially found only conference abstract and its lead investigator informed us in April 2017 that the study was just accepted in the peer‐reviewed journal (Reginster 2016).
Ongoing studies
See Characteristics of ongoing studies.
Four ongoing studies that fit the inclusion criteria were found on ClinicalTrials.gov (NCT01765296; NCT02079727; NCT01768520) and WHO ICTRP (EUCTR2011‐005398‐22‐ES), but no findings were available.
Risk of bias in included studies
All studies had two or more domains that were judged as having unclear or high risk of bias. See the risk of bias graphs (Figure 2; Figure 3).

Risk of bias graph: review authors' judgements about each risk of bias item presented as percentages across all included studies
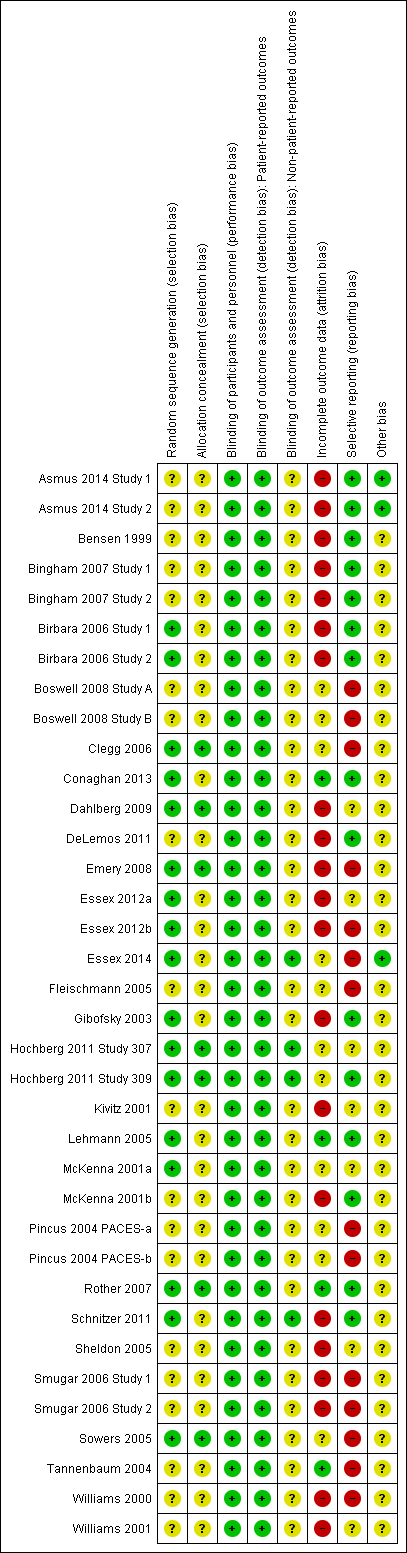
Risk of bias summary: review authors' judgements about each risk of bias item for each included study
Allocation
Random sequence generation was adequately described in 17 studies which were assessed as low risk of bias for this domain (Birbara 2006 Study 1; Birbara 2006 Study 2; Clegg 2006; Conaghan 2013; Dahlberg 2009; Emery 2008; Essex 2012a; Essex 2012b; Essex 2014; Gibofsky 2003; Hochberg 2011 Study 307; Hochberg 2011 Study 309; Lehmann 2005; McKenna 2001a; Rother 2007; Schnitzer 2011; Sowers 2005). Thirteen studies used a computer‐generated number list as their randomization method (Birbara 2006 Study 1; Birbara 2006 Study 2; Emery 2008; Essex 2012a; Essex 2012b; Essex 2014; Gibofsky 2003; Hochberg 2011 Study 307; Hochberg 2011 Study 309; McKenna 2001a; Rother 2007; Schnitzer 2011; Sowers 2005), three studies used block randomization (Clegg 2006; Conaghan 2013; Dahlberg 2009) and one study used "validated automated system" (Lehmann 2005). We classified 19 studies as having unclear risk of bias for this domain because the method of random sequence generation was not described (Asmus 2014 Study 1; Asmus 2014 Study 2; Bensen 1999; Bingham 2007 Study 1; Bingham 2007 Study 2; Boswell 2008 Study A; Boswell 2008 Study B; DeLemos 2011; Fleischmann 2005; Kivitz 2001; McKenna 2001b; Pincus 2004 PACES‐a; Pincus 2004 PACES‐b; Sheldon 2005; Smugar 2006 Study 1; Smugar 2006 Study 2; Tannenbaum 2004; Williams 2000; Williams 2001).
Allocation sequence was not described (unclear risk of bias) in 29 studies. In seven studies participants were allocated to randomized groups centrally (Clegg 2006; Dahlberg 2009; Emery 2008; Hochberg 2011 Study 307; Hochberg 2011 Study 309; Rother 2007; Sowers 2005). No studies were categorized at high risk of bias for selection bias.
Blinding
All studies were assessed at low risk of bias for blinding of participants and personnel, with adequate descriptions for methods. For patient‐reported outcomes (pain, physical function) studies were judged as having low risk of detection bias because participants were blinded. Patients were blinded by using identical pills in all groups.
For non‐patient reported outcomes (all safety outcomes) 32 studies presented no information about blinding of outcome assessors and were therefore assessed at unclear risk of bias. Four studies specifically indicated blind assessment of non‐patient‐reported outcomes (Essex 2014; Hochberg 2011 Study 307; Hochberg 2011 Study 309; Schnitzer 2011). No studies were assessed at high risk of bias for performance bias or detection bias.
Incomplete outcome data
Most studies were assessed at either high or unclear risk of bias for incomplete outcome data because of high attrition rates or imbalances in attrition between study arms. The last observation carried forward (LOCF) method was used in most studies to impute missing values. One study used baseline observation carried forward (BOCF) for participants with missing values (Conaghan 2013), two studies used modified intention‐to‐treat (ITT) analysis (Bingham 2007 Study 1; Bingham 2007 Study 2); five studies did not indicate methods for handling missing values (Essex 2014; McKenna 2001a; McKenna 2001b; Rother 2007; Sowers 2005).
Selective reporting
All outcomes mentioned in trials' methods were reported in most studies. However, 11 studies did not provide all outcomes that were indicated in the trials' methods (Boswell 2008 Study A; Boswell 2008 Study B; Clegg 2006; Essex 2012b; Essex 2014; Fleischmann 2005; Pincus 2004 PACES‐a; Pincus 2004 PACES‐b; Smugar 2006 Study 1; Smugar 2006 Study 2; Sowers 2005). In one study, the protocol was amended such that change of visual analog scale (VAS) at week 6 rather than week 12 became the primary end point (Emery 2008). Most studies reported adverse events only if they occurred in more than a certain percentage of participants.
Other potential sources of bias
Use of co‐interventions was identified as a potential source of bias in most studies. Three studies did not report use of any co‐interventions (Asmus 2014 Study 1; Asmus 2014 Study 2; Essex 2014); 33 studies reported that participants were permitted to take various co‐interventions (some studies indicated allowing more than one co‐intervention). Co‐interventions included acetaminophen, steroids, aspirin, low‐dose aspirin, glucosamine or chondroitin sulphate, antacids, prednisone, anti‐platelet agents, corticosteroids, H2‐receptor antagonists, physiotherapy, propoxyphene, codeine, tramadol, proton pump inhibitors, cryoprotective agents, topical pain relief, estrogen, progesterone, testosterone. Some studies indicated that participants were not permitted to take co‐intervention therapies within 12, 24 or 48 hours before the study visit, mostly for acetaminophen as a rescue medication; there were no limits when participants needed to stop taking co‐intervention treatments before a scheduled study visit for other permitted co‐interventions. Since none of the 33 studies reported amounts of co‐interventions consumed by participants during the study, and it is unclear whether this could have affected benefit and harms outcomes, these studies were assessed at unclear risk of bias.
Effects of interventions
See: Summary of findings for the main comparison Celecoxib versus placebo for osteoarthritis; Summary of findings 2 Celecoxib versus tNSAIDs for osteoarthritis
Comparison 1: Celecoxib compared with placebo
Studies in this comparison were assessed at low risk of bias for sequence generation, allocation concealment and blinding of participants and personnel.
Benefits
Pain
This was a patient‐reported outcome and included data from four studies (N = 1622) with follow‐up ranging from 6 weeks to 24 weeks. Celecoxib was statistically significantly superior to placebo, accounting for 3% absolute improvement (95% CI 2% to 5% improvement) or 12% relative improvement (95% CI 7% to 18% improvement) (SMD ‐0.22, 95% CI ‐0.32 to ‐0.12, P < 0.001). The number needed to treat to benefit (NNTB) was 11 (95% CI 7 to 18). Heterogeneity was low (Chi² = 2.11, df = 3, P = 0.55; I² = 0%, Analysis 1.1). Absolute improvement of 3% may not be clinically significant and there is uncertainty about this result (high quality evidence; summary of findings Table for the main comparison).
Physical function
This was a patient‐reported outcome and included data from four studies (N = 1622) with follow‐up ranging from 6 weeks to 24 weeks. Celecoxib was statistically significantly superior to placebo, accounting for 4% absolute improvement (95% CI 2% to 6% improvement) or 12% relative improvement (95% CI 5% to 19% improvement) (SMD ‐0.17, 95% CI ‐0.27 to ‐0.07, P < 0.001; Analysis 1.2). NNTB was 14 (95% CI 9 to 34). Heterogeneity was low (Chi² = 1.62, df = 3, P = 0.66, I² = 0%). Absolute improvement of 4% may not be clinically significant and there is uncertainty about this result (high quality evidence; summary of findings Table for the main comparison).
Quality of life
No studies reported this outcome.
Numbers of responders with at least 50% reduction in pain score
No studies reported this outcome.
Harms
None of the harms considered for this outcome were patient‐reported. All eligible studies were included in analyses. Follow‐up ranged from 6 weeks to 24 weeks.
Numbers of participants who withdrew due to adverse events
Based on direct, moderate‐quality evidence (downgraded due to risk of bias) we found no evidence of an important difference for withdrawals due to adverse events (Peto OR (can be interpreted as RR due to low event rate) 0.99, 95% CI 0.85 to 1.15; P = 0.88; 28 studies, 12,785 participants; Analysis 1.3). There was no statistically significant difference between celecoxib and placebo. Heterogeneity was low (Chi² = 34.60, df = 27, P = 0.15, I² = 22%).
Numbers of participants who experienced any serious adverse event
This analysis included 28 studies (N = 13,393). Based on direct, very low quality evidence (downgraded due to risk of bias and imprecision), results were inconclusive (Peto OR 0.95, 95% CI 0.66 to 1.36; P = 0.78; 28 studies, 13,393 participants; Analysis 1.4). There was no statistically significant difference between celecoxib and placebo. Heterogeneity was low (Chi² = 28.39, df = 25, P = 0.29, I² = 12%).
Numbers of participants who experienced gastro‐intestinal events (perforation, ulcer, bleeds)
Based on direct, very low quality evidence (downgraded due to risk of bias and imprecision), results were inconclusive (Peto OR 1.91, 95% CI 0.24 to 14.90; P = 0.54; 8 studies, 3263 participants; Analysis 1.5). There was no statistically significant difference between celecoxib and placebo. Heterogeneity was low (Chi² = 3.93, df = 3, P = 0.27, I² = 24%). Four studies indicated that no gastro‐intestinal events of the types specified occurred during the study. In the remaining four studies, three gastro‐intestinal events were reported in participants taking celecoxib and one event in a participant taking placebo.
Numbers of participants who experienced cardiovascular events (myocardial infarction, stroke)
Results were inconclusive (very low quality evidence, downgraded due to risk of bias and imprecision). There was no statistically significant difference between celecoxib and placebo (Peto OR 3.40, 95% CI 0.73 to 15.88; P = 0.12; 5 studies, 2947 participants; Analysis 1.6). Heterogeneity was low (Chi² = 0.54, df = 4, P = 0.97, I² = 0%). There were seven cardiovascular events reported in four studies including one stroke in the celecoxib group (Clegg 2006), three myocardial infarctions in the celecoxib group (Rother 2007; Smugar 2006 Study 1; Smugar 2006 Study 2). There were two deaths resulting from cerebrovascular adjudication and an atherosclerotic cardiovascular event in the celecoxib group and one ischemic stroke in the placebo group (Schnitzer 2011).
Regulatory agencies in Australia, Europe and the UK refer to the USA FDA assessment of increased risk of cardiovascular events (FDA 2005). An increased risk of cardiovascular events is included in most product labels.
Comparison 2: Celecoxib compared with tNSAIDs
Studies in this comparison were assessed at low risk of bias for sequence generation, allocation concealment and blinding of participants and personnel.
Benefits
Pain
We analysed data from two studies (N = 1180) that compared celecoxib 200 mg/day with naproxen 1000 mg/day with follow‐up of 12 weeks (Sowers 2005) and celecoxib 200 mg/day with diclofenac 100 mg/day with follow‐up of 52 weeks (Dahlberg 2009). Moderate quality evidence (downgraded due to missing data; summary of findings Table 2) provided inconclusive results between celecoxib and tNSAIDs (MD ‐4.52, 95% CI ‐10.65 to 1.61; P = 0.15). The pooled analysis indicated 5% absolute improvement (95% CI 11% improvement to 2% worse) and 11% relative improvement (95% CI 26% improvement to 4% worse). Heterogeneity was substantial, but not statistically significant (Chi² = 2.85, df = 1, P = 0.09, I² = 65%, Analysis 2.1).
Physical function
Results from one study (N = 264) which compared celecoxib 200 mg/day with naproxen 1000 mg/day with follow‐up of 12 weeks (Sowers 2005) indicated that celecoxib was superior to tNSAID, accounting for 6% absolute improvement (95% CI 6% to 11% improvement) and 16% relative improvement (95% CI 2% to 30% improvement) (MD ‐6.00, 95% CI ‐11.40 to ‐0.60, P = 0.03) in improving physical function. NNTB was 9 (95% CI 5 to 121, Analysis 2.2). Heterogeneity was not applicable. The improvement may not be of clinical significance (moderate quality evidence due to missing data; summary of findings Table 2).
Quality of life
No studies reported this outcome.
Numbers of responders with at least 50% reduction in pain score
No studies reported this outcome.
Harms
Numbers of participants who withdrew due to adverse events
This analysis included eight studies (N = 3150) that compared celecoxib 200 mg/day with diclofenac 100 mg/day with 52‐weeks follow‐up (Dahlberg 2009), diclofenac 150 mg/day with 6‐weeks follow‐up (McKenna 2001b), diclofenac 150 mg/day with 12‐weeks follow‐up (Emery 2008), naproxen 1000 mg/day with 6‐weeks follow‐up (Essex 2012b; Essex 2014) and naproxen 1000 mg/day with 12‐weeks follow‐up (Bensen 1999; Kivitz 2001; Sowers 2005). Low quality evidence (downgraded due to missing data, risk of bias, few events and wide confidence intervals; summary of findings Table 2) provided inconclusive results for numbers of participants who withdrew due to adverse events (Peto OR 0.97, 95% CI 0.74 to 1.27, P = 0.82). Heterogeneity was moderate, but not significant (Chi² = 10.63, df = 7, P = 0.16, I² = 34%, Analysis 2.3).
Numbers of participants who experienced any serious adverse event (SAE)
This analysis included five studies (N = 2404) that compared celecoxib 200 mg/day with diclofenac 100 mg/day with 52‐weeks follow‐up (Dahlberg 2009), diclofenac 150 mg/day with 6‐weeks follow‐up (McKenna 2001b), diclofenac 150 mg/day with 12‐weeks follow‐up (Emery 2008), naproxen 1000 mg/day with 6‐weeks follow‐up (Essex 2012b) and naproxen 1000 mg/day with 6‐months follow‐up (Essex 2012a). Based on very low quality evidence (downgraded due to missing data, risk of bias, few events and wide confidence intervals; summary of findings Table 2), results were inconclusive for numbers of participants experiencing any SAEs between celecoxib and tNSAIDs (Peto OR 0.92, 95% CI 0.66 to 1.28, P = 0.60). Heterogeneity was moderate, but not significant (Chi² = 5.90, df = 4, P = 0.21, I² = 32%; Analysis 2.4).
Numbers of participants who experienced gastro‐intestinal events (perforation, ulcer, bleeds)
This analysis included four studies (N = 1755) that compared celecoxib 200 mg/day with diclofenac 100 mg/day with 52‐weeks follow‐up (Dahlberg 2009), diclofenac 150 mg/day with 12‐weeks follow‐up (Emery 2008), naproxen 1000 mg/day with 6‐weeks follow‐up (Essex 2014) and naproxen 1000 mg/day with 12‐weeks follow‐up (Bensen 1999). The rate of gastro‐intestinal events was higher in participants who received tNSAIDs (1.2%, 5/878, 6 per 1000) compared with celecoxib (0.8%, 3/877, 4 per 1000). However, this result was not statistically significant (Peto OR 0.61, 0.15 to 2.43, P = 0.48). Heterogeneity was moderate (Chi² = 4.84, df = 3, P = 0.18, I² = 38%, Analysis 2.5).
Numbers of participants who experienced cardiovascular events (myocardial infarction, stroke)
This analysis included one study that compared celecoxib 200 mg/day versus diclofenac 100 mg/day with 52‐weeks follow‐up (Dahlberg 2009). Based on very low quality evidence (downgraded due to missing data, risk of bias, few events and wide confidence intervals; summary of findings Table 2), results were inconclusive for numbers of participants who experienced cardiovascular events between celecoxib and tNSAIDs (Peto OR 0.47, 95% CI 0.17 to 1.25, P = 0.13; 1 study, 916 participants; Analysis 2.6).
Comparison 3: Celecoxib compared with placebo (all eligible studies)
Differences between comparison 1 (celecoxib vs placebo in studies with low risk of bias) and comparison 3 (celecoxib vs placebo in all eligible studies): in comparisons of celecoxib and placebo there were no significant differences between the analyses (analyses which included studies with low risk of bias on sequence generation, allocation concealment and blinding of participants and personnel, and analyses with all eligible studies).
Benefits
Pain
All reported pain under 24 weeks
This analysis included 31 studies; follow‐up ranged from 6 weeks to 24 weeks. Celecoxib was more effective in reducing pain compared with placebo (SMD ‐0.41, 95% CI ‐0.49 to ‐0.32, P < 0.001; 31 studies, 13,069 participants; Analysis 3.1). Heterogeneity was high (Chi² = 163.27, df = 30, P < 0.001, I² = 82%). Two studies (Bingham 2007 Study 1; Bingham 2007 Study 2) did not report WOMAC pain data for end of study (12 weeks), but averaged data for 2, 4, 8 and 12‐week follow‐up were provided.
Visual analogue scale (VAS) for pain (0 mm to 100 mm)
Celecoxib was statistically significantly superior in reducing pain compared with placebo at 6 weeks (SMD ‐0.49, 95% CI ‐0.64 to ‐0.34, P < 0.001; 11 studies, 3722 participants; Chi² = 48.62, df = 10, P < 0.001, I² = 79%, Analysis 3.2); 12 weeks (MD ‐11.09, 95% CI ‐12.68 to ‐9.50, P < 0.001; 3 studies, 1226 participants; Chi² = 1.82, df = 2.0, P = 0.40, I² = 0%, Analysis 3.3); and 13 weeks (MD ‐6.35, 95% CI ‐8.00 to ‐4.70, P < 0.001; 5 studies, 3853 participants; Chi² = 3.01, df = 4, P = 0.56, I² = 0%, Analysis 3.4).
Pain on walking VAS (0 to 100 mm) at 6 weeks
Data from four studies informed analysis of this outcome (N = 1572). We found evidence of statistically significant differences between celecoxib and placebo in favor of celecoxib (MD ‐12.42, 95% CI ‐14.83 to ‐10.01, P < 0.001; Chi² = 0.15, df = 3, P = 0.99, I² = 0%, Analysis 3.5).
WOMAC pain
Celecoxib was statistically significantly superior in reducing pain at 6 weeks (MD ‐3.28, 95% CI ‐4.51 to ‐2.06, P < 0.001; 12 studies, 4178 participants; Chi² = 91.72, df = 11, P < 0.001, I² = 88%, Analysis 3.7); 12 weeks (SMD ‐0.32; 95% CI ‐0.40 to ‐0.23, P < 0.001; 9 studies, 3328 participants; Chi² = 10.64, df = 8.0, P = 0.22, I² = 25%, Analysis 3.8) (however, two studies (Bingham 2007 Study 1; Bingham 2007 Study 2) did not report WOMAC pain data for end of study (12 weeks), but provided averaged data for 2, 4, 8 and 12‐week follow‐up); 13 weeks (MD ‐1.06, 95% CI ‐1.31 to ‐0.80, P < 0.001; 5 studies, 3853 participants; Chi² = 3.44, df = 4, P = 0.49, I² = 0%, Analysis 3.9); and 24 weeks (MD ‐13.1, 95% CI ‐24.69 to ‐1.51, P = 0.03; 1 study, 631 participants; Analysis 3.10).
Physical function
All physical function under 24 weeks
Celecoxib was more effective than placebo (SMD ‐0.35, 95% CI ‐0.43 to ‐0.27, P < 0.001; 27 studies, 11,940 participants; Chi² = 113.87, df = 26, P < 0.001, I² = 77%, Analysis 3.11).
WOMAC physical function
Celecoxib was more effective than placebo at 6 weeks (SMD ‐0.31, 95% CI ‐0.41 to ‐0.22, P < 0.001; 12 studies, 4069 participants; moderate, but statistically significant heterogeneity, Chi² = 22.14, df = 11, P = 0.02, I² = 50%, Analysis 3.12); 12 weeks (SMD ‐0.46, 95% CI ‐0.65 to ‐0.26, P < 0.001; 9 studies, 3185 participants; very high heterogeneity, Chi² = 54.71, df = 8, P < 0.001, I² = 85%, Analysis 3.13); 13 weeks (MD ‐3.70, 95% CI ‐4.67 to ‐2.74, P < 0.001; 5 studies, 3853 participants; moderate heterogeneity, Chi² = 5.89, df = 4, P = 0.21, I² = 32%, Analysis 3.14); at 24 weeks, there was no statistically significant difference between celecoxib 200 mg and placebo (MD ‐32.6, 95% CI ‐81.07 to 15.87, P = 0.19; 1 study, 631 participants; Analysis 3.15).
Quality of life
One study assessed quality of life (DeLemos 2011, N = 402). Data were reported as SF‐36 physical component scores (PCS) and mental component scores (MCS). SF‐36 PCS was higher in participants taking celecoxib compared to placebo (MD 2.20, 95% CI 0.54 to 3.86, P = 0.01, Analysis 3.16). There was no difference in the SF‐36 MCS between celecoxib and placebo (MD 0.20, 95% CI ‐1.46 to 1.86, P = 0.81, Analysis 3.17).
Numbers of responders with at least 50% reduction in pain score
Based on data from four studies (N = 1816) with 12‐week (Bingham 2007 Study 1; Bingham 2007 Study 2; Conaghan 2013) and 24‐week follow‐up (Clegg 2006), that reported number of responders with at least 50% improvement in WOMAC pain, celecoxib was more effective than placebo (RR 1.47, 95% CI 1.16 to 1.87, P = 0.001). Heterogeneity was high (Chi² = 8.92, df = 3, P = 0.03, I² = 66%, Analysis 3.18). Data about this outcome for two studies (Bingham 2007 Study 1; Bingham 2007 Study 2) were not published in the primary publication about trials; they were provided by Merck Research Laboratories for the purpose of a meta‐analysis published by Moore et al in 2010. Prof. Andrew R. Moore approved usage of these additional data for the purpose of this review (personal communication).
Harms
Analysis 3.19; Analysis 3.20; Analysis 3.21; Analysis 3.22 report the same data as the corresponding analyses in Comparison 1: numbers of participants withdrawn due to adverse events (Analysis 1.3); experiencing any serious adverse event (Analysis 1.4); experiencing gastro‐intestinal events (perforation, ulcer, bleeds) (Analysis 1.5) and experiencing cardiovascular events (myocardial infarction, stroke) (Analysis 1.6).
Comparison 4: Celecoxib compared with tNSAIDs (all eligible studies)
Differences between Comparison 2 (celecoxib vs tNSAIDs in studies with low risk of bias) and Comparison 4 (celecoxib vs tNSAIDs in all eligible studies) were analyzed. For most outcomes there were no significant differences between outcomes sets (analyses including studies with low risk of bias for sequence generation, allocation concealment and blinding of participants and personnel, and analyses with all eligible studies). The exception was physical function; absolute improvement of 6% (relative improvement = 16%) in physical function was observed in one eligible study with low risk of bias (Analysis 2.2), but not in analyses of all eligible studies (Analysis 4.3).
Benefits
Pain
All pain under 24 weeks
Eight studies (N = 2277) compared celecoxib 200 mg/day with diclofenac 150 mg/day with 6‐weeks follow‐up (McKenna 2001b), diclofenac 150 mg/day with 12‐weeks follow‐up (Emery 2008), naproxen 1000 mg/day with 6‐weeks follow‐up (Essex 2012b; Essex 2014), naproxen 1000 mg/day with 12‐weeks follow‐up (Bensen 1999; Kivitz 2001; Sowers 2005) and naproxen 1000 mg/day with 6‐months follow‐up (Essex 2012a). Pooled analysis (SMD 0.00, 95% CI ‐0.10 to 0.10; Analysis 4.1) showed that there was no statistically significant difference between celecoxib and tNSAIDs (P = 0.93) in pain outcomes in studies that followed participants for fewer than 24 weeks. Heterogeneity was low (Chi² = 9.90, df = 7, P = 0.19, I² = 29%).
All pain over 24 weeks
There was no difference between celecoxib 200 g/day and diclofenac 100 mg/day (P = 0.24) in pain at 1 year (MD ‐2.00, 95% CI ‐5.32 to 1.32, P = 0.24, 1 study, 916 participants; Analysis 4.2).
Physical function
All physical function under 24 weeks
Seven studies (N = 2176) provided data for this outcome which compared celecoxib 200 mg/day with diclofenac 150 mg/day with 6‐weeks follow‐up (McKenna 2001b), naproxen 1000 mg/day with 6‐weeks follow‐up (Essex 2012b; Essex 2014), naproxen 1000 mg/day with 12‐weeks follow‐up (Bensen 1999; Kivitz 2001; Sowers 2005) and naproxen 1000 mg/day with 6‐months follow‐up (Essex 2012a). Pooled analysis (SMD 0.06, 95% CI ‐0.09 to 0.21, Analysis 4.3) showed no statistically significant difference between celecoxib and tNSAIDs (P = 0.46) in physical function outcomes in studies that followed participants for fewer than 24 weeks. Heterogeneity was high (Chi² = 18.58, df = 6, P = 0.005, I² = 68%).
Harms
Numbers of participants who withdrew due to adverse events
Studies compared celecoxib 200 mg/day with diclofenac 100 mg/day with 52‐weeks follow‐up (Dahlberg 2009), diclofenac 150 mg/day with 6‐weeks follow‐up (McKenna 2001b), diclofenac 150 mg/day with 12‐weeks follow‐up (Emery 2008), naproxen 1000 mg/day with 6‐weeks follow‐up (Essex 2012b; Essex 2014), naproxen 1000 mg/day with 12‐weeks follow‐up (Bensen 1999; Kivitz 2001; Sowers 2005) and naproxen 1000 mg/day with 6‐months follow‐up (Essex 2012a). There was no statistically significant difference among groups (Peto OR 0.85, 95% CI 0.68 to 1.07, P = 0.42; 9 studies, 3739 participants; Chi² = 13.56, df = 8, P = 0.09, I² = 41%; Analysis 4.4).
Numbers of participants who experienced any serious adverse event
Studies compared celecoxib 200 mg/day with diclofenac 100 mg/day with 52‐weeks follow‐up (Dahlberg 2009), diclofenac 150 mg/day with 6‐weeks follow‐up (McKenna 2001b), diclofenac 150 mg/day with 12‐weeks follow‐up (Emery 2008), naproxen 1000 mg/day with 6‐weeks follow‐up (Essex 2012b) and naproxen 1000 mg/day with 6‐months follow‐up (Essex 2012a). There was no statistically significant difference among groups (Peto OR 0.92, 95% CI 0.66 to 1.28, P = 0.60; 4 studies, 2404 participants; Chi² = 5.90, df = 4, P = 21, I² = 32%; Analysis 4.5).
Numbers of participants who experienced gastro‐intestinal events (perforation, ulcer, bleeds)
Studies compared celecoxib 200 mg/day with diclofenac 100 mg/day with 52‐weeks follow‐up (Dahlberg 2009), diclofenac 150 mg/day with 12‐weeks follow‐up (Emery 2008), naproxen 1000 mg/day with 6‐weeks follow‐up (Essex 2014) and naproxen 1000 mg/day with 12‐weeks follow‐up (Bensen 1999). There was no statistically significant difference between celecoxib and tNSAIDs for major gastro‐intestinal adverse events (Peto OR 0.61, 95% CI 0.15 to 2.43, P = 0.48; 4 studies, 1755 participants; Chi² = 4.84, df = 3, P = 0.18, I² = 38%; Analysis 4.6).
Numbers of participants who experienced cardiovascular events (myocardial infarction, stroke)
There was no statistically significant difference between celecoxib 200 mg/day and diclofenac 100 mg/day with 52‐weeks follow‐up for cardiovascular events (Peto OR 0.47, 95% CI 0.17 to 1.25, P = 0.13; 1 study, 916 participants; Analysis 4.7).
Comparison 5: Celecoxib compared with naproxen 1000 mg
Differences between Comparison 5 (celecoxib vs naproxen 1000 mg/day) and Comparison 4 (celecoxib vs tNSAIDs in all eligible studies) were analyzed. There were no differences in results.
Benefits
Pain
All pain up to 24 weeks
There was no statistically significant difference between celecoxib and naproxen (SMD ‐0.04, 95% CI ‐0.14 to 0.05; 6 studies, 1781 participants; P = 0.35; Chi² = 2.23, df = 5, P = 0.82, I² = 0%, Analysis 5.1).
VAS for pain (0 mm to 100 mm)
There was no statistical difference in pain measured with VAS between celecoxib 200 mg and naproxen 1000 mg/day at 6 weeks (MD 0.55, 95% CI 3.97 to 5.07, P = 0.81; 2 studies, 398 participants; Chi² = 0.34, df = 1, P = 0.56, I² = 0%, Analysis 5.2).
There was no statistical difference in pain measured with VAS between celecoxib 200 mg and naproxen 1000 mg/day at 12 weeks (MD ‐0.97, 95% CI ‐2.69 to 0.76, P = 0.27; 3 studies, 975 participants; Chi² = 0.68, df = 2, P = 0.71, I² = 0%, Analysis 5.3).
WOMAC pain
We did not find evidence of a clear difference between celecoxib 200 mg and naproxen 1000 mg at 6 weeks (MD 0.35, 95% CI ‐0.54 to 1.23, P = 0.44; 2 studies, 503 participants; Chi² = 1.26, df = 1, P = 0.26, I² = 20%, Analysis 5.4) or at 12 weeks (MD ‐0.103, 95% CI ‐0.65 to 0.60, P = 0.93; 3 studies, 1073 participants; Chi² = 2.84, df = 2, P = 0.24, I² = 30%, Analysis 5.5). There was no statistically significant difference at 6 months (MD 0.10, 95% CI ‐0.46 to 0.66, P = 0.72; 1 study, 310 participants; Analysis 5.6).
Physical function
All physical function up to 24 weeks
There was no statistically significant difference between celecoxib and naproxen at up to 24 weeks (SMD ‐0.01, 95% CI ‐0.18 to 0.16; P = 0.93; 6 studies, 1817 participants). Heterogeneity was substantial (Chi² = 16.32, df = 5, P = 0.006, I² = 69%, Analysis 5.7).
WOMAC physical function
There was no statistically significant difference between celecoxib 200 mg and naproxen 1000 mg in physical function at 6 weeks (MD ‐2.99, 95% CI ‐6.43 to 0.44, P = 0.08; 2 studies, 313 participants; Chi² = 1.07, df = 1, P = 0.30, I² = 7%, Analysis 5.8); 12 weeks (MD ‐1.27, 95% CI ‐4.32 to 1.78, P = 0.41; 3 studies, 1073 participants) but heterogeneity was substantial (Chi² = 19.53, df = 2, P < 0.001, I² = 89%, Analysis 5.9); or at 6 months (MD 0.30, 95% CI ‐1.94 to 2.54, P = 0.79; 1 study, 301 participants; Analysis 5.10).
Quality of life
No studies reported this outcome.
Numbers of responders with at least 50% reduction in pain score
No studies reported this outcome. However, Essex 2012a reported number of responders, defined as at least 20% decrease in WOMAC pain score; there was no statistically significant difference between celecoxib 200 mg/day and naproxen 1000 mg/day (RR 1.1, 95% CI 0.94 to 1.28; P = 0.22).
Harms
Numbers of participants who withdrew due to adverse events
There was no statistically significant difference between celecoxib 200 mg and naproxen 1000 mg (pooled OR 0.81, 95% CI 0.54 to 1.23; 6 studies, 2173 participants; P = 0.33). Heterogeneity was moderate, but not statistically significant (Chi² = 8.60, df = 5, P = 0.13, I² = 42%, Analysis 5.11).
Numbers of participants who experienced any serious adverse event
We did not find evidence of a clear difference between treatments (Peto OR 1.11, 95% CI 0.45 to 2.75, P = 0.83; 2 studies, 841 participants; Chi² = 0.00, df = 1, P = 0.94, I² = 0%, Analysis 5.12). There were no subgroups in this analysis.
Numbers of participants who experienced gastro‐intestinal events (perforation, ulcer, bleeds)
We did not find evidence of a clear difference between treatments (Peto OR 0.37, 95% CI 0.05 to 2.62, P = 0.32; 2 studies, 587 participants; Chi² = 0.33, df = 1, P = 0.56, I² = 0%; Analysis 5.13). One event was observed among participants taking celecoxib and three among those taking naproxen 1000 mg.
Numbers of participants who experienced cardiovascular events (myocardial infarction, stroke)
No studies reported this outcome.
Comparison 6: Celecoxib compared with diclofenac 100 mg
We compared results of Comparison 6 (celecoxib vs. diclofenac 100 mg/day) with analyses from Comparison 4 (celecoxib vs. all tNSAIDs). There were no differences.
Benefits
Pain
There was no statistically significant difference between celecoxib 200 mg and diclofenac 100 mg in VAS pain after 1 year of therapy (MD ‐2.0, 95% CI ‐5.32 to 1.32; P = 0.24; 1 study, 916 participants; Analysis 6.1).
Physical function
No studies reported this outcome.
Quality of life
No studies reported this outcome.
Numbers of responders with at least 50% reduction in pain score
No studies reported this outcome.
Harms
Numbers of participants who withdrew due to adverse events
There was no clear difference between celecoxib 200 mg and diclofenac 100 mg (Peto OR 1.44, 95% CI 0.80 to 2.61, P = 0.23; 1 study, 916 participants; Analysis 6.2).
Numbers of participants who experienced any serious adverse event
There was no clear difference between celecoxib and diclofenac 100 mg (OR 0.90, 95% CI 0.62 to 1.30, P = 0.57; 1 study, 916 participants; Analysis 6.3).
Numbers of participants who experienced gastro‐intestinal events (perforation, ulcer, bleeds)
There was no statistically significant difference between celecoxib 200 mg and diclofenac 100 mg (Peto OR 0.14, 95% CI 0.01 to 2.16, P = 0.16; 1 study, 916 participants; Analysis 6.4).
Numbers of participants who experienced cardiovascular events (myocardial infarction, stroke)
There was no statistically significant difference between celecoxib 200 mg and diclofenac 100 mg (Peto OR 0.47, 95% CI 0.17 to 1.25, P = 0.13; 1 study, 916 participants; Analysis 6.5).
Comparison 7: Celecoxib compared with diclofenac 150 mg
We compared results of Comparison 7 (celecoxib vs. diclofenac 150 mg/day) with analyses from Comparison 4 (celecoxib vs. all tNSAIDs). There were no differences.
Benefits
Pain
VAS for pain (0 mm to 100 mm) at 6 weeks
There was no statistically significant difference between celecoxib 200 mg and diclofenac 150 mg (MD 1.90 (95% CI ‐3.68 to 7.48, P = 0.58; 1 study, 398 participants; Analysis 7.1).
Pain WOMAC at 6 weeks
There was no clear difference between celecoxib and diclofenac 150 mg (MD 0.3, 95% CI ‐0.52 to 1.12; 1 study, 398 participants; Analysis 7.2).
Pain on walking at 12 weeks
Diclofenac 150 mg was statistically significantly better in reducing pain on walking compared with celecoxib 200 mg (MD 13.00 (95% CI 3.11 to 22.89; 1 (12 week) study, 98 participants; Analysis 7.3).
Physical function
There was no statistically significant difference between celecoxib 200 mg and diclofenac150 mg on physical function measured on the WOMAC scale after 6 weeks follow up (MD 1.90, 95% CI ‐1.26 to 5.06, P = 0.24; 1 study, 398 participants; Analysis 7.4).
Quality of life
No studies reported this outcome.
Numbers of responders with at least 50% reduction in pain score
No studies reported this outcome.
Harms
Numbers of participants who withdrew due to adverse events
There was no statistically significant difference between celecoxib 200 mg and diclofenac 150 mg in withdrawals due to adverse events (pooled OR (random‐effects model) 0.78, 95% CI 0.46 to 1.32, P = 0.35; 2 studies, 650 participants; Chi² = 1.11, df = 1, P = 0.29, I² = 10%, Analysis 7.5).
Numbers of participants who experienced any serious adverse event
There was no statistically significant difference between celecoxib 200 mg and diclofenac 150 mg in withdrawals due to adverse events (Peto OR 0.79, 95% CI 0.21 to 2.93, P = 0.72; 2 studies, 649 participants; substantial heterogeneity Chi² = 5.66, df = 1, P = 0.02, I² = 82%; Analysis 7.6).
Numbers of participants who experienced gastro‐intestinal events (perforation, ulcer, bleeds)
There was no statistically significant difference between celecoxib 200 mg and diclofenac 150 mg in gastro‐intestinal events including perforation, ulcer and bleeds (Peto OR 7.45, 95% CI 0.46 to 119.74, P = 0.16; 1 study, 252 participants; Analysis 7.7).
Numbers of participants who experienced cardiovascular events (myocardial infarction, stroke)
No studies reported this outcome.
Publication bias
The potential for small‐study effects was explored using funnel plots in outcomes with more than 10 studies; this included pain (Analysis 3.1; Analysis 3.2; Analysis 3.7), physical function (Analysis 3.11; Analysis 3.12), numbers of withdrawals due to adverse events (Analysis 1.3; Analysis 3.19), numbers experiencing any serious side effects (Analysis 1.4; Analysis 3.20), and numbers of participants experiencing gastro‐intestinal events (Analysis 1.5). Based on the appearance of these funnel plots, we judged that the pooled results for these outcomes were not biased by small‐study effects. Examples of these funnel plots are shown in Figure 4 and Figure 5.

Funnel plot of comparison: 1 Celecoxib versus placebo, outcome: 1.3 Number withdrawn due to adverse events.

Funnel plot of comparison: 1 Celecoxib versus placebo, outcome: 1.4 Number experiencing any serious adverse events.
However, because there are missing data for thousands of people who participated in studies, this presents serious publication bias. We therefore downgraded the quality of evidence for outcomes in the main comparisons of celecoxib and tNSAIDs (comparisons of studies that were judged as having low risk of bias).
Sensitivity analyses
We conducted sensitivity analyses to assess risk of bias. Because analyses of benefit outcomes for all included studies showed high statistical heterogeneity, we run sensitivity analysis on both comparisons of the patient‐reported outcomes for studies assessed at low risk of bias for three domains (randomization, allocation concealment and blinding of participants and personnel). In comparisons of celecoxib and placebo there were no statistically significant differences in these analyses. Sensitivity analyses of celecoxib and tNSAIDs showed no differences in all benefit and harms outcomes. However, analysis of low risk of bias studies only showed that celecoxib was significantly better than tNSAIDs in improving physical function. One low risk of bias study showed that celecoxib caused significantly fewer gastro‐intestinal adverse events compared with tNSAIDs.
Sensitivity analyses were also conducted to test if exclusion of studies with imputed standard deviations (Kivitz 2001; McKenna 2001a; Boswell 2008 Study A; Boswell 2008 Study B) influenced results. Exclusion of these studies did not statistically significant impact effect sizes.
Sensitivity analyses to estimate the effects of including Singh 2006 could have on review results were also conducted. Singh 2006 was by far the largest study we found (N = 13,274). However, the report available does not present summary data for each study arm. The study sponsor, Pfizer, declined to provide data for inclusion in this systematic review. We conducted three analyses with the data that could be extracted. Data for numbers of gastro‐intestinal and cardiovascular events were provided for celecoxib 200 mg daily and 400 mg daily combined, and for diclofenac and naproxen combined. This is significant because we included only analyses of celecoxib 200 mg daily because this is now the clinically recommended dose of celecoxib for people with osteoarthritis. Data for these combined groups were added to relevant analyses in the comparison of celecoxib vs tNSAIDs. For numbers of participants who experienced gastro‐intestinal events (Analysis 2.5) statistical significance changed after adding data from Singh 2006 study. After inclusion of data from Singh 2006, the number of participants totaled 14.949; total numbers of events in the celecoxib group was 86/9677 (0.9%) and 66/5272 (1.3%) in the tNSAIDs group. Statistically significant difference was then observed in favor of celecoxib (OR 0.68, 95% CI 0.49 to 0.93, P = 0.02, no heterogeneity). Without data from Singh 2006, there was no difference between groups (Analysis 2.5). Data on cardiovascular events from Singh 2006 were added to Analysis 2.6 (N = 14,110). Numbers of events in the celecoxib group was 29/9258 (0.31%) and 18/4852 (0.37%) in the tNSAIDs group. There was no statistically significant difference between groups when data from Singh 2006 were added (OR 1.03, 95% CI 0.56 to 1.91, P = 0.92); heterogeneity was statistically significant (I² 73%, P = 0.05). Analysis including generic inverse variance for VAS pain (100 mm scale) comparing celecoxib 200 mg daily and tNSAIDs was also conducted. However, these data were not presented as a summary effect; Singh 2006 presented mean differences and 95% CIs for participants from 15 regions separately, but numbers of participants per region was not reported. When data from all 15 regions were combined using generic inverse variance, results were statistically significant in favor of tNSAIDs (pooled MD 1.21, 95% CI 0.06 to 2.35, P = 0.03). Heterogeneity was low and not statistically significant (Chi² = 17.35, df = 14, P = 0.24, I² = 19%). We did not attempt to add these data to other analyses because numbers of participants were not available. However, considering the large number of participants in Singh 2006, it is possible that addition of these data would change results in favor of tNSAIDs.
Exploring potential sources of heterogeneity
Because analyses of all included studies showed statistically significant heterogeneity, we analyzed baseline participants' variables in detail to identify any systematic differences among studies. However, we did not find any consistent differences that could explain heterogeneity. Furthermore, for assessment of pain in celecoxib versus placebo we analyzed summary effects separately at three follow‐up times (6 weeks, 12/13 weeks and 24 weeks) and for two different pain instruments (pain VAS and pain WOMAC) (Table 2). We did not find reduced heterogeneity using either of the pain instruments or follow‐up times.
| Pain instrument | 6 weeks | 12 and 13 weeks | 24 weeks | All follow‐up times combined |
| Pain VAS | SMD = ‐0.49 (95% CI ‐0.56 to ‐0.43), P < 0.001, heterogeneity: 79% (11 studies, 3722 participants) | SMD = ‐0.37 (95% CI ‐0.43 to ‐0.30), P < 0.001, heterogeneity: 93% (6 studies, 3842 participants) | No studies reported pain VAS outcome | SMD = ‐0.43 (95% CI ‐0.48 to ‐0.38), P < 0.001, heterogeneity: 88% (17 studies, 7564 participants) |
| Pain WOMAC | SMD = ‐0.40 (95% CI ‐0.46 to ‐0.33), P < 0.001, heterogeneity: 71% (12 studies, 4718 participants) | SMD = ‐0.28 (95% CI ‐0.33 to ‐0.23), P < 0.001, heterogeneity: 19% (12 studies, 5944 participants) | SMD = ‐0.18 (95% CI ‐0.33 to ‐0.02), P = 0.03, heterogeneity: not applicable (1 study, 631 participants) | SMD = ‐0.32 (95% CI ‐0.36 to ‐0.28), P < 0.001, heterogeneity: 62% (25 studies, 10,753 participants) |
| Both instruments | SMD = ‐0.43 (95% CI ‐0.53 to ‐0.34), P < 0.001, heterogeneity: 76% (17 studies, 7900 participants) | SMD = ‐0.35 (95% CI ‐0.44 to ‐0.25), P < 0.001, heterogeneity: 81% (12 studies, 9786 participants) | SMD = ‐0.18 (95% CI ‐0.33 to ‐0.02), P = 0.03, heterogeneity: not applicable (1 study, 631 participants) | SMD = ‐0.39 (95% CI ‐0.46 to ‐0.32), P < 0.001, heterogeneity: 80% (30 studies, 18,317 participants) |
Each cell contains the following information: Standardized mean difference (SMD), 95% confidence interval (95% CI), heterogeneity, number of studies, number of participants.
Abbreviations: VAS: visual analogue scale; WOMAC: Western Ontario and McMaster Universities Arthritis Index
Discussion
Summary of main results
We included 36 randomized controlled trials (RCTs) that assessed the benefits and harms of celecoxib for people with osteoarthritis (OA). We found that compared with placebo or traditional non‐steroidal anti‐inflammatory drugs (tNSAIDs), celecoxib provided slight symptomatic benefit for people with OA of the knee, hip, or both knee and hip; however, it is unlikely that the small benefit has clinical significance. Benefits ranged from 3% to 6% improvement, whereas 15% improvement is considered to be a minimal clinically important difference (MCID) (Dworkin 2008).
Harms outcomes were inconclusive for celecoxib versus placebo or celecoxib versus tNSAIDs, with the exception of withdrawals due to adverse events in the placebo comparison in which there was no evidence of an important difference. These results were assessed as providing low to very low quality evidence. Quality of evidence for most outcomes was downgraded due to risk of bias, imprecision and publication bias. Considering that most studies had high or unclear risk of bias on at least one domain, harms outcomes suffered from imprecision due to wide confidence intervals and few events that were reported. Furthermore, we were unable to obtain results from studies that included 15,539 participants, and hence, our confidence in results presented is not high.
Our decision to provide separate analyses for low risk of bias studies that assessed patient‐reported outcomes was made because of high heterogeneity observed in analyses for all applicable studies. We investigated baseline variables of participants, but we were unable to identify variables that could explain statistical heterogeneity. We also conducted separate analyses for pain outcomes at different follow‐up times and a range of pain measurement instruments. Except for showing declining effect estimates over time, this analysis did not explain sources of statistical heterogeneity. Because high risk of bias studies can also be relevant to inform readers about the robustness of findings, we also presented separate analyses for patient‐reported outcomes. There were no major differences between these analyses.
Overall completeness and applicability of evidence
This review had several limitations. Most studies were short (6 weeks to 13 weeks duration). Only three of 36 studies were longer than 13 weeks, including two with 6‐month durations (Clegg 2006; Essex 2012a) and one 12‐month study (Dahlberg 2009). Most studies permitted additional use of analgesics and other co‐interventions such as antacids, topical therapies and physical therapy during the trial, which could have influenced results related to pain and evaluation of adverse effects. Furthermore, OA can affect joints other than hips and knees, but these were not evaluated in this review.
Most studies were conducted in high‐income countries in North America and Europe. Two studies specified that the study was conducted in low‐ and middle‐income South American countries (Fleischmann 2005; Sowers 2005). Three studies did not specify all study locations, indicating that the study was conducted “internationally” (Boswell 2008 Study A; Boswell 2008 Study B), or that the study was conducted in “15 countries” (Lehmann 2005). Two studies specifically targeted minority participants and included only African‐Americans (Essex 2012b) or Hispanic participants (Essex 2014). All other studies included predominantly white participants, ranging from 71% to 99% Caucasians in the study. It is known that there are complex pain disparities related to race and ethnicity (Green 2003). There are also racial and ethnic differences in the experience of chronic pain, which may be clinically meaningful (Riley 2002). Therefore, findings of included studies may not be applicable to people with OA of all races and ethnicities.
Two studies were conducted with participants who had previously failed naproxen (at least 750 mg/day for 2 weeks) and ibuprofen (at least 1200 mg/day for 2 weeks) within the past five years due to either lack of benefit, tolerability or both (Asmus 2014 Study 1; Asmus 2014 Study 2). These participants are not representative of the entire OA population.
All studies listed multiple morbidities as exclusion criteria. Therefore, review findings may not be applicable to people with OA who have multiple morbidities. It is known that RCTs regularly exclude participants who have multiple morbidities, which is not representative of the general population that a physician would encounter in clinical practice. Research results intended for application in medical practice should take the complex reality of effective treatment of these participants into consideration (Fortin 2006).
Previous meta‐analyses on coxibs and tNSAIDs have shown that these drugs are associated with an increased risk of cardiovascular disease and upper gastro‐intestinal complications, but the nature and magnitude of these risks was unclear, especially in participants at increased risk of coronary heart disease (Kearney 2006; McGettigan 2011; Ofman 2002; Rostom 2007; Solomon 2005; Trelle 2011). It has been suggested that the vascular risk might be highest for celecoxib in people at greatest risk of coronary heart disease (Solomon 2008). The included studies did not permit analysis of specified outcomes in this subset of the population.
In the included studies, women of childbearing age were regularly excluded if they were pregnant, lactating or not using adequate contraception. The findings of this review may not be applicable to these women.
Only one included study provided data for quality of life (DeLemos 2011). Four studies reported analysis of quality of life in their respective methods sections (Clegg 2006; Fleischmann 2005; Pincus 2004 PACES‐a; Pincus 2004 PACES‐b), but none reported outcomes.
Systematic reviews can identify gaps that help in developing new evidence‐based research and finding high‐priority research needs. This gap can be characterized by analysing participants, interventions, comparisons and outcomes (PICOs) of included studies, and if the gap exists because of insufficient or imprecise information, biased information, inconsistency or unknown consistency, or not the right information (Robinson 2011; Saldanha 2013). Based on the analyzed evidence, further research about the benefits and harms of celecoxib for people with osteoarthritis should include participants from different ethnicities, those with multiple morbidities and those not taking co‐interventions. Other desirable characteristics are: more head‐to‐head comparisons with active comparators, relevant outcomes recommended for osteoarthritis, and study designs to accomplish low levels of risk of bias, and that are independently funded.
During preparation of this review, the number of responders with at least 50% pain relief was included as a new outcome to keep in line with the latest guidance on reporting pain outcomes (Busse 2015). Only four of the included trials reported this outcome; three with 12‐week follow‐up and one with 24‐week follow‐up. The one with the longest follow‐up (Clegg 2006) reported the smallest effect and as much as 42% placebo response rate. Future trials should include 50% pain relief as an important outcome.
Quality of the evidence
Quality of the overall evidence showed serious limitations. None of the studies were assessed at low risk of bias on all seven domains. Poor reporting was a major weakness of the included studies, because many did not report relevant details about methods, leading to judgments of unclear risk of bias. Furthermore, attrition was very high. Most included studies had attrition rates over 30% in at least one arm, and a third of studies had attrition rates between 20% and 30% (Characteristics of included studies). Regardless of the imputation method used for missing data, the high number of participants lost from follow‐up is a cause for concern, especially because these were short‐term studies. Only one study had a duration over six months. Furthermore, most studies permitted participants to take multiple co‐interventions which may have influenced results.
The GRADE approach was used to rate overall quality of evidence for the key outcomes presented in the Summary of findings tables. For patient‐reported outcomes we included only studies assessed at low risk of bias on the first three domains. In the comparison of celecoxib versus placebo (summary of findings Table for the main comparison) pain and physical function outcomes were rated as high quality evidence; in the comparison of celecoxib versus tNSAIDs (summary of findings Table 2) quality of pain and physical function outcomes were downgraded one level because a large amount of data were missing from studies that were published, but not adequately reported.
Evidence quality of harms outcomes was assessed as low to very low. These studies were assessed at unclear or high risk of bias on at least one domain, missing data, few reported events and imprecision due to wide confidence intervals that included statistically significant effects for both intervention and control. Therefore, downgrading evidence levels related to problems with risk of bias, publication bias and imprecision.
Analyses of patient‐reported outcomes revealed statistically significant heterogeneity that we could not explain following systematic analysis of participants' baseline characteristics, different pain instruments, or follow‐up times.
We were unable to obtain relevant data for three manuscripts, which reported multiple studies that involved a total of 15,539 participants. Attempts to contact corresponding authors (of studies funded by GlaxoSmithKline, Merck and Novartis) and sponsor (Pfizer) with requests to provide missing data were unsuccessful. This meant that a significant amount of data; especially considering that the 36 RCTs included in this review represent data from a total of 17,206 participants. Our attempts to conduct sensitivity analyses indicated those data could have a significant impact on overall conclusions of this review. Release of missing data and further research is very likely to have an important impact on our confidence in the estimate of effect, and is likely to change the estimate. Furthermore, it is likely that review conclusions about benefits and harms may change following inclusion of relevant information from those studies.
Potential biases in the review process
Strengths of this systematic review include detailed electronic searching; all important databases were included in the search. At least two independent authors were involved In all steps of the review, including screening and data extraction. A third author was consulted when necessary to achieve consensus.
We conducted two sets of analyses for patient‐reported outcomes in studies that compared celecoxib versus placebo and celecoxib versus all tNSAIDs. Analysis was conducted including studies assessed at low risk of bias for three domains (sequence generation, allocation concealment, and blinding of participants and personnel) and repeated to include all eligible studies. Our definition for low risk of bias may be considered arbitrary. However, there is no universal definition for a low risk of bias study. Nevertheless, these two approaches did not result in major differences in results. In comparisons of celecoxib and placebo there were no differences in pooled analyses between studies with low risk of bias for patient‐reported outcomes and pooled analyses of all eligible studies. In comparisons of celecoxib and tNSAIDs, the only difference in pooled analyses between studies with low risk of bias for patient‐reported outcomes and pooled analyses of all eligible studies was observed for one outcome ‐ physical function. We found 6% absolute improvement with celecoxib compared to tNSAIDs in low risk of bias studies and no difference in all eligible studies. Improvement of 6% cannot be considered clinically significant, and therefore, it could be argued there was no difference between analyses for celecoxib versus tNSAIDs.
Limitations of this systematic review include lack of available data due to unsuccessful requests for missing data and clarifications made to study authors and sponsors. Attempts to contact corresponding authors either did not yield response, or replies that requested data were no longer available. Several study authors indicated that data need to be requested from the study sponsors. Data from two studies sponsored by Pfizer were requested using a complex Investigator‐Initiated Research (IIR) request because data were not presented for each randomized group separately; data from several groups were combined in the published manuscripts (Lisse 2001; Singh 2006). Pfizer refused to provide data for both studies. The two studies included a total of 14,042 participants and comparisons of celecoxib 200 mg with placebo, naproxen and diclofenac. Considering lack of head‐to‐head comparisons, inclusion of data from those studies in this systematic review would be very valuable.
Current spotlight on transparency of data from clinical trials, through the AllTrials campaign, stipulates that “All trials should be registered, with their full methods and results reported, and routine audit on the extent of information withheld” (Goldacre 2014). However, attempts to obtain even aggregate data for each randomized group in studies considered for this systematic review were unsuccessful.
Only one included study was not sponsored by a pharmaceutical company (Clegg 2006); one did not report information about funding, but because its authors were industry employees, it was also likely to have been industry funded (Sheldon 2005). Of the 36 studies in this review, 34 included one or more study authors who were company employees. It is known that sponsorship by the manufacturing company leads to more favorable results and conclusions than sponsorship from other sources (Lundh 2012). Therefore, conclusions of this systematic review should be interpreted cautiously.
Although we did not find evidence of publication bias in our analyses, it is possible that a number of negative studies was not published because almost all studies were linked to the pharmaceutical industry.
Agreements and disagreements with other studies or reviews
In 2002, a systematic review investigating the benefits, tolerability and upper gastro‐intestinal safety of celecoxib for both people with OA and those with rheumatoid arthritis (RA) was published (Deeks 2002). The review included published and unpublished studies of at least 12 week duration. Efficacy outcomes at 12 weeks showed that celecoxib resulted in statistically significant improvement in all components of the WOMAC scale, including pain and physical function sub scales, compared to placebo. There were no statistically significant differences between celecoxib and naproxen 500 mg twice daily, with both drugs equally effective for all WOMAC sub scales. Those results cannot be easily compared with our results for two reasons. In their efficacy analyses for comparison of celecoxib and placebo in OA Deeks 2002 included three studies (Bensen 1999, Zhao 1999 and unpublished Study 054, referred to in the literature as Study 054. Integrated clinical and statistical report for a double‐blind placebo controlled, randomised comparison study of the efficacy and safety of SC‐58635 50 mg, 100 mg and 200 mg BID and naproxen 500 mg BID in treating the signs and symptoms of osteoarthritis of the hip. Pharmacia:Data on file. 1997). However, despite slight differences in data presentation, Bensen 1999 and Zhao 1999 are two reports of the same study; hence, Deeks 2002 unintentionally double‐counted participants from the same study. This was noted in a letter from Jüni 2003 published in the British Medical Journal (BMJ). In their response in the same BMJ issue, Deeks et al wrote "We can confirm that the errors Jüni et al point out are not duplicate publications but simple labelling errors that do not affect the results". Furthermore, Study 054 had arms receiving celecoxib 200 mg/day and 400 mg/day and both groups were analyzed together for efficacy outcomes, as judged by the numbers presented in Figure 1. Therefore, this pooled analysis cannot be compared to our analysis of celecoxib 200 mg/day alone. Harms data cannot be compared because harms outcomes in Deeks 2002 were shown for both OA and RA participants combined. It is unclear if Deeks 2002 exhibited sponsorship‐related risk of bias because it was funded by Pfizer and Searle pharmaceutical companies.
A 2005 study assessed tolerability and adverse events in clinical trials of celecoxib in OA and RA in a systematic review and meta‐analysis of data from company clinical trial reports (Moore 2005). Studies lasting two or more weeks were included. Doses of celecoxib ranged from 50 mg to 800 mg daily. However, data were not presented for OA and RA participants separately. The study concluded, among other findings, that celecoxib was associated with higher incidence of myocardial infarction, but this was not statistically significant. Moore 2005 was sponsored by Pfizer and one author was a Pfizer employee.
A 2006 systematic review and meta‐analysis on the risk of cardiovascular events associated with celecoxib included studies of at least six weeks duration (Caldwell 2006). However, celecoxib treatment in the included studies was administered for a wide range of medical conditions including RA, OA, Alzheimer’s disease, and the prevention of colorectal adenoma in people at high risk. Six studies were included in the meta‐analysis. Caldwell 2006 concluded that the use of celecoxib was associated with a 2.26‐fold increased risk of myocardial infarction when compared with placebo, and a 1.88‐fold increased risk of myocardial infarction when compared with all comparator treatment groups. The published review indicated that no pharmaceutical company had any role in this systematic review (Caldwell 2006).
A 2008 systematic review of RCTs analyzing cyclooxygenase‐2 selective non‐steroidal anti‐inflammatory drugs (NSAIDs) for OA and RA included 40 RCTs (Chen 2008). Data were not presented separately for OA and RA. The summary conclusion for both diseases was that celecoxib in doses ranging from 200 mg to 800 mg per day, compared with non‐selective NSAIDs, has equal benefit and superior gastro‐intestinal tolerability, but statistically significant higher risk of myocardial infarction (RR 1.77, 95% CI 1.00 to 3.11). This study was conducted by NIHR Health Technology Assessment program (Chen 2008).
A 2012 systematic review of RCTs analyzing the benefit of etoricoxib, celecoxib, lumiracoxib, non‐selective NSAIDs, and acetaminophen in OA showed that celecoxib 200 mg was more efficacious than placebo for pain and physical function. Comparisons of celecoxib with active comparators were less clear. This systematic review was focused mainly on etoricoxib and was sponsored by Merck (Stam 2012).
In 2013, a meta‐analysis of vascular and upper gastro‐intestinal effects of NSAIDs, based on individual participant data (IPD) from randomized trials, was published (CNT 2013). CNT 2013 included data from trials that analyzed daily celecoxib doses of 100 mg, 200 mg, 400 mg and 800 mg daily. The IPD analysis found that celecoxib statistically significantly increased the risk of major cardiovascular events (RR 1.36, 95% CI 1.00 to 1.84), with smaller proportional additional risk of major vascular events with lower celecoxib doses in placebo‐controlled trials. The study also found that the higher doses of celecoxib yield larger proportional excesses in risk of ulcers. The conclusion was that although there was a trend towards less risk with lower celecoxib doses, the vascular effects of celecoxib 200 mg daily (the most widely used coxib regimen) were statistically uncertain. This analysis was funded by the UK Medical Research Council and British Heart Foundation (CNT 2013).
A 2016 network meta‐analysis assessed the effectiveness of NSAIDs for the treatment of knee and hip pain in people with osteoarthritis (Da Costa 2016). Da Costa 2016 included 74 RCTs analyzing NSAIDs and paracetamol. Celecoxib 200 mg/day was the most frequently investigated intervention, with the most randomized participants. The network meta‐analysis concluded that diclofenac at the maximum daily dose of 150 mg was the most effective intervention for the treatment of pain and physical disability in osteoarthritis, and superior to the maximum doses of frequently used NSAIDs, including ibuprofen, naproxen, and celecoxib (Da Costa 2016). In this systematic review, we found only two studies that directly compared diclofenac 150 mg/day with celecoxib 200 mg/day (Emery 2008; McKenna 2001b). Both studies included data for only some of the outcomes of interest for this review, and indicated that there were no difference between celecoxib and diclofenac in pain at six weeks, but diclofenac 150 mg/day was better in reducing pain on walking at 12 weeks. There was no difference in physical function or harms outcomes. Furthermore, Da Costa 2016 reported that although celecoxib 200 mg/day improved osteoarthritic pain and physical function outcomes when compared with placebo, there was no statistical evidence to support minimum clinically important effect for both outcomes (Da Costa 2016). We reached the same conclusion in this systematic review; although celecoxib 200 mg/day was statistically superior than placebo, absolute improvement of 3% for pain and 4% for physical function is unlikely to be clinically significant.
In conclusion, benefit data on celecoxib versus placebo and active comparators are in line with previous systematic reviews. Harms analyses in this review indicate higher numbers of serious adverse events, major gastro‐intestinal and cardiovascular events in celecoxib‐treated participants, but without statistically significant differences compared with placebo or active comparators – probably due to few participants with these events.
Risk of bias graph: review authors' judgements about each risk of bias item presented as percentages across all included studies
Risk of bias summary: review authors' judgements about each risk of bias item for each included study
Funnel plot of comparison: 1 Celecoxib versus placebo, outcome: 1.3 Number withdrawn due to adverse events.
Funnel plot of comparison: 1 Celecoxib versus placebo, outcome: 1.4 Number experiencing any serious adverse events.

Comparison 1 Celecoxib versus placebo, Outcome 1 Pain.

Comparison 1 Celecoxib versus placebo, Outcome 2 Physical function.

Comparison 1 Celecoxib versus placebo, Outcome 3 Number withdrawn due to adverse events.

Comparison 1 Celecoxib versus placebo, Outcome 4 Number experiencing any serious adverse events.
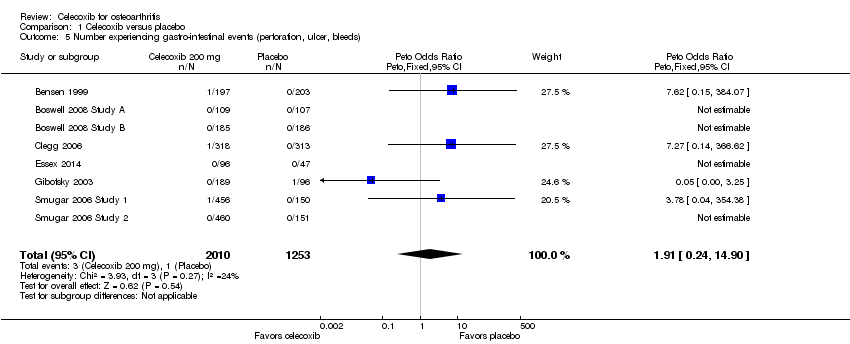
Comparison 1 Celecoxib versus placebo, Outcome 5 Number experiencing gastro‐intestinal events (perforation, ulcer, bleeds).

Comparison 1 Celecoxib versus placebo, Outcome 6 Number experiencing cardiovascular events (myocardial infarction, stroke).

Comparison 2 Celecoxib versus tNSAIDs, Outcome 1 Pain.

Comparison 2 Celecoxib versus tNSAIDs, Outcome 2 Physical function.

Comparison 2 Celecoxib versus tNSAIDs, Outcome 3 Number withdrawn due to adverse events.

Comparison 2 Celecoxib versus tNSAIDs, Outcome 4 Number experiencing any serious adverse events.

Comparison 2 Celecoxib versus tNSAIDs, Outcome 5 Number experiencing gastro‐intestinal events (perforation, ulcer, bleeds).

Comparison 2 Celecoxib versus tNSAIDs, Outcome 6 Number experiencing cardiovascular events (myocardial infarction, stroke).

Comparison 3 Celecoxib versus placebo (all eligible studies), Outcome 1 All pain < 24 weeks.
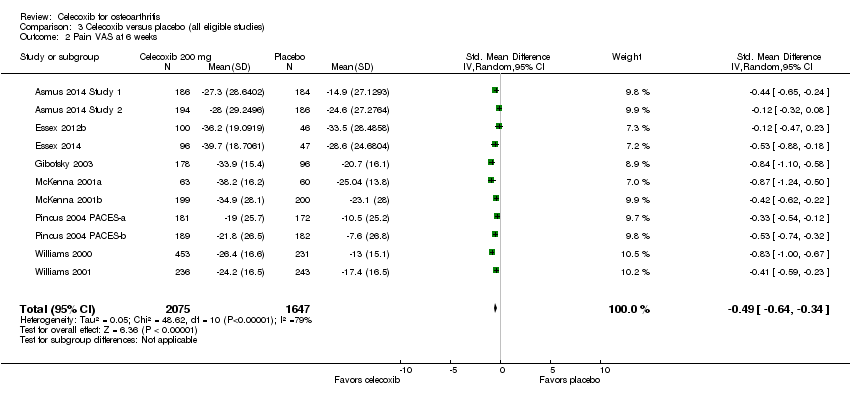
Comparison 3 Celecoxib versus placebo (all eligible studies), Outcome 2 Pain VAS at 6 weeks.

Comparison 3 Celecoxib versus placebo (all eligible studies), Outcome 3 Pain VAS at 12 weeks.
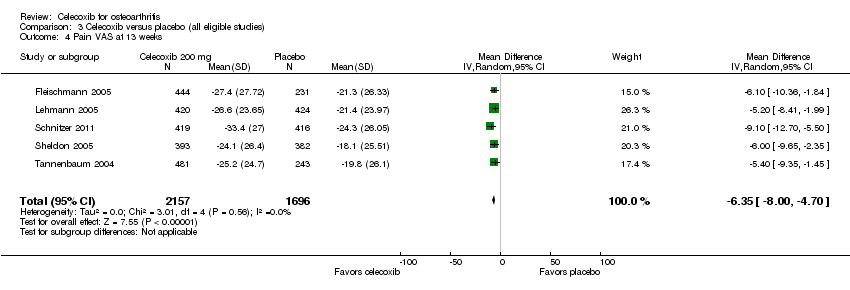
Comparison 3 Celecoxib versus placebo (all eligible studies), Outcome 4 Pain VAS at 13 weeks.

Comparison 3 Celecoxib versus placebo (all eligible studies), Outcome 5 Pain on walking VAS at 6 weeks.

Comparison 3 Celecoxib versus placebo (all eligible studies), Outcome 6 Pain on walking WOMAC at 12 weeks.
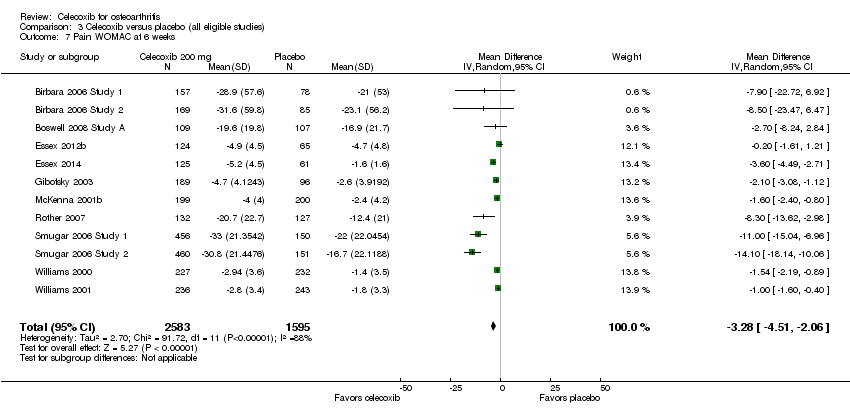
Comparison 3 Celecoxib versus placebo (all eligible studies), Outcome 7 Pain WOMAC at 6 weeks.

Comparison 3 Celecoxib versus placebo (all eligible studies), Outcome 8 Pain WOMAC at 12 weeks.

Comparison 3 Celecoxib versus placebo (all eligible studies), Outcome 9 Pain WOMAC at 13 weeks.

Comparison 3 Celecoxib versus placebo (all eligible studies), Outcome 10 Pain WOMAC at 24 weeks.

Comparison 3 Celecoxib versus placebo (all eligible studies), Outcome 11 All physical function < 24 weeks.

Comparison 3 Celecoxib versus placebo (all eligible studies), Outcome 12 Physical function WOMAC at 6 weeks.

Comparison 3 Celecoxib versus placebo (all eligible studies), Outcome 13 Physical function WOMAC at 12 weeks.

Comparison 3 Celecoxib versus placebo (all eligible studies), Outcome 14 Physical function WOMAC at 13 weeks.

Comparison 3 Celecoxib versus placebo (all eligible studies), Outcome 15 Physical function WOMAC at 24 weeks.

Comparison 3 Celecoxib versus placebo (all eligible studies), Outcome 16 Quality of life: SF‐36 physical component scores.

Comparison 3 Celecoxib versus placebo (all eligible studies), Outcome 17 Quality of life: SF‐36 mental component scores.

Comparison 3 Celecoxib versus placebo (all eligible studies), Outcome 18 Number of responders with at least 50% improvement in WOMAC pain.

Comparison 3 Celecoxib versus placebo (all eligible studies), Outcome 19 Number withdrawn due to adverse events.

Comparison 3 Celecoxib versus placebo (all eligible studies), Outcome 20 Number experiencing any serious adverse events.

Comparison 3 Celecoxib versus placebo (all eligible studies), Outcome 21 Number experiencing gastro‐intestinal events (perforation, ulcer, bleeds).

Comparison 3 Celecoxib versus placebo (all eligible studies), Outcome 22 Number experiencing cardiovascular events (myocardial infarction, stroke).

Comparison 4 Celecoxib versus tNSAIDs (all eligible studies), Outcome 1 All pain under 24 weeks.

Comparison 4 Celecoxib versus tNSAIDs (all eligible studies), Outcome 2 All pain over 24 weeks.
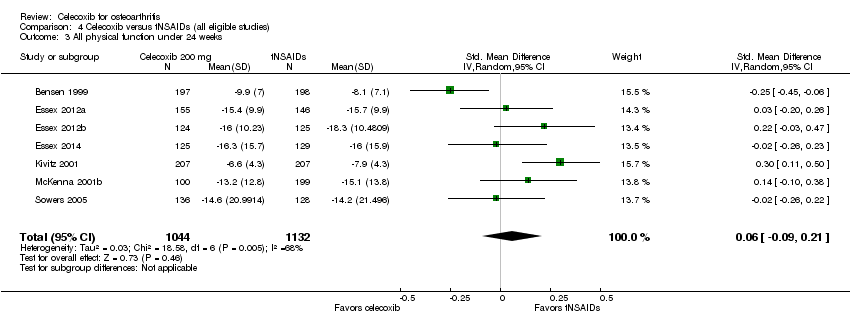
Comparison 4 Celecoxib versus tNSAIDs (all eligible studies), Outcome 3 All physical function under 24 weeks.

Comparison 4 Celecoxib versus tNSAIDs (all eligible studies), Outcome 4 Number withdrawn due to adverse events.

Comparison 4 Celecoxib versus tNSAIDs (all eligible studies), Outcome 5 Number experiencing any serious adverse events.

Comparison 4 Celecoxib versus tNSAIDs (all eligible studies), Outcome 6 Number experiencing gastro‐intestinal events (perforation, ulcer, bleeds).

Comparison 4 Celecoxib versus tNSAIDs (all eligible studies), Outcome 7 Number experiencing cardiovascular events (myocardial infarction, stroke).

Comparison 5 Celecoxib versus naproxen 1000 mg, Outcome 1 All pain ≤ 24 weeks.

Comparison 5 Celecoxib versus naproxen 1000 mg, Outcome 2 Pain VAS at 6 weeks.

Comparison 5 Celecoxib versus naproxen 1000 mg, Outcome 3 Pain VAS at 12 weeks.

Comparison 5 Celecoxib versus naproxen 1000 mg, Outcome 4 Pain WOMAC at 6 weeks.

Comparison 5 Celecoxib versus naproxen 1000 mg, Outcome 5 Pain WOMAC at 12 weeks.

Comparison 5 Celecoxib versus naproxen 1000 mg, Outcome 6 Pain WOMAC at 6 months.

Comparison 5 Celecoxib versus naproxen 1000 mg, Outcome 7 All physical function ≤ 24 weeks.

Comparison 5 Celecoxib versus naproxen 1000 mg, Outcome 8 Physical function WOMAC at 6 weeks.

Comparison 5 Celecoxib versus naproxen 1000 mg, Outcome 9 Physical function WOMAC at 12 weeks.

Comparison 5 Celecoxib versus naproxen 1000 mg, Outcome 10 Physical function WOMAC at 6 months.

Comparison 5 Celecoxib versus naproxen 1000 mg, Outcome 11 Number withdrawn due to adverse events.
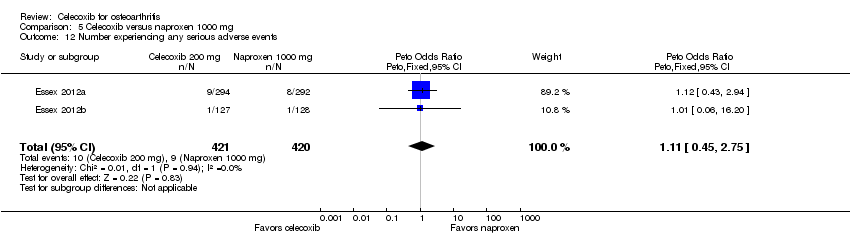
Comparison 5 Celecoxib versus naproxen 1000 mg, Outcome 12 Number experiencing any serious adverse events.

Comparison 5 Celecoxib versus naproxen 1000 mg, Outcome 13 Number experiencing gastro‐intestinal events (perforation, ulcer, bleeds).

Comparison 6 Celecoxib versus diclofenac 100 mg, Outcome 1 Pain VAS at 1 year.

Comparison 6 Celecoxib versus diclofenac 100 mg, Outcome 2 Number withdrawn due to adverse events.

Comparison 6 Celecoxib versus diclofenac 100 mg, Outcome 3 Number experiencing any serious adverse events.

Comparison 6 Celecoxib versus diclofenac 100 mg, Outcome 4 Number experiencing gastro‐intestinal events (perforation, ulcer, bleeds).

Comparison 6 Celecoxib versus diclofenac 100 mg, Outcome 5 Number experiencing cardiovascular events (myocardial infarction, stroke).

Comparison 7 Celecoxib versus diclofenac 150 mg, Outcome 1 Pain VAS at 6 weeks.

Comparison 7 Celecoxib versus diclofenac 150 mg, Outcome 2 Pain WOMAC at 6 weeks.
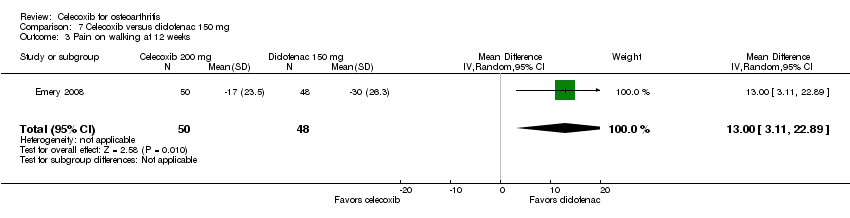
Comparison 7 Celecoxib versus diclofenac 150 mg, Outcome 3 Pain on walking at 12 weeks.

Comparison 7 Celecoxib versus diclofenac 150 mg, Outcome 4 Physical function WOMAC at 6 weeks.

Comparison 7 Celecoxib versus diclofenac 150 mg, Outcome 5 Number withdrawn due to adverse events.

Comparison 7 Celecoxib versus diclofenac 150 mg, Outcome 6 Number experiencing any serious adverse events.

Comparison 7 Celecoxib versus diclofenac 150 mg, Outcome 7 Number experiencing gastro‐intestinal events (perforation, ulcer, bleeds).
| Patient or population: osteoarthritis | ||||||
| Outcomes | Anticipated absolute effects* (95% CI) | Relative effect | № of participants | Quality of the evidence | Comments | |
| Risk with placebo | Risk with celecoxib | |||||
| Pain | The mean pain was 136 | The mean pain in the intervention group was 16 lower (9 lower to 24 lower) 1 | ‐ | 1622 | ⊕⊕⊕⊕ | 3% absolute improvement (95% CI 2% to 5%)1, 12% relative improvement (95% CI 7% to 18% improvement), SMD ‐0.22 (‐0.32 to ‐0.12), NNTB 11 (7 to 18) 2 |
| Physical function | The mean physical function was 540 | The mean physical function in the intervention group was 64 lower (26 lower to 101 lower) 3 | ‐ | 1622 | ⊕⊕⊕⊕ | 4% absolute improvement (95% CI 2% to 6% improvement)3, 12% relative improvement (95% CI 5% to 19% improvement), SMD ‐0.17 (‐0.27 to ‐0.07), NNTB 14 (9 to 34) 2 |
| Quality of life | not estimable | see comment | ‐ | (0 RCTs) | No included studies measured this outcome | |
| Number withdrawn due to adverse events | 57 per 1000 | 55 per 1000 | Peto OR 0.99 | 10996 | ⊕⊕⊕⊝ | 0% absolute change (95% CI 1% less to 1% more), 1% relative change (95% CI 15% less to 15% more) (NNTH = NA) |
| Number experiencing any serious adverse events | 10 per 1000 | 10 per 1000 | Peto OR 0.95 | 10926 | ⊕⊝⊝⊝ | 0% absolute change (95% CI 0% to 0%), 5% relative change (95% CI 34% less to 36% more) (NNTH = NA) |
| Number experiencing gastro‐intestinal events (perforation, ulcer, bleeds) | 1 per 1000 | 1 per 1000 | Peto OR 1.91 | 3263 | ⊕⊝⊝⊝ | 0% absolute change (95% CI 0% less to 1% more), 91% relative change (95% CI 76% less to 1390% more) (NNTH = NA) |
| Number experiencing cardiovascular events (myocardial infarction, stroke) | 1 per 1000 | 7 per 1000 | Peto OR 3.40 | 2112 | ⊕⊝⊝⊝ | 0% absolute change (95% CI 0% less to 1% more), 240% relative change (95% CI 27% less to 1488% more) (NNTH = NA) |
| *The risk in the intervention group (and its 95% confidence interval) is based on the assumed risk in the comparison group and the relative effect of the intervention (and its 95% CI). | ||||||
| GRADE Working Group grades of evidence | ||||||
| ¹ Calculations based on control group SD for pain of 74.2 (from Clegg 2006); to obtain absolute change, the following formula was used: SMD x SD/500 ² Number needed to treat for an additional beneficial outcome (NNTB) for continuous outcomes calculated using the Wells calculator (from the CMSG Editorial office http://musculoskeletal.cochrane.org/) ³ Calculations based on control group SD for pain of 374.1 (from Clegg 2006); to obtain absolute change, the following formula was used: SMD x SD/500 ⁴ Downgraded one level due to study limitations (all trials had high or unclear risk of at least one type of bias (harms outcomes included all eligible studies)) ⁵ Downgraded two levels for serious imprecision (few events and wide confidence intervals) ⁶ Report Peto OR which can be interpreted as an RR due to the low event rate | ||||||
| Patient or population: osteoarthritis | ||||||
| Outcomes | Anticipated absolute effects* (95% CI) | Relative effect | № of participants | Quality of the evidence | Comments | |
| Risk with tNSAIDs | Risk with celecoxib | |||||
| Pain | The mean pain was 41 points | The mean pain in the intervention group was 4.52 points lower (10.65 lower to 1.61 higher) | ‐ | 1180 | ⊕⊕⊕⊝ | 5% absolute improvement (95% CI 11% improvement to 2% worse), 11% relative improvement (95% CI 26% improvement to 4% worse), MD ‐4.52 (‐10.65 to 1.61) |
| Physical function | The mean physical function was 37 points | The mean physical function in the intervention group was 6 points lower (0.6 lower to 11 lower) | ‐ | 264 | ⊕⊕⊕⊝ | 6% absolute improvement (95% CI 6% to 11% improvement), 16% relative improvement (95% CI 2% to 30% improvement), MD: ‐6 (‐11.4 to ‐0.6), NNTB 9 (5 to 121) 2 |
| Quality of life | not estimable | see comment | ‐ | (0 study) | no included studies measured this outcome | |
| Number withdrawn due to adverse events | 74 per 1000 | 72 per 1000 | Peto OR 0.97 | 3150 | ⊕⊕⊝⊝ | 0% absolute change (95% CI 3% less to 2% more), 3% relative change (95% CI 26% less to 27% more) (NNTH = NA) |
| Number experiencing any serious adverse events | 68 per 1000 | 63 per 1000 | Peto OR 0.92 | 2404 | ⊕⊝⊝⊝ | 0% absolute change (95% CI 2% less to 1% more), 8% relative change (95% CI 34% less to 28% more) (NNTH = NA) |
| Number experiencing gastro‐intestinal events (perforation, ulcer, bleeds) | 6 per 1000 | 4 per 1000 | Peto OR 0.61 | 1755 | ⊕⊝⊝⊝ | 0% absolute change (95% CI 1% less to 0% more), 39% relative change (95% CI 85% less to 143% more) (NNTH = NA) |
| Number experiencing cardiovascular events (myocardial infarction, stroke) follow up: 52 weeks | 24 per 1000 | 11 per 1000 | Peto OR 0.47 | 916 | ⊕⊝⊝⊝ | 1% absolute change (95% CI 3% less to 0% more), 53% relative change (95% CI 83% less to 25% more) (NNTH = NA) |
| *The risk in the intervention group (and its 95% confidence interval) is based on the assumed risk in the comparison group and the relative effect of the intervention (and its 95% CI). | ||||||
| GRADE Working Group grades of evidence | ||||||
| ¹ Downgraded one level due to publication bias (missing data from large studies) ² Number needed to treat for an additional beneficial outcome (NNTB) for continuous outcomes calculated using the Wells calculator (from the CMSG editorial office) ³ Downgraded one level for study limitations (all trials had high or unclear risk of at least one type of bias (harms outcomes included all eligible studies)) and one level due to imprecision ⁴ Downgraded two levels for serious imprecision (few events and wide confidence intervals) ⁵ Report Peto OR which can be interpreted as an RR due to the low event rate | ||||||
| March 8, 2013: L Puljak (review author) contacted Prof Gurkirpal Singh to request missing data, because data were not shown as randomized |
| March 8, 2013: Prof Singh responds that the study protocol prespecified data analysis |
| March 8, 2013: L Puljak asked Prof Singh if raw data can be obtained |
| March 8, 2013: Prof Singh responds that data are owned by Pfizer and copies the message to 2 Pfizer employees, Manuela Berger and Gail Cawkwell |
| March 12, 2013: L Puljak writes to Manuela Berger and Gail Cawkwell, repeating the request |
| March 13, 2013: Gail Cawkwell responds, thanks for the interest, directs communication to Dr Peter Park, medical lead for Celebrex, who will “follow up [...] as soon as he returns from a business trip” |
| March 25, 2013: Since there was no response, L Puljak emailed Peter Park |
| March 25, 2013: Automatic reply received, indicating Peter Park is away until March 24 |
| March 25, 2013: Peter Park responds, asks L Puljak to file for "independent data grant application” – Investigator Initiated Research (IIR) request |
| March 29, 2013: L Puljak filed the IIR request in order to obtain summary data (means and standard deviations) for each randomized group separately |
| Shortly afterwards, a gentleman from Croatian Pfizer (Dr Lado Uglesic) called L Puljak on the office phone to ask about the identity of authors, purpose of doing this |
| April 30, 2013: Peter Park responds that a committee will meet in May to decide about the request |
| May 8, 2013: Lado Uglesic from Croatian Pfizer emails L Puljak confirmation of the IIR |
| May 8, 2013: Lado Uglesic asks L Puljak to anonymize her CV submitted with IIR application |
| May 13, 2013: Lado Uglesic confirms that the CV was successfully anonymized |
| October 18, 2013: Lado Uglesic sends email containing the following decision: “Thank you for your submission entitled Celecoxib for osteoarthritis. After careful consideration by the CELEBREX IIR Grant Review Committee, we regret to inform you that we are unable to support it at this time. We receive many promising requests and unfortunately cannot respond favourably to all of them. [...] We appreciate your interest in Pfizer’s IIR program and would be pleased to review another submission from you in the future." |
| Pain instrument | 6 weeks | 12 and 13 weeks | 24 weeks | All follow‐up times combined |
| Pain VAS | SMD = ‐0.49 (95% CI ‐0.56 to ‐0.43), P < 0.001, heterogeneity: 79% (11 studies, 3722 participants) | SMD = ‐0.37 (95% CI ‐0.43 to ‐0.30), P < 0.001, heterogeneity: 93% (6 studies, 3842 participants) | No studies reported pain VAS outcome | SMD = ‐0.43 (95% CI ‐0.48 to ‐0.38), P < 0.001, heterogeneity: 88% (17 studies, 7564 participants) |
| Pain WOMAC | SMD = ‐0.40 (95% CI ‐0.46 to ‐0.33), P < 0.001, heterogeneity: 71% (12 studies, 4718 participants) | SMD = ‐0.28 (95% CI ‐0.33 to ‐0.23), P < 0.001, heterogeneity: 19% (12 studies, 5944 participants) | SMD = ‐0.18 (95% CI ‐0.33 to ‐0.02), P = 0.03, heterogeneity: not applicable (1 study, 631 participants) | SMD = ‐0.32 (95% CI ‐0.36 to ‐0.28), P < 0.001, heterogeneity: 62% (25 studies, 10,753 participants) |
| Both instruments | SMD = ‐0.43 (95% CI ‐0.53 to ‐0.34), P < 0.001, heterogeneity: 76% (17 studies, 7900 participants) | SMD = ‐0.35 (95% CI ‐0.44 to ‐0.25), P < 0.001, heterogeneity: 81% (12 studies, 9786 participants) | SMD = ‐0.18 (95% CI ‐0.33 to ‐0.02), P = 0.03, heterogeneity: not applicable (1 study, 631 participants) | SMD = ‐0.39 (95% CI ‐0.46 to ‐0.32), P < 0.001, heterogeneity: 80% (30 studies, 18,317 participants) |
| Each cell contains the following information: Standardized mean difference (SMD), 95% confidence interval (95% CI), heterogeneity, number of studies, number of participants. Abbreviations: VAS: visual analogue scale; WOMAC: Western Ontario and McMaster Universities Arthritis Index | ||||
| Outcome or subgroup title | No. of studies | No. of participants | Statistical method | Effect size |
| 1 Pain Show forest plot | 4 | 1622 | Std. Mean Difference (IV, Random, 95% CI) | ‐0.22 [‐0.32, ‐0.12] |
| 2 Physical function Show forest plot | 4 | 1622 | Std. Mean Difference (IV, Random, 95% CI) | ‐0.17 [‐0.27, ‐0.07] |
| 3 Number withdrawn due to adverse events Show forest plot | 28 | 12965 | Peto Odds Ratio (Peto, Fixed, 95% CI) | 0.99 [0.85, 1.15] |
| 4 Number experiencing any serious adverse events Show forest plot | 28 | 13393 | Peto Odds Ratio (Peto, Fixed, 95% CI) | 0.95 [0.66, 1.36] |
| 5 Number experiencing gastro‐intestinal events (perforation, ulcer, bleeds) Show forest plot | 8 | 3263 | Peto Odds Ratio (Peto, Fixed, 95% CI) | 1.91 [0.24, 14.90] |
| 6 Number experiencing cardiovascular events (myocardial infarction, stroke) Show forest plot | 5 | 2947 | Peto Odds Ratio (Peto, Fixed, 95% CI) | 3.40 [0.73, 15.88] |
| Outcome or subgroup title | No. of studies | No. of participants | Statistical method | Effect size |
| 1 Pain Show forest plot | 2 | 1180 | Mean Difference (IV, Random, 95% CI) | ‐4.52 [‐10.65, 1.61] |
| 2 Physical function Show forest plot | 1 | 264 | Mean Difference (IV, Random, 95% CI) | ‐4.00 [‐11.40, ‐0.60] |
| 3 Number withdrawn due to adverse events Show forest plot | 8 | 3150 | Peto Odds Ratio (Peto, Fixed, 95% CI) | 0.97 [0.74, 1.27] |
| 4 Number experiencing any serious adverse events Show forest plot | 5 | 2404 | Peto Odds Ratio (Peto, Fixed, 95% CI) | 0.92 [0.66, 1.28] |
| 5 Number experiencing gastro‐intestinal events (perforation, ulcer, bleeds) Show forest plot | 4 | 1755 | Peto Odds Ratio (Peto, Fixed, 95% CI) | 0.61 [0.15, 2.43] |
| 6 Number experiencing cardiovascular events (myocardial infarction, stroke) Show forest plot | 1 | 916 | Peto Odds Ratio (Peto, Fixed, 95% CI) | 0.47 [0.17, 1.25] |
| Outcome or subgroup title | No. of studies | No. of participants | Statistical method | Effect size |
| 1 All pain < 24 weeks Show forest plot | 31 | 13069 | Std. Mean Difference (IV, Random, 95% CI) | ‐0.41 [‐0.49, ‐0.32] |
| 2 Pain VAS at 6 weeks Show forest plot | 11 | 3722 | Std. Mean Difference (IV, Random, 95% CI) | ‐0.49 [‐0.64, ‐0.34] |
| 3 Pain VAS at 12 weeks Show forest plot | 3 | 1226 | Mean Difference (IV, Random, 95% CI) | ‐11.09 [‐12.68, ‐9.50] |
| 4 Pain VAS at 13 weeks Show forest plot | 5 | 3853 | Mean Difference (IV, Random, 95% CI) | ‐6.35 [‐6.00, ‐4.70] |
| 5 Pain on walking VAS at 6 weeks Show forest plot | 4 | 1572 | Mean Difference (IV, Random, 95% CI) | ‐12.42 [‐14.83, ‐10.01] |
| 6 Pain on walking WOMAC at 12 weeks Show forest plot | 1 | 402 | Mean Difference (IV, Random, 95% CI) | 7.0 [1.73, 12.27] |
| 7 Pain WOMAC at 6 weeks Show forest plot | 12 | 4178 | Mean Difference (IV, Random, 95% CI) | ‐3.28 [‐4.51, ‐2.06] |
| 8 Pain WOMAC at 12 weeks Show forest plot | 9 | 3328 | Std. Mean Difference (IV, Random, 95% CI) | ‐0.32 [‐0.40, ‐0.23] |
| 9 Pain WOMAC at 13 weeks Show forest plot | 5 | 3853 | Mean Difference (IV, Random, 95% CI) | ‐1.06 [‐1.31, ‐0.80] |
| 10 Pain WOMAC at 24 weeks Show forest plot | 1 | 631 | Mean Difference (IV, Random, 95% CI) | ‐13.10 [‐24.69, ‐1.51] |
| 11 All physical function < 24 weeks Show forest plot | 27 | 11940 | Std. Mean Difference (IV, Random, 95% CI) | ‐0.35 [‐0.43, ‐0.27] |
| 12 Physical function WOMAC at 6 weeks Show forest plot | 12 | 4069 | Std. Mean Difference (IV, Random, 95% CI) | ‐0.31 [‐0.41, ‐0.22] |
| 13 Physical function WOMAC at 12 weeks Show forest plot | 9 | 3185 | Std. Mean Difference (IV, Random, 95% CI) | ‐0.46 [‐0.65, ‐0.26] |
| 14 Physical function WOMAC at 13 weeks Show forest plot | 5 | 3853 | Mean Difference (IV, Random, 95% CI) | ‐3.70 [‐4.67, ‐2.74] |
| 15 Physical function WOMAC at 24 weeks Show forest plot | 1 | 631 | Mean Difference (IV, Random, 95% CI) | ‐32.60 [‐81.07, 15.87] |
| 16 Quality of life: SF‐36 physical component scores Show forest plot | 1 | 402 | Mean Difference (IV, Random, 95% CI) | ‐2.2 [‐3.86, ‐0.54] |
| 17 Quality of life: SF‐36 mental component scores Show forest plot | 1 | 402 | Mean Difference (IV, Random, 95% CI) | 0.20 [‐1.46, 1.86] |
| 18 Number of responders with at least 50% improvement in WOMAC pain Show forest plot | 4 | 1816 | Risk Ratio (M‐H, Random, 95% CI) | 1.47 [1.16, 1.87] |
| 19 Number withdrawn due to adverse events Show forest plot | 28 | 12965 | Peto Odds Ratio (Peto, Fixed, 95% CI) | 0.99 [0.85, 1.15] |
| 20 Number experiencing any serious adverse events Show forest plot | 28 | 13393 | Peto Odds Ratio (Peto, Fixed, 95% CI) | 0.95 [0.66, 1.36] |
| 21 Number experiencing gastro‐intestinal events (perforation, ulcer, bleeds) Show forest plot | 8 | 3263 | Peto Odds Ratio (Peto, Fixed, 95% CI) | 1.91 [0.24, 14.90] |
| 22 Number experiencing cardiovascular events (myocardial infarction, stroke) Show forest plot | 5 | 2947 | Peto Odds Ratio (Peto, Fixed, 95% CI) | 3.40 [0.73, 15.88] |
| Outcome or subgroup title | No. of studies | No. of participants | Statistical method | Effect size |
| 1 All pain under 24 weeks Show forest plot | 8 | 2277 | Std. Mean Difference (IV, Random, 95% CI) | 0.00 [‐0.10, 0.10] |
| 2 All pain over 24 weeks Show forest plot | 1 | 916 | Mean Difference (IV, Random, 95% CI) | ‐2.0 [‐5.32, 1.32] |
| 3 All physical function under 24 weeks Show forest plot | 7 | 2176 | Std. Mean Difference (IV, Random, 95% CI) | 0.06 [‐0.09, 0.21] |
| 4 Number withdrawn due to adverse events Show forest plot | 9 | 3739 | Peto Odds Ratio (Peto, Fixed, 95% CI) | 0.85 [0.68, 1.07] |
| 5 Number experiencing any serious adverse events Show forest plot | 5 | 2404 | Peto Odds Ratio (Peto, Fixed, 95% CI) | 0.92 [0.66, 1.28] |
| 6 Number experiencing gastro‐intestinal events (perforation, ulcer, bleeds) Show forest plot | 4 | 1755 | Peto Odds Ratio (Peto, Fixed, 95% CI) | 0.61 [0.15, 2.43] |
| 7 Number experiencing cardiovascular events (myocardial infarction, stroke) Show forest plot | 1 | 916 | Peto Odds Ratio (Peto, Fixed, 95% CI) | 0.47 [0.17, 1.25] |
| Outcome or subgroup title | No. of studies | No. of participants | Statistical method | Effect size |
| 1 All pain ≤ 24 weeks Show forest plot | 6 | 1781 | Std. Mean Difference (IV, Random, 95% CI) | ‐0.04 [‐0.14, 0.05] |
| 2 Pain VAS at 6 weeks Show forest plot | 2 | 398 | Mean Difference (IV, Random, 95% CI) | 0.55 [‐3.97, 5.07] |
| 3 Pain VAS at 12 weeks Show forest plot | 3 | 975 | Mean Difference (IV, Random, 95% CI) | ‐0.97 [‐2.69, 0.76] |
| 4 Pain WOMAC at 6 weeks Show forest plot | 2 | 503 | Mean Difference (IV, Random, 95% CI) | 0.35 [‐0.54, 1.23] |
| 5 Pain WOMAC at 12 weeks Show forest plot | 3 | 1073 | Mean Difference (IV, Random, 95% CI) | ‐0.03 [‐0.65, 0.60] |
| 6 Pain WOMAC at 6 months Show forest plot | 1 | 310 | Mean Difference (IV, Random, 95% CI) | 0.10 [‐0.46, 0.66] |
| 7 All physical function ≤ 24 weeks Show forest plot | 6 | 1817 | Std. Mean Difference (IV, Random, 95% CI) | ‐0.01 [‐0.18, 0.16] |
| 8 Physical function WOMAC at 6 weeks Show forest plot | 2 | 313 | Mean Difference (IV, Random, 95% CI) | ‐2.99 [‐6.43, 0.44] |
| 9 Physical function WOMAC at 12 weeks Show forest plot | 3 | 1073 | Mean Difference (IV, Random, 95% CI) | ‐1.27 [‐4.32, 1.78] |
| 10 Physical function WOMAC at 6 months Show forest plot | 1 | 301 | Mean Difference (IV, Random, 95% CI) | 0.30 [‐1.94, 2.54] |
| 11 Number withdrawn due to adverse events Show forest plot | 6 | 2173 | Odds Ratio (M‐H, Random, 95% CI) | 0.81 [0.54, 1.23] |
| 12 Number experiencing any serious adverse events Show forest plot | 2 | 841 | Peto Odds Ratio (Peto, Fixed, 95% CI) | 1.11 [0.45, 2.75] |
| 13 Number experiencing gastro‐intestinal events (perforation, ulcer, bleeds) Show forest plot | 2 | 587 | Peto Odds Ratio (Peto, Fixed, 95% CI) | 0.37 [0.05, 2.62] |
| Outcome or subgroup title | No. of studies | No. of participants | Statistical method | Effect size |
| 1 Pain VAS at 1 year Show forest plot | 1 | 916 | Mean Difference (IV, Random, 95% CI) | ‐2.0 [‐5.32, 1.32] |
| 2 Number withdrawn due to adverse events Show forest plot | 1 | 916 | Peto Odds Ratio (Peto, Fixed, 95% CI) | 1.44 [0.80, 2.61] |
| 3 Number experiencing any serious adverse events Show forest plot | 1 | 916 | Odds Ratio (M‐H, Random, 95% CI) | 0.90 [0.62, 1.30] |
| 4 Number experiencing gastro‐intestinal events (perforation, ulcer, bleeds) Show forest plot | 1 | 916 | Peto Odds Ratio (Peto, Fixed, 95% CI) | 0.14 [0.01, 2.16] |
| 5 Number experiencing cardiovascular events (myocardial infarction, stroke) Show forest plot | 1 | 916 | Peto Odds Ratio (Peto, Fixed, 95% CI) | 0.47 [0.17, 1.25] |
| Outcome or subgroup title | No. of studies | No. of participants | Statistical method | Effect size |
| 1 Pain VAS at 6 weeks Show forest plot | 1 | 398 | Mean Difference (IV, Random, 95% CI) | 1.90 [‐3.68, 7.48] |
| 2 Pain WOMAC at 6 weeks Show forest plot | 1 | 398 | Mean Difference (IV, Random, 95% CI) | 0.30 [‐0.52, 1.12] |
| 3 Pain on walking at 12 weeks Show forest plot | 1 | 98 | Mean Difference (IV, Random, 95% CI) | 13.0 [3.11, 22.89] |
| 4 Physical function WOMAC at 6 weeks Show forest plot | 1 | 398 | Mean Difference (IV, Random, 95% CI) | 1.90 [‐0.72, 4.52] |
| 5 Number withdrawn due to adverse events Show forest plot | 2 | 650 | Peto Odds Ratio (Peto, Fixed, 95% CI) | 0.78 [0.46, 1.32] |
| 6 Number experiencing any serious adverse events Show forest plot | 2 | 647 | Peto Odds Ratio (Peto, Fixed, 95% CI) | 0.79 [0.21, 2.93] |
| 7 Number experiencing gastro‐intestinal events (perforation, ulcer, bleeds) Show forest plot | 1 | 252 | Peto Odds Ratio (Peto, Fixed, 95% CI) | 7.45 [0.46, 119.74] |