Pressure support versus T‐tube for weaning from mechanical ventilation in adults
Abstract
Background
Mechanical ventilation is important in caring for patients with critical illness. Clinical complications, increased mortality, and high costs of health care are associated with prolonged ventilatory support or premature discontinuation of mechanical ventilation. Weaning refers to the process of gradually or abruptly withdrawing mechanical ventilation. The weaning process begins after partial or complete resolution of the underlying pathophysiology precipitating respiratory failure and ends with weaning success (successful extubation in intubated patients or permanent withdrawal of ventilatory support in tracheostomized patients).
Objectives
To evaluate the effectiveness and safety of two strategies, a T‐tube and pressure support ventilation, for weaning adult patients with respiratory failure that required invasive mechanical ventilation for at least 24 hours, measuring weaning success and other clinically important outcomes.
Search methods
We searched the following electronic databases: Cochrane Central Register of Controlled Trials (CENTRAL) (The Cochrane Library 2012, Issue 6); MEDLINE (via PubMed) (1966 to June 2012); EMBASE (January 1980 to June 2012); LILACS (1986 to June 2012); CINAHL (1982 to June 2012); SciELO (from 1997 to August 2012); thesis repository of CAPES (Coordenação de Aperfeiçoamento de Pessoal de Nível Superior) (http://capesdw.capes.gov.br/capesdw/) (August 2012); and Current Controlled Trials (August 2012).
We reran the search in December 2013. We will deal with any studies of interest when we update the review.
Selection criteria
We included randomized controlled trials (RCTs) that compared a T‐tube with pressure support (PS) for the conduct of spontaneous breathing trials and as methods of gradual weaning of adult patients with respiratory failure of various aetiologies who received invasive mechanical ventilation for at least 24 hours.
Data collection and analysis
Two authors extracted data and assessed the methodological quality of the included studies. Meta‐analyses using the random‐effects model were conducted for nine outcomes. Relative risk (RR) and mean difference (MD) or standardized mean difference (SMD) were used to estimate the treatment effect, with 95% confidence intervals (CI).
Main results
We included nine RCTs with 1208 patients; 622 patients were randomized to a PS spontaneous breathing trial (SBT) and 586 to a T‐tube SBT. The studies were classified into three categories of weaning: simple, difficult, and prolonged. Four studies placed patients in two categories of weaning. Pressure support ventilation (PSV) and a T‐tube were used directly as SBTs in four studies (844 patients, 69.9% of the sample). In 186 patients (15.4%) both interventions were used along with gradual weaning from mechanical ventilation; the PS was gradually decreased, twice a day, until it was minimal and periods with a T‐tube were gradually increased to two and eight hours for patients with difficult and prolonged weaning. In two studies (14.7% of patients) the PS was lowered to 2 to 4 cm H2O and 3 to 5 cm H2O based on ventilatory parameters until the minimal PS levels were reached. PS was then compared to the trial with the T‐tube (TT).
We identified 33 different reported outcomes in the included studies; we took 14 of them into consideration and performed meta‐analyses on nine. With regard to the sequence of allocation generation, allocation concealment, selective reporting and attrition bias, no study presented a high risk of bias. We found no clear evidence of a difference between PS and TT for weaning success (RR 1.07, 95% CI 0.97 to 1.17, 9 studies, low quality of evidence), intensive care unit (ICU) mortality (RR 0.81, 95% CI 0.53 to 1.23, 5 studies, low quality of evidence), reintubation (RR 0.92, 95% CI 0.66 to 1.26, 7 studies, low quality evidence), ICU and long‐term weaning unit (LWU) length of stay (MD ‐7.08 days, 95% CI ‐16.26 to 2.1, 2 studies, low quality of evidence) and pneumonia (RR 0.67, 95% CI 0.08 to 5.85, 2 studies, low quality of evidence). PS was significantly superior to the TT for successful SBTs (RR 1.09, 95% CI 1.02 to 1.17, 4 studies, moderate quality of evidence). Four studies reported on weaning duration, however we were unable to combined the study data because of differences in how the studies presented their data. One study was at high risk of other bias and four studies were at high risk for detection bias. Three studies reported that the weaning duration was shorter with PS, and in one study the duration was shorter in patients with a TT.
Authors' conclusions
To date, we have found evidence of generally low quality from studies comparing pressure support ventilation (PSV) and with a T‐tube. The effects on weaning success, ICU mortality, reintubation, ICU and LWU length of stay, and pneumonia were imprecise. However, PSV was more effective than a T‐tube for successful spontaneous breathing trials (SBTs) among patients with simple weaning. Based on the findings of single trials, three studies presented a shorter weaning duration in the group undergoing PS SBT, however a fourth study found a shorter weaning duration with a T‐tube.
PICOs
Plain language summary
Weaning from mechanical ventilation using pressure support or a T‐tube for a spontaneous breathing trial
Patients with severe lung disease, such as acute respiratory failure, may require invasive mechanical ventilation through an endotracheal tube or tracheostomy until their underlying disease is either treated or stabilized. Both early suspension of or delay in withdrawing mechanical ventilation can however lead to complications that may delay the weaning of patients from mechanical ventilation and prolong their length of stay in the intensive care unit (ICU) and hospital. Previous studies and systematic reviews suggest that a weaning protocol should be implemented in order to make daily assessments of patients who may be ready for weaning from mechanical ventilation. The ability to breathe spontaneously can be assessed with a spontaneous breathing trial using a T‐tube (T‐piece) or by reducing the applied airway pressure to provide low levels of pressure support (PS) (5 to 10 cm H2O). After removal of the endotracheal tube (extubation) the patients are monitored for 48 hours. If over this period ventilatory support does not need to be reintroduced, this is taken to indicate successful weaning. For this Cochrane systematic review we searched the medical literature databases until June 2012 and included nine studies with 1208 adult patients who had been on invasive mechanical ventilation for at least 24 hours. The trials compared pressure support (PS) and the use of a T‐tube (622 patients randomized to PS and 586 randomized to a T‐tube). There was no clear evidence to confirm that PS was superior to a T‐tube with regard to the success of weaning, need for reintubation, ICU mortality, and other factors including long‐term weaning unit (LWU) length of stay, pneumonia and a rapid shallow breathing index. Among patients who received PS, a greater number of patients had a successful spontaneous breathing trial and the airway tube was removed. For respiratory rate and tidal volume outcomes PS was superior to using a T‐tube in two trials. Three studies reported that the weaning duration was shorter during PS, and in one study in which patients submitted to a T‐tube the weaning time was shorter. Because of limitations in the design of the studies and imprecision in the effect estimates we have rated the quality of the evidence to be low. We reran the search in December 2013. We will deal with any studies of interest when we update the review.
Authors' conclusions
Summary of findings
| Pressure support versus T‐tube for weaning from mechanical ventilation in adults | ||||||
| Patient or population: patients on weaning from mechanical ventilation in adults. | ||||||
| Outcomes | Illustrative comparative risks* (95% CI) | Relative effect | No of Participants | Quality of the evidence | Comments | |
| Assumed risk | Corresponding risk | |||||
| Control | Pressure support versus T‐tube | |||||
| Weaning success | Study population | RR 1.07 | 935 | ⊕⊕⊝⊝ | The physicians need to take into consideration the age, baseline disease, duration of mechanical ventilation before weaning | |
| 730 per 1000 | 781 per 1000 | |||||
| Low | ||||||
| 600 per 1000 | 642 per 1000 | |||||
| High | ||||||
| 950 per 1000 | 1000 per 1000 | |||||
| ICU mortality | Study population | RR 0.81 | 725 | ⊕⊕⊝⊝ | The physicians need to take into consideration the age of patients, disease severity, duration of mechanical ventilation before weaning, baseline disease (COPD), cause of respiratory failure | |
| 125 per 1000 | 101 per 1000 | |||||
| Low | ||||||
| 50 per 1000 | 41 per 1000 | |||||
| High | ||||||
| 200 per 1000 | 162 per 1000 | |||||
| Reintubation | Study population | RR 0.92 | 823 | ⊕⊕⊝⊝ | The physicians need to take into consideration the age, time of mechanical ventilation, before weaning | |
| 159 per 1000 | 146 per 1000 | |||||
| Low | ||||||
| 50 per 1000 | 46 per 1000 | |||||
| High | ||||||
| 200 per 1000 | 184 per 1000 | |||||
| ICU or LWU length of stay (days) | The mean ICU or LWU length of stay (days) in the intervention groups was | 118 | ⊕⊕⊝⊝ | The physicians need to take into consideration the age, time of mechanical ventilation, weaning process (prolonged weaning) and baseline disease | ||
| Pneumonia | Study population | RR 0.67 | 118 | ⊕⊝⊝⊝ | The physicians need to take into consideration the time of mechanical ventilation | |
| 82 per 1000 | 55 per 1000 | |||||
| Low | ||||||
| 10 per 1000 | 7 per 1000 | |||||
| High | ||||||
| 200 per 1000 | 134 per 1000 | |||||
| Successful spontaneous breathing trial | Study population | RR 1.09 | 940 | ⊕⊕⊕⊝ | The physicians need to take into consideration the time of mechanical ventilation, age of patients, disease severity | |
| 732 per 1000 | 798 per 1000 | |||||
| Low | ||||||
| 500 per 1000 | 545 per 1000 | |||||
| High | ||||||
| 800 per 1000 | 872 per 1000 | |||||
| *The basis for the assumed risk (e.g. the median control group risk across studies) is provided in footnotes. The corresponding risk (and its 95% confidence interval) is based on the assumed risk in the comparison group and the relative effect of the intervention (and its 95% CI). | ||||||
| GRADE Working Group grades of evidence | ||||||
| 1 Two studies with high and moderate risk of bias in at least two items of methodological quality. | ||||||
Background
Description of the condition
Mechanical ventilation, while providing partial or full support to patients with respiratory failure of different aetiologies (Marini 1998), exerts important effects on global oxygen delivery and reduces the full or partial work of breathing. While enabling clinicians to support patients with respiratory failure, invasive mechanical ventilation has been shown to initiate lung injury, exacerbate pre‐existing parenchymal lung injury, and induce ultrastructural abnormalities (Marini 1998) and clinical complications. Clinical complications may include ventilator associated pneumonia (VAP) (Eggimann 2001), with a prevalence of 9 to 24 cases per 100 patients depending on the population examined (Morehead 2000); respiratory muscle weakness (Le Bourdelles 1994; Levine 2008; Powers 2002); sinusitis (van Zanten 2005) (with a higher incidence in nasotracheal than in orotracheal intubation) (Michelson 1991); barotrauma (Baeza 1975; Petersen 1983); gastrointestinal bleeding (Pingleton 1988; Schuster 1984) and critical illness polyneuropathy (CIP) (Garnacho‐Montero2005). These complications have in turn been associated with failure to wean from mechanical ventilation, prolonged duration of intubation and hospital stay (Combes 2003; Rello 1991) and increased intensive care unit (ICU) mortality (Esteban 2002; Fagon 1996).
Early recognition of weaning candidates ready for reduction and discontinuation of ventilatory support is important in order to minimize exposure to prolonged invasive ventilation (Blackwood 2010; Ely 1996; Kollef 1997; Marelich 2000), specifically unnecessary sedation doses, increased infection risk, higher costs, morbidity and mortality (Esteban 2002). On the other hand, early withdrawal of mechanical ventilation can lead to post‐extubation failure as well as respiratory muscle fatigue, hypoxaemia, hypercapnia, and the risk of complications during reintubation procedures, which are associated with increased ICU stay and mortality (Epstein 1997).
Weaning refers to the process of gradually or abruptly withdrawing mechanical ventilation. The weaning process begins after partial or complete resolution of the underlying pathophysiology that precipitated respiratory failure and ends with weaning success (successful extubation in intubated patients or permanent withdrawal of ventilatory support in tracheostomized patients) (Boles 2007). The weaning duration extends to 41% of the total time of mechanical ventilation (MV); in patients with chronic obstructive pulmonary disease (COPD) and cardiac failure, the weaning duration can reach 59% and 48% of the total time of MV, respectively (Esteban 1994). Over the past decade, scientific investigations have focused on strategies to limit the duration of invasive ventilation, including daily withdrawal of sedation (Girard 2008; Luetz 2012), assessment of physiologic criteria or 'weaning parameters', spontaneous breathing trials (SBTs) (Esteban 1997) and methods to reduce support in patients who fail a SBT (Brochard 1994; Esen 1992; Esteban 1995; MacIntyre 2001). Most weaning parameters, individually or in combination, are evaluated while the patient is receiving MV. Such evaluations assess the strength of the respiratory muscles, gas exchange, and comfort and are used to identify early candidates who are 'ready to wean' (Epstein 2000; Epstein 2001), that is, those capable of maintaining spontaneous breathing (Ely 1996; Kollef 1997; Marelich 2000).
Several studies have demonstrated that while the majority of patients (69% to 75%) satisfying 'readiness criteria' will tolerate an initial SBT, only a minority of patients require a more gradual withdrawal of invasive ventilation (Caroleo 2007; Peňuelas 2011). Patients are classified into three categories according to the difficulty and length of the weaning process: simple weaning, encompassing patients who are successfully extubated on the first SBT; difficult weaning, encompassing patients who require up to three SBTs or until seven days of MV after the first attempt to achieve weaning success; and prolonged weaning, encompassing the patients who fail three SBTs or remain on invasive ventilatory support for over seven days after the first SBT (Boles 2007; Tonnelier 2011).
Description of the intervention
The ability to breathe spontaneously can be assessed by means of a SBT (Boles 2007; MacIntyre 2012). Several studies have investigate the best technique for performing a SBT; the most common modes include: synchronized intermittent mechanical ventilation (SIMV), continuous positive airway pressure (CPAP), automatic tube compensation (ATC), pressure support ventilation (PSV) and T‐tube (T‐piece). Several reviews (Alia 2000; Butler 1999; Cook 2000; Caroleo 2007; Meade 2001), reported that SIMV is the method least preferred for weaning patients from mechanical ventilation, and the use of this method has thus reduced to 1.6% (Esteban 2008). An SBT may range from 30 minutes to two hours in duration on simple and difficult weaning with similar outcomes when compared to one another in two randomized controlled trials (Esteban 1999; Perren 2002). In prolonged weaning patients, T‐tube for long periods or gradual reduction of PS levels can be used as weaning strategies (Vitacca 2001).
How the intervention might work
Low levels of pressure support (PS) and a T‐tube can simulate the ventilatory load after extubation and can thus be used to evaluate a patient's ability to maintain spontaneous ventilation without ventilatory support; that is, they can be employed to select patients who are ready for extubation (Boles 2007; Esteban 1997; MacIntyre 2012). In a T‐tube SBT, the patient is disconnected from the ventilator and allowed to breathe spontaneously through a simple T‐piece with supplemental oxygen. For some patients the work of breathing during the test may be excessive, causing them to fail the SBT. In PSV mode, the patients remain connected to ventilatory support and the PS minimum value (5 to 10 cm H2O) is adjusted to decrease the work of breathing imposed by the endotracheal tube during a SBT (Nathan 1993).
Why it is important to do this review
The current literature asserts that an SBT must be performed prior to extubation. Some studies say that there appears to be no difference between SBTs (PSV and T‐tube) on relevant clinical outcomes (Boles 2007; Caroleo 2007; Esteban 1997). According to MacIntyre 2012, controversies exist regarding the best techniques involved in an SBT. The T‐tube technique is used more frequently for SBTs in the simple weaning group in clinical practice (76%), while the use of PSV as an SBT has increased slightly (14%) (Esteban 2008).
Weaning from MV is an important area of research as the optimal strategy for trials to wean patients from invasive MV remains to be elucidated and as solid evidence to answer this question is lacking. In this systematic review we evaluated, synthesized and compared the best evidence for using a T‐tube (T‐piece) and PSV as SBTs and on the gradual withdrawal process aimed towards releasing invasively ventilated adults from mechanical support.
Objectives
We aimed to evaluate the effectiveness and safety of two strategies, a T‐tube and pressure support ventilation (PSV), for weaning adult patients with respiratory failure that required mechanical ventilation for at least 24 hours, measuring weaning success and other clinically important outcomes.
Methods
Criteria for considering studies for this review
Types of studies
We included all randomized controlled trials (RCTs) that compared a T‐piece with PSV for the conduct of SBTs to liberate patients from invasive ventilation.
Types of participants
We included adult patients (at least 18 years of age) with respiratory failure of various aetiologies who received invasive mechanical ventilation (MV) for at least 24 hours. We included postoperative adult patients (following cardiac surgery, neurosurgery etc.) requiring invasive ventilation for at least 24 hours.
Types of interventions
We included RCTs that compared T‐piece to invasive PS weaning.
We excluded trials that extubated patients directly to non‐invasive positive pressure ventilation (NPPV) for the purpose of weaning.
Types of outcome measures
Primary outcomes
-
Weaning success (defined as the absence of the requirement for ventilatory support within 48 hours after extubation (translaryngeal tube) or withdrawal (tracheostomy tube) of MV, or as defined by the authors)
Secondary outcomes
We included the following secondary outcomes.
-
Mortality (ICU mortality and hospital mortality, or as defined by the study authors).
-
Time of weaning from MV or weaning duration (the time from randomization to extubation).
-
Proportion requiring reintubation (as defined by the authors) or reintubation.
-
Proportion requiring tracheostomy.
-
Intensive care unit (ICU) and hospital length of stay (LOS) (the time from randomization to ICU and hospital discharge, respectively).
-
Proportion with VAP.
-
Total duration of MV (days or hours).
-
Adverse events related to weaning.
-
Quality of life.
-
Physiologic parameters, including:
a. respiratory rate (RR),
b. tidal volume (VT),
c. rapid and shallow breathing index (RSBI or RR/VT).
Outcomes defined post hoc during the review process
-
Successful spontaneous breathing trial (SBT)
Search methods for identification of studies
Electronic searches
We searched the current issue of the Cochrane Central Register of Controlled Trials (CENTRAL) (The Cochrane Library 2012, Issue 6); MEDLINE (January 1966 to June 2012); EMBASE (January 1980 to June 2012); LILACS (1986 to June 2012); CINAHL (1982 to June 2012), SciELO (from 1997 to August 2012); the thesis repository CAPES (Coordenação de Aperfeiçoamento de Pessoal de Nível Superior) (http://capesdw.capes.gov.br/capesdw/); as well as Current Controlled Trials (www.controlled‐trials.com) for RCTs meeting our inclusion criteria. Our search terms included synonyms for ventilator weaning, spontaneous breathing trial (SBT), T‐tube (or T‐piece), pressure support and respiratory failure as the clinical condition, interventions and target population of interest.
See Appendix 1 (EMBASE); Appendix 2 (CINAHL); Appendix 3 (CENTRAL); Appendix 4 (MEDLINE); Appendix 5 (LILACS); Appendix 6 (SciELO); Appendix 7 (CAPES) and Appendix 8 (Current Controlled Trials) for details of the search strategies used for each database. We utilized the Cochrane highly sensitive RCT filter for MEDLINE from the Cochrane Handbook for Systematic Reviews of Interventions 5.1.0 (Higgins 2011). We did not apply any language restrictions.
We reran the search in December 2013. We will deal with any studies of interest when we update the review.
Searching other resources
We handsearched the bibliographies of all retrieved articles and review articles to identify potentially relevant trials.
Data collection and analysis
We followed the recommendations of the Cochrane Handbook for Systematic Reviews of Interventions (Higgins 2011). Three review authors (ML, FV, and BG) are physiotherapists and clinical experts in the support of adult patients admitted to the ICU. All review authors are experts in Cochrane systematic reviews.
Selection of studies
Two authors (ML and BG) independently screened citations identified by the initial search for RCTs against the predefined inclusion criteria. Two authors (FV and RA) retrieved and reviewed the full text articles to reaffirm that the inclusion criteria were met. Disagreements were resolved through discussion with a third author (SP). Only studies containing at least two arms of interest (PS and T‐tube) were considered for inclusion in the review.
Data extraction and management
Two authors (ML and RA) independently extracted the data pertaining to participant characteristics, details of the interventions applied, and outcomes for all studies meeting the inclusion criteria. We used a data extraction form developed for this systematic review. For relevant data that were missing or not clearly reported, we contacted the first authors for the required information (see data extraction form: Appendix 9).
Assessment of risk of bias in included studies
Two authors (ML and BS) assessed each included trial for study design characteristics and features of internal validity. Two authors (ML and RA) independently assessed the methodologic quality of the included studies using the following criteria (see Risk of bias in included studies).
Was the allocation sequence adequately generated?
Yes (low risk of bias): adequate sequence generation
Unclear (moderate risk of bias): not reported in the paper or determined by contacting authors
No (high risk of bias): not adequate (quasi‐randomized studies)
Was allocation adequately concealed?
Yes (low risk of bias): adequate allocation concealment
Unclear (moderate risk of bias): not reported in the paper or by determined by contacting authors
No (high risk of bias): not adequate
Free of detection bias ?
Yes (low risk of bias): outcome assessors were independent from the individuals administering or supervising the assigned treatments
Unclear (moderate risk of bias): not reported in the paper or determined by contacting authors
No (high risk of bias): outcome assessors aware about the assigned treatments
Free of attrition bias?
Yes (low risk of bias): dropouts without substantial (statistically significant) difference between the two comparison groups or a substantial dropout rate within the sample as a whole
Unclear (moderate risk of bias): not reported in the paper or determined by contacting authors
No (high risk of bias): dropouts with substantial (statistically significant) difference between the two treatment groups or a substantial dropout rate within the sample as a whole
Free of selective reporting?
Yes (low risk of bias): reports of the study free of suggestion of selective outcome reporting
Unclear (moderate risk of bias): not reported in the paper or by contacting authors
No (high risk of bias): reports of the study with suggestion of selective outcome reporting
Free of other bias?
Yes (low risk of bias): the study appears to be free of other sources of bias
Unclear (moderate risk of bias): there may be a risk of bias
No (high risk of bias): there is at least one important risk of bias
Measures of treatment effect
Dichotomous data
We summarized the dichotomous data using relative risk (RR) as a summary estimate of treatment effect, with 95% confidence interval (CI). Where feasible, we calculated and reported the number needed to treat (NNT).
Continuous data
We summarized the continuous outcomes using the mean difference (MD). For data reported using different scales, which could not be converted to a uniform scale, we planned to use the standardized mean difference (SMD).
Unit of analysis issues
The unit of analysis was based on the individual patient. We considered cross‐over RCTs only if the data from the first phase were available (Higgins 2011).
Dealing with missing data
For continuous and dichotomous data we carried out available case analysis.
Assessment of heterogeneity
Clinical heterogeneity
We used the term 'clinical heterogeneity' to describe clinical differences in the studies related to the participants studied, interventions applied, and outcomes reported. We based the decision to pool studies on the absence of important clinical heterogeneity. We judged clinical heterogeneity based on patient demographics, clinical circumstances, and the comparability of the interventions applied.
Statistical heterogeneity
We performed an evaluation of the heterogeneity of the data using Cochran's Q statistic, a Chi2 test, with a threshold P value of less than 0.10 (Fleiss 1986). The consistency of the results was assessed visually using forest plots and by the I2 statistic (Higgins 2002). The I2 statistic describes the proportion of variation in point estimates that is attributable to heterogeneity as opposed to sampling error.
Assessment of reporting biases
We planned to construct a funnel plot (trial effect versus standard error) to assess possible reporting bias if sufficient (at least five) studies were identified (Egger 1997).
Data synthesis
Qualitative information
Qualitative information relating to methods, risk of bias, description of participants, and outcome measurements was synthesized in the Characteristics of included studies and Table 1.
| Results: characteristics of included studies | ||||||||||||||||||||
| Studies | Patients number | Characteristics of patients | Interventions | Risk of methodological bias | Study design | |||||||||||||||
| Total | PSV | TT | Age | Male | Fem | Score Health | MV days | % COPD | Prosthesis | Weaning Process | PSV min | SBTs time | AG? | AC? | RS? | OB? | DB? | AB? | ||
| Brochard 1994 | 109 | 31 | 35 | 58 | 74 | 35 | SAPs II 12 | 14 | 27% | TOT/TQT | DW/PW | 8 | TT2h/ PS24h | Low | Low | Low | High | High | Low | M RCT |
| Esteban 1995 | 130 | 37 | 31 | 58 | not reported | APACHE 18,6 | 9,3 | 40 | TOT | DW | 5 | 2h | Low | Low | Low | Low | Low | Low | M RCT | |
| Esteban 1997 | 484 | 238 | 246 | 0 | 343 | 141 | SAPs II 36 | 6 (4‐12) | 20 | TOT | SW/DW | 7 | 2h | Low | Low | Low | Low | Low | Low | M RCT |
| Haberthür2002 | 90 | 30 | 30 | 57 | 58 | 32 | APACHE 20 | 6 | 10 | TOT | SW/DW | 5 | 2h | Low | Low | Low | Mod | Low | Low | CO RCT |
| Koh 2000 | 36 | 20 | 22 | 61 | 23 | 13 | APACHE 35 | 12 | 0 | TOT | SW/DW | 7.6 | TT1h/ PS30 | Low | Low | Low | Mod | High | Low | RCT |
| Koksal 2004 | 60 | 20 | 20 | 74 | 28 | 32 | APACHE 18,5 | not rep | not rep | TOT | SW | 10 | 2h | Low | Mod | Low | Low | Low | Low | RCT |
| Matić 2004 | 260 | 150 | 110 | 0 | 170 | 90 | APACHE 19‐28 | 6,75 | 13 | TOT | DW | 8 | 2h | Mod | Low | Low | Low | Mod | Low | RCT |
| Matić 2007 | 136 | 70 | 66 | 0 | 36 | 27 | APACHE 23‐34 | 3.6‐6.3 | 100% | TOT | DW | 5 | 2h | Low | Low | Low | Low | High | Low | RCT |
| Vitacca 2001 | 52 | 26 | 26 | 72.5 | not reported | APACHE 17 | 15‐39 | 100% | TQT | PW | 8 | 8h | Low | Low | Low | Low | High | Low | M RCT | |
| Total | 1357 | 622 | 586 |
| 732 | 370 |
|
|
|
|
|
|
|
|
|
|
|
|
| |
Quantitative information
For dichotomous variables, we calculated the risk ratio (RR) and pooled the estimated effects from the studies by using the Mantel‐Haenszel statistical method. For continuous variables, we calculated the MD by using the inverse variance statistical method when studies reported their results through the same variables measured with the same instruments (same measurement units). When continuous data were reported with non‐interchangeable measurement units, we planned to pool them through the SMD. We calculated their respective 95% confidence intervals (CI).
For continuous and dichotomous data, we used a random‐effects statistical model since we were expecting substantial clinical and methodological heterogeneity, which could generate substantial statistical heterogeneity.
Subgroup analysis and investigation of heterogeneity
We planned to perform subgroup analyses to assess the impact of the:
-
aetiology for MV (medical versus surgical studies);
-
duration of MV prior to randomization (less than versus more than seven days);
-
duration of SBTs before extubation (target durations of 30 and 120 minutes) on weaning time.
Subgroup analysis post hoc during the review process
-
Weaning process divided into three categories: simple, difficult and prolonged weaning
-
Endotracheal prosthesis (tracheostomy versus translaryngeal tube)
Conduct of the proposed subgroup analyses, defined a priori, were 'hypothesis generating'. We anticipate that all subgroup analyses will be underpowered and consequently we will view these as exploratory given their propensity to generate misleading conclusions (Oxman 1992; Yusuf 1991).
Sensitivity analysis
We planned to conduct a sensitivity analysis to access the impact of excluding studies with a high risk of bias on pooled estimates of weaning time, mortality, and the proportion requiring reintubation.
Results
Description of studies
Results of the search
See Figure 1.

Study flow diagram. Search reran in December 2013.
We reran the search in December 2013. The search strategies retrieved 4334 titles and abstracts from the various electronic databases, the thesis repository and handsearches (Figure 1). We excluded 3217 references and 28 studies were retrieved as possibly meeting the inclusion criteria; one of them (Zhang 2009) is awaiting classification since the abstract was published in English and the full paper was written in Chinese, and two ongoing studies (Agarwal 2008; Pellegrini 2011) are registered in Current Controlled Trials. We found one study (Jubran 2013) of interest in the search that was rerun in December 2013. We will deal with this study when we update the review. We evaluated 25 full papers that were potentially eligible for the review and included nine studies. We excluded 16 studies from the analysis (see Excluded studies). The studies that were included represented international experience in conducting SBTs. The various countries included Argentina, Brazil, Croatia, France, Italy, Korea, Spain, Switzerland, Turkey and Venezuela. All the included studies were published in the English language.
Included studies
See Characteristics of included studies and Table 1 for the summary of the characteristics of the included studies.
Among the studies included, four were multicentre (Brochard 1994; Esteban 1995; Esteban 1997; Vitacca 2001), four RCTs were conducted at only one centre (Koh 2000; Koksal 2004; Matić 2004; Matić 2007), and one study was a cross‐over trial (Haberthur 2002).
The studies enrolled 1357 patients with acute respiratory failure of various aetiologies that required mechanical ventilation for more than 24 hours, and 1208 were included in this review. The number of participants in each study ranged from 36 (Koh 2000) to 484 (Esteban 1997). The mean participant age ranged from 58 to 74 years in six trials. Three studies reported these data as the median and interquartile range (IQR): Esteban 1997, 64 years (50 to 72); Matić 2004, 51 years (2 to 64.2); Matić 2007, 57 years (32 to 71) years. The gender distribution was 732 males and 370 females in seven studies, while two studies (Esteban 1995; Vitacca 2001) did not report the sex of the patients. In seven studies (Esteban 1995; Esteban 1997; Haberthur 2002; Koh 2000; Koksal 2004; Matić 2004; Matić 2007) the participants were intubated by means of a translaryngeal tube, Brochard 1994 had intubated and tracheostomized patients and, in one study (Vitacca 2001), all the patients (N = 52) were tracheostomized.
The disease severity was evaluated by the Acute Physiology and Chronic Health Evaluation score (APACHE II) (Knaus 1985) in seven studies, and the Simplified Acute Physiology score (SAPs II) (Le Gall 1993) was used for two studies (Brochard 1994; Esteban 1997).
In two studies (Matić 2007; Vitacca 2001) all the participants presented with chronic obstructive pulmonary disease (COPD), whereas in one study (Koksal 2004) the patients' underlying diagnoses were not reported. In six studies the proportion of patients with COPD ranged from 0% (Koh 2000) to 40% (Esteban 1995).
The mean duration of MV before weaning ranged from 6.3 (Haberthur 2002) to 14 days (Brochard 1994) in four trials. The median duration of MV before the trials in three studies (Esteban 1997; Matić 2004; Matić 2007) was 6.0, 6.75 and 5.0 days, respectively. The duration of MV before transfer to a long‐term weaning unit ranged from 15 to 39 days in one study (Vitacca 2001). Koksal 2004 did not report the duration of mechanical ventilation before SBT.
All studies started the process of withdrawal of ventilatory support after partial or complete improvement of the cause that led to acute respiratory failure, based on clinical and laboratory criteria. In seven studies (Brochard 1994; Esteban 1995; Esteban 1997; Haberthur 2002; Matić 2004; Matić 2007; Vitacca 2001) the patients were submitted to a T‐tube trial for two to five minutes, when respiratory parameters (respiratory rate (RR), tidal volume (VT), maximal inspiratory pressure (MIP) and rapid shallow breathing index (RSBI)) were measured. Two studies (Koh 2000; Koksal 2004) did not report the initial T‐tube trial. The criteria for discontinuation of SBT (see Table 2), weaning success and reintubation outcomes were previously defined and they were similar for all authors.
| Signs to poor tolerance to spontaneous breathing trial | |||||
| Studies | Respiratory rate (bpm) | SaO2 | Heart rate (beats/min) | Systolic blood pressure (mm Hg) | Others |
| > 35 | PaO2 < 50 | ≤ 20% basal | > 20% basal | Agitation, diaphoresis, depressed mental status | |
| > 35 | < 90% | > 140 | > 180 | Agitation, anxiety or diaphoresis | |
| > 35 | < 90% | > 140 | > 200 | Agitation, anxiety or diaphoresis | |
| > 35 | < 90% | > 140 | > 180 | Agitation, anxiety or diaphoresis | |
| > 40 | PaO2 < 55 | ≤ 20% basal | > 20% basal | Agitation, diaphoresis, depressed mental status | |
| ≥ 35 | ≤ 90% | ≥ 140 | ≤ 90 or ≥ 180 | Agitation, diaphoresis, depressed mental status | |
| > 35 | < 90% | > 140 | > 200 | Stable clinical condition | |
| > 25 | < 90% | > 140 | > 200 | Restlessness | |
| > 35 | PaO2 < 50 | > 145 | > 180 | Agitation, anxiety or diaphoresis | |
The patients of the included studies were classified into three categories (simple, difficult, and prolonged weaning) according to the difficulty and length of the weaning process, as presented by Laurent Brochard at the Fifth International Concensus Conference in Intensive Care Medicine (Boles 2007). Four authors evaluated PS versus T‐tube in patients who were successfully extubated on the first SBT, simple weaning (Esteban 1997; Haberthur 2002; Koh 2000; Koksal 2004). Seven studies (Brochard 1994; Esteban 1995; Esteban 1997; Haberthur 2002; Koh 2000; Matić 2004; Matić 2007) were classified as presenting cases of patients who required up to three SBTs, or until seven days of MV after the first attempt to achieve weaning success, that is, difficult weaning. In two studies (Brochard 1994; Vitacca 2001) the patients were considered as prolonged weaning category, that is, the patients failed three spontaneous breathing trials or remained on invasive ventilatory support for more than seven days after the first SBT; in the study by Vitacca 2001 the participants were tracheostomized patients who were transferred to a weaning unit. Only the study of Esteban 1997 compared and showed the data of relevant clinical outcomes for two categories of weaning: patients with simple and difficult weaning processes.
With regard to the interventions, five studies (Esteban 1997; Koh 2000; Matić 2004; Matić 2007; Vitacca 2001) compared two interventions (PSV versus T‐tube) for conducting SBTs. Three studies (Brochard 1994; Haberthur 2002; Koksal 2004) compared three interventions, synchronized intermittent mechanical ventilation (SIMV), automatic tube compensation (ATC) and continuous positive airway pressure (CPAP), with PSV and the T‐tube. One study (Esteban 1995) compared four interventions (intermittent mandatory ventilation (IMV) and intermittent SBTs were compared with PSV and a once daily trial with a T‐tube). We took into consideration only the interventions that this review was focusing on.
In the included studies, 622 patients underwent a PSV trial and 586 patients underwent a T‐tube trial. The PS values during the SBT ranged from five (Esteban 1995; Haberthur 2002; Matić 2007) to 10 cm H2O (Koksal 2004). The PSV and T‐tube were utilized for the SBT in 844 (69.9%) patients for four studies; in three studies (Brochard 1994; Esteban 1995; Vitacca 2001) in approximately 186 (15.4%) patients the PS value was gradually reduced until reaching minimal PS (PSmin) for SBT and periods of using a T‐tube increased twice a day until the full duration time of the SBTs. In two studies in 178 (14.7%) patients the PS was lowered to 2 to 4 cm H2O (Matić 2007) and 3 to 5 cm H2O (Koh 2000), based on ventilatory parameters, until reaching the PSmin for SBT. Koh 2000 established the PSmin using the formula: PSmin = peak inspiratory flow rate (PIFR) x total ventilatory system resistance. The duration of the SBTs (PSV and T‐tube) were the same in seven studies, two hours for six studies (Esteban 1995; Esteban 1997; Haberthur 2002; Koksal 2004; Matić 2004; Matić 2007) and eight hours in one study (Vitacca 2001). Two studies compared different durations of SBTs: Brochard 1994 compared a 24 hours PSV SBT versus two hours of a T‐tube trial; and in the trial by Koh 2000 the patients underwent an additional one‐hour T‐tube trial versus 30 min of a PSV SBT.
Six studies only evaluated clinical outcomes, while three (Haberthur 2002; Koh 2000; Koksal 2004) evaluated clinical and surrogate outcomes (physiological parameters, work of breathing (WOB) and endocrine response). However, 33 different outcomes were evaluated for all included studies, see Appendix 10. Weaning success or successful extubation was defined as the absence of support ventilation , when no mechanical ventilatory support was required 48 hours after extubation, or the withdrawal of mechanical ventilation in all included studies.
Five studies (Brochard 1994; Haberthur 2002; Koh 2000; Koksal 2004; Vitacca 2001) reported the findings as mean ± SD for continuous parameters and four studies (Esteban 1995; Esteban 1997; Matić 2004; Matić 2007) expressed their data using the median and IQR. See Appendix 11; Appendix 12; Appendix 13; Appendix 14.
Excluded studies
See Characteristics of excluded studies.
We excluded 16 studies from this review. Three studies (Colombo 2007; Emmerich 1997; Niembro 1996) compared PS and T‐tube as SBT trials, but the randomization strategy was not adequate (quasi‐randomized). Eight studies (Cabello 2010; Costa 2005; Guntzel 2007; Kuhlen 2003; Patel 1996; Rieder 2004; Santos 2008; Schifelbain 2011; Sassoon 1991) were cross‐over clinical trials that evaluated surrogate outcomes (WOB, pressure time product (PTP), energy expenditure (EE), physiological variables and others) and the results of the first moment (before cross‐over) were not available. Figueiredo 2001 conducted an RCT comparing PS and T‐tube but the examined patient populations were outside the scope of this review. The results from one excluded study (Goldwasser 1998) were considered in the results reported by another included trial (Esteban 1997). In two studies the patients were allocated to T‐tube for either 30 or 120 minutes (Esteban 1999) and PSV for 30 or 120 minutes (Perren 2002).
Risk of bias in included studies
A synthesis of the assessment of the methodological quality items described below is presented in Figure 2 and Figure 3. See Risk of bias in included studies and Table 1.

Risk of bias summary: review authors' judgements about each risk of bias item for each included study.

Risk of bias graph: review authors' judgements about each risk of bias item presented as percentages across all included studies.
Allocation
Randomization
The generation of the allocation sequence was adequate (low risk of bias) in eight studies. Brochard 1994 reported that the randomization was stratified according to centre and the aetiology of the process responsible for difficult weaning. It was performed by means of a random number table in the studies by Esteban 1995; Esteban 1997 and Koh 2000. Two authors (Haberthur 2002; Vitacca 2001) reported, by e‐mail contact, that the patients were allocated to each one of the interventions based on a computer‐generated random list. The randomization was achieved by pulling slips of paper labelled I, II and III from a bag (20 pieces per group) in the study of Koksal 2004. One study (Matić 2007) reported that the patients were randomly assigned by means of a draw of envelopes.
The risk of bias in one trial (Matić 2004) was considered to be moderate because the authors did not describe the randomization method in the published study, nor by contact with the author.
Allocation concealment
The allocation concealment was reported to have been done by means of sealed envelopes in eight trials (Brochard 1994; Esteban 1995; Esteban 1997; Haberthur 2002; Koh 2000; Matić 2004; Matić 2007; Vitacca 2001). One author (Koksal 2004) did not report sufficient details regarding the allocation concealment. This study was considered to be at moderate risk of bias.
Blinding
Detection bias
The risk of detection bias was low in four studies (Esteban 1995; Esteban 1997; Haberthur 2002; Koksal 2004) and their authors stated by e‐mail that the outcome assessors were blinded to the interventions. Matić 2004 was considered to present a moderate risk of bias since the author did not report whether the outcomes assessor was different from the study researchers.
Three authors (Brochard 1994; Koh 2000; Vitacca 2001) reported that their studies did not have any blinding after randomization. These three studies were considered to present a high risk of detection bias. Matić 2007 stated that his study was single‐blinded, with a protocol published in Current Controlled Trials.
Incomplete outcome data
In all studies (Brochard 1994; Esteban 1995; Esteban 1997; Haberthur 2002; Koh 2000; Koksal 2004; Matić 2004; Matić 2007; Vitacca 2001) the risk of attrition bias was considered to be low. They reported a clear patient flow or intention to treat (ITT). One study (Koh 2000) explicitly reported eight withdrawals (18%), and it described the reasons for these withdrawals.
Selective reporting
All the studies were considered to have a low risk of bias based on the relevant outcomes considered to evaluate the effectiveness and safety of SBTs, with an absence of suspected selective outcome reporting (Brochard 1994; Esteban 1995; Esteban 1997; Haberthur 2002; Koh 2000; Koksal 2004; Matić 2004; Matić 2007; Vitacca 2001).
Other potential sources of bias
Brochard 1994 reported that the criteria for extubation were different in the three groups (high risk of bias). Koh 2000 described results from 42 weaning trials on 36 patients (cross‐over occurred in six patients) who were randomly assigned to an additional one‐hour period in the T‐tube trial group and immediate extubation in the PSmin group. The study design of Haberthur 2002 was a cross‐over trial. These studies were considered to present moderate risk of methodological bias.
In six studies (Esteban 1995; Esteban 1997; Koksal 2004; Matić 2004; Matić 2007; Vitacca 2001) we did not suspect any other potential sources of bias.
Effects of interventions
Weaning success
In nine studies (Brochard 1994; Esteban 1995; Esteban 1997; Haberthur 2002; Koh 2000; Koksal 2004; Matić 2004; Matić 2007; Vitacca 2001), involving 935 patients, we found that a larger but not statistically significant proportion of patients assigned to PS (357/464) were successfully extubated or withdrawn from invasive MV, or both, compared with patients assigned to T‐tube SBT (344/471) (RR 1.07, 95% CI 0.97 to 1.17, P = 0.16) in the presence of non‐significant heterogeneity (P = 0.27; I2 = 19%). The test for subgroup differences was not significant (I2 = 0%) (Analysis 1.1). We performed a subgroup analysis to evaluate the differences among the four weaning categories (simple, difficult, prolonged, and mixed weaning). In the simple weaning group, three studies (Esteban 1997; Haberthur 2002; Koksal 2004) involving 497 patients compared PS versus T‐tube in patients who tolerated the first SBTs and were extubated. We did not find any statistically significant difference in the proportion of patients extubated with success (RR 1.05, 95% CI 0.91 to 1.22, P = 0.47) in the presence of non‐significant heterogeneity (I2 = 34%). For four studies (Esteban 1995; Esteban 1997; Matić 2004; Matić 2007) on 278 patients who were considered to present difficult weaning, we did not find any significant difference between the patients who underwent PS (95/132) versus T‐tube (101/146), with low heterogeneity (I2 = 36%) (RR 1.06, 95% CI 0.87 to 1.29, P = 0. 56). We classified one study (Vitacca 2001) as presenting prolonged weaning. This trial involved 52 tracheostomized COPD patients with more than 15 days of MV. We did not find any statistical differences between PS (19/26) and T‐tube SBTs (20/26) (RR 0.95, 95% CI 0.69 to 1.30, P = 0.75). Two studies (Brochard 1994; Koh 2000) that involved 108 patients were included in the mixed weaning group because they did not report data for each weaning group. We did not find any statistically significant difference in the proportion of patients extubated with success (RR 1.33, 95% CI 1.01 to 1.76, P = 0.05), without any heterogeneity (I2 = 0%).
ICU mortality
In five trials (Brochard 1994; Esteban 1997; Matić 2004; Matić 2007; Vitacca 2001) reporting on 725 patients, we found a lower but not statistically significant probability of ICU mortality favouring patients undergoing PS (32/357) versus T‐tube SBT (46/368) (RR 0.81, 95% CI 0.53 to 1.23, P = 0.32), without any heterogeneity (I2 = 0%). The test for subgroup differences was not significant (I2 = 0%).
We performed subgroup analysis to evaluate the differences among weaning groups (simple weaning, difficult weaning, prolonged, and mixed weaning). Four studies were classified into four categories of weaning; Brochard 1994 was included in the mixed subgroup analysis as the patients were classified as difficult and prolonged weaning but the data were not reported for each weaning category. Mortality was evaluated for only one study in simple weaning (Esteban 1997) for which we found a lower rate of ICU mortality in the PS group (12/205) than in the T‐tube group (17/192), but this was statistically non‐significant (RR 0.66, 95% CI 0.32 to 1.35, P = 0.25). Three studies (Esteban 1997; Matić 2004; Matić 2007) evaluated ICU mortality among 210 difficult weaning patients and the result from the meta‐analysis for mortality in the difficult weaning subgroup did not show any statistically significant difference between PS and T‐tube (RR 0.97, 95% CI 0.50 to 1.87, P = 0.93), with low heterogeneity (I2 = 3%). In the study by Vitacca 2001, among 52 tracheostomized patients with prolonged weaning three died in the group that underwent PS versus two patients with the T‐tube (26 patients in each group) (RR 1.50, 95% CI 0.27 to 8.25, P = 0.64). See Analysis 1.2.
Time of weaning from mechanical ventilation (weaning duration)
Four studies (Brochard 1994; Esteban 1995; Matić 2004; Matić 2007) evaluated the weaning duration. Three studies (Esteban 1995; Matić 2004; Matić 2007) reported weaning duration data using medians. We did not pool these studies, thus it was not possible to quantitatively evaluate which SBT led to a shorter time for weaning from MV. Brochard 1994 made data available on the time taken to wean from MV, which favoured the PS group over the T‐tube group with a mean difference of ‐2.80 days, but the difference was not statistically significant (95% CI ‐5.84 to 0.24, P = 0.07). Matić 2004 showed better median results for the PS group (54 hours, range 47 to 88) than for the T‐tube group (94 hours, range 79 to 132) (P < 0.001 according to the Mann–Whitney test). Matić 2007 also reported the time taken for weaning as median values, with 43 hours for PS (range 35 to 49) and 63 hours for T‐tube (range 51 to 69) (P < 0.001 according to the Mann‐Whitney test) thus favouring the PS group. However, Esteban 1995 observed better results for the T‐tube group (72 hours, range 24 to 144) than for the PS group (96 hours, range 48 to 288) (P value not available). See Appendix 11.
Reintubation
Reintubation was evaluated in seven studies (Brochard 1994; Esteban 1995; Esteban 1997; Koh 2000; Koksal 2004; Matić 2004; Matić 2007) with 823 patients. We did not find any significant difference in the proportion of patients requiring reintubation within 48 hours after extubation (RR 0.92, 95% CI 0.66 to 1.26, P = 0.59), without heterogeneity (I2 = 0%). The test for subgroup differences was not significant (I2 = 0%). See Analysis 1.3.
Although we observed that statistical heterogeneity was absent, the studies pooled for analysis on reintubation were clinically different with regard to the weaning process. We performed subgroup analysis for simple, difficult, and mixed weaning. Two studies (Esteban 1997; Koksal 2004) with 437 patients whose weaning was simple had low rates of reintubation in the PS group, which was not statistically significantly different from the T‐tube SBT group (RR 0.53, 95% CI 0.07 to 3.79, P = 0.52) in the presence of moderate heterogeneity (P = 0.13; I2 = 56%).
In four studies (Esteban 1995; Esteban 1997; Matić 2004; Matić 2007) with 278 patients the result from the meta‐analysis for the subgroup of patients who presented with difficult weaning did not show any significant difference between SBTs (PS versus T‐tube) (RR 0.85, 95% CI 0.47 to 1.52, P = 0.58), without any heterogeneity (I2 = 0). Two studies (Brochard 1994; Koh 2000) were included in a third analysis (mixed categories of weaning) because they did not report data for each weaning group. We did not find any statistically significant difference in the proportion of patients that were reintubated (RR 0.95, 95% CI 0.32 to 2.86, P = 0.93), without any heterogeneity (I2 = 0%).
ICU or long‐term weaning unit (LWU) length of stay (days)
Five studies evaluated the ICU or LWU length of stay and meta‐analysis was done for two studies; the estimated effects on ICU or LWU length of stay favoured the PS group in two studies (Brochard 1994; Vitacca 2001) but without statistical significance (MD ‐7.08 days, 95% CI ‐16.26 to 2.10, P = 0.13). We observed substantial heterogeneity between the studies included in this outcome (P = 0.10; I2 = 64%). The clinical heterogeneity can be explained by at least four characteristics among the participants: mean age (58 versus 73 years), process of weaning (difficult and prolonged versus prolonged weaning), endotracheal prosthesis type (translaryngeal and tracheostomy tubes versus all tracheostomized patients), and percentage of patients with COPD (27% versus 100%). See Analysis 1.4.
In three trials (Esteban 1997; Matić 2004; Matić 2007) the estimated effects were reported as median values: 270 (235 to 290) and 331 (292 to 396) hours observed in the PS and T‐tube groups, respectively (P < 0.001; Mann‐Whitney test) (Matić 2004); and 210 (186 to 241) and 241 (211 to 268) hours observed in the PS and T‐tube groups, respectively (P < 0.001, Mann‐Whitney test) (Matić 2007). However, the only study which showed an estimated effect favouring the T‐tube was Esteban 1997, with median values of 12 (288 hours) and 10 (240 hours) for PS and T‐tube, respectively (P = 0.33, Mann‐Whitney test). See Appendix 12.
Pneumonia
We pooled the results from two trials (Brochard 1994; Vitacca 2001) that evaluated pneumonia in 118 patients. Of these, 3/57 in the PS group and 5/61 in the T‐tube group developed pneumonia (RR 0.67, 95% CI 0.08 to 5.85, P = 0.72), with moderate statistical heterogeneity (I2 = 44%). See Analysis 1.5.
Successful spontaneous breathing trial (SBT)
The result of the meta‐analysis pooling four studies (Esteban 1997; Haberthur 2002; Matić 2004; Matić 2007) involving 940 patients in relation to successful SBT revealed a statistically significant difference in the proportion of patients in the PS group (388/488) compared with the patients in the T‐tube group (331/452) (RR 1.09, 95% CI 1.02 to 1.17, P = 0.009; risk difference (RD) 0.07, 95% CI 0.02 to 0.12, P = 0.009). We observed that there was no statistical heterogeneity between the studies (I2 = 0%). All the patients had received a translaryngeal tube, the duration of the SBT was two hours, and the patients were considered to present simple weaning. Using these estimates, 14 patients would need to be treated with a PS SBT to have one additional successful SBT. See Analysis 1.6.
Respiratory rate (RR)
A meta‐analysis on two studies (Koh 2000; Haberthur 2002) compared the RR in 94 intubated patients. The MD ‐1.95 breaths/minute (95% CI ‐2.60 to ‐1.29, P < 0.00001) in favour of PS without any heterogeneity (I2 = 0%). See Analysis 1.7.
Tidal volume (VT)
Koh 2000 and Haberthur 2002 evaluated tidal volume (VT) in 94 patients, showing a statistically significant difference in VT in the PS group. The MD was 0.06 L/min (95% CI 0.04 to 0.08, P < 0.00001) without any heterogeneity (I2 = 0%). See Analysis 1.8.
Rapid and shallow breathing index (RSBI or RR/VT)
There was no statistical difference in relation to RSBI or RR/VT, with a mean difference of ‐13.70 breaths/min/L (95% CI ‐32.79 to 5.39, P = 0.16) in two studies (Haberthur 2002; Koh 2000) involving 94 patients, with significant heterogeneity (I2 = 89%). See Analysis 1.9.
Adverse events
Vitacca 2001 considered new episodes of pneumonia and arrhythmia as complications. The pneumonia outcome was assessed by two studies, and the meta‐analysis for this outcome was described in Analysis 1.5. The same author reported new episodes of arrhythmias in three patients in the PSV and T‐tube groups, and agitation was reported in seven patients assigned to PSV versus three patients in the T‐tube group. Matić 2004 reported that three patients had life‐threatening complications during the procedures in the group submitted to the T‐tube compared to one patient in the PSV group. Brochard 1994 reported ischaemic heart failure during weaning in one patient in each SBT group.
Continuous and dichotomous outcomes that were impossible to combine in a meta‐analysis
1. Proportion of patients requiring tracheostomy
Only one study (Esteban 1997) reported the number of patients who were tracheostomized among 484 intubated patients. There was a statistically non‐significant difference between PS and T‐tube (RR 0.72, 95% CI 0.39 to 1.33, P = 0.29). See Table 3 (item 2).
| Outcomes | N | Estimated effect (RR, 95% CI, P) | Favoured group | Study |
| 1. Hospital mortality | 397 | RR 1.03, 0.65 to 1.64, P = 0.89 | T‐tube | |
| 2. Proportion of patients requiring tracheostomy | 484 | RR 0.72, 0.39 to 1.33, P = 0.29 | PS |
2. Hospital mortality
Only one study (Esteban 1997) reported hospital mortality among patients undergoing PS (32/205) and T‐tube SBT (29/192) (RR 1.03, 95% CI 0.65 to 1.64, P = 0.89). See Table 3 (item 1).
3. Hospital length of stay (days)
Two studies (Esteban 1997; Vitacca 2001) measured the total hospital length of stay among intubated and tracheostomized COPD patients, respectively. The data were not pooled because Esteban 1997 presented the results as the median and the IQR was not available in the published study. Vitacca 2001 reported a MD of ‐1.0 day favourable to PSV compared with T‐tube but with no statistical significance (95% CI ‐17.09 to 15.09, P = 0.90). See Appendix 13.
4. Total duration of mechanical ventilation (MV) (hours)
Three studies evaluated total duration of MV, and only one study (Vitacca 2001) reported the mean duration of MV: 181 hours in the PS SBT compared with 130 hours in the T‐tube SBT, among 52 patients. There was a MD of 51 hours, but without statistical significance (95% CI ‐23.09 to 125.09, P = 0.18). Two trials (Matić 2004; Matić 2007) reported the total duration of MV in terms of medians and IQRs. Matić 2004 reported median values for PS versus T‐tube of 215 (range 187 to 259) and 262 hours (range 216 to 328), respectively, thus significantly favouring the PS group (P < 0.001, Mann‐Whitney test). Matić 2007 reported median values favouring the PS group (163, range 113 to 203) compared with the T‐tube group (187, range 143 to 328) (P < 0.001). See Appendix 14.
Quality of life
None of the studies included in this review evaluated quality of life.
Reporting bias
The reporting bias was evaluated for weaning success because this outcome pooled nine studies. We did not identify asymmetry of the funnel plot. See Figure 4.
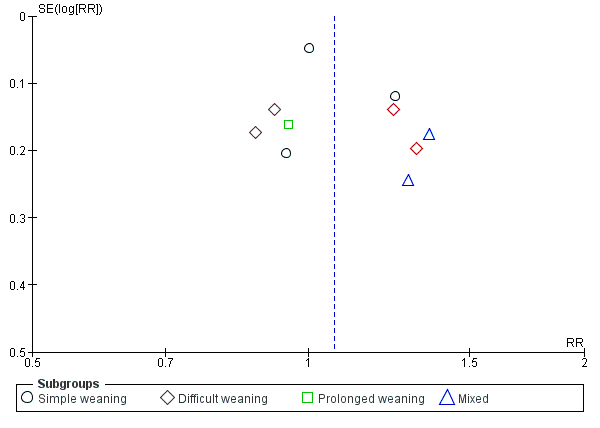
Funnel plot of comparison: 1 Pressure support versus T‐tube, outcome: 1.1 Weaning success.
Subgroup analyses
The studies included in this review could be classified in terms of endotracheal prosthesis: one study with a tracheostomy tube (Vitacca 2001), one study with both tracheostomy and a translaryngeal tube (Brochard 1994), seven studies with a translaryngeal tube (1090, 92.3% of patients) where a tracheostomy tube was an exclusion criterion in these studies. Pooling two studies (Brochard 1994; Vitacca 2001) the number of included tracheostomized patients was about 118 (9.7%); this difference in proportions between intubated and tracheostomized patients was not sufficient to perform subgroups analysis by type of tracheal prosthesis. No included study evaluated PSV versus T‐tube in surgical patients who were ventilated for at least 24 hours. The duration of the SBTs was at least two hours in eight studies; Koh 2000 evaluated weaning success and reintubation outcomes for a PS SBT for 30 minutes compared with an additional 1‐hour period of T‐tube SBT.
Clinically, the nine studies were classified into three groups of weaning: simple weaning (Esteban 1997; Haberthur 2002; Koh 2000; Koksal 2004); difficult weaning (Brochard 1994; Esteban 1995; Esteban 1997; Koh 2000; Matić 2004; Matić 2007); and patients considered to present prolonged weaning (Brochard 1994; Vitacca 2001). Esteban 1997 reported data both for simple and difficult weaning patients. Subgroup analysis based on the weaning process could be carried out for three outcomes: ICU mortality, weaning success, and reintubation. Two studies (Brochard 1994; Koh 2000) were excluded from the subgroup analysis.
Sensitivity analysis
There was a potential risk of detection bias in four studies (Brochard 1994; Koksal 2004; Matić 2007; Vitacca 2001). There were not significant changes to the estimates when the data of these studies were excluded from analysis for the following outcomes: weaning success, ICU mortality and reintubation.
In this review, data for dichotomous outcomes were analysed by ITT.
Discussion
Summary of main results
The studies included here were conducted in various parts of the world, in Europe, South America, and Asia, although all of them were published in the English language. The results of this systematic review have external validity for adult patients, mostly intubated, who were on mechanical ventilation for at least 24 hours due to acute respiratory failure of different aetiologies and classified into three categories of weaning (simple, difficult, and prolonged). Despite the fact that the included studies had not defined respiratory failure, the causes of respiratory failure or reasons for the initiation of mechanical ventilation were described for eight studies. The criteria for interruption of ventilatory support were described by all authors.
Pressure support (PS) ventilation and a T‐tube were used directly as spontaneous breathing trials (SBTs) in four studies with 844 patients (69.9% of the sample). In 186 (15.4%) included patients, both interventions were used along with a gradual weaning from mechanical ventilation; the PS was gradually decreased, twice a day, until the minimal PS was reached (PSmin) and periods with a T‐tube were gradually increased to two hours (Brochard 1994; Esteban 1995) and eight hours (Vitacca 2001) of SBTs for patients with difficult and prolonged weaning. In two studies involving 178 (14.7%) patients, the PS was lowered to 2 to 4 cm H2O (Matić 2007) and 3 to 5 cm H2O (Koh 2000), based on ventilatory parameters, until they reached the PSmin, and then the results were compared with one trial with the T‐tube.
The duration of the SBTs was 30 minutes in patients submitted to pressure support ventilation (PSV) in one study (Koh 2000), two hours in six studies, and longer (eight and 24 hours) in two studies (Brochard 1994; Vitacca 2001). Two authors (Esteban 1999; Perren 2002) reported no statistical differences between 30 minutes versus 120 minutes of SBTs on the outcomes weaning success and reintubation. The results of this review apply to at least a two hour SBT.
The nine included studies were classified according to the difficulty and length of the weaning process. Four studies presented patients who achieved simple weaning (Esteban 1997; Haberthur 2002; Koh 2000; Koksal 2004). In six studies (Brochard 1994; Esteban 1995; Esteban 1997; Koh 2000; Matić 2004; Matić 2007) the patients failed on their first attempt at a SBT or required seven days of mechanical ventilation before successful weaning. They were classified as having a difficult weaning. Two studies (Brochard 1994; Vitacca 2001) presented patients with prolonged weaning. They had failed three attempted SBTs or required more than seven days of mechanical ventilation after their first SBT to finally achieve successful weaning. Four studies had patients classified into two weaning groups, and only Esteban 1997 followed up on simple and difficult weaning patients until their discharge or death. The classification of patients into three groups of weaning was based on expert opinion during the Fifth Conference of the International Consensus Intensive in 2005, according to difficulty and duration of weaning from mechanical ventilation (Boles 2007). We classified the included studies into three categories of weaning based on information reported in the original articles and by contacting the authors. Further studies are being conducted to establish this classification and to evaluate how the outcomes of ICU mortality, reintubation, and length of stay in the ICU are affected in each category of weaning (Funk 2010; Peňuelas 2011; Sellares 2011).
Weaning success was defined as the absence of the requirement for ventilatory support within 48 hours after extubation (translaryngeal tube) or withdrawal (tracheostomy tube) of mechanical ventilation in all included studies. Nine studies assessed this outcome in 935 patients; approximately 77% of the patients who underwent PS and 73% with a T‐tube achieved weaning success, although this difference was statistically non‐significant. The weaning success was 80%, 70%, and 75% on simple, difficult, and prolonged weaning, respectively. Boles 2007 reported weaning success in 1710 (68.8%) patients (adult and paediatric) pooled in six studies, and therefore the SBTs, population, and duration of the SBT differed among the studies. In this review, the percentages of patients in simple, difficult, and prolonged weaning groups were 60%, 34%, and 6%, respectively. In the Funk 2010 trial, the percentage of patients in the weaning categories was similar to this review: 60% and 26% for simple and difficult weaning, and 35% for prolonged weaning. Our sample size for prolonged weaning was smaller (52 patients).
The ICU mortality rate was not statistically different among the patients who passed the SBTs using PS and T‐tube, independent of the weaning process. The overall mortality rate was 10.7% (78) among 725 patients. The mortality rate was 7.3% for the patients with simple weaning, 15.2% among those with difficult weaning, and 9.6% among those with prolonged weaning. The mortality rate was higher among the patients with difficult weaning. Peňuelas 2011 reported the same mortality rate between simple and difficult weaning groups (7%) and 22% for prolonged patients in the 2714 patients who were weaned. In the 257 patients of an observational study, Funk 2010 described a higher mortality rate (22%) for prolonged weaning compared to 3% for the simple group and 1% in the difficult weaning group. Our sample size for prolonged weaning was small (52 patients transferred to weaning units).
The duration of weaning from mechanical ventilation was analysed qualitatively, even though four studies (Brochard 1994; Esteban 1997; Matić 2004; Matić 2007) had already evaluated this outcome. The data of three of these studies were reported as medians and interquartile ranges. The mean and standard deviation can be estimated from the median (Hozo 2005), but we chose not to perform meta‐analysis with estimated data. Based on the qualitative analysis of these three studies (Brochard 1994; Matić 2004; Matić 2007), there was a tendency of PS to reduce the time for weaning of difficult and prolonged weaning groups (see Appendix 11). The weaning duration depends on the cause of the respiratory failure as, for example, COPD patients can spend up to 59% of their total time on mechanical ventilation in the process of withdrawal of ventilatory support (Esteban 1994). Blackwood 2010 reported that implementation of weaning protocols was related to the shorter duration of weaning, a reduction of 78% on the time spent for weaning, given the significant heterogeneity among the included studies; this systematic review did not establish the SBTs (PSV versus T‐tube) that influenced weaning duration.
In this review, the reintubation rate was higher among patients who used the T‐tube (16% versus 15% for PS) but we did not find any statistically significant difference between them. The rate of reintubation within 48 hours after extubation among 823 participants was 16.5%. Esteban 1999 and Boles 2007 reported reintubation in 13.5% (453) and 13.0% (1962) of the patients extubated after successful SBTs. From the subgroup analysis on two categories of the weaning process, the reintubation rate was higher among the patients with simple rather than difficult weaning: 18.% and 13%, respectively. Again, there was not any statistically significant difference between PSV and the T‐tube. According to MacIntyre 2012, reintubation rates of 5% to 20% seem to be reasonable as low values of reintubation can be associated with delays in the withdrawal of a mechanical ventilator and higher rates suggest early interruption of ventilatory support. The rates of reintubation with simple and difficult weaning in two observational studies (Funk 2010; Peňuelas 2011) were 19% and 5% and 10% and 10%, respectively. In this review, the reintubation rate was lower in the difficult weaning group.
The successful SBT (PSV or T‐tube) is used as a predictor of weaning success from mechanical ventilation, so this outcome was added to the systematic review. Data were available from four included studies. A statistically significantly percentage (79.5% versus 73.2%) of the patients on simple weaning who underwent two hours of PS passed the SBT and were extubated. A greater number of patients undergoing T‐tube trials failed the two hours of SBT, and these patients returned to mechanical ventilation for at least 24 hours. After pooling the data on 940 patients in a meta‐analysis, 719 (76.4%) were found to have had a successful SBT. Weaning success or successful extubation is the absence of ventilatory support (Brochard 1994; Vitacca 2001) 48 hours after extubation or the withdrawal of mechanical ventilation in all included studies. In all studies included here, the intolerance criteria or tolerance criteria for SBTs were similar: respiratory rate and pattern, gas exchange (arterial oxygen saturation), and haemodynamic stability (heart rate and systolic blood pressure) (see Table 2). Ezingeard 2006 observed that the intubated patients who failed the SBT through the T‐tube but continued the SBT with PS of 7 or 10 cm H20 were successfully extubated. Several studies showed that work of breathing is significantly higher during T‐tube trials compared with PSV trials (Cabello 2010; Koh 2000; Kuhlen 2003; Patel 1996).
The ICU and long‐term weaning unit (LWU) lengths of stay were evaluated by five authors (Brochard 1994, Esteban 1997; Matić 2004; Matić 2007; Vitacca 2001). The mean difference of 7.08 days, favourable for PSV, in our meta‐analysis of two studies (Brochard 1994; Vitacca 2001) with 118 patients did not reach a statistical significance. Three studies (Esteban 1997; Matić 2004; Matić 2007) were not pooled in a meta‐analysis because they described their results as medians and interquartile ranges (IQRs) and we decided not to perform meta‐analysis with the mean estimated by median data. The results reported by two studies (Matić 2004; Matić 2007) were favourable to PSV and Esteban 1997 reported two days reduced ICU length of stay in simple weaning patients submitted to the T‐tube. Blackwood 2010 reported a 10% reduction in ICU length of stay in studies that adopted a weaning protocol. All studies included in this review followed the criteria for the interruption of mechanical ventilation, an initial T‐tube test, and SBTs.
The physiologic parameters planned for this review were evaluated by seven studies, and these parameters were measured in an initial T‐tube test between two to five minutes before the SBTs. Only two studies (Haberthur 2002; Koh 2000) evaluated RR, VT, and rapid shallow breathing index (RSBI) during SBTs; for two outcomes, RR and VT, the PS was statistically superior to the T‐tube in a meta‐analysis of two studies with 94 pooled patients. We did not find any differences between PS and T‐tube SBTs among the 94 pooled simple weaning patients with regard to RSBI. The RSBI was used as a weaning predictor test before trials of extubation (SBTs) as recommended by Boles 2007 and MacIntyre 2012. In this review, the PSV was not statistically different from T‐tube, and some studies (Cabello 2010; Gonçalves 2012; Santos 2007) reported that RSBI measured with PSV of 5 to 10 cm H2O is overestimated, that is, the value of the rapid and shallow breathing index (RSBI or RR/VT)is lower than was measured for PSV.
It was not possible to perform meta‐analyses for hospital length of stay, total duration of mechanical ventilation, proportion of patients requiring a tracheostomy, and hospital mortality outcomes. Although at least two studies evaluated the total duration of mechanical ventilation and hospital length of stay, the data from three studies were reported as the median and interquartile range but we chose not to perform meta‐analysis with estimated data. Patients in difficult weaning who submitted to PSV spent less time on mechanical ventilation (median of ‐47 hours) than patients who submitted to the T‐tube. Vitacca 2001 reported a mean of 51 hours of mechanical ventilation in tracheostomized patients on prolonged weaning and weaned by T‐tube (see Appendix 13 and Appendix 14). Only the study by Esteban 1997 assessed hospital mortality and the proportion of patients requiring tracheostomy. There was not any statistical difference between PSV and T‐tube for these outcomes (see Table 3).
Adverse effects were reported by three studies (Brochard 1994; Matić 2004; Vitacca 2001). New episodes of pneumonia and arrhythmia were diagnosed in 11.5% and 7% of patients, respectively, while 3% of the patients submitted to SBTs presented with ischaemic heart failure during weaning. Agitation needing low dose sedative was found in 19% of patients (seven in PSV versus three in T‐tube SBTs), and life‐threatening complications during the procedure were reported in 6.7% of patients (one (3.5%) in PSV versus three (10%) in T‐tube SBTs). The studies did not find any significant statistical difference between patients who underwent PS and T‐tube SBTs. Costa 2005 reported a higher frequency of arrhythmias in cardiac patients compared to patients without heart disease, regardless of SBTs (PSV versus T‐tube). The SBTs appear to be safe for weaning patients from mechanical ventilation.
Subgroup analysis was conducted in accordance with the weaning process (simple, difficult, and prolonged) for the three outcomes ICU mortality, weaning success and reintubation. Four studies compared the PSV versus T‐tube techniques in two weaning groups; only Esteban 1997 reported all of the data evaluated for each weaning group, while two studies (Brochard 1994; Koh 2000) did not present data for each weaning category and were excluded from the subgroup analysis. Haberthur 2002 evaluated and reported the data for weaning success in patients in the simple and difficult weaning groups. However, the study design was cross‐over. We thus collected the results of the first study moment, that is, prior to cross‐over.
None of the studies evaluated comfort, quality of life, or costs. The agitation during SBTs may be associated with patient discomfort.
Overall completeness and applicability of evidence
The results from this systematic review applied to adult patients with at least 24 hours of invasive mechanical ventilation. The patients were clinically and biogenically stable, their weaning was either simple or difficult, and they underwent SBTs through PS and the T‐tube. The results were favourable towards PS but were non‐statistically significant for weaning success, ICU mortality, reintubation and other factors. The RR and VT were statistically significant in favour of PS. The patients who underwent PS for 120 minutes (two hours) were extubated because they demonstrated a successful SBT.
Quality of the evidence
We defined six relevant outcomes (weaning success, ICU mortality, reintubation, ICU or LWU length of stay, pneumonia, and successful SBT) in order to assess the quality of evidence. Four outcomes (weaning success, ICU mortality, reintubation, ICU or LWU length of stay) yielded low quality evidence. Successful SBT was classified as moderate quality evidence, and pneumonia as very low quality evidence. See summary of findings Table for the main comparison.
Potential biases in the review process
The protocol was published in 2006 (Ladeira 2006).
In the seven years since publication of the protocol, the original primary outcome, weaning duration, has been discarded. The binary variable weaning success is now considered the preferred outcome when evaluating the effectiveness of both PSV and T‐tube as SBTs for simple and difficult weaning. For prolonged weaning patients, the weaning duration may be better to evaluate the effectiveness of PSV and T‐tube as methods for gradual withdrawal from mechanical ventilation.
In this review, we added a successful SBT as a secondary outcome and we included subgroup analyses according to the difficulty and length of the weaning process, as presented by Laurent Brochard at the 5th International Consensus Conference in Intensive Care Medicine: weaning from mechanical ventilation (Boles 2007).
Only one study (Vitacca 2001), which included 52 tracheostomized patients, was classified as presenting prolonged weaning. The results of the present systematic review are limited in relation to this category of weaning.
The data taken to indicate success of weaning in the study by Brochard 1994 were based on failure to wean. We removed all weaning failures from the total number in each group (PS and T‐tube) and considered the difference between them to be weaning success.
Meta‐analysis was not performed for the outcomes of ICU and hospital length of stay, time of weaning from mechanical ventilation, and total duration of mechanical ventilation because the data from the included studies were presented as medians and interquartile ranges. We could have made an estimate of the mean using the values of the median values and the low and high ends of the range to perform a meta‐analysis for continuous data (Hozo 2005) but we chose not to perform meta‐analysis with estimated data.
Seven cross‐over trials, which evaluated appropriate surrogate outcomes in order to perform cross‐over, such as work of breathing, pressure‐time product, energy expenditure, RR, VT and RSBI, were excluded from this review because no data from the initial period were available in the published trials.
Agreements and disagreements with other studies or reviews
We have not found any other systematic review with meta‐analysis that compared PS versus T‐tube spontaneous breathing trials; this is therefore the first one.
The published reviews on mechanical ventilation and weaning (Boles 2007; Caroleo 2007; Luetz 2012) reported no difference between PS and T‐tube spontaneous breathing trials for several outcomes. The present systematic review showed that PS was significantly superior to T‐tube for predicting extubation in simple weaning patients (RR 1.09, 95% CI 1.02 to 1.17, P = 0.009, NNT = 14), but the weaning success was not statistically favourable to PSV.
Studies have shown that when RSBI was measured with PS in comparison with spontaneous ventilation through the T‐tube, the RSBI value was overestimated with PSV (Gonçalves 2012; Patel 2009; Santos 2007). In the present systematic review we grouped only two studies and pooled 94 patients, and PS was not statistically superior to the T‐tube.
Study flow diagram. Search reran in December 2013.
Risk of bias summary: review authors' judgements about each risk of bias item for each included study.
Risk of bias graph: review authors' judgements about each risk of bias item presented as percentages across all included studies.
Funnel plot of comparison: 1 Pressure support versus T‐tube, outcome: 1.1 Weaning success.

Comparison 1 Pressure support versus T‐tube, Outcome 1 Weaning success.

Comparison 1 Pressure support versus T‐tube, Outcome 2 ICU mortality.

Comparison 1 Pressure support versus T‐tube, Outcome 3 Reintubation.

Comparison 1 Pressure support versus T‐tube, Outcome 4 ICU or LWU length of stay.
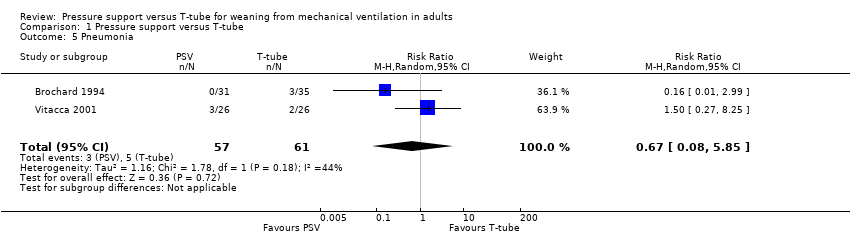
Comparison 1 Pressure support versus T‐tube, Outcome 5 Pneumonia.

Comparison 1 Pressure support versus T‐tube, Outcome 6 Successful spontaneous breathing trial.

Comparison 1 Pressure support versus T‐tube, Outcome 7 Respiratory rate (RR).

Comparison 1 Pressure support versus T‐tube, Outcome 8 Tidal volume (VT).
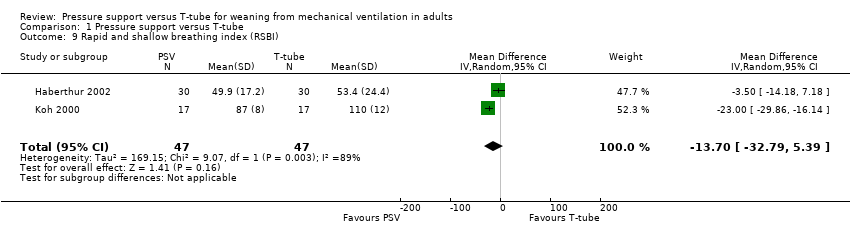
Comparison 1 Pressure support versus T‐tube, Outcome 9 Rapid and shallow breathing index (RSBI).

Comparison 1 Pressure support versus T‐tube, Outcome 10 Time of weaning from MV (Duration of weaning).
| Pressure support versus T‐tube for weaning from mechanical ventilation in adults | ||||||
| Patient or population: patients on weaning from mechanical ventilation in adults. | ||||||
| Outcomes | Illustrative comparative risks* (95% CI) | Relative effect | No of Participants | Quality of the evidence | Comments | |
| Assumed risk | Corresponding risk | |||||
| Control | Pressure support versus T‐tube | |||||
| Weaning success | Study population | RR 1.07 | 935 | ⊕⊕⊝⊝ | The physicians need to take into consideration the age, baseline disease, duration of mechanical ventilation before weaning | |
| 730 per 1000 | 781 per 1000 | |||||
| Low | ||||||
| 600 per 1000 | 642 per 1000 | |||||
| High | ||||||
| 950 per 1000 | 1000 per 1000 | |||||
| ICU mortality | Study population | RR 0.81 | 725 | ⊕⊕⊝⊝ | The physicians need to take into consideration the age of patients, disease severity, duration of mechanical ventilation before weaning, baseline disease (COPD), cause of respiratory failure | |
| 125 per 1000 | 101 per 1000 | |||||
| Low | ||||||
| 50 per 1000 | 41 per 1000 | |||||
| High | ||||||
| 200 per 1000 | 162 per 1000 | |||||
| Reintubation | Study population | RR 0.92 | 823 | ⊕⊕⊝⊝ | The physicians need to take into consideration the age, time of mechanical ventilation, before weaning | |
| 159 per 1000 | 146 per 1000 | |||||
| Low | ||||||
| 50 per 1000 | 46 per 1000 | |||||
| High | ||||||
| 200 per 1000 | 184 per 1000 | |||||
| ICU or LWU length of stay (days) | The mean ICU or LWU length of stay (days) in the intervention groups was | 118 | ⊕⊕⊝⊝ | The physicians need to take into consideration the age, time of mechanical ventilation, weaning process (prolonged weaning) and baseline disease | ||
| Pneumonia | Study population | RR 0.67 | 118 | ⊕⊝⊝⊝ | The physicians need to take into consideration the time of mechanical ventilation | |
| 82 per 1000 | 55 per 1000 | |||||
| Low | ||||||
| 10 per 1000 | 7 per 1000 | |||||
| High | ||||||
| 200 per 1000 | 134 per 1000 | |||||
| Successful spontaneous breathing trial | Study population | RR 1.09 | 940 | ⊕⊕⊕⊝ | The physicians need to take into consideration the time of mechanical ventilation, age of patients, disease severity | |
| 732 per 1000 | 798 per 1000 | |||||
| Low | ||||||
| 500 per 1000 | 545 per 1000 | |||||
| High | ||||||
| 800 per 1000 | 872 per 1000 | |||||
| *The basis for the assumed risk (e.g. the median control group risk across studies) is provided in footnotes. The corresponding risk (and its 95% confidence interval) is based on the assumed risk in the comparison group and the relative effect of the intervention (and its 95% CI). | ||||||
| GRADE Working Group grades of evidence | ||||||
| 1 Two studies with high and moderate risk of bias in at least two items of methodological quality. | ||||||
| Results: characteristics of included studies | ||||||||||||||||||||
| Studies | Patients number | Characteristics of patients | Interventions | Risk of methodological bias | Study design | |||||||||||||||
| Total | PSV | TT | Age | Male | Fem | Score Health | MV days | % COPD | Prosthesis | Weaning Process | PSV min | SBTs time | AG? | AC? | RS? | OB? | DB? | AB? | ||
| Brochard 1994 | 109 | 31 | 35 | 58 | 74 | 35 | SAPs II 12 | 14 | 27% | TOT/TQT | DW/PW | 8 | TT2h/ PS24h | Low | Low | Low | High | High | Low | M RCT |
| Esteban 1995 | 130 | 37 | 31 | 58 | not reported | APACHE 18,6 | 9,3 | 40 | TOT | DW | 5 | 2h | Low | Low | Low | Low | Low | Low | M RCT | |
| Esteban 1997 | 484 | 238 | 246 | 0 | 343 | 141 | SAPs II 36 | 6 (4‐12) | 20 | TOT | SW/DW | 7 | 2h | Low | Low | Low | Low | Low | Low | M RCT |
| Haberthür2002 | 90 | 30 | 30 | 57 | 58 | 32 | APACHE 20 | 6 | 10 | TOT | SW/DW | 5 | 2h | Low | Low | Low | Mod | Low | Low | CO RCT |
| Koh 2000 | 36 | 20 | 22 | 61 | 23 | 13 | APACHE 35 | 12 | 0 | TOT | SW/DW | 7.6 | TT1h/ PS30 | Low | Low | Low | Mod | High | Low | RCT |
| Koksal 2004 | 60 | 20 | 20 | 74 | 28 | 32 | APACHE 18,5 | not rep | not rep | TOT | SW | 10 | 2h | Low | Mod | Low | Low | Low | Low | RCT |
| Matić 2004 | 260 | 150 | 110 | 0 | 170 | 90 | APACHE 19‐28 | 6,75 | 13 | TOT | DW | 8 | 2h | Mod | Low | Low | Low | Mod | Low | RCT |
| Matić 2007 | 136 | 70 | 66 | 0 | 36 | 27 | APACHE 23‐34 | 3.6‐6.3 | 100% | TOT | DW | 5 | 2h | Low | Low | Low | Low | High | Low | RCT |
| Vitacca 2001 | 52 | 26 | 26 | 72.5 | not reported | APACHE 17 | 15‐39 | 100% | TQT | PW | 8 | 8h | Low | Low | Low | Low | High | Low | M RCT | |
| Total | 1357 | 622 | 586 |
| 732 | 370 |
|
|
|
|
|
|
|
|
|
|
|
|
| |
| Signs to poor tolerance to spontaneous breathing trial | |||||
| Studies | Respiratory rate (bpm) | SaO2 | Heart rate (beats/min) | Systolic blood pressure (mm Hg) | Others |
| > 35 | PaO2 < 50 | ≤ 20% basal | > 20% basal | Agitation, diaphoresis, depressed mental status | |
| > 35 | < 90% | > 140 | > 180 | Agitation, anxiety or diaphoresis | |
| > 35 | < 90% | > 140 | > 200 | Agitation, anxiety or diaphoresis | |
| > 35 | < 90% | > 140 | > 180 | Agitation, anxiety or diaphoresis | |
| > 40 | PaO2 < 55 | ≤ 20% basal | > 20% basal | Agitation, diaphoresis, depressed mental status | |
| ≥ 35 | ≤ 90% | ≥ 140 | ≤ 90 or ≥ 180 | Agitation, diaphoresis, depressed mental status | |
| > 35 | < 90% | > 140 | > 200 | Stable clinical condition | |
| > 25 | < 90% | > 140 | > 200 | Restlessness | |
| > 35 | PaO2 < 50 | > 145 | > 180 | Agitation, anxiety or diaphoresis | |
| Outcomes | N | Estimated effect (RR, 95% CI, P) | Favoured group | Study |
| 1. Hospital mortality | 397 | RR 1.03, 0.65 to 1.64, P = 0.89 | T‐tube | |
| 2. Proportion of patients requiring tracheostomy | 484 | RR 0.72, 0.39 to 1.33, P = 0.29 | PS |
| Outcome or subgroup title | No. of studies | No. of participants | Statistical method | Effect size |
| 1 Weaning success Show forest plot | 9 | 935 | Risk Ratio (M‐H, Random, 95% CI) | 1.07 [0.97, 1.17] |
| 1.1 Simple weaning | 3 | 497 | Risk Ratio (M‐H, Random, 95% CI) | 1.05 [0.91, 1.22] |
| 1.2 Difficult weaning | 4 | 278 | Risk Ratio (M‐H, Random, 95% CI) | 1.06 [0.87, 1.29] |
| 1.3 Prolonged weaning | 1 | 52 | Risk Ratio (M‐H, Random, 95% CI) | 0.95 [0.69, 1.30] |
| 1.4 Mixed | 2 | 108 | Risk Ratio (M‐H, Random, 95% CI) | 1.33 [1.01, 1.76] |
| 2 ICU mortality Show forest plot | 5 | 725 | Risk Ratio (M‐H, Random, 95% CI) | 0.81 [0.53, 1.23] |
| 2.1 Simple weaning | 1 | 397 | Risk Ratio (M‐H, Random, 95% CI) | 0.66 [0.32, 1.35] |
| 2.2 Difficult weaning | 3 | 210 | Risk Ratio (M‐H, Random, 95% CI) | 0.97 [0.50, 1.87] |
| 2.3 Prolonged weaning | 1 | 52 | Risk Ratio (M‐H, Random, 95% CI) | 1.5 [0.27, 8.25] |
| 2.4 Mixed | 1 | 66 | Risk Ratio (M‐H, Random, 95% CI) | 0.56 [0.19, 1.69] |
| 3 Reintubation Show forest plot | 7 | 823 | Risk Ratio (M‐H, Random, 95% CI) | 0.92 [0.66, 1.26] |
| 3.1 Simple weaning | 2 | 437 | Risk Ratio (M‐H, Random, 95% CI) | 0.53 [0.07, 3.79] |
| 3.2 Difficult weaning | 4 | 278 | Risk Ratio (M‐H, Random, 95% CI) | 0.85 [0.47, 1.52] |
| 3.3 Mixed | 2 | 108 | Risk Ratio (M‐H, Random, 95% CI) | 0.95 [0.32, 2.86] |
| 4 ICU or LWU length of stay Show forest plot | 2 | 118 | Mean Difference (IV, Random, 95% CI) | ‐7.08 [‐16.26, 2.10] |
| 5 Pneumonia Show forest plot | 2 | 118 | Risk Ratio (M‐H, Random, 95% CI) | 0.67 [0.08, 5.85] |
| 6 Successful spontaneous breathing trial Show forest plot | 4 | 940 | Risk Ratio (M‐H, Random, 95% CI) | 1.09 [1.02, 1.17] |
| 7 Respiratory rate (RR) Show forest plot | 2 | 94 | Mean Difference (IV, Random, 95% CI) | ‐1.95 [‐2.60, ‐1.29] |
| 8 Tidal volume (VT) Show forest plot | 2 | 94 | Mean Difference (IV, Random, 95% CI) | 0.06 [0.04, 0.08] |
| 9 Rapid and shallow breathing index (RSBI) Show forest plot | 2 | 94 | Mean Difference (IV, Random, 95% CI) | ‐13.70 [‐32.79, 5.39] |
| 10 Time of weaning from MV (Duration of weaning) Show forest plot | 4 | Mean Difference (IV, Random, 95% CI) | Totals not selected | |