Psychological therapies for women who experience intimate partner violence
Information
- DOI:
- https://doi.org/10.1002/14651858.CD013017.pub2Copy DOI

- Database:
-
- Cochrane Database of Systematic Reviews
- Version published:
-
- 01 July 2020see what's new
- Type:
-
- Intervention
- Stage:
-
- Review
- Cochrane Editorial Group:
-
Cochrane Common Mental Disorders Group
- Copyright:
-
- Copyright © 2020 The Cochrane Collaboration. Published by John Wiley & Sons, Ltd.
Article metrics
Altmetric:
Cited by:
Authors
Contributions of authors
Drafting of protocol: MT, KH, LOD, GF, GG, JT, AT, and PC.
Search strategy: MT and KH.
Selection of trials: MH, LOD, JTM, GG and KH.
Extraction of data: MH, LOD, GG, JTM, AT.
Data entry into Review Manager 5.3: MH.
Analysis and interpretation of analysis: MH, PC and KH.
Drafting of review: MH, KH, LOD, GF, GG, JTM, AT and PC.
Topic expertise and editing: MH, KH, LOD, GF, GG, JTM, AT, JR, and PC.
Updating of review: MH and KH.
Sources of support
Internal sources
-
The University of Melbourne, Australia
Support for MT
External sources
-
Australian General Practice Training, Australia
Funding support for MT
Declarations of interest
We acknowledge that the following authors were involved in the cited trials. These trials met the inclusion criteria for this review and were included. Authors' knowledge about these trials may represent a greater availability of knowledge about those specific trials. We ensured that no‐one involved in a particular trial extracted data from their own trial or assessed that trial for risk of bias.
MH: no conflicts of interest.
LOD: co‐investigator of WEAVE trial (Hegarty 2013).
GG: co‐investigator of an adapted version of the Women’s Wellness Treatment trial (Tirado‐Muñoz 2015).
JTM: lead investigator of an adapted version of the Women’s Wellness Treatment trial (Tirado‐Muñoz 2015).
AT: co‐investigator of WEAVE (Hegarty 2013) and I‐DECIDE trial (Hegarty 2019).
PC: co‐investigator of WEAVE trial (Hegarty 2013).
GF: principal investigator of PATH trial (Ferrari 2018), co‐investigator WEAVE trial (Hegarty 2013), chair of the WHO Intimate Partner Violence and Sexual Assault Guidelines Development Group and chair of the UK NICE Domestic Violence Programme Development Group.
MT: no conflicts of interest.
KH: lead investigator of WEAVE (Hegarty 2013) and I‐DECIDE trial (Hegarty 2019).
Acknowledgements
The review authors thank the Cochrane Common Mental Disorders' (CCMD) editorial team for providing guidance during the completion of the review. We developed search strategies in collaboration with CCMD's Information Specialist. We would also like to thank Jim Harley for administrative support.
The review authors and the CCMD Editorial Team are grateful to the following peer reviewers for their time and comments: Alyson Huntley, Nuala Livingstone, and Katherine Thomas. They would also like to thank Cochrane Copy Edit Support for the team's help.
CRG funding acknowledgement: the National Institute for Health Research (NIHR) is the largest single funder of the CCMD Group.
Disclaimer: the views and opinions expressed herein are those of the review authors and do not necessarily reflect those of the NIHR, the National Health Service or the Department of Health and Social Care.
Version history
| Published | Title | Stage | Authors | Version |
| 2020 Jul 01 | Psychological therapies for women who experience intimate partner violence | Review | Mohajer Hameed, Lorna O'Doherty, Gail Gilchrist, Judit Tirado-Muñoz, Angela Taft, Patty Chondros, Gene Feder, Melissa Tan, Kelsey Hegarty | |
| 2018 May 15 | Psychological therapies for women who experience intimate partner violence | Protocol | Melissa Tan, Lorna O'Doherty, Gail Gilchrist, Angela Taft, Gene Feder, Judit Tirado Muñoz, Patty Chondros, Laura Sadowski, Kelsey Hegarty | |
Differences between protocol and review
In our protocol (Tan 2018), we stated that the timing of outcome assessment would include short‐term time frames classified as zero to six months, medium‐term greater than six months to 12 months, and long‐term as periods greater than 12 months. As this did not distinguish which follow‐up time point six months would fall into, we classified the timing of outcome assessments as short‐term (up to 6 months), medium‐term (six to under 12 months) and long‐term (12 or more months).
A further difference relates to intensity of interventions. In the protocol we classified this as two to five sessions and five or more sessions. As it is unclear where five sessions should be included, in this review we changed intensity of interventions to include up to four sessions and five or more sessions.
For 'Summary of findings' table, our protocol did not specify whether we would present dichotomous or continuous outcomes. In this review, we decided to present continuous outcomes.
Keywords
MeSH
Medical Subject Headings (MeSH) Keywords
Medical Subject Headings Check Words
Adolescent; Adult; Aged; Aged, 80 and over; Female; Humans; Middle Aged; Young Adult;
PICOs

Risk of Bias graph: review authors' judgements about each risk of bias item presented as percentages across all included trials.


Funnel plot of comparison: 1 Intervention vs Control, outcome: 1.1 Depression (continuous).

Comparison 1: Intervention vs Control, Outcome 1: Depression (continuous)

Comparison 1: Intervention vs Control, Outcome 2: Depression (categorical)

Comparison 1: Intervention vs Control, Outcome 3: Depression (recruitment setting of participants)

Comparison 1: Intervention vs Control, Outcome 4: Depression (type of intervention)

Comparison 1: Intervention vs Control, Outcome 5: Depression (intensity of intervention)

Comparison 1: Intervention vs Control, Outcome 6: Depression (person delivering the intervention)

Comparison 1: Intervention vs Control, Outcome 7: Self‐efficacy

Comparison 1: Intervention vs Control, Outcome 8: Dropouts from treatment

Comparison 1: Intervention vs Control, Outcome 9: Mental health

Comparison 1: Intervention vs Control, Outcome 10: Anxiety (continuous)

Comparison 1: Intervention vs Control, Outcome 11: Anxiety (categorical)

Comparison 1: Intervention vs Control, Outcome 12: Post‐traumatic stress disorder (continuous)

Comparison 1: Intervention vs Control, Outcome 13: Quality of life

Comparison 1: Intervention vs Control, Outcome 14: Re‐exposure to IPV (continuous)

Comparison 1: Intervention vs Control, Outcome 15: Re‐exposure to IPV (categorical)

Comparison 1: Intervention vs Control, Outcome 16: Safety planning and/or safety behaviour (continuous)

Comparison 1: Intervention vs Control, Outcome 17: Safety planning and/or safety behaviour (categorical)

Comparison 1: Intervention vs Control, Outcome 18: Use of healthcare and IPV services

Comparison 1: Intervention vs Control, Outcome 19: Social support (continuous)

Comparison 1: Intervention vs Control, Outcome 20: Social support (categorical)
| Psychological therapies compared to comparator intervention (e.g. usual care, no treatment or minimal treatment) for women who experience intimate partner violence | ||||||
| Patient or population: women aged 16 years and older who self‐report previous or current experience of intimate partner violence | ||||||
| Outcomes | Anticipated absolute effects* (95% CI) | Relative effect | № of participants | Certainty of the evidence | Comments | |
|---|---|---|---|---|---|---|
| Risk with comparator intervention (e.g. usual care, no treatment or minimal treatment) | Risk with psychological therapies | |||||
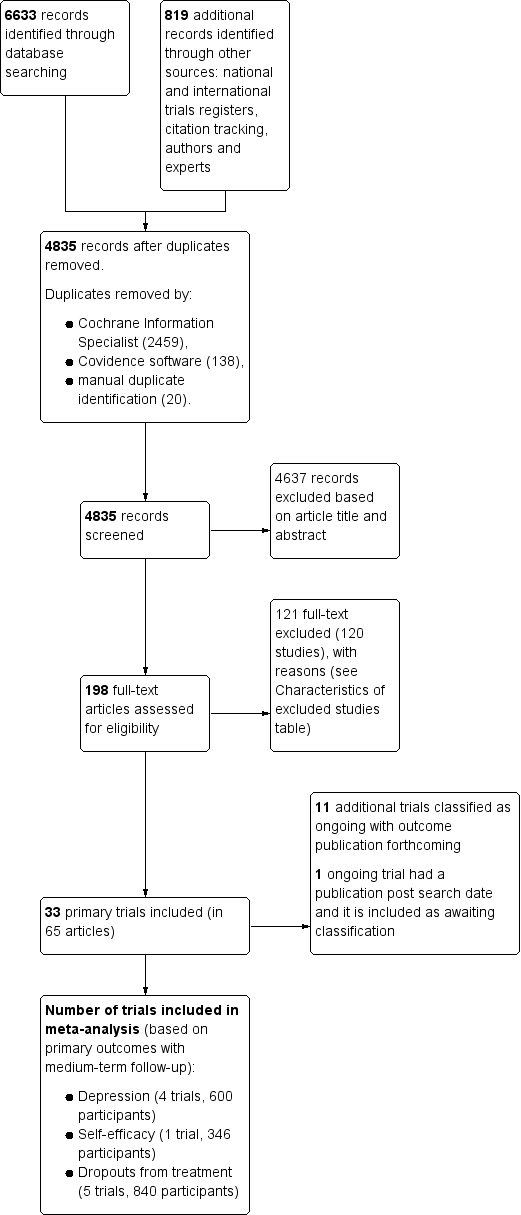
| Depression score Scales: Beck Depression Inventory, Center for Epidemiologic Studies Short Depression Scale, Patient Health Questionnaire Direction: lower better Follow‐up: medium‐term (6 to under 12 months) | The mean depression score ranged from 11.1 to 24.2 | SMD 0.24 lower | ‐ | 600 | ⊕⊕⊕⊝ | This corresponds to a small effect according to conventions proposed by Cohen 1992 |
| Self‐efficacy score Scale: Generalized Self‐Efficacy Scale Direction: higher better Follow‐up: medium‐term (6 to under 12 months) | The mean self‐efficacy score was 28.1 | SMD 0.12 lower | ‐ | 346 | ⊕⊕⊝⊝ | This effect approaches zero |
| Dropouts from treatment Follow‐up: medium‐term (6 to under 12 months) | Trial population | OR 1.04 | 840 | ⊕⊕⊝⊝ | This effect approaches zero | |
| 263 per 1000 | 271 per 1000 | |||||
| Anxiety score Scales: Beck Anxiety Inventory, State‐Trait Anxiety Inventory and Depression, Anxiety, and Stress Scale Direction: lower better Follow‐up: short‐term (under 6 months) | The mean anxiety score ranged from 8 to 53.1 | SMD 0.96 lower | ‐ | 158 | ⊕⊕⊝⊝ | This corresponds to large effect according to conventions proposed by Cohen 1992 |
| Post‐traumatic stress disorder Score Scale: Clinician Administered PTSD Scale, Posttraumatic Stress Symptoms— Interview, Posttraumatic Stress Disorder Checklist Direction: lower better Follow‐up: medium‐term (6 to under 12 months) | The mean post‐traumatic stress disorder score ranged from 19.5 to 36.5 | SMD 0.24 lower | ‐ | 484 | ⊕⊕⊝⊝ | This corresponds to a small effect according to conventions proposed by Cohen 1992. However the 95% confidence interval indicate we are uncertain whether psychological therapies reduce post‐traumatic stress disorder |
| Re‐exposure to IPV score Scales: Revised Conflict Tactics Scales, Composite Abuse Scale Direction: lower better Follow‐up: medium‐term (6 to under 12 months) | The mean re‐exposure to IPV score was 6.1 and 8.7 | SMD 0.03 higher | ‐ | 547 | ⊕⊕⊝⊝ | This effect approaches zero |
| Safety planning and/or safety behaviour score Service use and activities questionnaire Direction: higher better Follow‐up: medium‐term (6 to under 12 months) | The mean safety planning and/or safety behaviour score was 4.2 | SMD 0.04 higher | ‐ | 337 | ⊕⊕⊝⊝ | This effect approaches zero |
| *The risk in the intervention group (and its 95% confidence interval) is based on the assumed risk in the comparison group and the relative effect of the intervention (and its 95% CI). | ||||||
| GRADE Working Group grades of evidence | ||||||
| aDowngraded one level due to unclear risk of bias in allocation concealment (risk of bias). | ||||||
| Outcome or subgroup title | No. of studies | No. of participants | Statistical method | Effect size |
| 1.1 Depression (continuous) Show forest plot | 17 | Std. Mean Difference (IV, Random, 95% CI) | Subtotals only | |
| 1.1.1 Short‐term FU (under 6 months) | 15 | 1247 | Std. Mean Difference (IV, Random, 95% CI) | ‐0.45 [‐0.67, ‐0.22] |
| 1.1.2 Medium‐term FU (6 to under 12 months) | 4 | 600 | Std. Mean Difference (IV, Random, 95% CI) | ‐0.24 [‐0.47, ‐0.01] |
| 1.1.3 Long‐term FU (12 months and above) | 3 | 503 | Std. Mean Difference (IV, Random, 95% CI) | ‐0.08 [‐0.30, 0.14] |
| 1.2 Depression (categorical) Show forest plot | 2 | Odds Ratio (IV, Fixed, 95% CI) | Subtotals only | |
| 1.2.1 Medium‐term FU (6 to under 12 months) | 2 | 528 | Odds Ratio (IV, Fixed, 95% CI) | 0.68 [0.47, 0.98] |
| 1.2.2 Long‐term FU (12 months and above) | 1 | 195 | Odds Ratio (IV, Fixed, 95% CI) | 0.50 [0.29, 0.89] |
| 1.3 Depression (recruitment setting of participants) Show forest plot | 17 | 1729 | Std. Mean Difference (IV, Random, 95% CI) | ‐0.36 [‐0.55, ‐0.17] |
| 1.3.1 Healthcare | 6 | 519 | Std. Mean Difference (IV, Random, 95% CI) | ‐0.18 [‐0.38, 0.01] |
| 1.3.2 Community | 5 | 469 | Std. Mean Difference (IV, Random, 95% CI) | ‐0.24 [‐0.62, 0.15] |
| 1.3.3 Shelter / refuge | 1 | 52 | Std. Mean Difference (IV, Random, 95% CI) | ‐0.55 [‐1.13, 0.02] |
| 1.3.4 Various | 5 | 689 | Std. Mean Difference (IV, Random, 95% CI) | ‐0.55 [‐0.96, ‐0.13] |
| 1.4 Depression (type of intervention) Show forest plot | 16 | 1604 | Std. Mean Difference (IV, Random, 95% CI) | ‐0.24 [‐0.37, ‐0.11] |
| 1.4.1 Cognitive behavioral therapy | 4 | 262 | Std. Mean Difference (IV, Random, 95% CI) | ‐0.31 [‐0.55, ‐0.06] |
| 1.4.2 Humanistic therapies | 4 | 161 | Std. Mean Difference (IV, Random, 95% CI) | ‐0.47 [‐0.91, ‐0.03] |
| 1.4.3 Integrative therapies | 6 | 892 | Std. Mean Difference (IV, Random, 95% CI) | ‐0.09 [‐0.23, 0.04] |
| 1.4.4 Other psychologically‐oriented interventions | 2 | 289 | Std. Mean Difference (IV, Random, 95% CI) | ‐0.41 [‐0.99, 0.16] |
| 1.5 Depression (intensity of intervention) Show forest plot | 17 | 1729 | Std. Mean Difference (IV, Random, 95% CI) | ‐0.36 [‐0.55, ‐0.17] |
| 1.5.1 Up to four sessions | 5 | 644 | Std. Mean Difference (IV, Random, 95% CI) | ‐0.03 [‐0.18, 0.13] |
| 1.5.2 Five or more sessions | 12 | 1085 | Std. Mean Difference (IV, Random, 95% CI) | ‐0.49 [‐0.73, ‐0.25] |
| 1.6 Depression (person delivering the intervention) Show forest plot | 15 | 1342 | Std. Mean Difference (IV, Random, 95% CI) | ‐0.36 [‐0.57, ‐0.16] |
| 1.6.1 healthcare workers | 10 | 649 | Std. Mean Difference (IV, Random, 95% CI) | ‐0.42 [‐0.73, ‐0.11] |
| 1.6.2 non‐healthcare workers | 5 | 693 | Std. Mean Difference (IV, Random, 95% CI) | ‐0.21 [‐0.39, ‐0.03] |
| 1.7 Self‐efficacy Show forest plot | 4 | Std. Mean Difference (IV, Random, 95% CI) | Subtotals only | |
| 1.7.1 Short‐term FU (under 6 months) | 3 | 279 | Std. Mean Difference (IV, Random, 95% CI) | 0.20 [‐0.22, 0.63] |
| 1.7.2 Medium‐term FU (6 to under 12 months) | 1 | 346 | Std. Mean Difference (IV, Random, 95% CI) | ‐0.12 [‐0.33, 0.09] |
| 1.7.3 Long‐term FU (12 months and above) | 1 | 331 | Std. Mean Difference (IV, Random, 95% CI) | ‐0.23 [‐0.45, ‐0.01] |
| 1.8 Dropouts from treatment Show forest plot | 33 | Odds Ratio (IV, Random, 95% CI) | Subtotals only | |
| 1.8.1 Short‐term FU (up to 6 months) | 22 | 3022 | Odds Ratio (IV, Random, 95% CI) | 1.21 [0.98, 1.48] |
| 1.8.2 Medium‐term FU (6 to 12 months) | 5 | 840 | Odds Ratio (IV, Random, 95% CI) | 1.04 [0.75, 1.44] |
| 1.8.3 Long‐term FU (greater than 12 months) | 6 | 1655 | Odds Ratio (IV, Random, 95% CI) | 1.08 [0.85, 1.38] |
| 1.9 Mental health Show forest plot | 4 | Std. Mean Difference (IV, Random, 95% CI) | Subtotals only | |
| 1.9.1 Short‐term FU (under 6 months) | 2 | 353 | Std. Mean Difference (IV, Random, 95% CI) | ‐0.34 [‐0.55, ‐0.13] |
| 1.9.2 Medium‐term FU (6 to under 12 months) | 2 | 219 | Std. Mean Difference (IV, Random, 95% CI) | ‐0.11 [‐0.38, 0.16] |
| 1.9.3 Long‐term FU (12 months and above) | 2 | 355 | Std. Mean Difference (IV, Random, 95% CI) | ‐0.27 [‐0.48, ‐0.06] |
| 1.10 Anxiety (continuous) Show forest plot | 5 | Std. Mean Difference (IV, Random, 95% CI) | Subtotals only | |
| 1.10.1 Short‐term FU (under 6 months) | 4 | 158 | Std. Mean Difference (IV, Random, 95% CI) | ‐0.96 [‐1.29, ‐0.63] |
| 1.10.2 Long‐term FU (12 months and above) | 1 | 166 | Std. Mean Difference (IV, Random, 95% CI) | ‐0.20 [‐0.51, 0.10] |
| 1.11 Anxiety (categorical) Show forest plot | 1 | Odds Ratio (IV, Random, 95% CI) | Subtotals only | |
| 1.11.1 Medium‐term FU (6 to under 12 months) | 1 | 192 | Odds Ratio (IV, Random, 95% CI) | 0.82 [0.45, 1.49] |
| 1.11.2 Long‐term FU (12 months and above) | 1 | 195 | Odds Ratio (IV, Random, 95% CI) | 0.87 [0.48, 1.57] |
| 1.12 Post‐traumatic stress disorder (continuous) Show forest plot | 10 | Std. Mean Difference (IV, Random, 95% CI) | Subtotals only | |
| 1.12.1 Short‐term FU (under 6 months) | 9 | 1150 | Std. Mean Difference (IV, Random, 95% CI) | ‐0.48 [‐0.80, ‐0.16] |
| 1.12.2 Medium‐term FU (6 to under 12 months) | 4 | 484 | Std. Mean Difference (IV, Random, 95% CI) | ‐0.24 [‐0.54, 0.06] |
| 1.12.3 Long‐term FU (12 months and above) | 1 | 170 | Std. Mean Difference (IV, Random, 95% CI) | ‐0.27 [‐0.57, 0.04] |
| 1.13 Quality of life Show forest plot | 4 | Std. Mean Difference (IV, Random, 95% CI) | Subtotals only | |
| 1.13.1 Short‐term FU (under 6 months) | 2 | 382 | Std. Mean Difference (IV, Random, 95% CI) | 0.16 [‐0.04, 0.36] |
| 1.13.2 Medium‐term FU (6 to under 12 months) | 2 | 557 | Std. Mean Difference (IV, Random, 95% CI) | 0.10 [‐0.07, 0.27] |
| 1.13.3 Long‐term FU (12 months and above) | 4 | 699 | Std. Mean Difference (IV, Random, 95% CI) | 0.11 [‐0.04, 0.25] |
| 1.14 Re‐exposure to IPV (continuous) Show forest plot | 9 | Std. Mean Difference (IV, Random, 95% CI) | Subtotals only | |
| 1.14.1 Short‐term FU (under 6 months) | 7 | 749 | Std. Mean Difference (IV, Random, 95% CI) | ‐0.00 [‐0.29, 0.29] |
| 1.14.2 Medium‐term FU (6 to under 12 months) | 2 | 547 | Std. Mean Difference (IV, Random, 95% CI) | 0.03 [‐0.14, 0.20] |
| 1.14.3 Long‐term FU (12 months and above) | 4 | 837 | Std. Mean Difference (IV, Random, 95% CI) | ‐0.07 [‐0.20, 0.07] |
| 1.15 Re‐exposure to IPV (categorical) Show forest plot | 7 | Odds Ratio (IV, Random, 95% CI) | Subtotals only | |
| 1.15.1 Short‐term FU (under 6 months) | 5 | 797 | Odds Ratio (IV, Random, 95% CI) | 0.45 [0.21, 0.96] |
| 1.15.2 Medium‐term FU (6 to under 12 months) | 1 | 186 | Odds Ratio (IV, Random, 95% CI) | 1.29 [0.55, 3.01] |
| 1.15.3 Long‐term FU (12 months and above) | 2 | 381 | Odds Ratio (IV, Random, 95% CI) | 0.77 [0.28, 2.11] |
| 1.16 Safety planning and/or safety behaviour (continuous) Show forest plot | 1 | Std. Mean Difference (IV, Random, 95% CI) | Subtotals only | |
| 1.16.1 Medium‐term FU (6 to under 12 months) | 1 | 337 | Std. Mean Difference (IV, Random, 95% CI) | 0.04 [‐0.18, 0.25] |
| 1.16.2 Long‐term FU (12 months and above) | 1 | 318 | Std. Mean Difference (IV, Random, 95% CI) | 0.00 [‐0.22, 0.22] |
| 1.17 Safety planning and/or safety behaviour (categorical) Show forest plot | 2 | Odds Ratio (IV, Random, 95% CI) | Subtotals only | |
| 1.17.1 Short‐term FU (under 6 months) | 1 | 138 | Odds Ratio (IV, Random, 95% CI) | 1.38 [0.66, 2.89] |
| 1.17.2 Medium‐term FU (6 to under 12 months) | 1 | 191 | Odds Ratio (IV, Random, 95% CI) | 1.25 [0.68, 2.27] |
| 1.17.3 Long‐term FU (12 months and above) | 1 | 192 | Odds Ratio (IV, Random, 95% CI) | 2.14 [1.18, 3.91] |
| 1.18 Use of healthcare and IPV services Show forest plot | 2 | Odds Ratio (IV, Random, 95% CI) | Subtotals only | |
| 1.18.1 Short‐term FU (under 6 months) | 1 | 371 | Odds Ratio (IV, Random, 95% CI) | 1.60 [0.68, 3.76] |
| 1.18.2 Medium‐term FU (6 to under 12 months) | 1 | 364 | Odds Ratio (IV, Random, 95% CI) | 1.21 [0.44, 3.33] |
| 1.18.3 Long‐term FU (12 months and above) | 2 | 526 | Odds Ratio (IV, Random, 95% CI) | 0.79 [0.21, 2.97] |
| 1.19 Social support (continuous) Show forest plot | 2 | Std. Mean Difference (IV, Random, 95% CI) | Subtotals only | |
| 1.19.1 Short‐term FU (under 6 months) | 2 | 245 | Std. Mean Difference (IV, Random, 95% CI) | 0.31 [‐0.38, 1.00] |
| 1.19.2 Medium‐term FU (6 to under 12 months) | 2 | 235 | Std. Mean Difference (IV, Random, 95% CI) | 0.05 [‐0.21, 0.31] |
| 1.20 Social support (categorical) Show forest plot | 1 | Odds Ratio (IV, Random, 95% CI) | Totals not selected | |
| 1.20.1 Short‐term FU (under 6 months) | 1 | Odds Ratio (IV, Random, 95% CI) | Totals not selected | |
| 1.20.2 Medium‐term FU (6 to under 12 months) | 1 | Odds Ratio (IV, Random, 95% CI) | Totals not selected | |
| 1.20.3 Long‐term FU (12 months and above) | 1 | Odds Ratio (IV, Random, 95% CI) | Totals not selected | |