| Exercise‐based cardiac rehabilitation (CR) compared to usual care for patients with stable angina |
| Patient or population: adults with stable angina
Setting: hospital, outpatient clinic, community or home‐based environment
Intervention: exercise‐based cardiac rehabilitation
Comparison: usual care (standard medical care but without any structured training or advice on structured exercise training) |
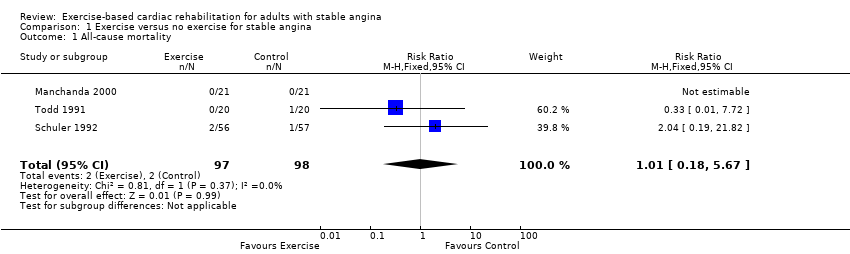
| All‐cause mortality Follow‐up: 12 months | Study population | RR 1.01
(0.18 to 5.67) | 195
(3 RCTs) | ⊕⊝⊝⊝
VERY LOW 1,2,3 | We are uncertain about the effect of exercise‐based CR on all‐cause mortality compared to usual care. |
| 20 per 1,000 | 21 per 1,000
(4 to 116) |
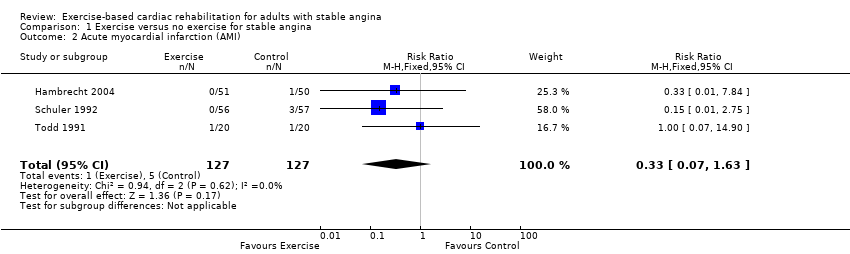
| Acute myocardial infarction (AMI) Follow‐up: 12 months | Study population | RR 0.33
(0.07 to 1.63) | 254
(3 RCTs) | ⊕⊝⊝⊝
VERY LOW 2,3,5 | We are uncertain about the effect of exercise‐based CR on AMI compared to usual care. |
| 39 per 1,000 | 13 per 1,000
(3 to 64) |
| Exercise capacity (assessed using a variety of outcomes including VO2 max and duration of exercise) Follow‐up: range 6 to 12 months | The mean exercise capacity in the intervention groups was 0.45 standard deviations higher
(0.2 higher to 0.7 higher) | 267
(5 RCTs) | ⊕⊕⊝⊝
LOW 4,6 | Using Cohen's rule of thumb a SMD of 0.2 represents a small effect, 0.5 a moderate effect and 0.8 a large effect between groups (Cohen 1988). Exercise‐based CR may slightly improve exercise capacity compared to usual care. |
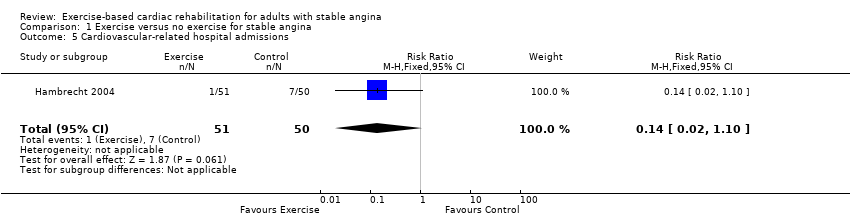
| Cardiovascular‐related hospital admissions
(assessed with: combined clinical endpoint (cardiac death, stroke, CABG, PCI, AMI, worsening angina with objective evidence resulting in hospitalisation)) Follow‐up: 12 months | Study population | RR 0.14 (0.02 to 1.1) | 101
(1 RCT) | ⊕⊝⊝⊝
VERY LOW 2,7,9 | We are uncertain about the effect of exercise‐based CR on cardiovascular‐related hospital admissions compared to usual care. |
| 140 per 1000 | 20 per 1000 (2 to 154) |
| Health‐related quality of life (assessed with: Seattle Angina Questionnaire and The MacNew Questionnaire)
Follow‐up: range 6 weeks to 6 months | One study showed improvement in emotional score at 6‐week follow up, and benefits in angina frequency and social HRQL score at 6 months follow‐up. | Not estimable | 94 (1 RCT) | ⊕⊝⊝⊝
VERY LOW 8,9 | We are uncertain about the effect of exercise‐based CR on quality of life compared to usual care. |
| Return to work | No studies were found that looked at return to work. |
| Adverse events (e.g. skeletomuscular injury) Follow‐up: 12 months | Only one study looked at adverse events and reported that there were no adverse events during the exercise‐based CR. | Not estimable | 101 (1 RCT) | ⊕⊝⊝⊝
VERY LOW 2,7,9 | We are uncertain about the effect of exercise‐based CR on adverse events compared to usual care. |
| *The risk in the intervention group (and its 95% confidence interval) is based on the assumed risk in the comparison group and the relative effect of the intervention (and its 95% CI).
AMI: acute myocardial infarction; CABG: coronary artery bypass graft; CI: confidence interval; CR: cardiac rehabilitation; HRQL: health‐related quality of life; PCI: percutaneous coronary intervention;RCT: randomised controlled trial; RR: risk ratio |
| GRADE Working Group grades of evidence
High quality: We are very confident that the true effect lies close to that of the estimate of the effect
Moderate quality: We are moderately confident in the effect estimate: The true effect is likely to be close to the estimate of the effect, but there is a possibility that it is substantially different
Low quality: Our confidence in the effect estimate is limited: The true effect may be substantially different from the estimate of the effect
Very low quality: We have very little confidence in the effect estimate: The true effect is likely to be substantially different from the estimate of effect |